Thursday, 18 June 2026

The Bumpy Road To Peace With Iran

This is another rare post without charts from me, but I want to write some important posts about the prospects for US equities and oil prices over the summer and need to write a post first about the Iran peace process to refer back to as I write those.

Just to be clear, I am not talking in the title about the bumpy road behind us in the road to peace with Iran, I am talking about the bumpy road ahead as the peace process hopefully evolves from the Memorandum of Understanding (MOU) signed yesterday to a more permanent peace.

This Substack is reader-supported. To receive new posts and support my work, consider becoming a free or paid subscriber.

If you want to read about my thoughts earlier on in this peace process I wrote sections about this at the start of the following posts in March and April which weren’t that well received at the time, as I was suggesting the war was not going well for the US, but have aged well:

In my post on 8th April I listed Iran’s ten point proposal for ending the war as follows. This was in essence the same plan they presented a few days into the war as a precondition for talks:

  1. A guarantee that Iran will not be attacked again.

  2. A permanent end to the war, not just a ceasefire.

  3. An end to Israeli strikes in Lebanon and against Iranian allies.

  4. Lifting of all US sanctions in Iran.

  5. Reopening of the Strait of Hormuz with a transit fee of $2 million per ship.

  6. Continuation of Iran’s control over the Strait of Hormuz.

  7. Acceptance of Iran’s right to enrich uranium for its nuclear program.

  8. Compensation for war damages to Iran.

  9. Withdrawal of US combat forces from the region.

  10. End to all UN and IAEA resolutions targeting Iran.

This was the agreement signed yesterday which, with minor tweaks was in essence that same initial proposal from Iran, fleshed out in more detail:

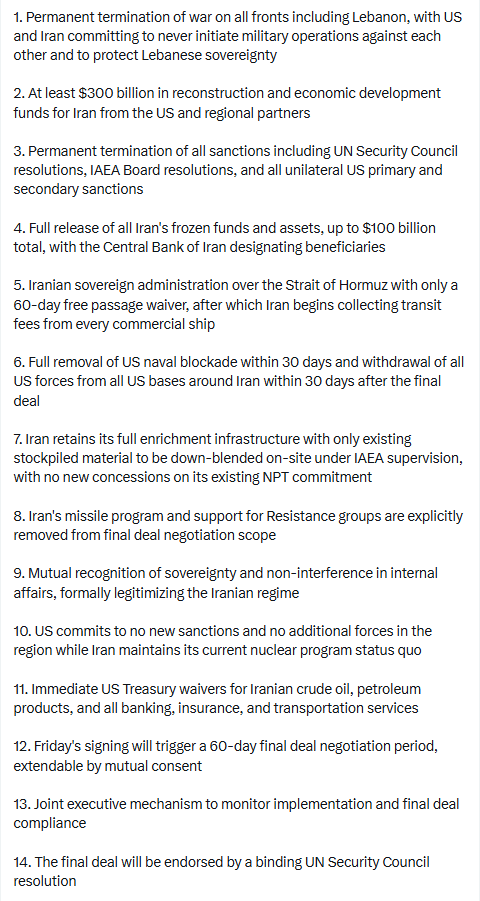
In essence therefore the US has ultimately accepted all Iran’s demands to end this war after a long period of trying to sweeten this bitter pill with negotiation and threats.

In terms of the war the US showed up with aircraft carriers and fighter jets to a war fought with cheap drones and supply chains. Iran blocked the Strait of Hormuz and were prepared to do whatever it took to hold it until the shortage of oil inflicted major damage on the world economy. The US has the most impressive military and naval forces on the planet but the only way to open the Strait by force would have involved a ground invasion that would likely have resulted in large numbers of US casualties. That wasn’t a realistic option & so there was no viable way forward for the US in this war.

Trump has returned from Versailles to a firestorm of disapproval from Republican lawmakers, but I think Trump took the least bad option here to avoid a far worse outcome. That can’t have been easy but the key was what he said at Versailles yesterday which was that the deal needed to be done to avoid a potential economic meltdown from a shortage of available oil. In my view he was right, and to make this agreement took courage. I am surprised that he did this now but I had clearly underestimated him.

Starting this train wreck of a war was the mistake made here, and there was no way to undo that mistake. Trump was very poorly advised before this war started, mainly by Netanyahu and Hegseth, and Netanyahu has now likely lost much of his influence with Trump as a result. I suspect that both Netanyahu and Hegseth may be exploring alternative employment opportunities in the easily foreseeable future. JD Vance appears to have been a lonely voice in the Administration opposing the war before it started, but it appears he may be the scapegoat for making this agreement regardless.

So what now?

Now this MOU has some serious obstacles to negotiate on the path to a more permanent peace and, as I mentioned, getting past those obstacles may be a bumpy ride.

The first big obstacle is the US Congress, and the Iran Nuclear Agreement Review Act of 2015. Now it might be argued that this law only applied to Obama’s JCPOA, which the US withdrew from in 2016, but if it still applies, and I am reading that it does still apply, then Congress will need to review any agreement for up 30 or 60 days before deciding whether any sanctions on Iran can be removed.

Judging by the furore among legislators since the MOU text was agreed, that congressional approval might be hard to secure.

Regardless of whether this law applies it is hard to see how a more permanent agreement can be made without congressional approval.

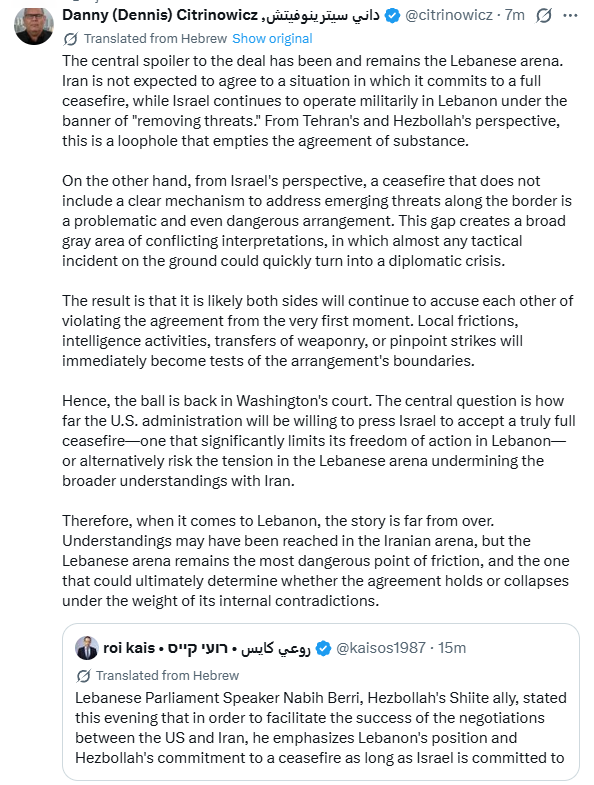
The second big obstacle is Israel which has made no secret that it is unhappy with this agreement and has also made clear that it will not be withdrawing from Lebanon. It has been violating the ceasefire that explicitly includes both Israel and Lebanon, even though the MOU was only signed last night. Without Israel behaving, Iran has been very clear that it will consider any agreement void, and will re-impose the blockade on the Strait of Hormuz:

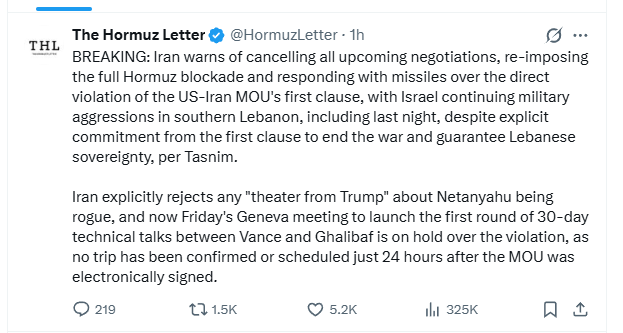
Are the Iranians prepared to exclude Israel from the peace deal? Likely not as with good reason they view Israel as heavily dependent on the US and therefore within their control. Does the US possess either the ability or the will to force Israel to comply with the peace process? Maybe, we’ll see.

There are numerous other smaller but significant issues which include:

There is a backlash among US legislators who seem to have picked up the impression from somewhere that the US had won this war, and are outraged about a peace deal that leaves the US in a demonstrably much weaker position in the Middle East than it was in before the war started.

The US seems to have agreed to the Iranian demand that it withdraw from all US bases in the Persian Gulf states, which reduces US influence in the region and leaves Israel looking increasingly isolated. If the US becomes just another big power in the Middle East that potentially threatens longer term the dominance of the US Dollar as the world’s reserve currency, and potentially also the continued existence of Israel unless Israel is prepared to make peace with their neighbours.

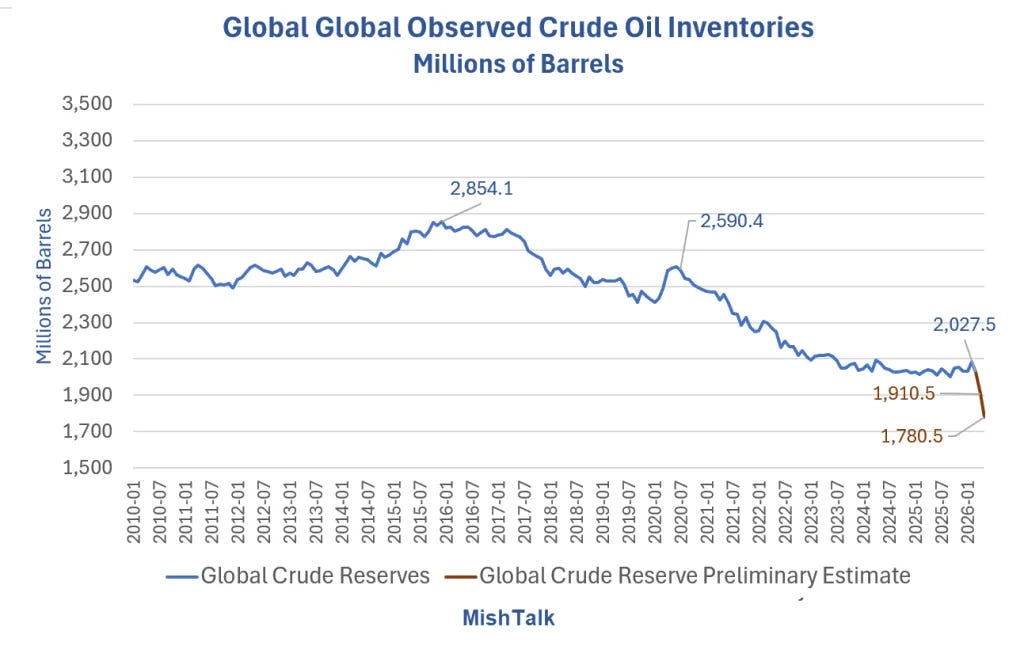
There is also the fact that world oil stocks are low after several months of the Strait of Hormuz being closed, and that even with the Strait reopened it will take up to ten weeks for those tankers passing through the Strait to reach their destinations. Even if the Strait stays open there may be a serious shortage of oil across the world in coming weeks, and I’ve seen estimates that it may take a year or two for the oil supply & demand equilibrium to be re-established and settle down again.

Overall the road to a more permanent agreement will be bumpy, may take several months to agree, and may face very serious opposition from US legislators and Israel.

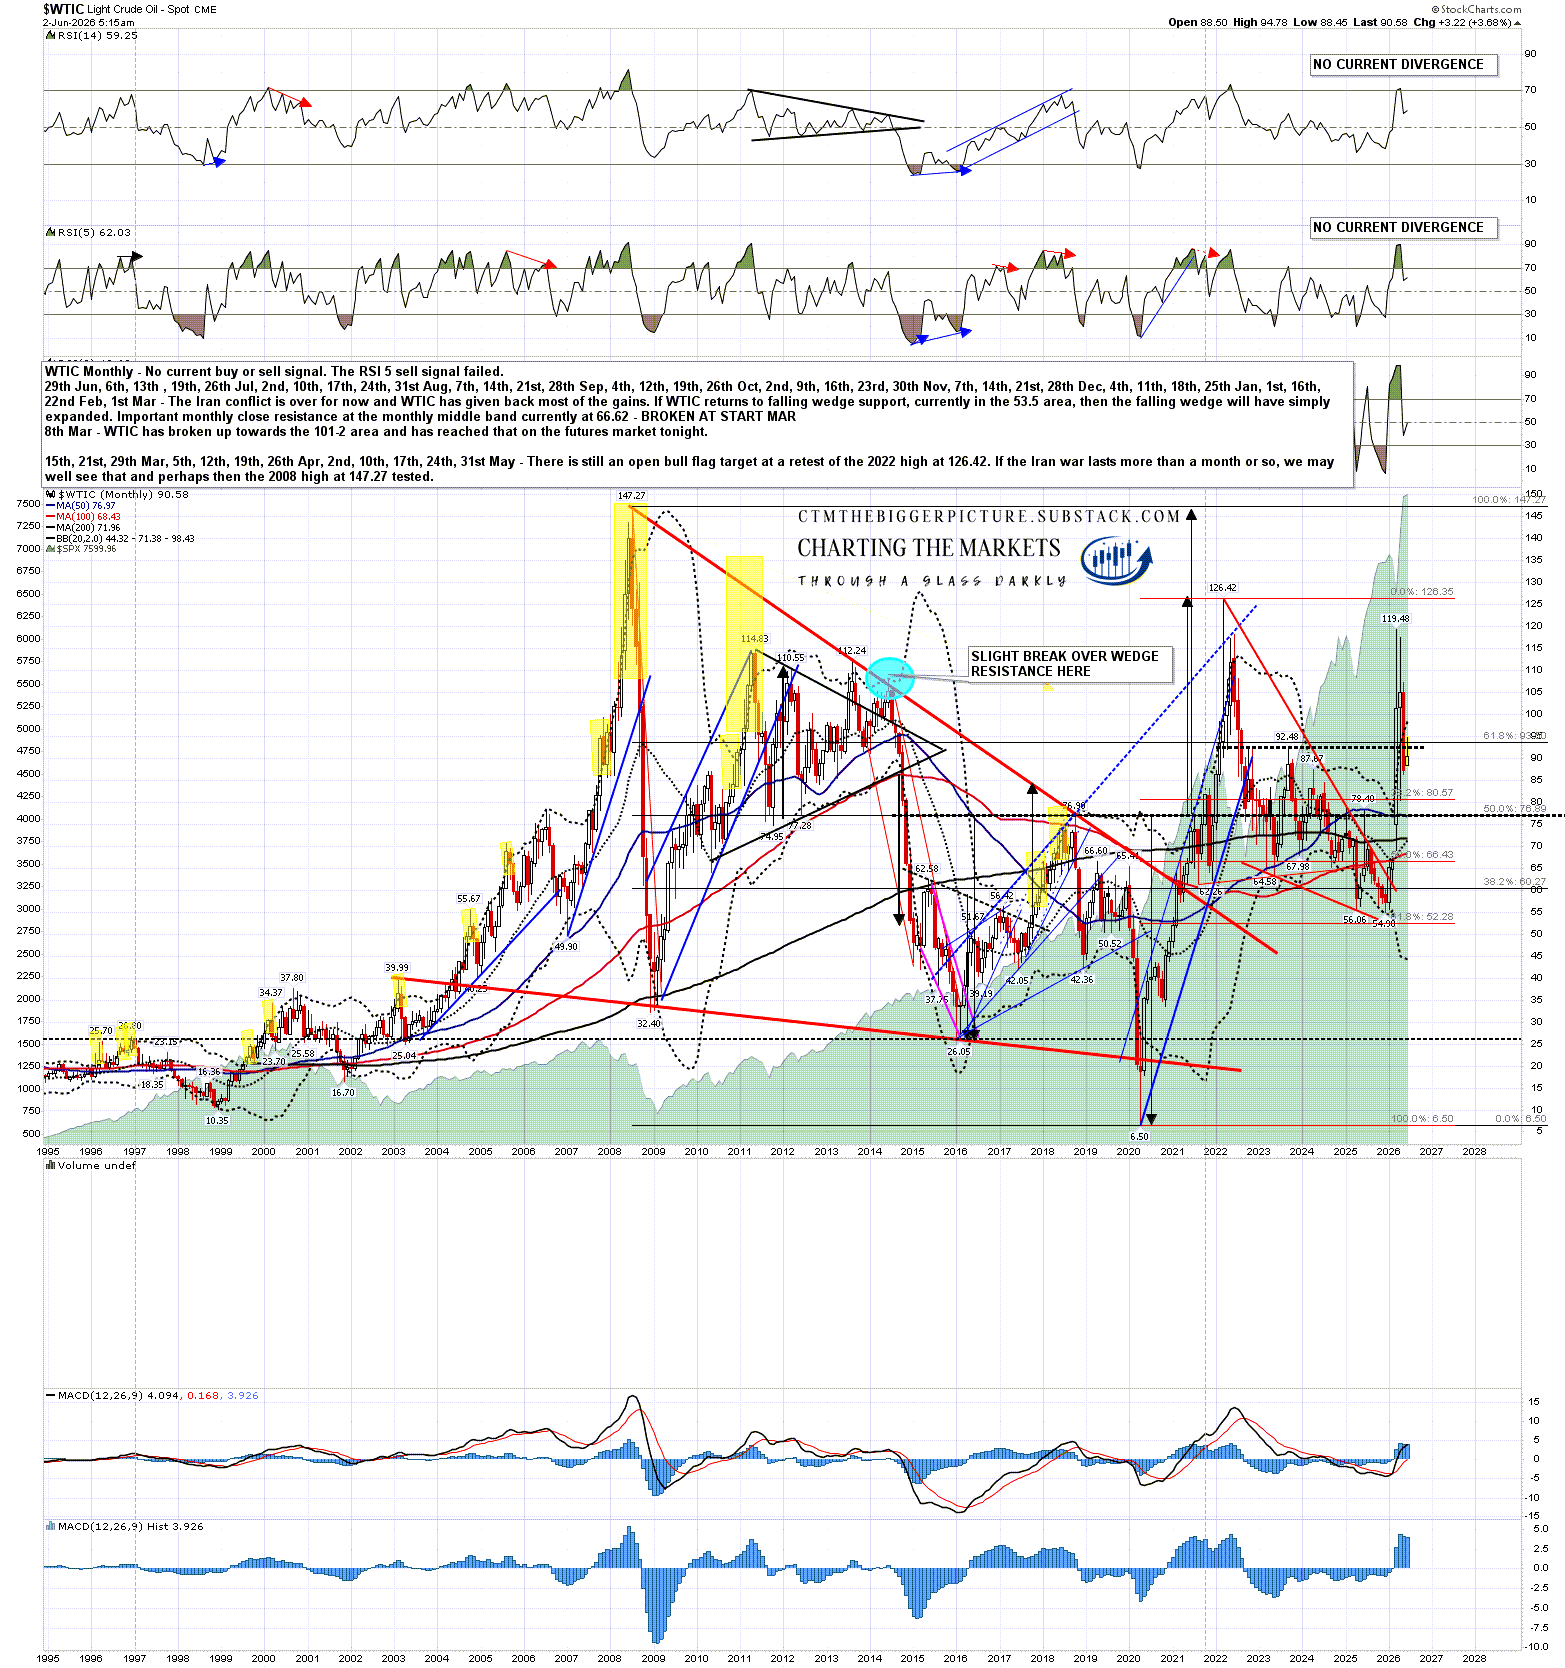
In terms of oil supplies the Strait of Hormuz may be closed again at various points during the negotiations and, even if that doesn’t happen, low oil stocks in the world may still deliver some wild price spikes on oil before oil supply and demand reach a new equilibrium. 

If you like my analysis and would like to see more, please take a free subscription at my thebiggerpicture substack, where I publish these posts first and for members also bi-weekly videos looking at equity indices, bonds, currencies and commodities. Those videos are posted on my Youtube channel after a seven day delay. Links to all my posts from my charting substacks are also always posted on my twitter.


Friday, 12 June 2026

Another Inflection Point Here

In my post on Wednesday I was looking at the H&S patterns that had broken down on SPX, QQQ and DIA and saying that, for a variety of reasons I explained then, I didn’t think any of those H&S patterns were likely to reach their targets, and would likely instead fail into retests of their all time highs. Since then we have seen the start of rally I expected and equity indices have reached another inflection point where they can either break up towards retests of the all time highs, or fail down into those H&S targets.

On DIA the H&S failed this morning on the break back over the H&S right shoulder, and that now has a target at a retest of the all time high, but the big dogs here are SPX and QQQ, so I’ll mainly be looking at those today.

DIA 15min chart:

On SPX the key level for the H&S is the right shoulder high at 7483.15, and if we see that or the QQQ right shoulder high break then retests of the all time highs become very likely, and I’d expect to see those next week.

SPX 15min chart:

On QQQ the key level for the H&S is the right shoulder high at 725.66, and if we see that or the QQQ right shoulder high break then retests of the all time highs become very likely, and I’d expect to see those next week.

QQQ 15min chart:

These breaks of the H&S right shoulders are the key resistance levels here. If they break then the all time high retests are very much the next obvious targets across the board, though I’d note that the ATH has already been retested and broken on IWM this morning.

The daily middle bands are still important though and at the time of writing SPX is close to backtesting the daily middle band in the 7466 area. If SPX is returning to the all time high that needs to be broken and converted back to support.

An hourly RSI 14 buy signal has fixed since Wednesday and is a decent signal supporting the bull case here.

SPX daily chart:

At the time of writing QQQ is backtesting the daily middle band in the 721.60 area. If QQQ is returning to the all time high that needs to be broken and converted back to support.

A daily RSI 5 buy signal and an hourly RSI 14 buy signal have fixed since Wednesday and both are decent signals supporting the bull case here.

QQQ daily chart:

So is there a bear case here? Yes, though it looked stronger at the open, and is weakening with ES at the time of writing this up about 60. There is still a good quality bear flag on the SPX 5min chart, and the current break above may be a bearish overthrow, but if the bear flag is breaking higher, the target for that break would also be close to a retest of the all time high.

SPX 5min chart:

I was talking on Wednesday about the daily historical leans on SPX that I look at every week, the unusual continuous run of significant leans either way both last week and this week, and the 100% hit rate on those leans since the start of last week. That hit rate was at 7/7 on Wednesday and is at 9/9 now. Today and Monday lean bullish, the lean is neutral Tuesday through Thursday and Friday next week is a holiday, with holiday weeks having a general overall bullish lean. This is an ideal time window to see retests of the all time highs. On a pure technical basis I would give 80% odds to seeing those all time high retests next, though this is obviously also a very dense news environment.

Fifteen weeks into this two to four week war against Iran, that may now finally be ending, I am still expecting to see an oil squeeze starting in coming weeks when world oil stocks fall to critical levels, and I think that last Friday’s decline on QQQ was a warning that the AI bubble might also be heading into trouble. I am watching the upcoming IPOs on SpaceX, OpenAI and Anthropic with great interest and also the cash calls to shareholders from Google and Facebook for their AI investment plans. These are putting strain on an already stretched market.

I am still looking for a significant high on equities soon and after this equities high is made I think the months after that high lean strongly bullish for oil, food and inflation, and bearish for equities and US treasuries.

I’ll be following this up with as look at the longer term structure in a post early next week and I’ll be posting an updated look at oil markets on my The Bigger Picture substack later today.

In my post on 30th April I made some predictions for oil, equity and bond markets over the rest of this year. Nothing has happened since to change this longer term view though it might take an extra month for US inflation to reach 5%. US CPI hit 4.2% this week.

  1. Oil - I think it is now very likely that Brent Crude and West Texas Intermediate Crude will hit new all time highs over $150 within weeks, and that we may well see prices in the $200 to $250 range within months. Gas at the US pump will likely rise into the $6 to $9 range and oil will likely be over $100 on a monthly average basis for the rest of this year.

  2. Bonds - US Inflation will likely go back over 5% within two months and may go over 7% by the end of the year. Ten year and thirty year Treasury yields will likely go over a key psychological level at 6% over the summer and may reach 9% before the next big high on yields is made.

  3. Equities - Looking at SPX I’ll be looking for at least a decline into the rising support trendline from the October 2022 low, currently in the 5400 area. On a break below I would be looking for a retest of the April 2025 low at 4835.04.

Obviously this is a bearish take, but I have not felt this bearish about equities since summer 2008 and February 2020. There is good reason to be bearish here. When will all this happen? We’ll have to find out the usual way, by waiting to see, but I like the odds. Could I be wrong? Always, but I still like the odds. :-)

If you like my analysis and would like to see more, please take a free subscription at my chartingthemarkets substack, where I publish these posts first. I also do a premarket video every day on equity indices, bonds, currencies, energies, precious commodities and other commodities at 8.45am EST, but only for paying subscribers. Other places to find me are my page on the platform previously known as twitter, and my YouTube channel.

Topping Really Is A Process

In my post on 20th May I was looking at the four high quality topping patterns forming on SPX, QQQ, DIA and IWM. As is often the case these didn’t deliver and the indices rejected back into higher highs. We are now looking at a new candidate high forming here but for a number of reasons these highs tend to take a while to form. This one does not look ready yet for much more downside unless there is some really bad news today.

I watch the historical stats for each day carefully as they often deliver, and last week and this week have been unusual for two reasons. Firstly every day has had a significant bullish or bearish lean, which is rare, as the majority of trading days in any year lean neutral. Secondly, the historical lean towards a red or green close has delivered every day since the start of last week, and I’m thinking the odds are decent that will continue to be the case into the end of this week.

On Friday I was talking about this in my premarket video, and was talking about the possibility that we would see a trend down day, which delivered and gave us a strong signal that another possible topping process might have started. So far this week the lean was bullish on Monday and bearish yesterday, which both delivered and the H&S patterns that had formed on SPX, QQQ and DIA all broke down towards lower targets.

I don’t think that any of those H&S patterns are likely to reach their targets, and I’ll explain why that is, but first let’s have a look at those patterns. I would note first that whenever an H&S breaks down there are in effect two targets. One of these two targets is highly likely (over 85%) to be reached. The first target is the H&S downside target, and the second is the fail target in the event that the trading instrument breaks back over the right shoulder high, in which case the target is the retest of the prior high at the top of the head, which in this case would be a retest of the all time highs on SPX, QQQ and DIA.

On SPX a decent quality H&S broke down with a target in the 7100 area. The H&S would fail on a move back over the right shoulder high at 7483.15.

SPX 15min chart:

On QQQ a decent quality H&S broke down with a target in the 657 area. The H&S would fail on a move back over the right shoulder high at 725.66.

QQQ 15min chart:

On DIA a fair quality H&S broke down with a target in the 498.30 area. The H&S would fail on a move back over the right shoulder high at 513.54.

DIA 15min chart:

Why do I think that all these H&S patterns are likely to fail back into high retests? Well one reason is that the second and last historically bearish leaning day this week is today, and reaching those targets either today or tomorrow morning looks very ambitious unless there is some really bad and market moving news. The impressive decline on SPX last Friday from high to low was about 230 points. At the time of writing this SPX is at 7360 and to hit the H&S target would therefore require a decline of 260 points. That looks ambitious.

There’s more though, the low on SPX yesterday was a visual hit of the 3sd lower band. Unless there is really bad news that tends to be a strong buy level on SPX, as it was yesterday. It takes time for daily middle bands to turn down and for the outer bands to expand and SPX just isn’t there yet. This is a key reason that topping tends to take a while. The daily 3sd lower band on SPX is in the same area today and a more than 100 point punch below it today historically looks like a long shot. In the unlikely event that was to be reached today or tomorrow morning, it would likely be a strong buy.

SPX daily chart:

QQQ didn’t quite reach the daily 3sd lower band yesterday though it came close. For today that is strong support in the 676.50 area, supported by the 50dma now at 676.39. I’d be surprised to see that broken significantly today.

One other thing I would note is that a possible daily RSI 5 buy signal is brewing on QQQ. There are also possible hourly RSI 14 buy signals brewing on both QQQ and SPX and all of these are suggesting a reversal back up to rested the all time highs from here. QQQ and SPX have been driving the downside bus over the last few days, and it’s likely they would be driving the upside bus too.

Lastly I should add that the low on DIA yesterday was a test of the daily middle band, which tends to be decent support, and the close on IWM yesterday was slightly over the daily middle band. Both of those have been stronger than QQQ and SPX over the last few days.

QQQ daily chart:

So what are the historical stats from here? Well today leans bearish as I mentioned. After today the next three trading days through Monday lean bullish, Tuesday through Thursday next week lean neutral into the Juneteenth holiday on Friday. Obviously this would be an attractive window to see some all time high retests.

Does this change my longer term outlook? No. I still think a significant high is forming on equity indices here and we are watching the process of finding that high. Each time a candidate high area is reached however the topping process has to start again from scratch and can take a while.

Fifteen weeks into this two to four week war against Iran I am still expecting to see an oil squeeze soon when world oil stocks fall to critical levels, and I think that last week’s decline on QQQ was a warning that the AI bubble might also be heading into trouble. I am watching the upcoming IPOs on SpaceX, OpenAI and Anthropic with great interest and also the cash calls to shareholders from Google and Facebook for their AI investment plans. These are putting strain on an already stretched market.

After this equities high is made I think the months after that high lean strongly bullish for oil, food and inflation, and bearish for equities and US treasuries.

I’ve been looking at the short term prospects for US equity indices today and I’ll be following this up with as look at the longer term structure in a post tomorrow.

In my post on 30th April I made some predictions for oil, equity and bond markets over the rest of this year. Nothing has happened since to change this longer term view though it might take an extra month for US inflation to reach 5%.

  1. Oil - I think it is now very likely that Brent Crude and West Texas Intermediate Crude will hit new all time highs over $150 within weeks, and that we may well see prices in the $200 to $250 range within months. Gas at the US pump will likely rise into the $6 to $9 range and oil will likely be over $100 on a monthly average basis for the rest of this year.

  2. Bonds - US Inflation will likely go back over 5% within two months and may go over 7% by the end of the year. Ten year and thirty year Treasury yields will likely go over a key psychological level at 6% over the summer and may reach 9% before the next big high on yields is made.

  3. Equities - Looking at SPX I’ll be looking for at least a decline into the rising support trendline from the October 2022 low, currently in the 5400 area. On a break below I would be looking for a retest of the April 2025 low at 4835.04.

Obviously this is a bearish take, but I have not felt this bearish about equities since summer 2008 and February 2020. There is good reason to be bearish here. When will all this happen? We’ll have to find out the usual way, by waiting to see, but I like the odds.

If you like my analysis and would like to see more, please take a free subscription at my chartingthemarkets substack, where I publish these posts first. I also do a premarket video every day on equity indices, bonds, currencies, energies, precious commodities and other commodities at 8.45am EST, but only for paying subscribers. Other places to find me are my page on the platform previously known as twitter, and my YouTube channel.

Tuesday, 2 June 2026

Oil Inventories Hitting Critical Levels

I wrote a post on 23rd April arguing that from an economic point of view the ongoing war between the US, Israel and Iran was largely irrelevant as the only thing that really mattered was how long the Strait of Hormuz would stay closed, and the risk that the Bab al-Mandab Strait might also be closed.

That was almost six weeks ago, and we’ve had a lot of announcements and briefings about peace talks since then, at least some of which appear to have been real, and it looked for a while last week as though there might actually be a chance of an interim agreement, but that has foundered for two strong reasons, firstly that both sides badly wanted a deal they could present as an unambiguous victory for themselves, and secondly that Israel didn’t want any peace agreement, and weren’t willing to restrict their actions in any way to get such any agreement.

On Saturday 23rd May, after a week of talk about active hostilities resuming, as the Polymarket odds of the Strait of Hormuz opening by the end of June fell to 25%, there were announcement that a peace agreement was close, and over the coming week those odds rose and peaked at 59%, and oil fell over 15%. By yesterday morning those odds had fallen back into the 20s and at the time of writing are at 22%. At the high yesterday oil had rallied back 50% of last week’s decline.

Announcements I saw from Iran yesterday included them leaving the negotiations because Israel were not allowing a ceasefire in Lebanon, or observing the ceasefire in Gaza, then Iran cutting off all diplomatic communications with the US, and saying that they were also about to close the Bab al-Mandab Strait for the first time in this conflict. It appears that peace talks have collapsed and will not be easy to resume.

So what now?

Well as I was saying in my post on 23rd April, the main issue was always whether the Strait of Hormuz stayed closed, and traffic through the Strait has now been at very low levels for over three months.

The consensus view is that oil supply is currently falling short of demand by about 6 million barrels per day, and that has been the case for over three months now. In that time global working and reserve stocks of oil have been declining and Exxon warned last week that these are reaching critical levels, and that within two or three weeks we might see a supply crunch that could see oil prices hit the $150 to $160 area. Chevron agreed and said that June and July would be very difficult months for oil markets.

It is likely that a major supply crunch on oil is coming in June or latest in July and prices would then need to reach a level where enough demand was destroyed to balance demand with this restricted supply. That might of course require prices going a lot higher than $150, and staying there potentially for months.

So what are the charts telling us?

The Brent Crude and Light Crude oil charts are telling similar stories here so I’ll just be looking at the Light Crude (WTIC) charts today.

On the bigger picture WTIC broke up from a falling wedge in February, and from a double bottom at the beginning of March. That made target within a couple of days. That falling wedge was also a decent quality bull flag and that flag has a target at a retest of the 2022 high at 126.42 which has not yet been reached.

There is also an older double bottom from before the 2022 high with an extended target at a retest of the all time high at 147.27. If Exxon and Chevron are right then both of those targets may well be hit in the next few weeks. That would involve WTIC rising $57 in that time from the level at the time of writing.

WTIC monthly chart:

On the daily chart a rough triangle has been forming from the March high and this would generally be a bullish consolidation pattern that should in due course deliver a retest of that March high at 119.48.

If we see last week’s low retested, though that isn’t the obvious scenario here, that should set up positive RSI 5 divergence and set a possible daily buy signal brewing.

WTIC daily chart:

On the hourly chart a falling megaphone from the 109.44 high formed last week and broke up on Sunday. The rally peaked almost exactly at a possible IHS neckline and there may well be an IHS forming here. If so a sustained break back up over the neckline at 94.67 would look for a target in the 103.10 area. That seems an obvious target area with my rough triangle resistance currently in the 106.8 area.

WTIC 60min chart:

Has the IHS right shoulder bottomed out? Very possibly, as there is an encouragingly high quality falling wedge that has formed on the 1min chart from yesterday’s high. If that holds then the right shoulder low is either made or close. As I have been writing this post this falling wedge has started to break up.

WTIC 1min chart:

Do I think that Brent & WTIC have a real shot at reaching Exxon’s $150 to $160 area? Well the projection I gave weeks ago in the event of a supply crunch was in the $150 to $300 range, so that would be at the low end of my range.

In the event that the Strait of Hormuz magically opened tomorrow I’m thinking we would likely see those new all time highs in any case. I understand that big oil tankers travel at a fast walking pace, so any resumed supply wouldn’t likely be important for a few weeks afterwards in any case.

The oil long from here has potential to be the trade of the year in my view.

If you like my analysis and would like to see more, please take a free subscription at my thebiggerpicture substack, where I publish these posts first and for members (from next week) also bi-weekly videos looking at equity indices, bonds, currencies and commodities. Those videos are posted on my Youtube channel after a seven day delay. Links to all my posts from my charting substacks are also always posted on my twitter.

Wednesday, 20 May 2026

Four Beautiful Topping Patterns

In my post on 6th May I was looking at the resistance trendline on the SPX weekly chart and that rising trendline was being close to being hit in the 7385 to 7400 area. It was then hit and exceeded in what might have been a bearish overthrow, but I had by then also drawn in an alternate high quality resistance trendline that was hit perfectly at the high on Friday. SPX could go a bit higher, but the ideal upside trendline target has been hit. Look at the chart below and admire this beautiful rising megaphone from the 2022 low. :-)

SPX daily chart:

In my last post on Friday 14th May I was putting the case that further upside was likely to be limited, and a decent looking candidate high was made that day, with a modest decline into yesterday’s lows.

So what now?

Well, now I am looking for topping patterns, first some smaller ones for the next leg down, and after that some larger ones for the much larger retracement that I think will likely follow.

In terms of these first topping patterns I was hoping for high retests on SPX and QQQ, and we could still see those, with newsbomb potential here high with the Iran talks apparently in progress again, and NVDA earnings out after the close tonight.

I remain doubtful that there are any serious talks with Iran happening, as it is clear that previous talks were mostly imaginary, and as it is already clear that the resumption of US attacks planned for yesterday were delayed, not by talks, but by an ultimatum to the US from Gulf States that unless they first consented, any further attacks on Iran would have to be done without any support from Gulf States or US bases on their territory. Subject to that though, there are four high quality H&S patterns forming on SPX, QQQ, DIA and IWM, and they are as follows.

On SPX there is a high quality H&S forming, the ideal right shoulder high area has been reached today, and on a sustained break below 7330 would look for a target in the 7140 area.

SPX 15min chart:

On QQQ there is also a high quality H&S forming, the ideal right shoulder high area has been reached today, and on a sustained break below 694 would look for a target in the 688 area.

QQQ 15min chart:

On DIA there is also a high quality H&S forming, though in this case it can also be read as a double top that has already broken down. On a sustained break below 492 the double top target would be in the 483 area.

Read as an H&S, the ideal right shoulder high area has been reached today, and on a sustained break below 692 would look for a target in the 687 area.

DIA 15min chart:

On IWM there is also a high quality H&S forming, the ideal right shoulder high area has been reached today, and on a sustained break below 271 would look for a target in the 254 area.

IWM 15min chart:

Will these patterns play out? Well there are fixed daily sell signals on all four of these indices and the newsbomb part of the day may be over, with CL already having dropped $8.50 from the last highs on the news that the talks with Iran were ‘in the final stages’. As ever the first part of that decline happened before the news so we can at least be confident that US Administration insiders had a solid trading day.

As for NVDA? Well a classic move at or near the end of a big bull run would be to get good news that the market responded to by dropping. Well see how that goes tonight.

If markets rally much further I’d be looking for all time high retests on SPX and QQQ, and we might then see the all time high retest on DIA that I was looking for last week and didn’t see.

Either way further upside looks limited, and at most I think that this bull run from the late February low is likely to be over by the end of May.

After this equities high is made I think the months after that high lean strongly bullish for oil, food and inflation, and bearish for equities and US treasuries.

In my post on 30th April I made some predictions for oil, equity and bond markets over the rest of this year. Nothing has happened since to change this longer term view though it might take an extra month for US inflation to reach 5%.

  1. Oil - I think it is now very likely that Brent Crude and West Texas Intermediate Crude will hit new all time highs over $150 within weeks, and that we may well see prices in the $200 to $250 range within months. Gas at the US pump will likely rise into the $6 to $9 range and oil will likely be over $100 on a monthly average basis for the rest of this year.

  2. Bonds - US Inflation will likely go back over 5% within two months and may go over 7% by the end of the year. Ten year and thirty year Treasury yields will likely go over a key psychological level at 6% over the summer and may reach 9% before the next big high on yields is made.

  3. Equities - Looking at SPX I’ll be looking for at least a decline into the rising support trendline from the October 2022 low, currently in the 5400 area. On a break below I would be looking for a retest of the April 2025 low at 4835.04.

Obviously this is a bearish take, but I have not felt this bearish about equities since summer 2008 and February 2020. There is good reason to be bearish here.

If you like my analysis and would like to see more, please take a free subscription at my chartingthemarkets substack, where I publish these posts first. I also do a premarket video every day on equity indices, bonds, currencies, energies, precious commodities and other commodities at 8.45am EST, but only for paying subscribers. Other places to find me are my page on the platform previously known as twitter, and my YouTube channel.

Thursday, 14 May 2026

Wild Thing

In my post on 28th April I was talking about the Hormuz crisis but noting that when SPX made a new all time high on 19th February 2020, well after it was so obvious that COVID-19 was going to be a big problem that panic hoarders had caused a worldwide shortage of toilet paper, it reached a major resistance trendline and I was speculating that we might see that again here, giving a trendline target 200 handles higher in the 7360 area.

In my last post on 6th May I was looking at the resistance trendline again on the SPX weekly chart and that rising trendline was being close to being hit in the 7385 to 7400 area. It has since been hit and exceeded in what might be a bearish overthrow, but a have also since drawn in an alternate high quality resistance trendline that is being hit today. SPX could go a bit higher, but the obvious upside trendline targets have now been hit.

SPX weekly chart:

On QQQ I was looking for a trendline target in the 695 area at the time of my last post and that has also been hit and exceeded, with QQQ in the 720 area at the time of writing.

I don’t have any higher targets on that weekly chart from the 2022 low but I do have a very nice possible trendline target on the daily chart from the April 2025 low. If that is hit this week it would be in the 730 area.

QQQ daily chart:

On DIA I was just looking for a retest of the all time high at 503.37 and that hasn’t quite happened, though the high so far today at 502.16 is very close. I’m leaning towards seeing that hit before the high for this move, ideally tomorrow or early next week.

DIA daily chart:

On IWM I drew two possible trendline targets that have not been hit but have since drawn in a third possibility that has. IWM doesn’t need to go any higher but I am at least expecting this high at 287.58 to be retested, as I have a nice looking bull flag on the RTY hourly chart which has broken up with a target there.

IWM daily chart:

What kind of high might we see at the end of this wild run? Well this is looking very like a parabolic ending move. That would suggest a significant high:

How are things looking under the surface? Well the Strait of Hormuz has now been closed for 11 weeks and doesn’t look likely to reopen at anything like pre-war levels anytime soon. There is a likely big supply shock coming soon.

Both sides in the Iran War have been waiting for the other side to concede defeat since early April, but neither looks likely to do so. A resumption of hostilities is looking increasingly likely. Regardless of that the big supply shock from the closure of the Strait is likely coming soon.

In the US inflation is rising rapidly, there is increasing evidence that US consumers are cutting back on non-gasoline expenses and the yawning chasm between the current all time highs on the S&P 500 and all time low in consumer confidence is awe-inspiring. Consumer confidence historically is a leading indicator of market declines as you can see on the chart below:

In the short term US equity indices look very stretched on many measures, but the one that caught my eye today was the number of days of SPX 1% gains without a 1% loss . That hit eight yesterday, equalling eight previous runs like this since 1950. It may hit nine today, with two previous instances since 1950. Above there are just one instance of ten and two instances of eleven. Upside from here looks limited:

At the end of April I was arguing for higher equity prices using the analog of February 2020, high quality target trendlines above, and (on my webinars) that the short term structure looked incomplete in a way that generally suggested that the move was not close to finishing.

At this point equities have hit the trendlines I was looking for and I am almost out of upside targets. I think the high for this move is close, and I think the months after that high lean strongly bullish for oil, food and inflation, and bearish for equities and US treasuries.

In my post on 30th April I made some predictions for oil, equity and bond markets over the rest of this year. Nothing has happened since to change this longer term view though it might take an extra month for US inflation to reach 5%.

  1. Oil - I think it is now very likely that Brent Crude and West Texas Intermediate Crude will hit new all time highs over $150 within weeks, and that we may well see prices in the $200 to $250 range within months. Gas at the US pump will likely rise into the $6 to $9 range and oil will likely be over $100 on a monthly average basis for the rest of this year.

  2. Bonds - US Inflation will likely go back over 5% within two months and may go over 7% by the end of the year. Ten year and thirty year Treasury yields will likely go over a key psychological level at 6% over the summer and may reach 9% before the next big high on yields is made.

  3. Equities - Looking at SPX I’ll be looking for at least a decline into the rising support trendline from the October 2022 low, currently in the 5400 area. On a break below I would be looking for a retest of the April 2025 low at 4835.04.

Obviously this is a bearish take, but I have not felt this bearish about equities since summer 2008 and February 2020. There is good reason to be bearish here.

If you like my analysis and would like to see more, please take a free subscription at my chartingthemarkets substack, where I publish these posts first. I also do a premarket video every day on equity indices, bonds, currencies, energies, precious commodities and other commodities at 8.45am EST, but only for paying subscribers. Other places to find me are my page on the platform previously known as twitter, and my YouTube channel.

Wednesday, 6 May 2026

Crisis? What Crisis?

In my post on 23rd April on my The Bigger Picture substack I was looking at why in my view the Iran War was, and is, largely irrelevant in the context of the economic shock being created by the closure of the Strait of Hormuz. The Strait has now been closed for almost ten weeks, and seems very likely to be closed for at least another three weeks. I’ll be writing a follow up post tomorrow about oil, and the oil shock that I’m expecting to become very important when the oil and equity markets come out of their current wishful thinking daze in one to three weeks. If you’d like to see that, it will be published on my The Bigger Picture substack and at theslopeofhope.com.

In my post on 28th April I was talking about the brewing oil crisis as well but noting that when SPX made a new all time high on 19th February 2020, well after it was so obvious that COVID-19 was going to be a big problem that panic hoarders had caused a worldwide shortage of toilet paper, it reached a major resistance trendline and I was speculating that we might see that again here, giving an ambitious trendline target 200 handles higher in the 7360 area.

That trendline is rising of course, and is now in the 7385-7400 area, with SPX at 7365 at the close tonight. It would not be unusual to go a bit higher than that in a bearish overthrow before this move tops out.

SPX weekly chart:

I’ve been talking for the last couple of weeks in my daily premarket webinars and bi-weekly The Bigger Picture webinars about having a continued long bias on equities because decent quality patterns had not yet formed on SPX or QQQ from the late March low. These webinars are all posted on my YouTube channel of course. When the pattern looks incomplete on SPX in particular it usually means that the move has further to go and so it has proved here.

That has now been fixed on SPX with a clear rising channel established from the late March low. These often evolve into rising wedges and I have drawn the most likely three possible wedge resistance trendline options on the chart below. The best match with the trendline on the weekly chart would be the lower trendline, currently in the 7390 area, and the highest quality option would be the middle dotted trendline, currently in the 7425 area.

SPX 15min chart:

On QQQ I mistakenly said on 28th April that the target trendline was in the 680 area. It was in fact in the 690 area and was hit this afternoon in the 695 area. As with SPX we could see a bearish overthrow of that trendline.

QQQ weekly chart:

On the QQQ 15min chart I have a clear rising support trendline from the late March low, and four obvious possible resistance trendlines. The two best quality trendlines are the lowest, with QQQ already above it, and the middle of the higher three trendlines, currently in the 703 area.

QQQ 15min chart:

I’m ignoring DIA today, as my only target there was a retest of the all time high at 503.37. DIA is close but lagging the others so badly that I’m wondering whether it will even manage that. I’m provisionally assuming it will though.

On the IWM daily chart the pattern I’m watching is from the April 2025 low, and there are two obvious resistance trendlines above. The first is possible channel resistance, currently in the 292 area, and possible rising megaphone resistance, currently in the 296 area.

IWM daily chart:

On the IWM 15min chart there is another clear rising channel from the late March low, but as with SPX this channel may well evolve into a rising wedge, and the obvious rising wedge resistance trendline is currently in the 289 area.

IWM 15min chart:

In broad terms I have all of SPX, QQQ, DIA & IWM close to their target areas and I’m looking for those all to be hit and then to start a topping process for this move that doesn’t seem likely to take more than one to three weeks before equity markets are on the way down again. I think this high on equities may well last the rest of this year and perhaps next year as well.

In my post on 30th April I made some predictions for oil, equity and bond markets over the rest of this year. Nothing has happened since to change this longer term view.

  1. Oil - I think it is now very likely that Brent Crude and West Texas Intermediate Crude will hit new all time highs over $150 within weeks, and that we may well see prices in the $200 to $250 range within months. Gas at the US pump will likely rise into the $6 to $9 range and oil will likely be over $100 on a monthly average basis for the rest of this year.

  2. Bonds - US Inflation will likely go back over 5% within two months and may go over 7% by the end of the year. Ten year and thirty year Treasury yields will likely go over a key psychological level at 6% over the summer and may reach 9% before the next big high on yields is made.

  3. Equities - Looking at SPX I’ll be looking for at least a decline into the rising support trendline from the October 2022 low, currently in the 5400 area. On a break below I would be looking for a retest of the April 2025 low at 4835.04.

If you like my analysis and would like to see more, please take a free subscription at my chartingthemarkets substack, where I publish these posts first. I also do a premarket video every day on equity indices, bonds, currencies, energies, precious commodities and other commodities at 8.45am EST, but only for paying subscribers. Other places to find me are my page on the platform previously known as twitter, and my YouTube channel.