- WE'RE JUST RANDOM SPECKS OF DUST IN A TORNADO TO THE MARKETS .......
- CHARTISTS MUST PUT ALL BIAS ASIDE AND LET THE CHARTS DO THE TALKING OR WE'LL SEE ONLY WHAT WE WANT TO SEE
- This blog has a copy of all header posts that I publish anywhere, so that those interested in seeing what my thoughts are on the markets can find them easily.
- I will be answering questions and responding to comments, so feel free to respond to any posts and I will see your comment even if it is not on the most recent post.
- If you're interested in seeing any intraday charts I post, I do that on twitter, and my twitter handle is @shjackcharts.
- The charts in the posts are as large as I can practically make them. if you would like to look at one more closely, click on it, and the link will take you to a larger version at screencast. If you click on that again, you will get a full page version, and can use the resizing function on your browser to enlarge parts of interest further.

Wednesday, 30 December 2020

A Most Interesting Year

Tomorrow is the last trading day of 2020 and with new Year's Day on Friday we get another long weekend into the start of 2021 next week. This has been a really interesting year, though a very hard one for many, and will leave a legacy for economies and markets that will likely ripple through the next few years. We'll see how that develops in 2021.

At the end of every year we like to do a free public webinar or two at theartofchart.net looking at where we see markets going over the next year, and we are doing the ones for next year tonight and tomorrow. All are welcome and the first  webinar we are running is at 5PM EDT tonight (Wednesday 30th January) looking at equity indices, FAANG stocks and key sector ETFs and, if you'd like to attend, you can register for that here. The second webinar is at 5PM EDT tomorrow (Thursday 31st January) looking at commodities including metals, energies, softs, meat and grains and, if you'd like to attend, you can register for that here. As always all webinars are linked from our monthly free webinars page at our blog, currently December.

In the short term we are seeing a slow, low volume end to the year, and markets are looking very stretched here. At the time of writing SPX is over 1.5% over the monthly upper band and would need to decline over 16% to retrace to the monthly middle band in the 3130 area. That is extreme though I'd note that IWM is even more stretched, currently an eye-watering 8% over the monthly upper band and 25% over the monthly middle band. The odds favor a large retracement starting soon, and that may start next week.

SPX monthly chart:

In terms of the setup for making a short term high here that is now very attractive and there is a very attractive case too that equity indices are topping out here before a retracement that might well look for backtests of those monthly middle bands.

On the SPX daily chart the main support is the daily middle band, currently at 3694. On a break below and conversion of that level to resistance a significant high may well be in, barring a retest or two to make topping patterns. That high might last through much of all of 2021, and we'll be talking more about that tonight, and talking tomorrow night about why we are looking for a solid bull run in commodities in 2021.

SPX daily chart:

On the SPX 60min chart the last new all time high delivered a slight overthrow of the rising wedge resistance trendline. I'm expecting the retracement back to rising wedge support, currently 3490 area, to start shortly, and the bearish overthrow is telling us to expect that to break, opening a possible move back to the monthly middle band.

SPX 60min chart:

NDX is looking toppy here, with a possible daily RSI 5 sell signal brewing and well established support at the daily middle band, now in the 12617 area. There is no obvious overall pattern from the March low but a decent rising wedge from the November low is topping out here.

NDX 60min chart:

Dow has been topping out within the very nice rising wedge from the March low for six weeks or so now. The last new all time high has now also slightly overthrown, so that too is looking very toppy here.

INDU 60min chart:

Years regularly start with strong declines in the first couple of weeks of the month and there is a very decent setup for that here. Could markets hang around here a while longer, or even break up? Sure, anything is always possible, but the odds favor lower.

We are running our next Trader Boot Camp starting 18th January and this is extremely competitively priced and covers a lot of territory. If you're interested you can read more about that here.

Lastly we are running our December sale for memberships at theartofchart.net until the end of the year, and that offers annual memberships with four free months rather than the usual two. We won't be running another of these sales until at least July, so if you are interested you should get this done before the end of December. You can find the page for that here.

Everyone have a great holiday weekend and a very Happy New Year! :-)

Wednesday, 23 December 2020

Tis The Season

It has been a grim year and I, and many others, will be very glad to leave it behind, but even with maximum lockdown spreading rapidly across the UK with the new virus mutation, I have a great holiday weekend planned with roaring fires, presents, great food, homemade pancakes, (probably too much) chocolate, board games and so on. My soon to be ex-wife will be absent but my three children, two cats, and one dog will all be here having a great time and there is a good chance that this will be the most enjoyable christmas that we have had so far this millenium. I'm really looking forward to it. I've had requests for a family video of us making pancakes over the holiday that I may well film on New Year's Day and post on YouTube. :-)

In the background of course markets are still trading and are setting up beautifully for a possible retracement in (probably) early January, so let's have a quick look and see how that is developing.

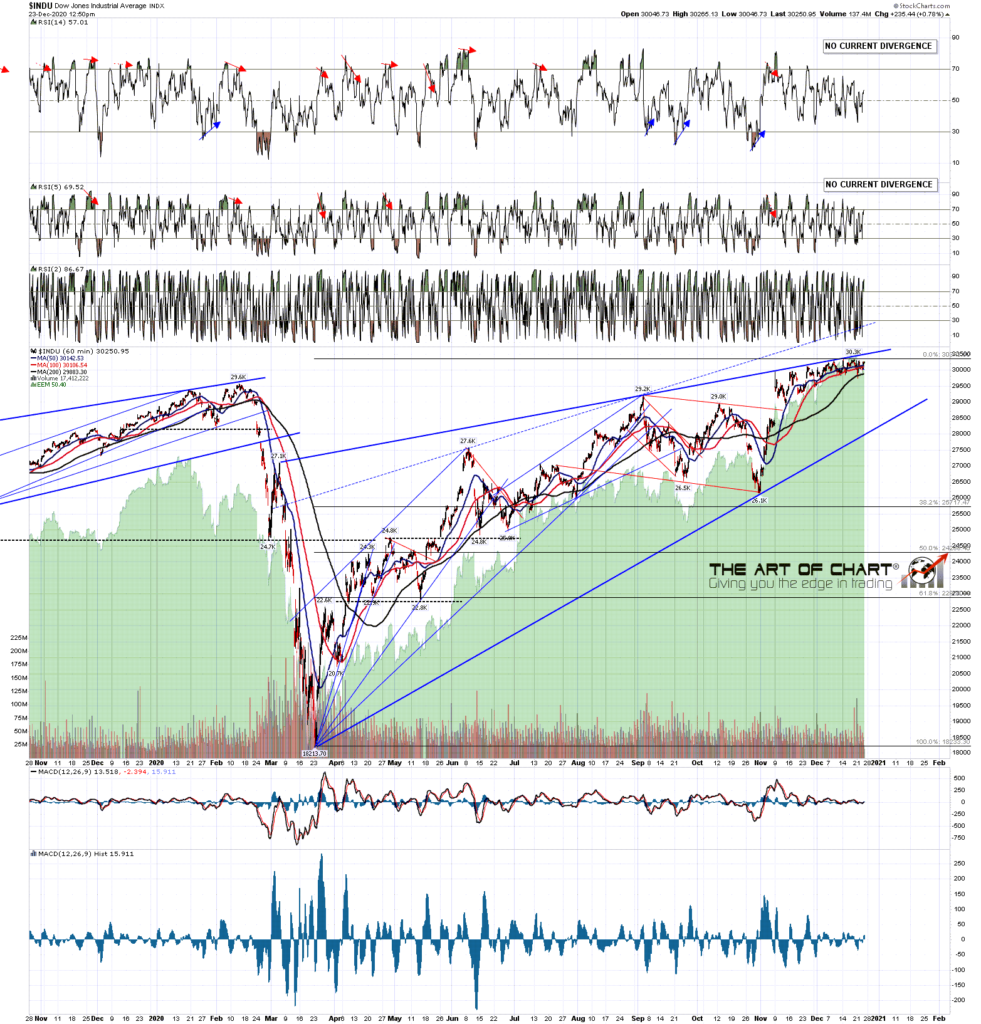
On the Dow 30 price is still rising very gently just under the beautiful rising wedge resistance trendline that I've been watching for four or five weeks now. Looking for a retracement towards rising wedge support, currently in the 28000 area, to start soon. No bearish overthrow here so that wedge support may well hold as support when tested.

INDU 60min chart: 

On the SPX chart I had SPX bearishly overthrowing my initial rising wedge resistance trendline, but the latest all time high has established a high quality alternate wedge resistance trendline that I have switched over to now. This wedge is therefore in the same place as the Dow 30 wedge, looking for a retracement back to rising wedge support to start soon, with that currently in the 3470 area.

SPX 60min chart:

There isn't much negative divergence on the daily charts here what what I would note is the repeated tests of the daily middle bands on SPX and most other indices notably excepting the Russell 2000. The daily middle band on SPX is now in the 3677 area, and a break and conversion of that level to resistance should signal that the retracement has begun.

SPX daily chart:

The Dow has also been repeatedly testing the daily middle band as well. No daily closes below that so far, but it is easy to see where current support is, and I'm expecting to see that close below within days.

INDU daily chart:

NDX hasn't been testing the daily middle band as aggressively as SPX and INDU, but there are still two clear and precise tests in recent days, so that support is very clear there as well. When that support breaks we should see that decent retracement.

NDX daily chart: 

I'll be working most of next week, as I don't really like taking many days off work, and Stan and I have two big public webinars planned for the end of the year, looking at the prospects in 2021 for the many instruments we watch across the board, and with a particular focus on commodities, which we are expecting to be the big winners next year. The two webinars we are running are firstly at 5PM EDT on Wednesday 30th January looking at equity indices, FAANG stocks and key sector ETFs and if you'd like to attend you can register for that here. The second webinar is at 5PM EDT on Thursday 31st January looking at commodities including metals, energies, softs, meat and grains and if you'd like to attend you can register for that here. As always all webinars are linked from our monthly free webinars page at our blog, currently December.

We are running our next Trader Boot Camp starting 18th January and this is extremely competitively priced and covers a lot of territory. If you're interested you can read more about that here.

Lastly we are running our December sale for memberships at theartofchart.net until the end of the year, and that offers annual memberships with four free months rather than the usual two. We won't be running another of these sales until at least July, so if you are interested you should get this done before the end of December. You can find the page for that here.

I'll be back at work on Monday and am planning a couple more posts before the end of the year. Everyone have a great holiday weekend. I know I will. :-)

Friday, 11 December 2020

Annus Horribilis

Occasionally there is a year so awful that nothing seems to go right. The title phrase was first used in a Church of England publication in 1870, the year that papal infallibility was declared, Prussia invaded France, Italy annexed Rome, Lenin was born and the US weather service made their first official forecast. 2020 is another year worthy of the name (meaning horrible year in Latin), with COVID-19 having ravaged the world in a serious and lasting health and economic disaster.

This hasn't been a great year for me either, with my marriage ending acrimoniously, though that end had at least been a long time coming, and then I received the news this morning that my beloved sister was killed last night by a drunk driver in London. She will be sadly missed by many including her  three barely grown children though the funeral will have to be small due to COVID-19 restrictions. This really has been a bad year and I really won't be sorry to see the back of it. This also adds a sister killed by a drunk driver to my existing tally of two close friends killed by (their own) alcohol problems in their 40s. That's high, though a 2017 study found that the annual deaths worldwide from alcohol abuse are about 15 times higher, and the deaths from tobacco about 5 times higher, than the total deaths from all illegal drugs, which makes those last deaths from illegal drugs essentially a small rounding error on a much larger substance abuse problem involving legal drugs. Thought for the day.

Onto the markets where I think that the likely retracement on SPX that I've been predicting has started, though there may still be a high retest or two as larger topping patterns form. Just to review those charts across multiple timeframes then.

On the SPX monthly chart the recent punches over the monthly upper band historically favor a topping process that at least heads back to the monthly middle band area, currently about 3124.

SPX monthly chart: 

An RSI 5 sell signal has fixed on the daily chart that is getting close to target, but hasn't reached it yet, suggesting that SPX may retrace further short term. The low today was a test of decent support at the daily middle band, which could deliver a high retest if we see a strong enough rejection there.

SPX daily chart:

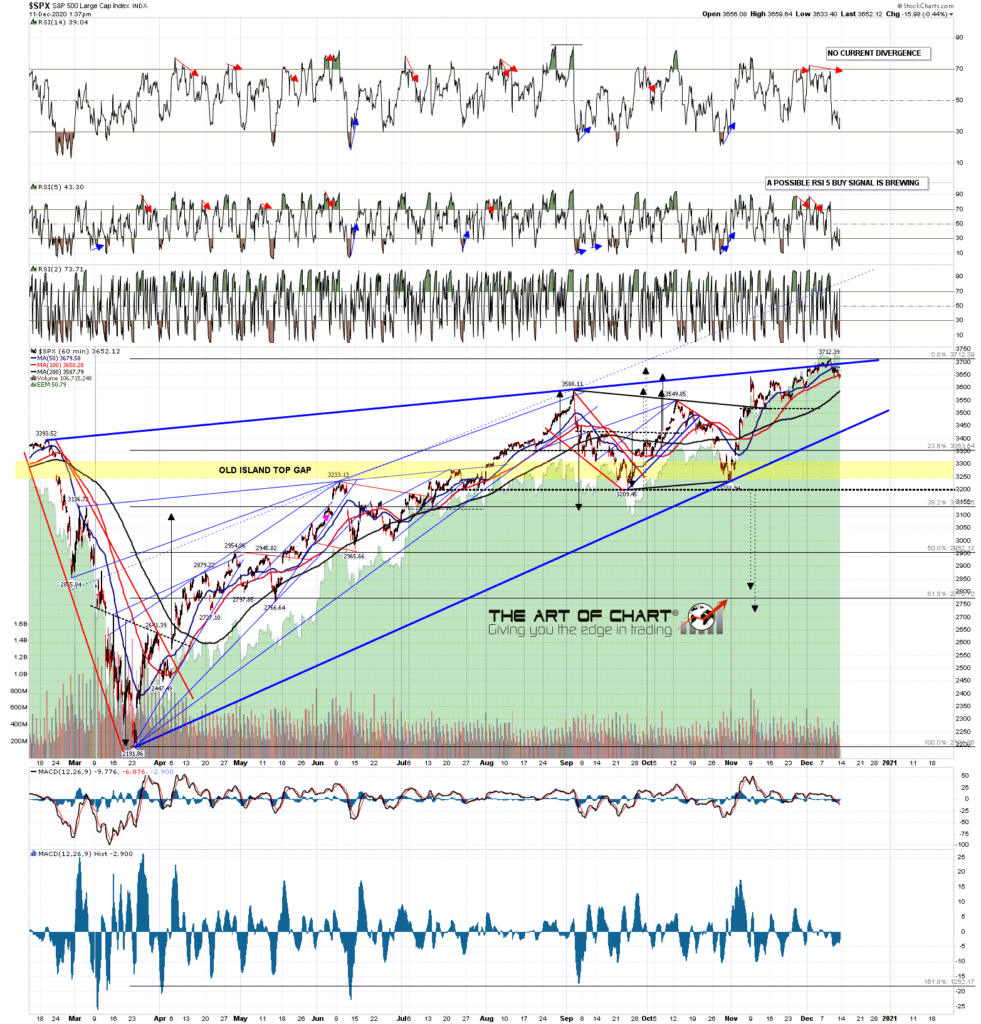
On the hourly chart SPX has formed a beautiful rising wedge from the March low that has overthrown bearishly and should now be returning to rising wedge support, currently in the 3420 area. The bearish overthrow suggest that will break at or soon after that test and open a minimum likely retracement of 38.2% of the move up from the March low. That target would be in the 3130 area, and if you're thinking that area sounds familiar, I'd note that the monthly middle band target is currently just six handles lower.

SPX 60min chart:

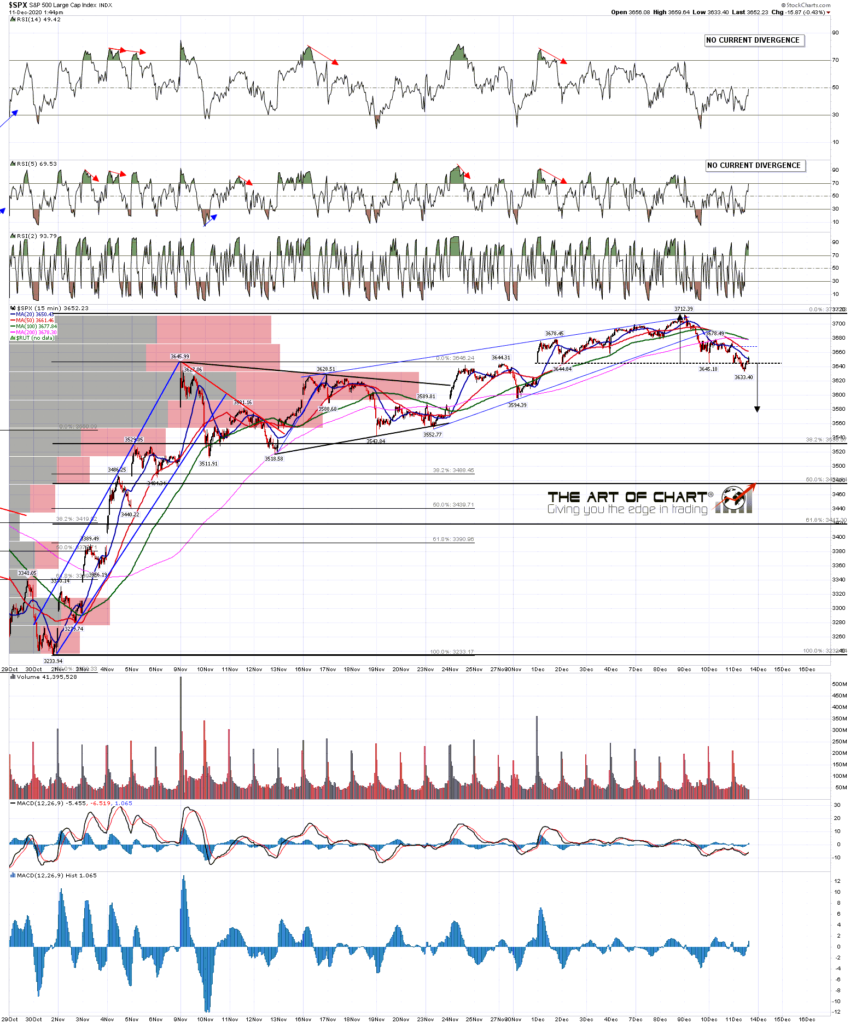
In terms of the shorter term pattern setup a very high quality H&S was forming on both SPX and ES into the close yesterday, and then broke down overnight with a target in the 3575 area on SPX and 3570 area on ES.  Of course whenever a pattern like this breaks down there is an inflection point where the trading instrument can reject back up into the previous highs (all time high retest here).  There are two levels I would be watching to signal that rejection. The first is the H&S right shoulder high at 3674.97, as a break above invalidates the H&S. The second is the 50 hour MA on SPX, currently at 3679. A break and conversion of that 50 hour MA back to support opens the all time high retest.

SPX 15min chart:

What else supports my overall view here? Well there are a number of things, but by far the prettiest is the beautiful rising wedge on Dow from the March low. I've been following and posting this for weeks now and it really is a beauty. So far it is delivering very well, and likely that continues to be the case.

INDU 60min chart:

Why am I working today when my sister was killed last night? Well I tend to work when I am feeling happy, as I enjoy it, and I tend to work when I am feeling sad, as I find it takes my mind off other problems. All in all I don't tend to take many days off work.

We had to delay the webinar scheduled for last night so we are doing our next free public Trading Commodities webinar tonight at theartofchart.net an hour after the close today. We will be looking at interesting trades on oil, natural gas and gold. If you'd like to attend you can register for that on on our December Free Webinars page. If you can't make it the recording will be posted on the same page later tonight.

Thursday, 3 December 2020

Topping Trendlines

I was saying in my last post on Monday that a retest of the high looked likely and we saw new all time highs on both SPX and NDX as expected. So what now?

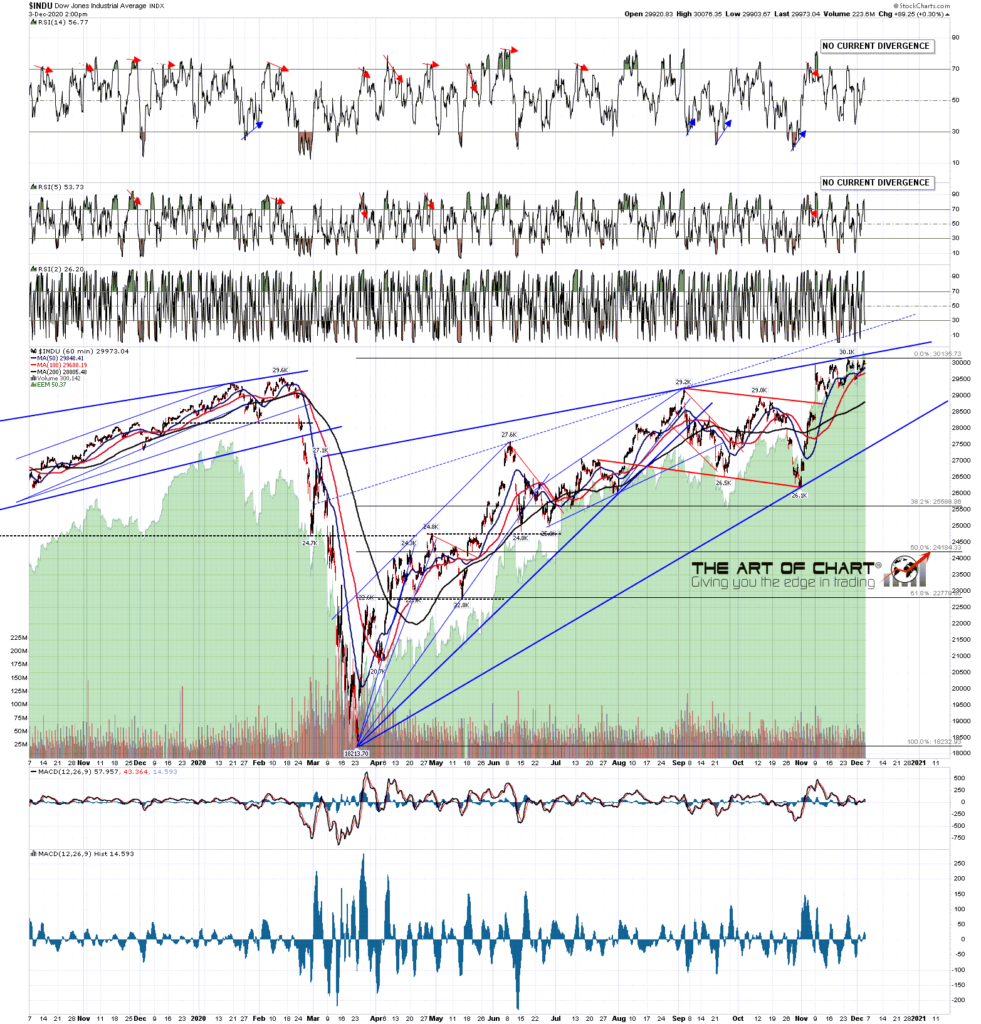
Well the best pattern on the board on Monday was the rising wedge on the Dow, and that is still looking pretty good. A daily RSI 5 sell signal has fixed there already of course, as one has on SPX as well.

INDU 60min chart: 

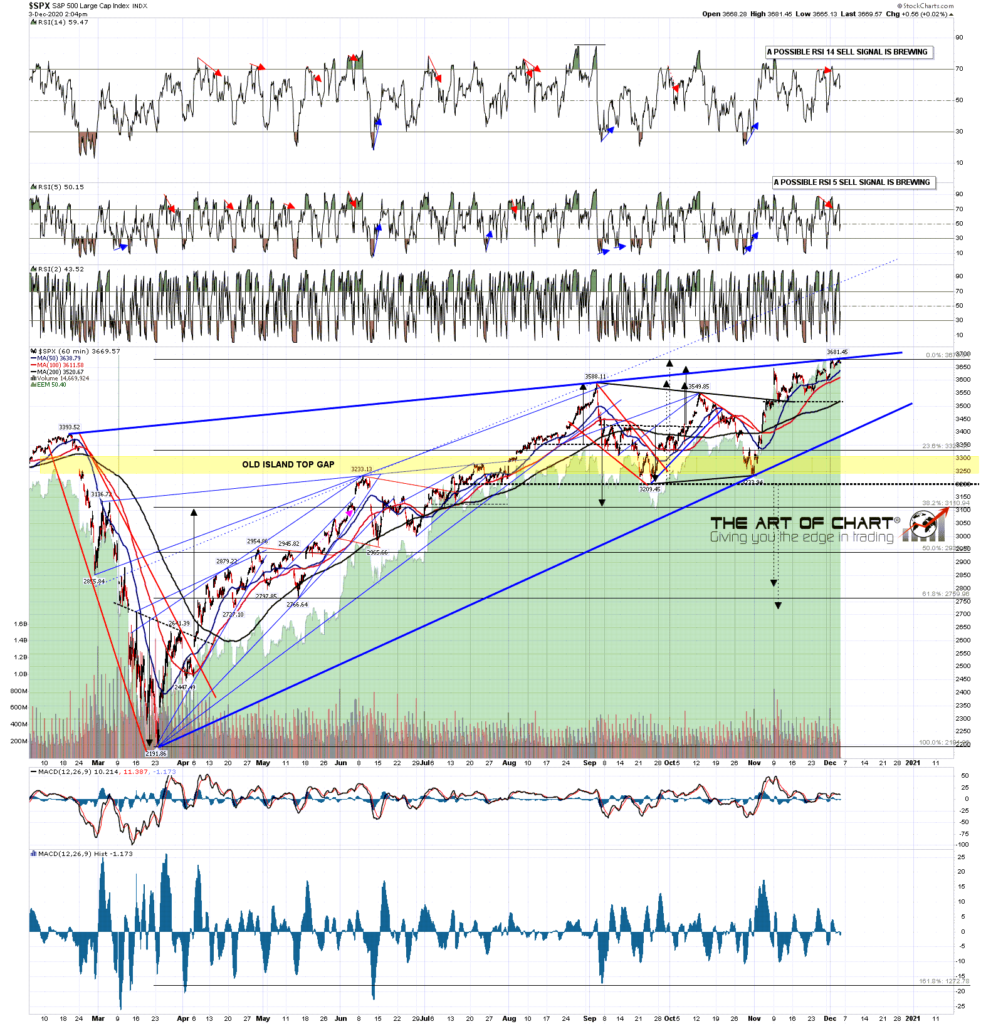
However that rising wedge on Dow is no longer the best pattern on the board as a simply beautiful rising wedge was established on SPX at the high this morning. A possible hourly RSI 14 sell signal is now brewing (also on NDX) and an hourly RSI 5 sell signal has fixed.

SPX 60min chart:

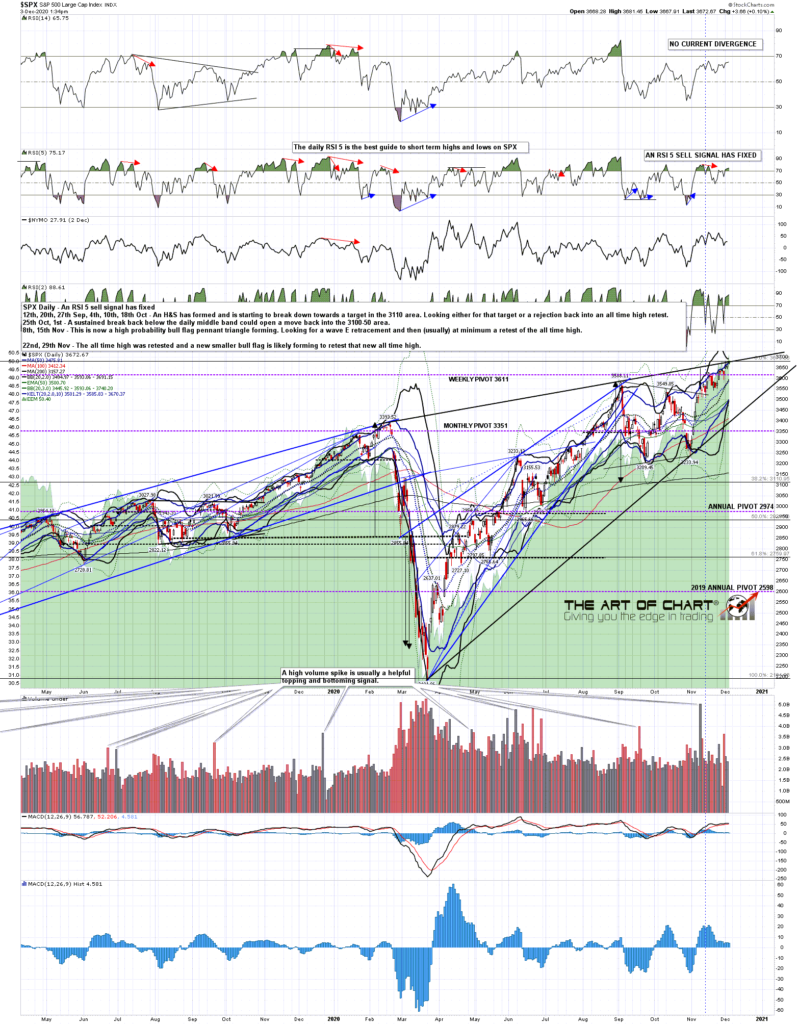
The daily chart on SPX looks very ready to roll over here. No more upside targets on SPX, NDX, IWM or INDU that remain to be hit and look like unfinished business.

SPX daily chart: 

We have a service at theartofchart.net that covers tech majors and sector ETFs. We send out charts a couple of times a week and the chart below is the hourly TSLA chart I sent out on Sunday. There is a dotted trendline above price that is the potential rising channel resistance trendline that is a theoretical resistance level. I put these on charts a lot in case they are hit.

TSLA 60min chart (Sun 29th Nov):

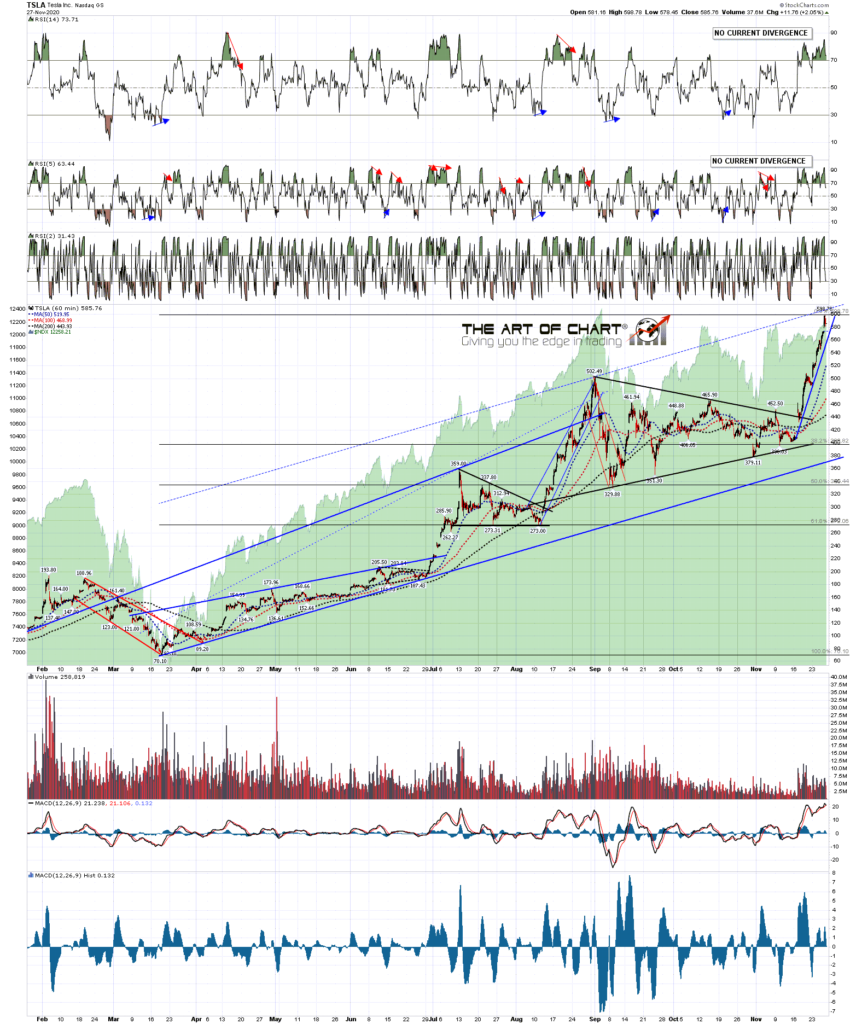
Here is the TSLA chart from today and as you can see, that rising channel on TSLA has now been established. Unless that breaks TSLA is also topping out here. It's just one (very large cap) stock but there are a lot of signs that a significant high is being made here.

TSLA 60min chart: 

We'll see how it goes but until we see some significant evidence to the contrary, my working assumption is that equity indices are topping out here. Our December Free Webinars page has been posted and I'd mention that our free monthly public Chart Chat is at 4pm EST on Sunday 6th December. Be there or be unaware! :-)