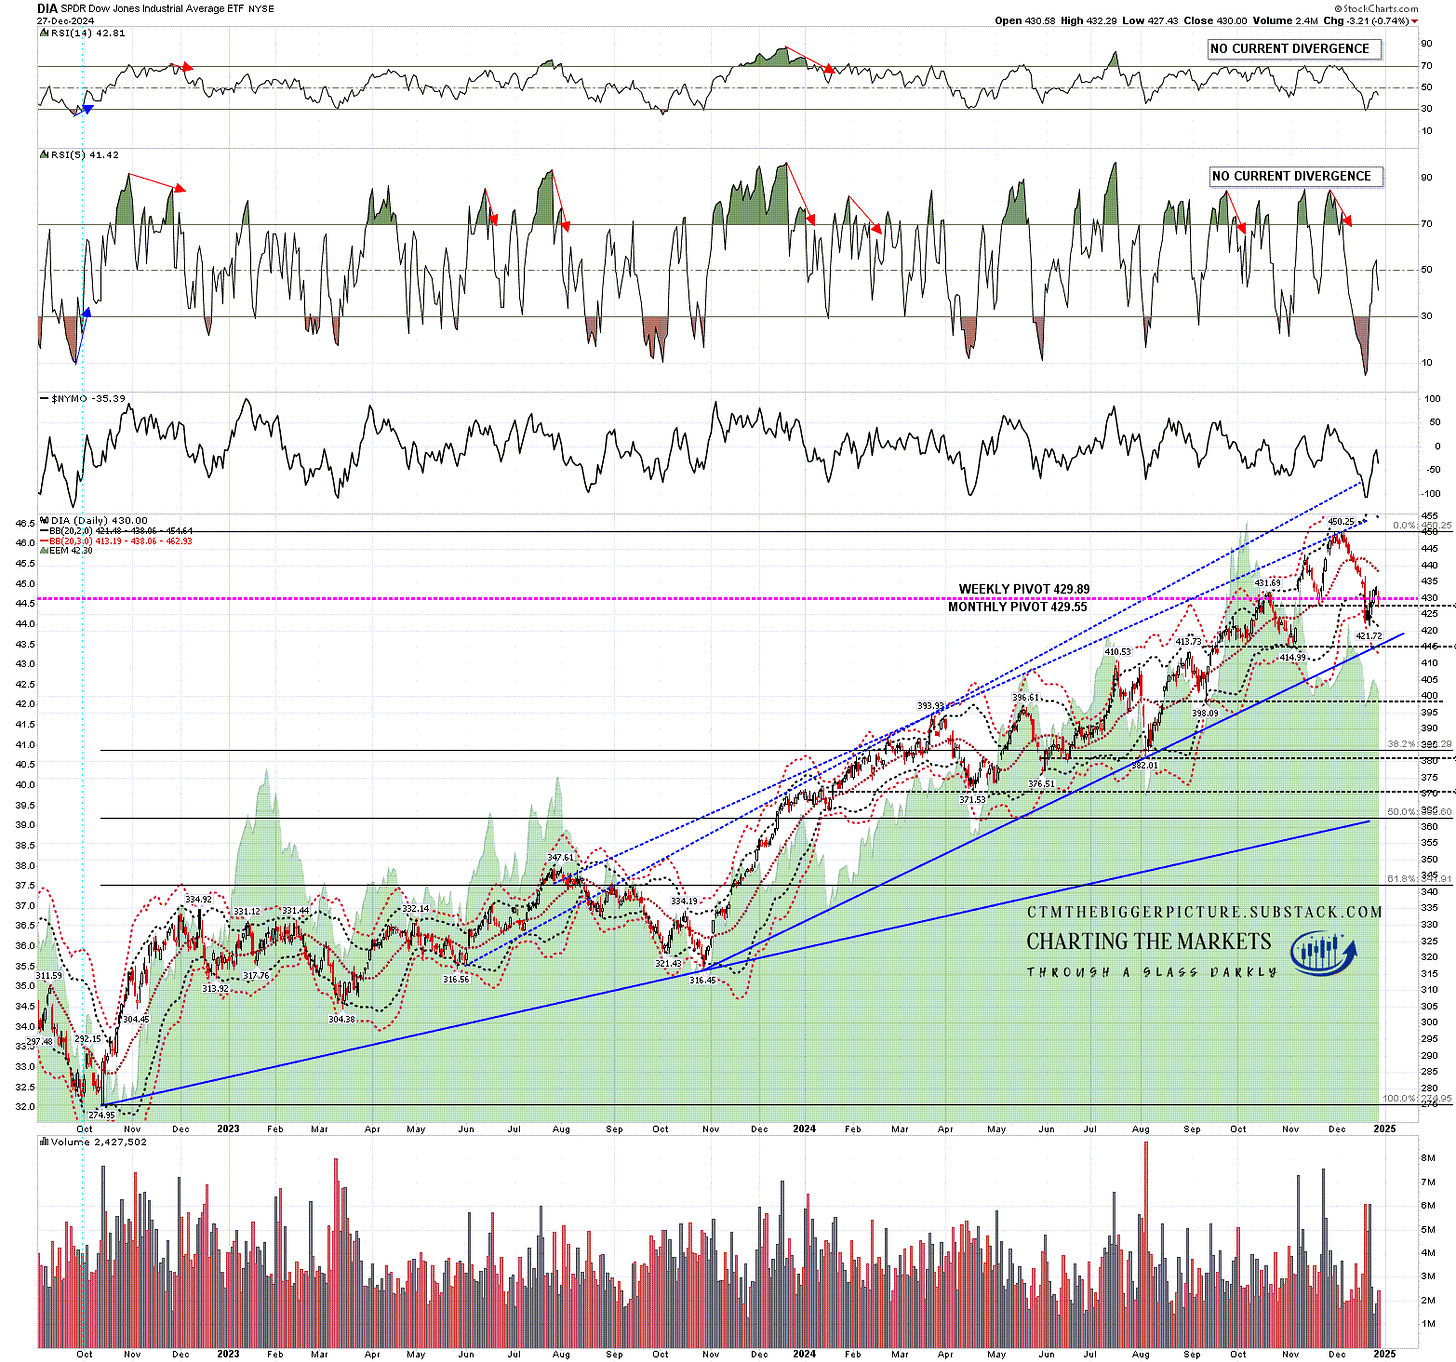
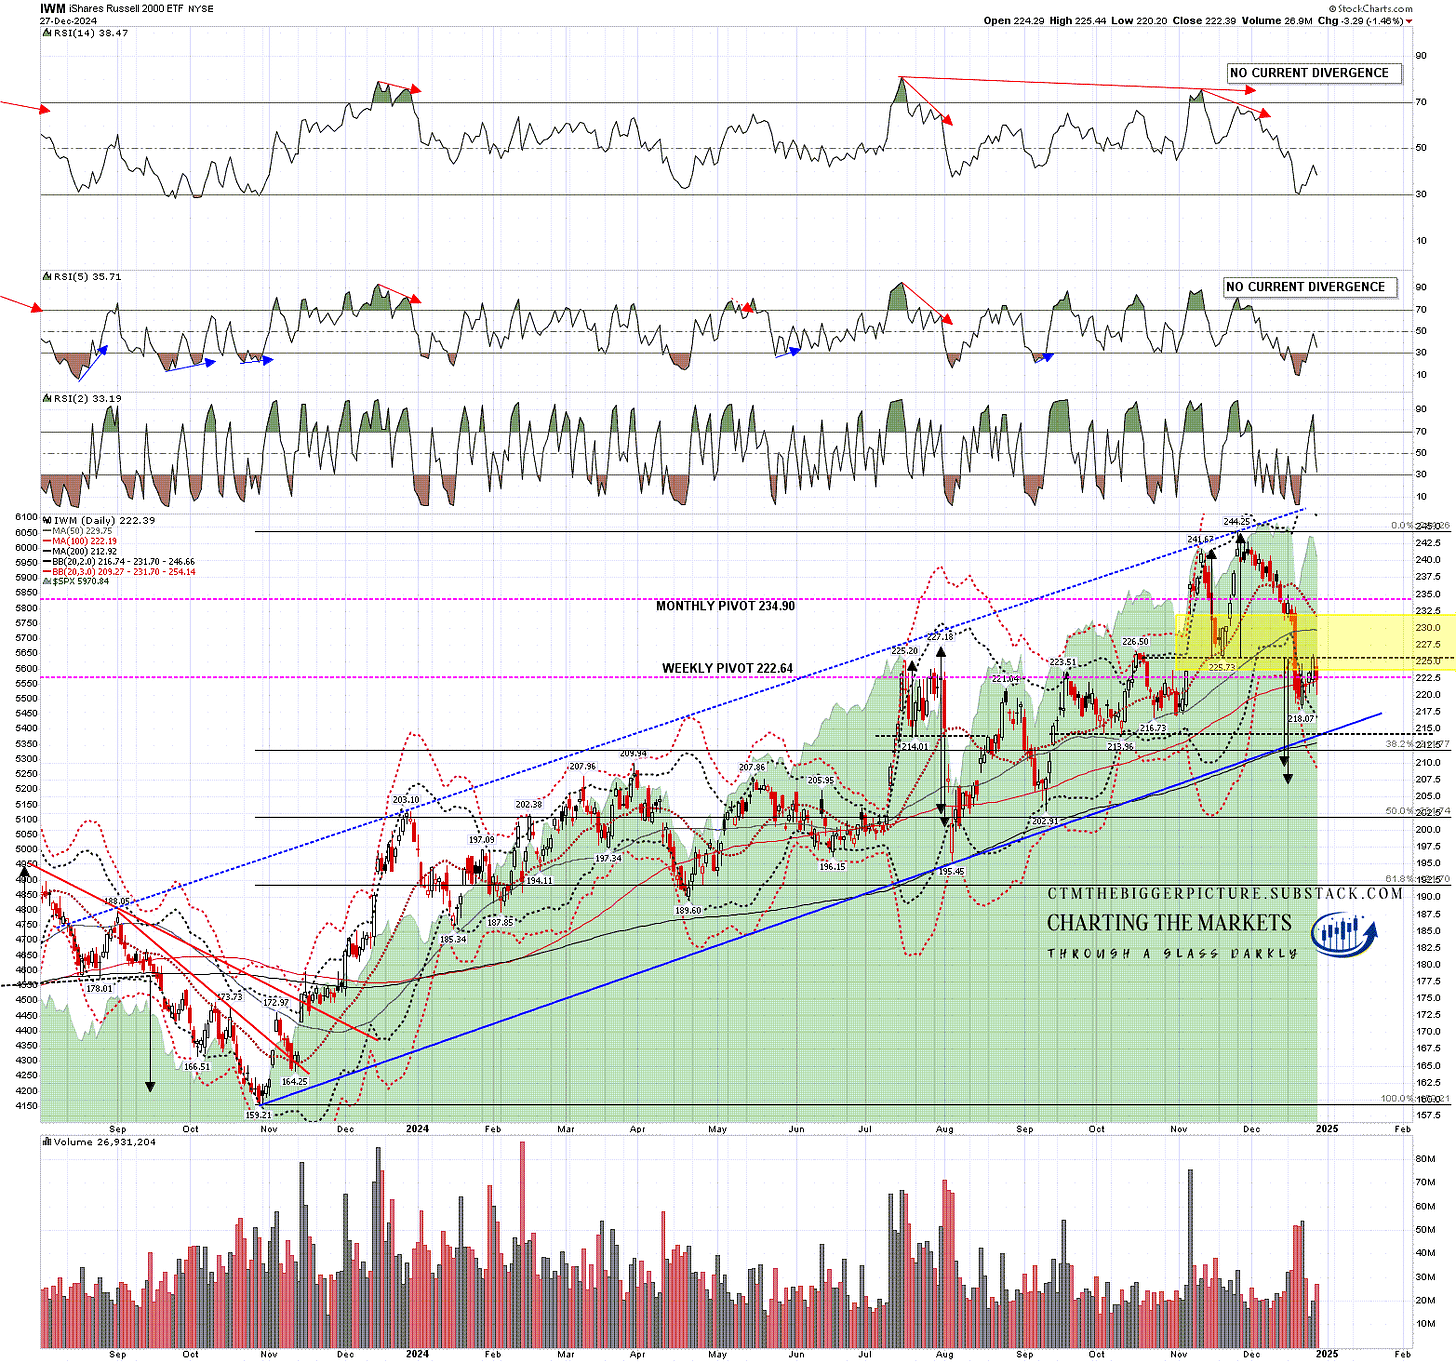
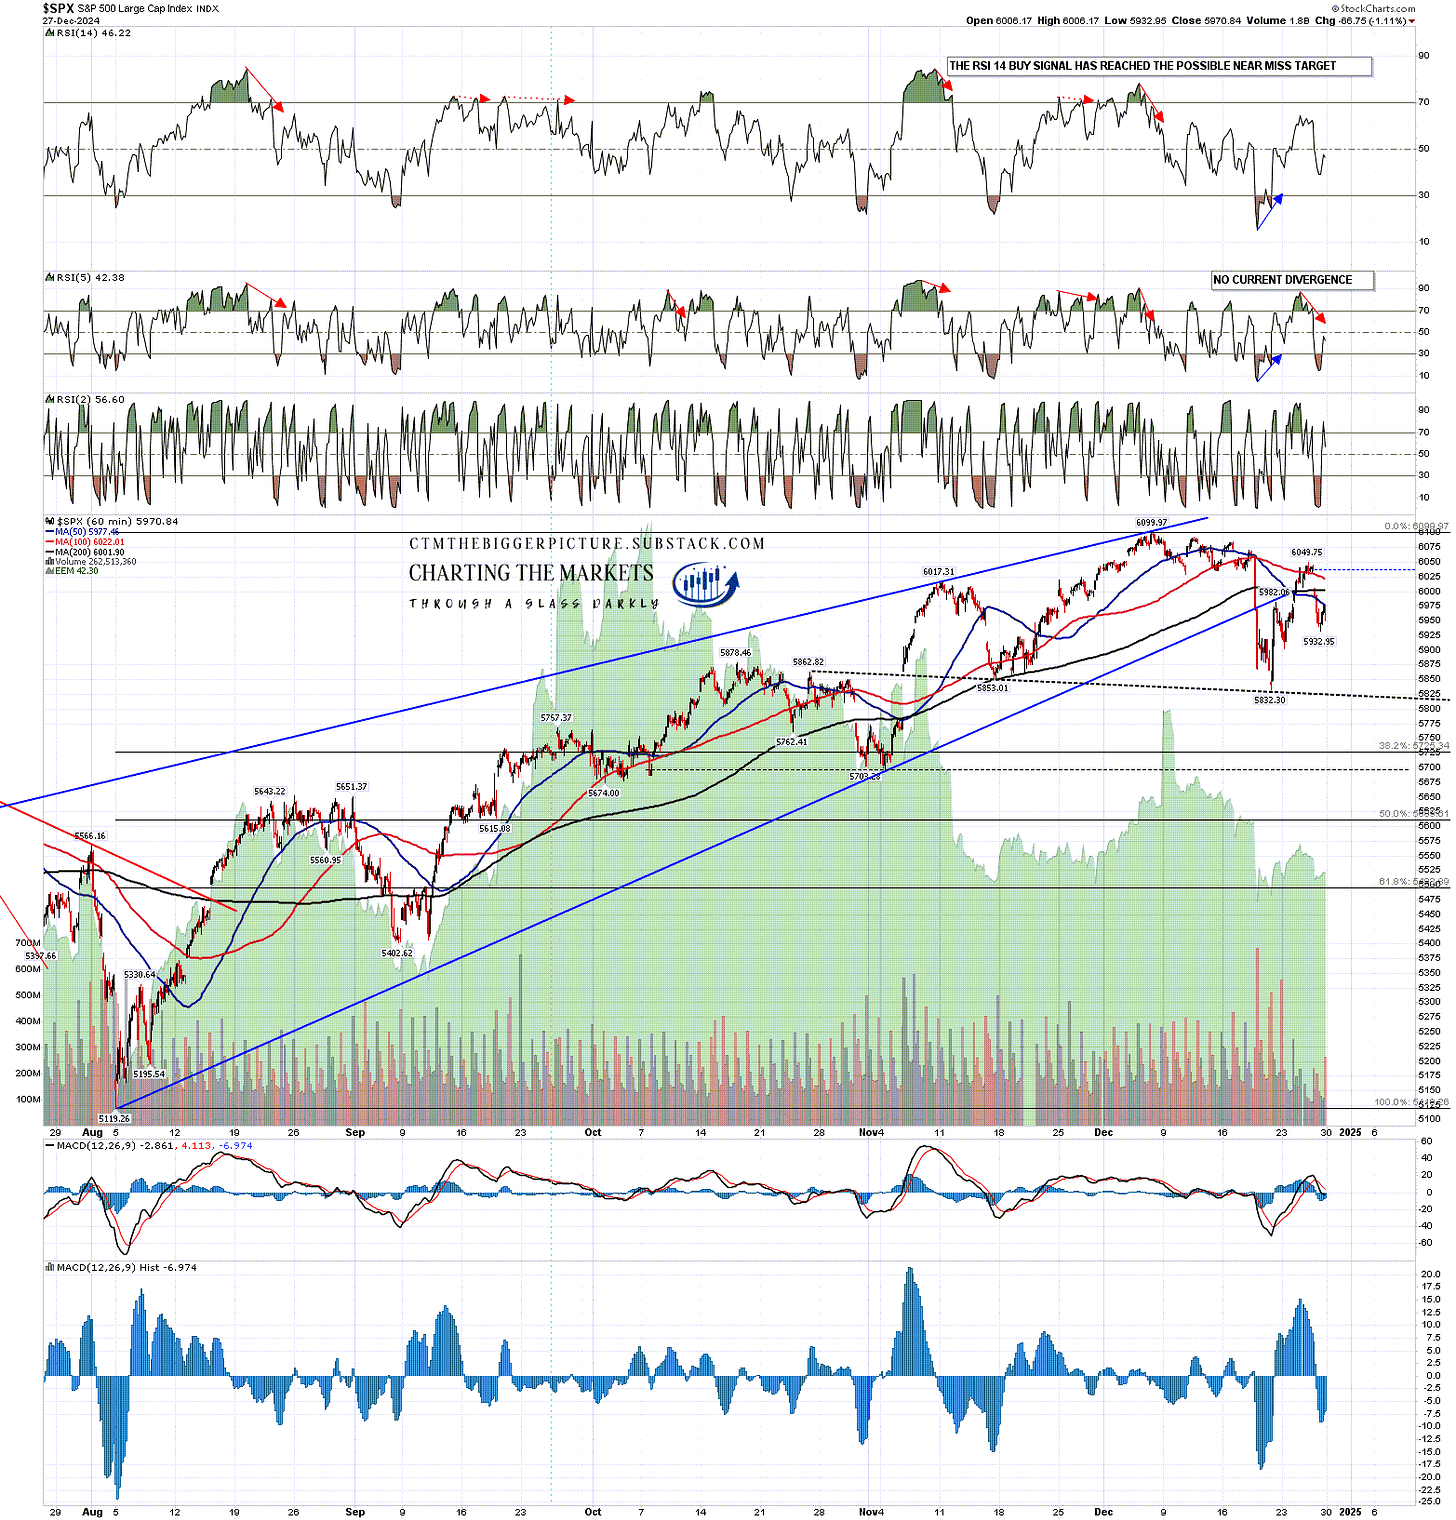
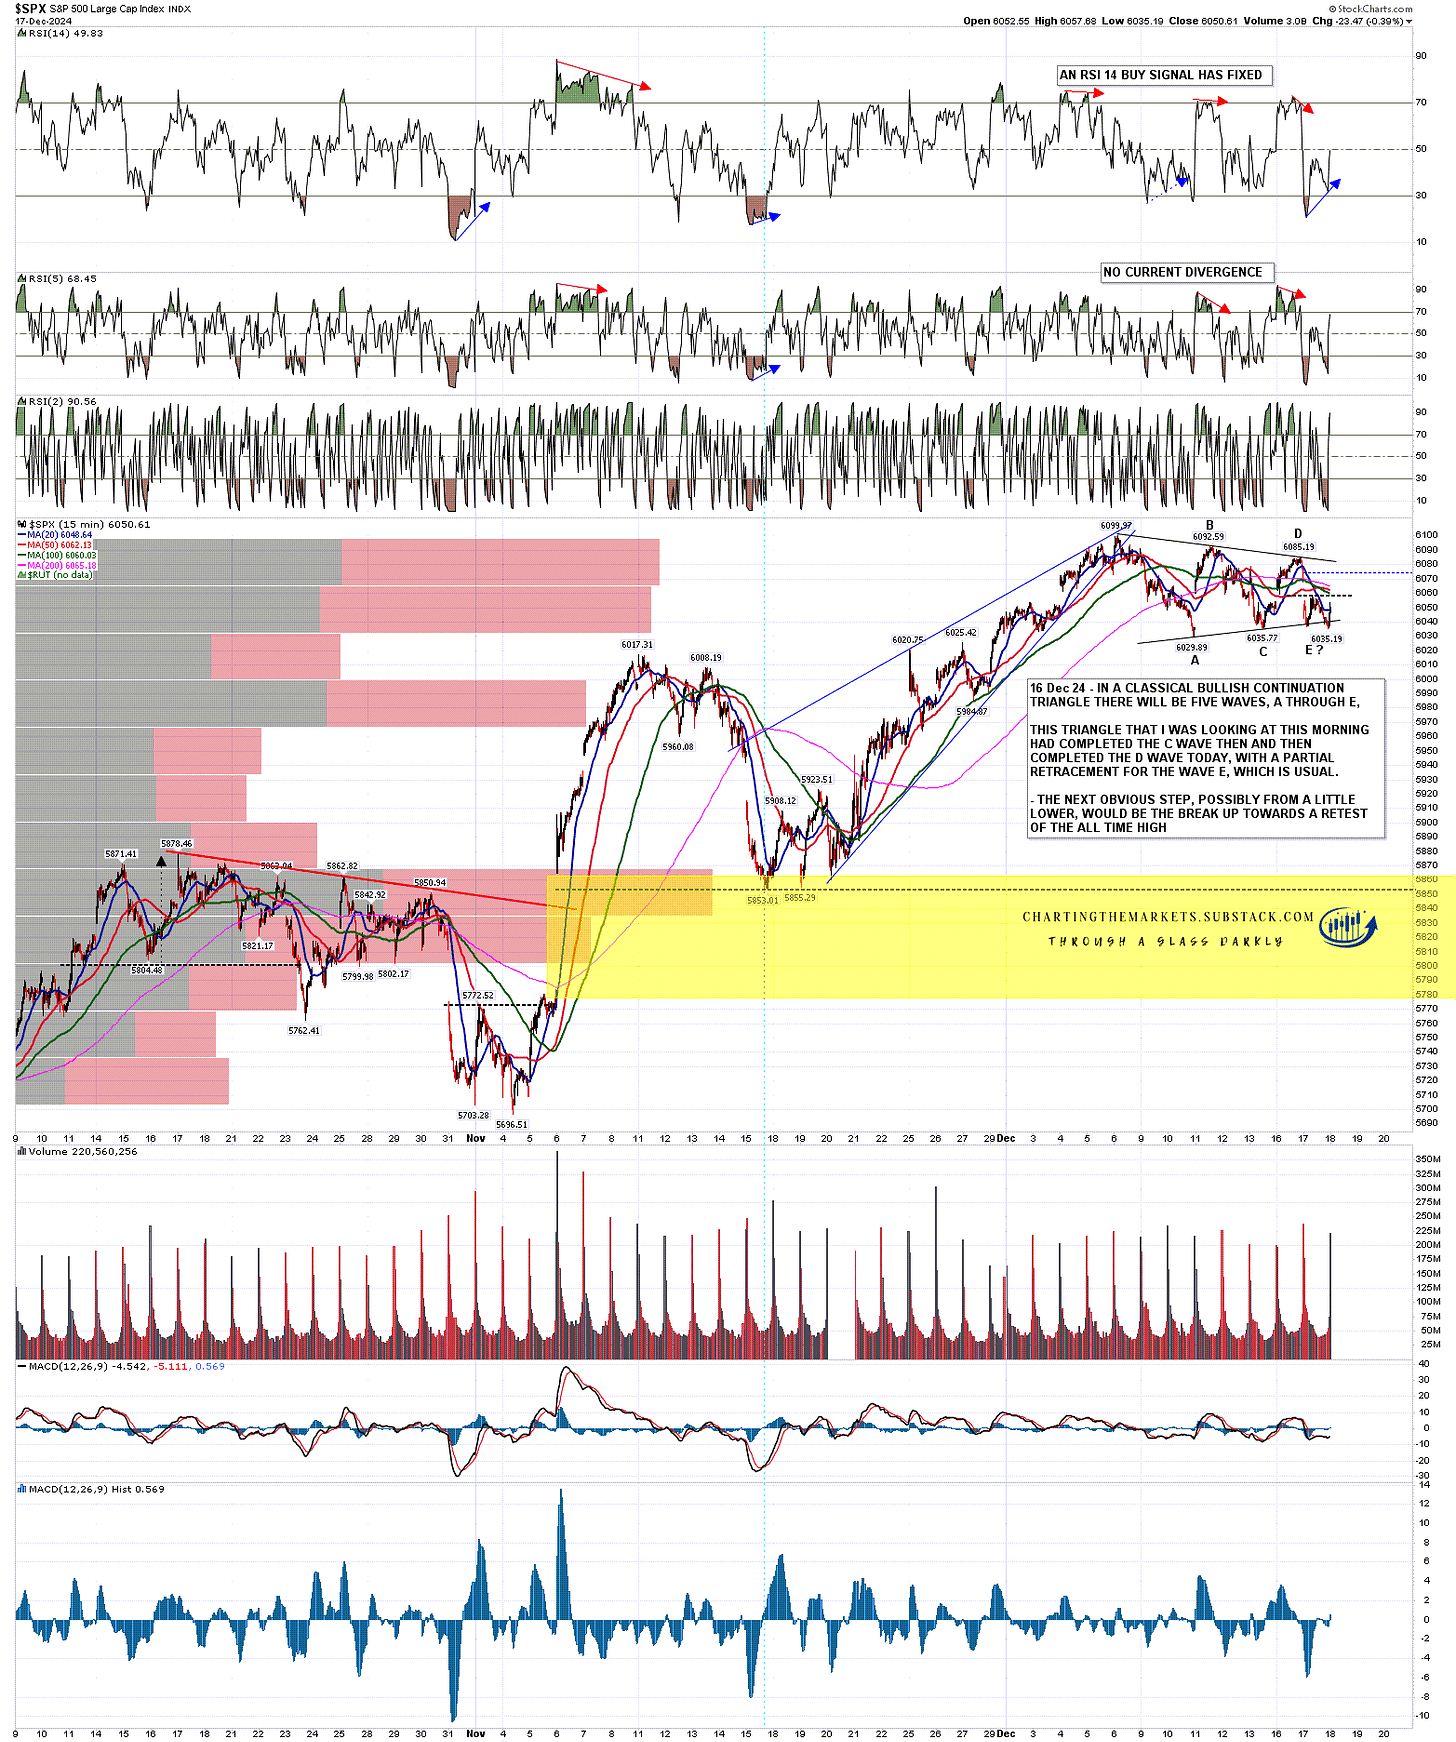
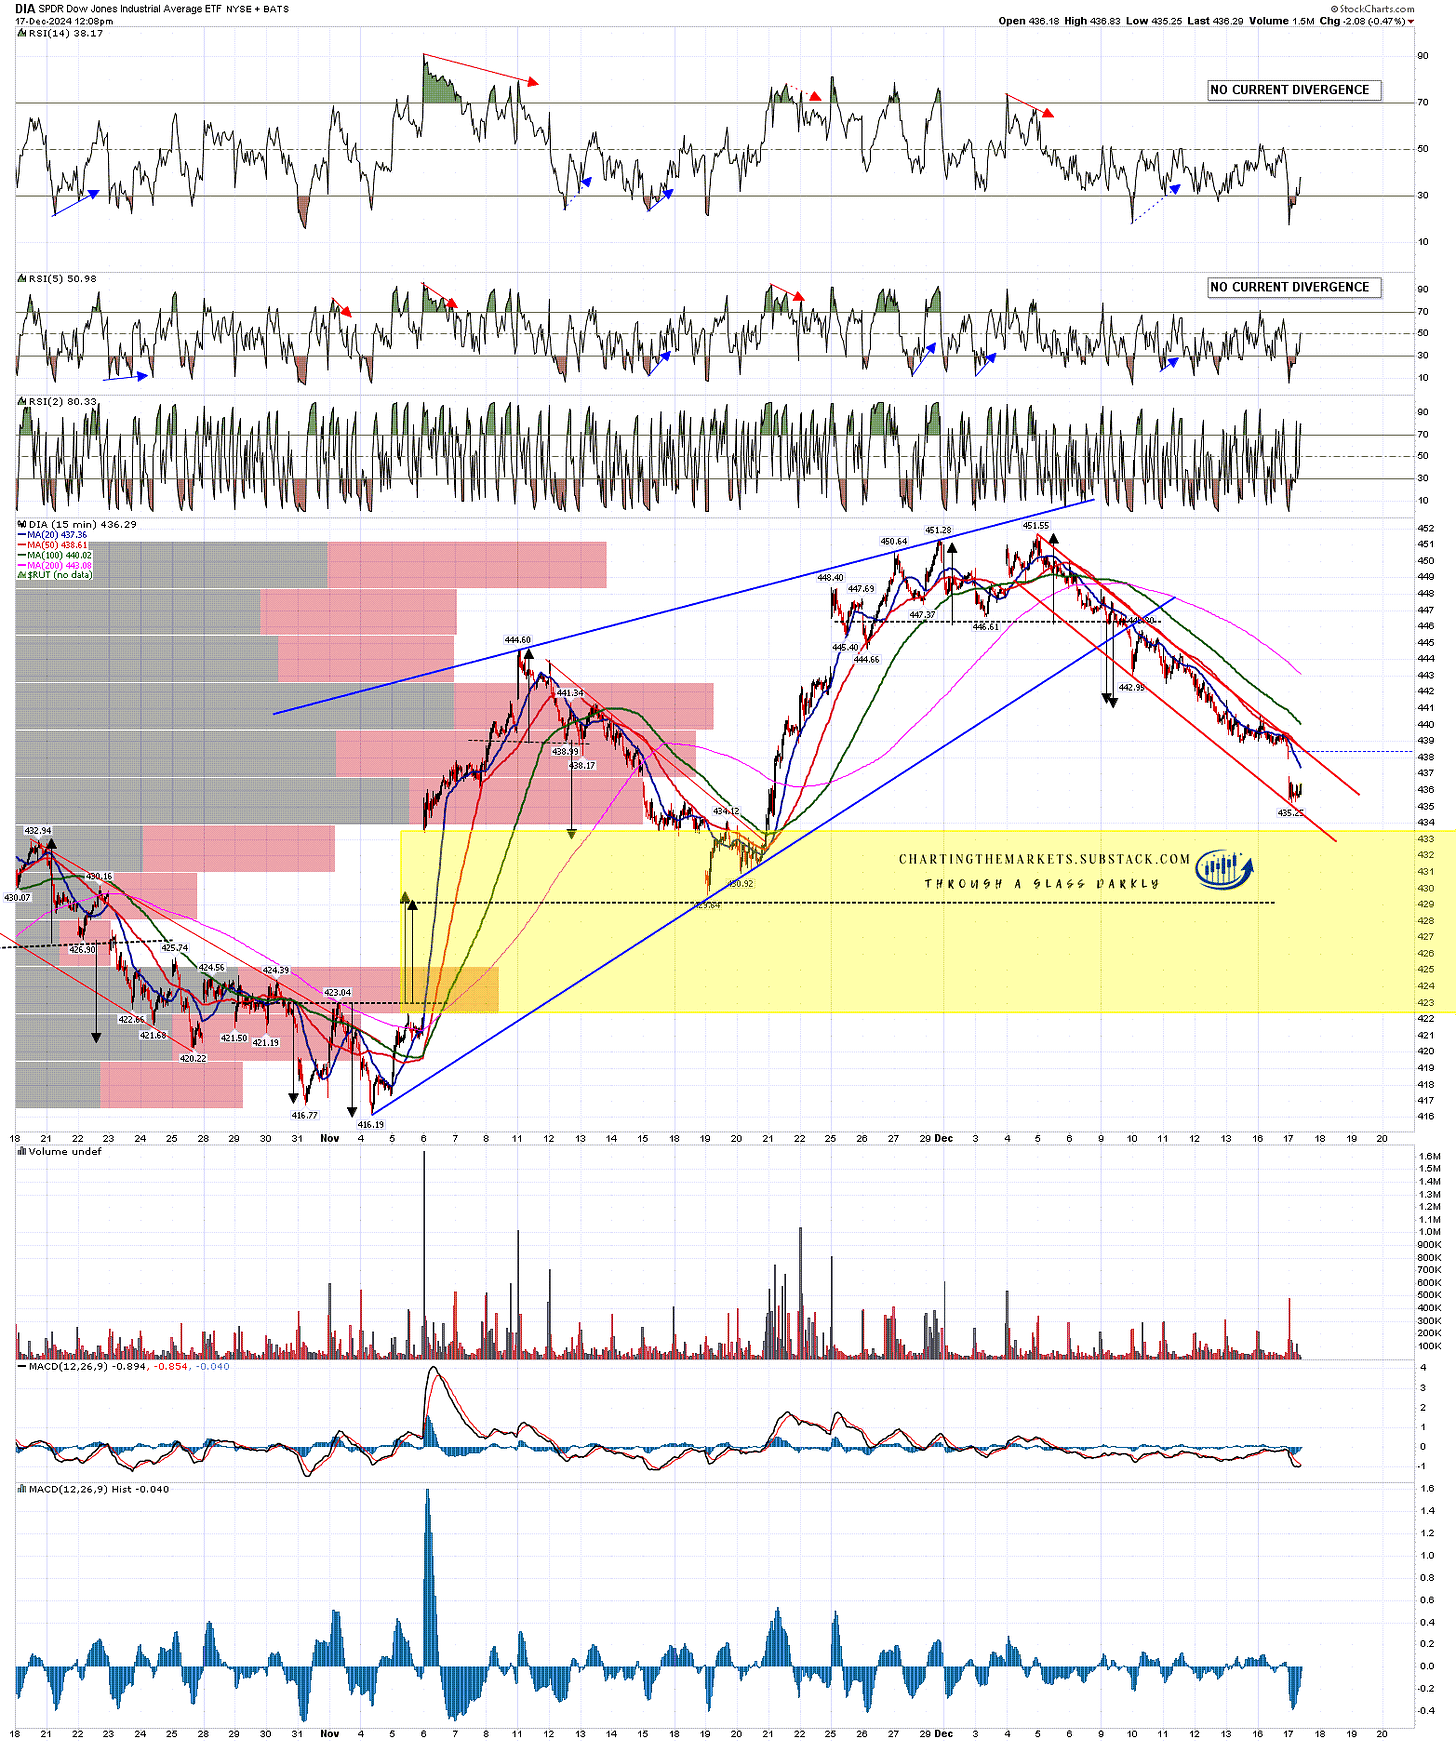
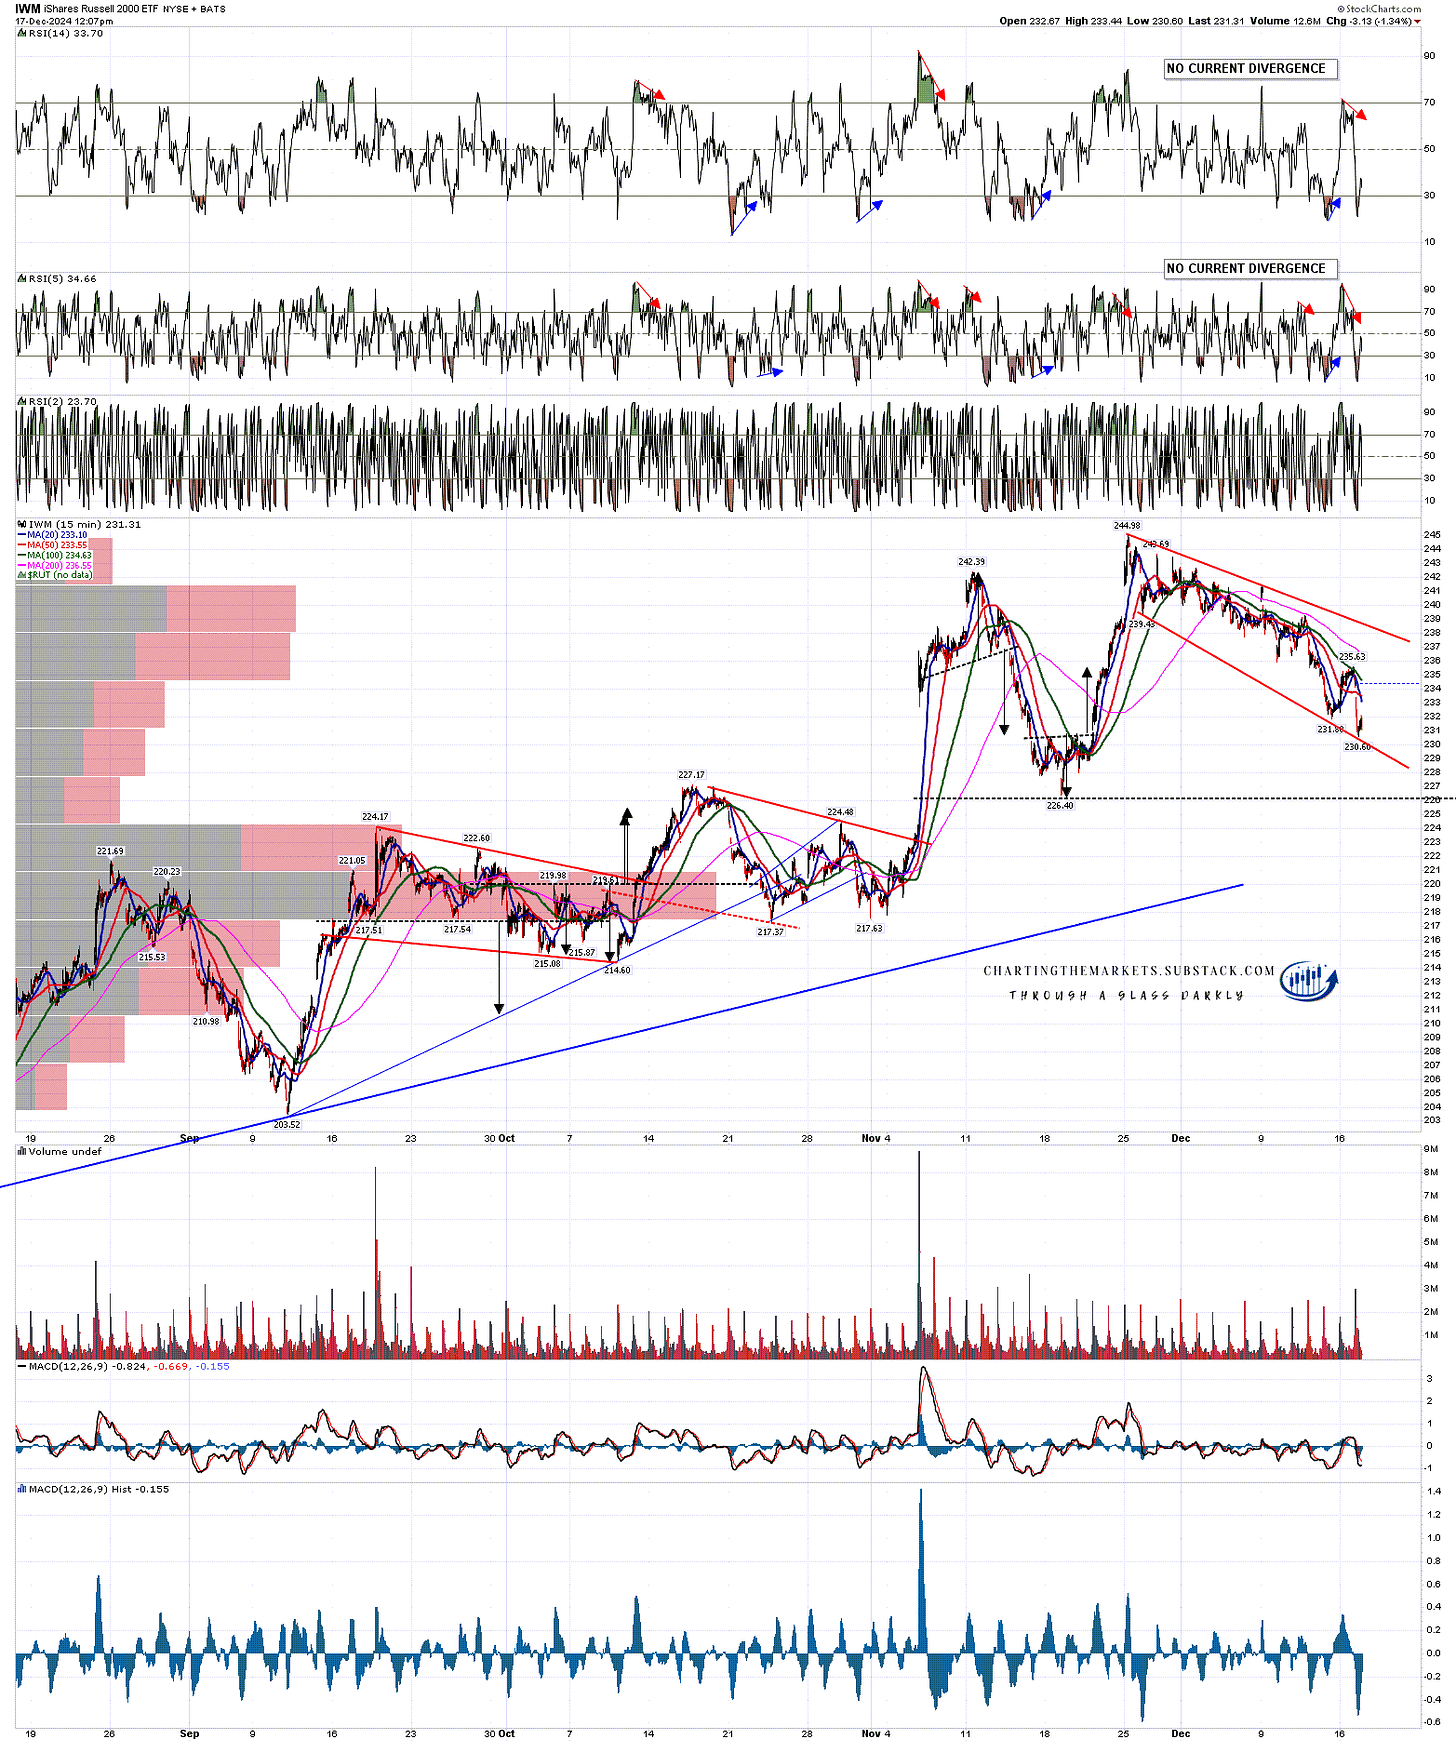
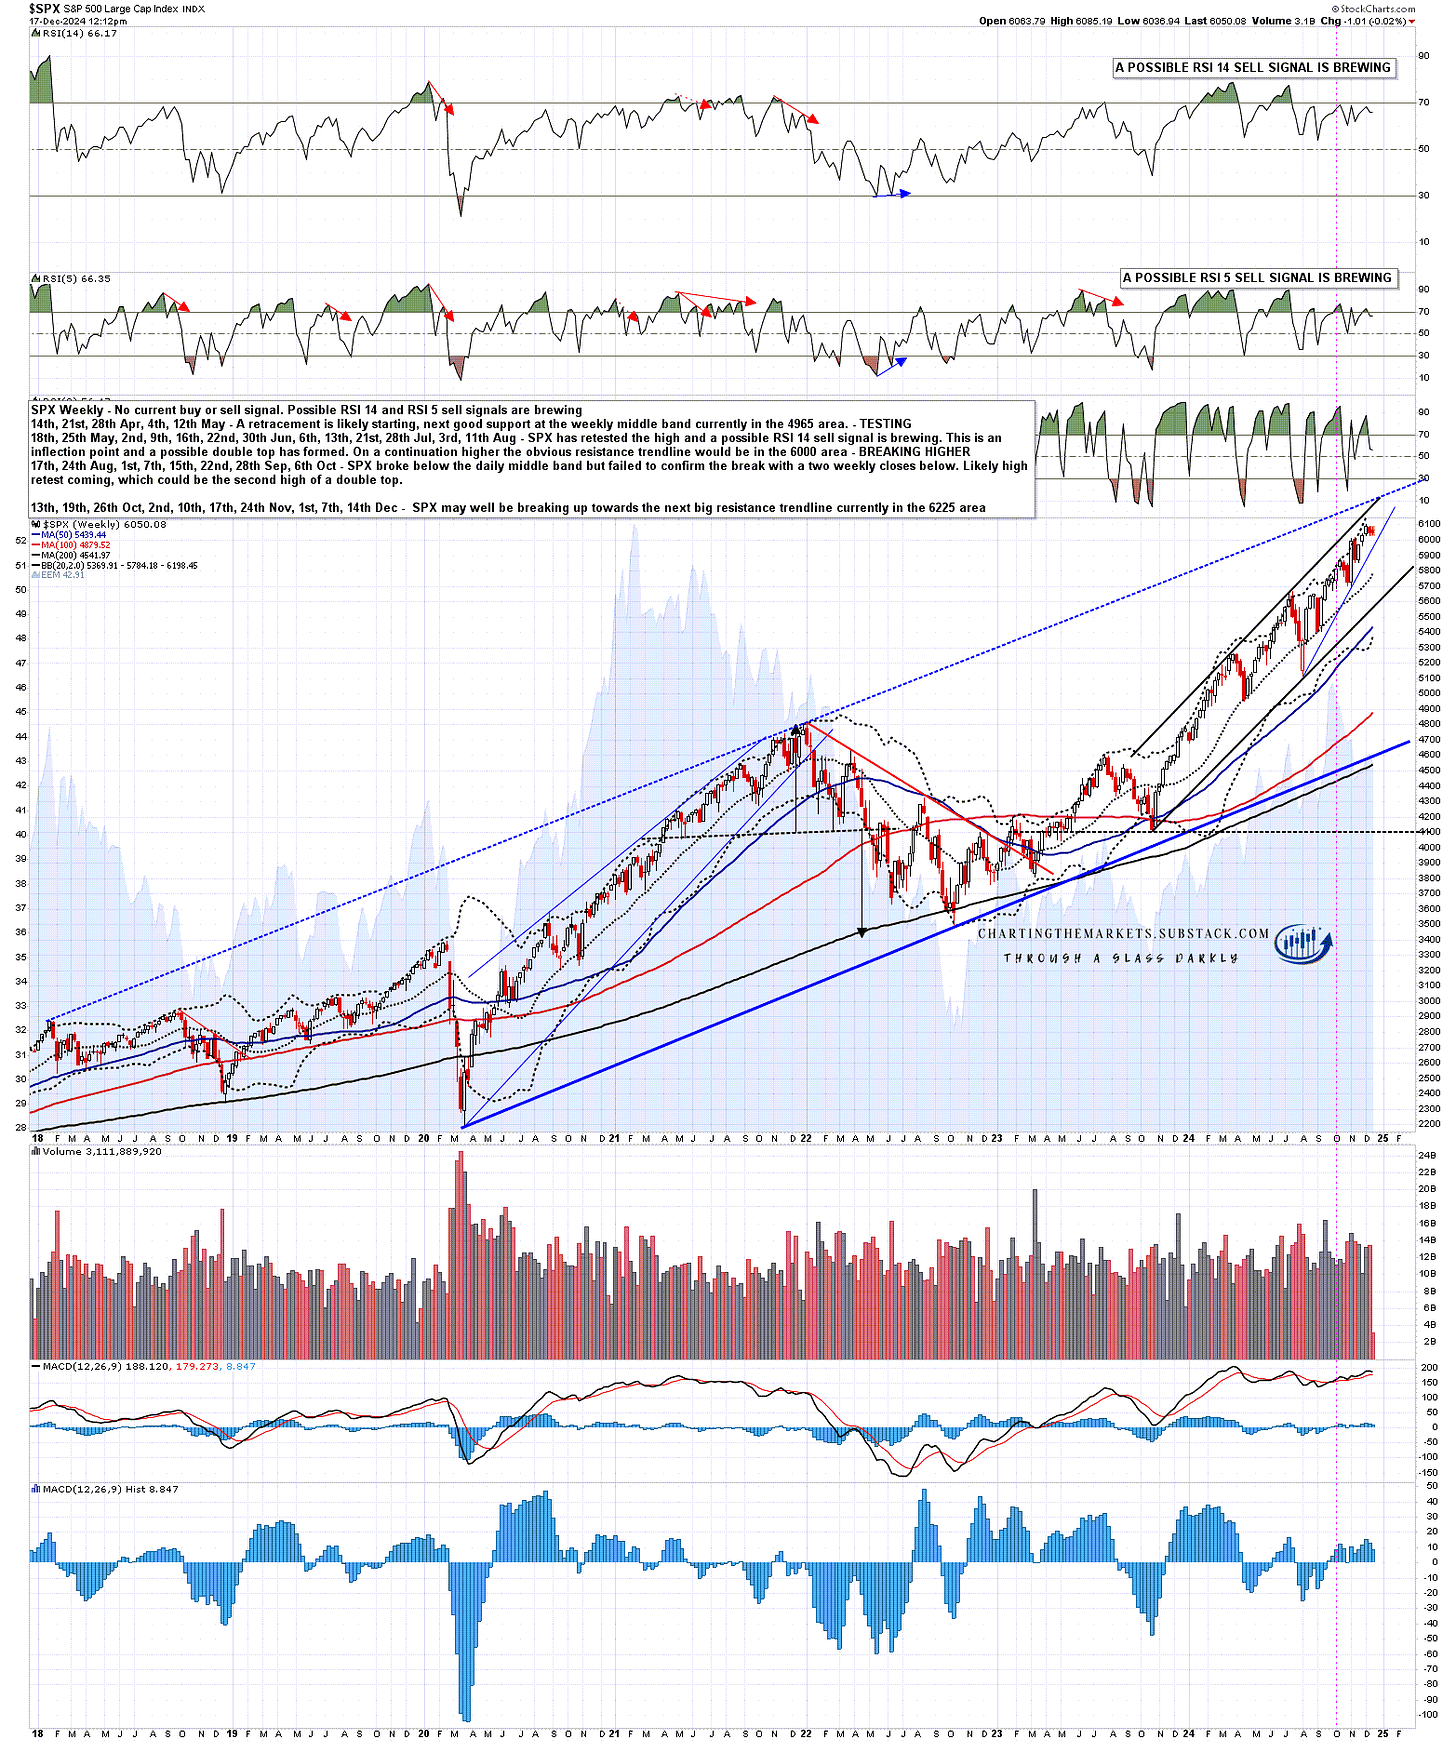
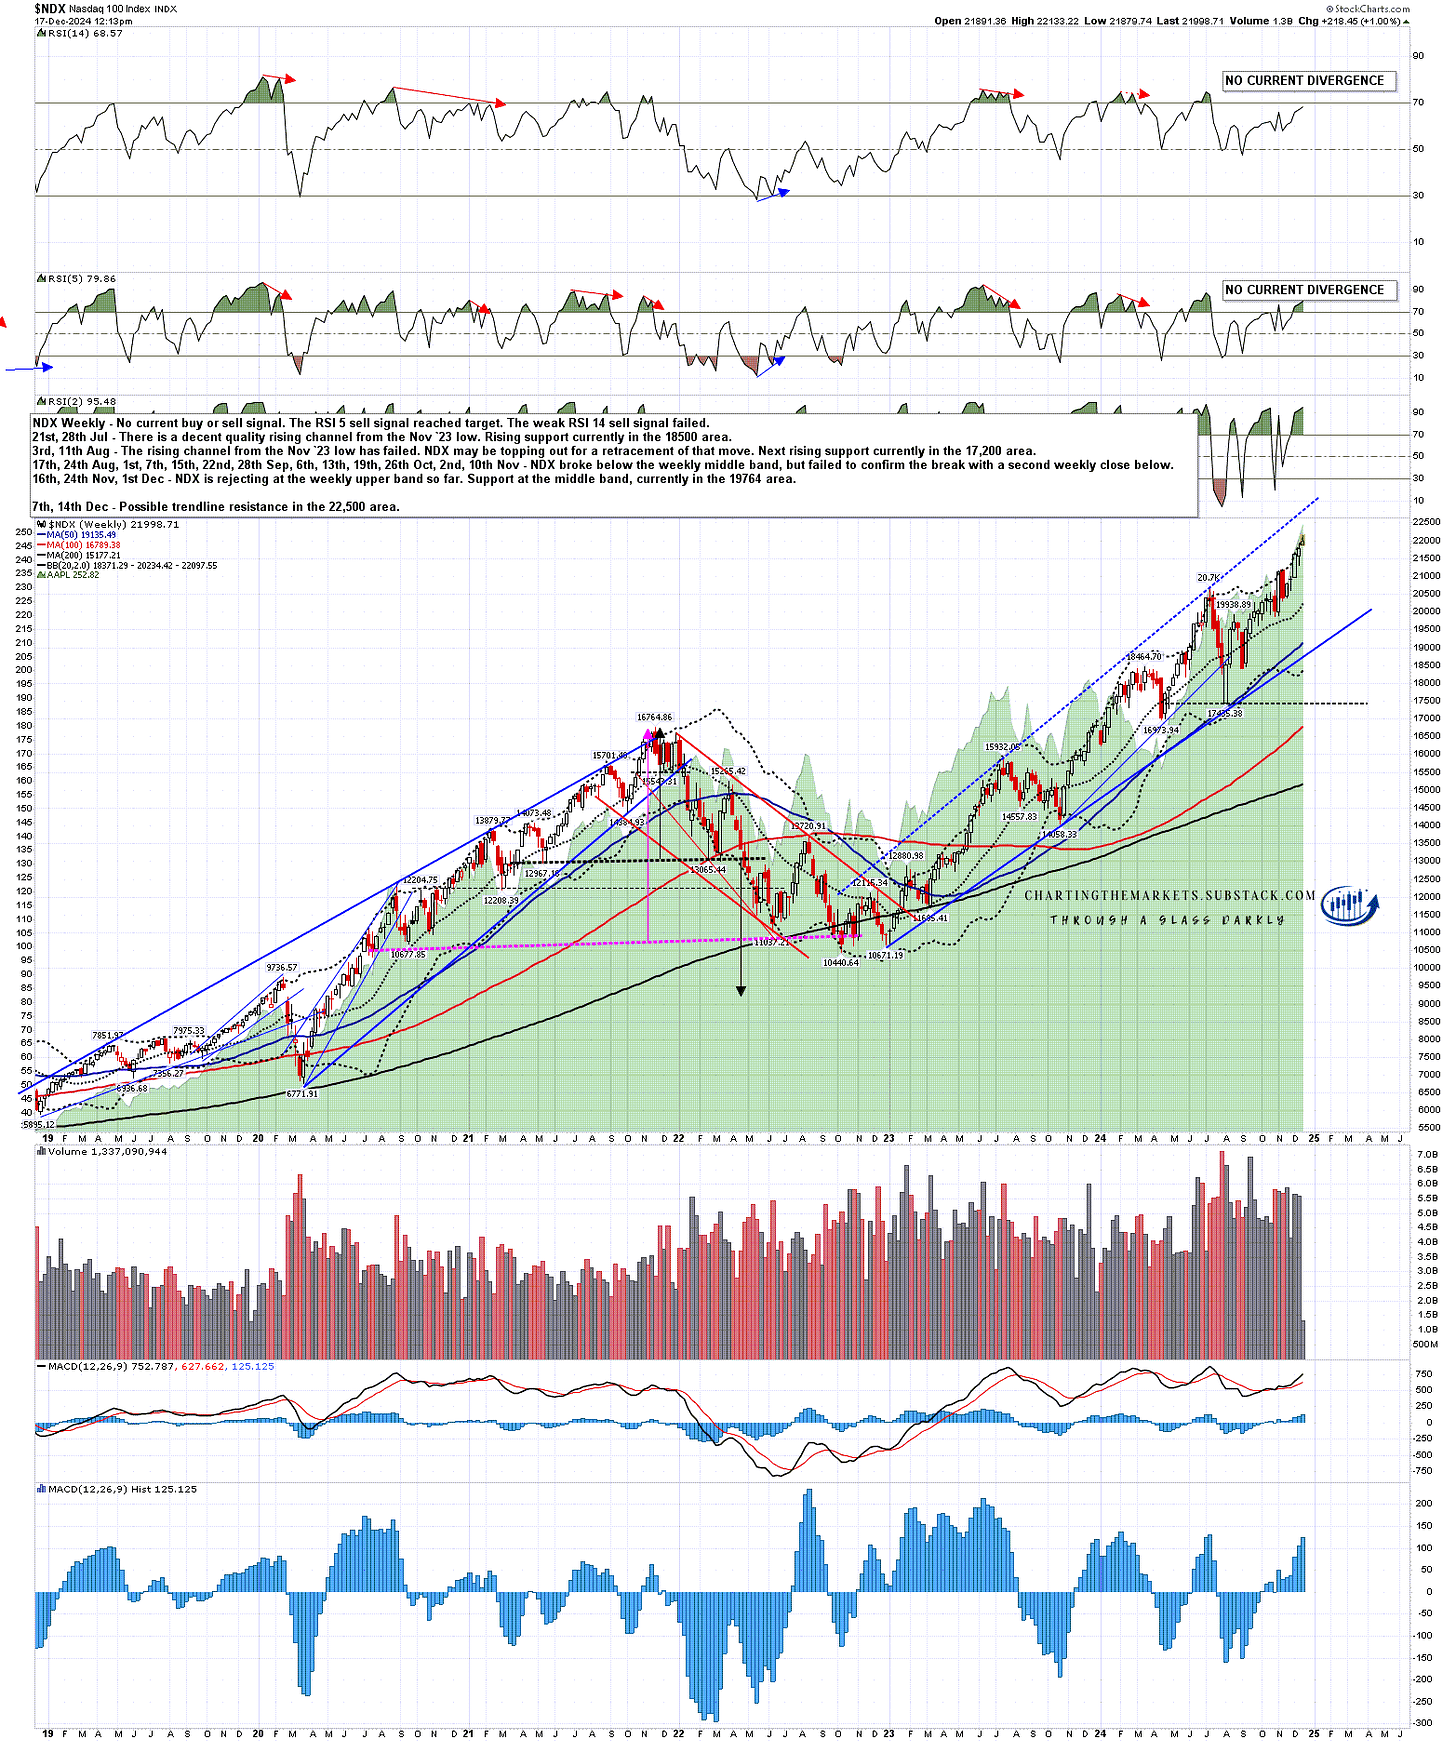
- WE'RE JUST RANDOM SPECKS OF DUST IN A TORNADO TO THE MARKETS .......
- CHARTISTS MUST PUT ALL BIAS ASIDE AND LET THE CHARTS DO THE TALKING OR WE'LL SEE ONLY WHAT WE WANT TO SEE
- This blog has a copy of all header posts that I publish anywhere, so that those interested in seeing what my thoughts are on the markets can find them easily.
- I will be answering questions and responding to comments, so feel free to respond to any posts and I will see your comment even if it is not on the most recent post.
- If you're interested in seeing any intraday charts I post, I do that on twitter, and my twitter handle is @shjackcharts.
- The charts in the posts are as large as I can practically make them. if you would like to look at one more closely, click on it, and the link will take you to a larger version at screencast. If you click on that again, you will get a full page version, and can use the resizing function on your browser to enlarge parts of interest further.

Wednesday, 18 December 2024

Waiting For The Worms

In my post yesterday I was looking at the possible bull flag setups on SPX, DIA and IWM, and today of course we have FOMC.

Those flags all ended yesterday on an encouraging note but overall this very much looks like an inflection point as we are coming into FOMC and it may well be that FOMC today determines the direction of the break from this.

The Fed is expected to cut rates 0.25% today and everyone seems very certain that will happen. I am assuming that is because the Fed have indicated that will be the case informally as to be honest, given the recent inflation and job numbers, and the uncertainty over tariffs next month, they might logically be expected to leave rates unchanged or raise them.

Nonetheless the Fed has a long history of supporting equity bulls and while in theory the Fed Chairs have spines, the historical evidence in recent decades for the existence of those spines isn’t compelling. I’m assigning an 80% probability that they cut rates today and that the equity indices react positively to that.

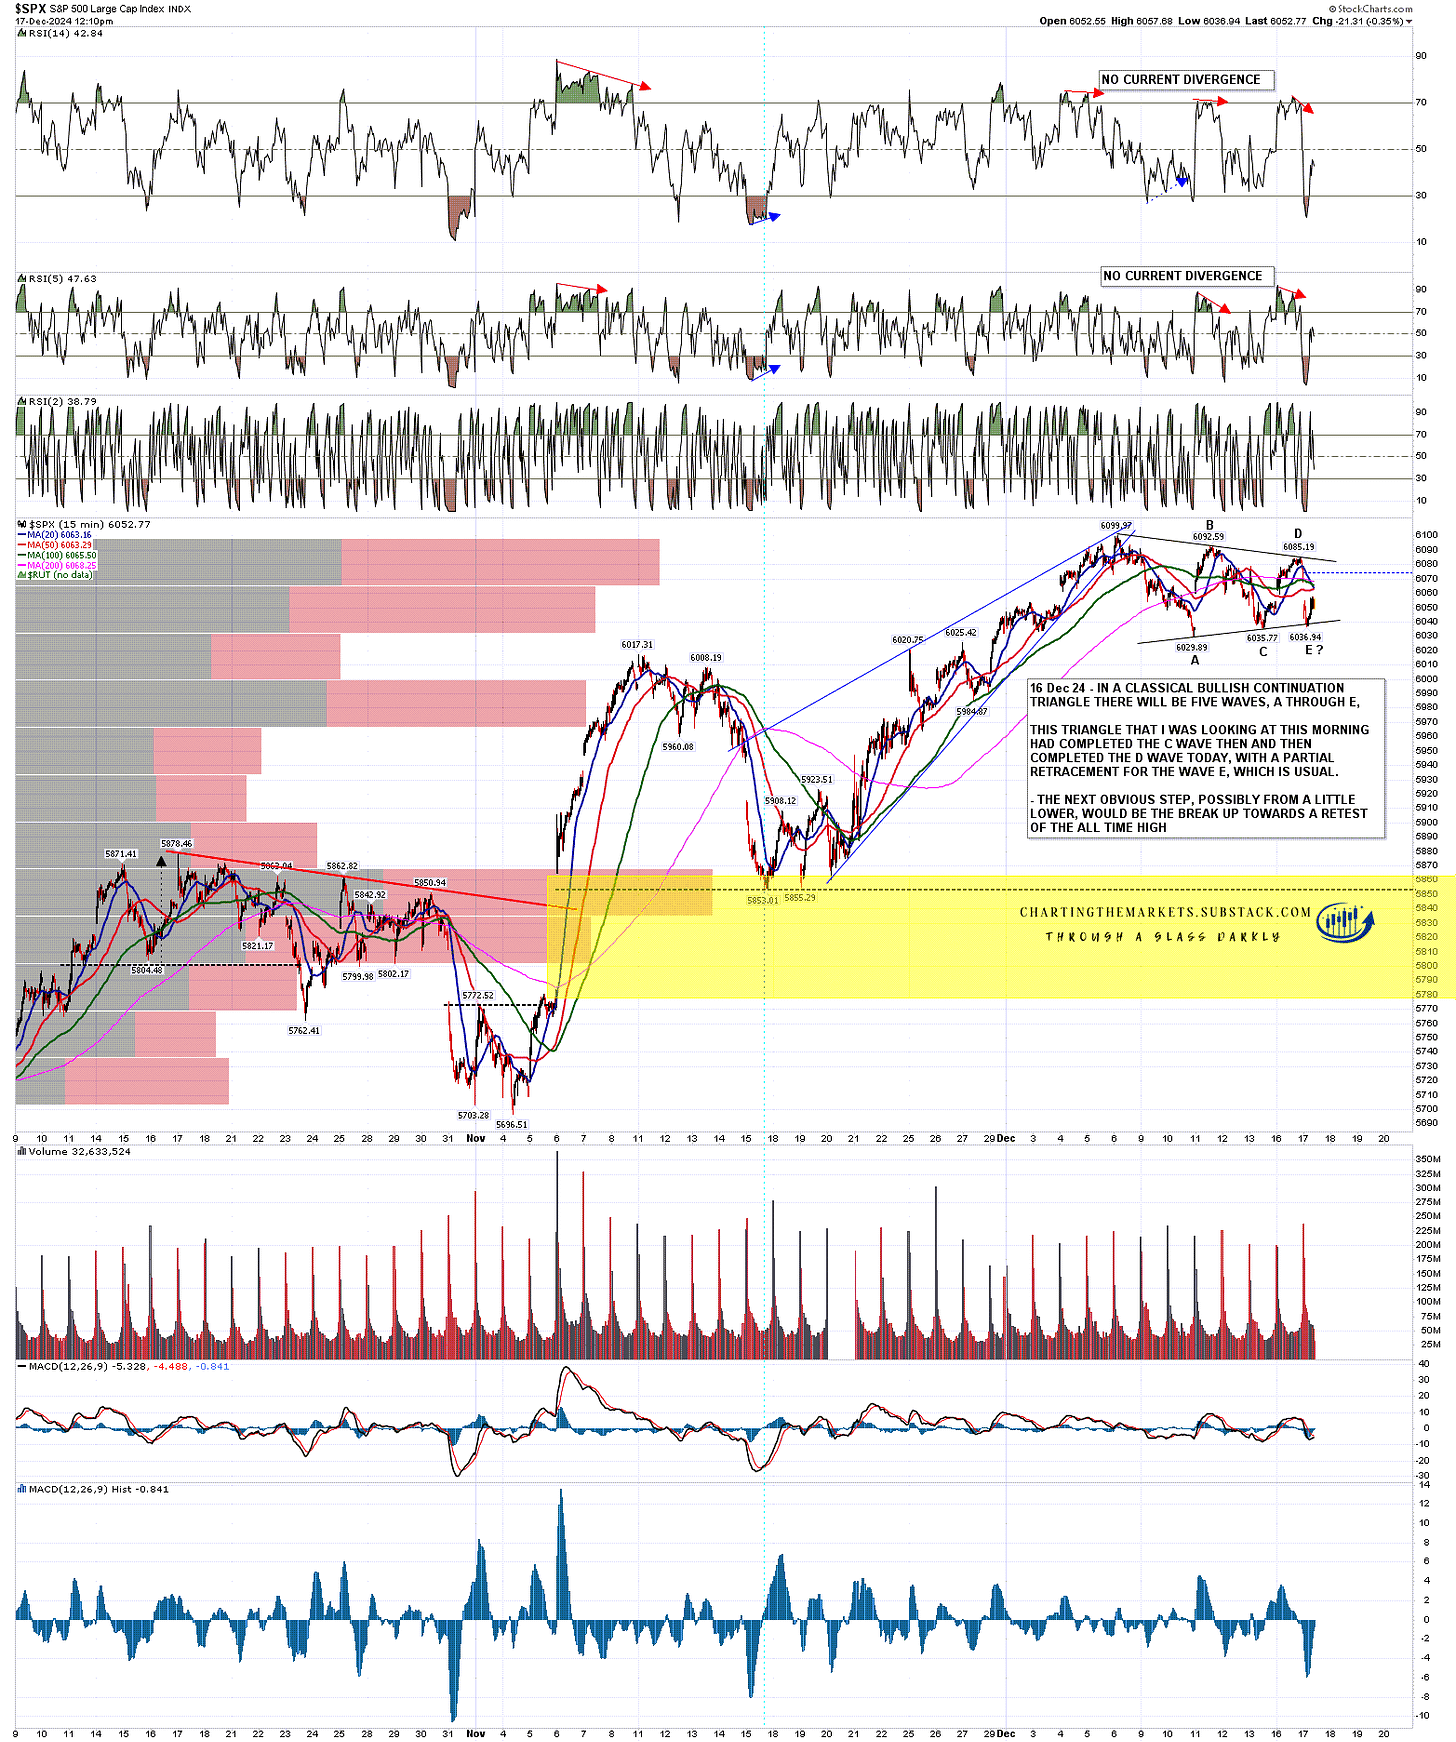
On SPX my triangle support was broken briefly twice yesterday but that formed a small double bottom looking for the triangle resistance area and a 15min RSI 14 buy signal was fixed at the close.

SPX 15min chart:

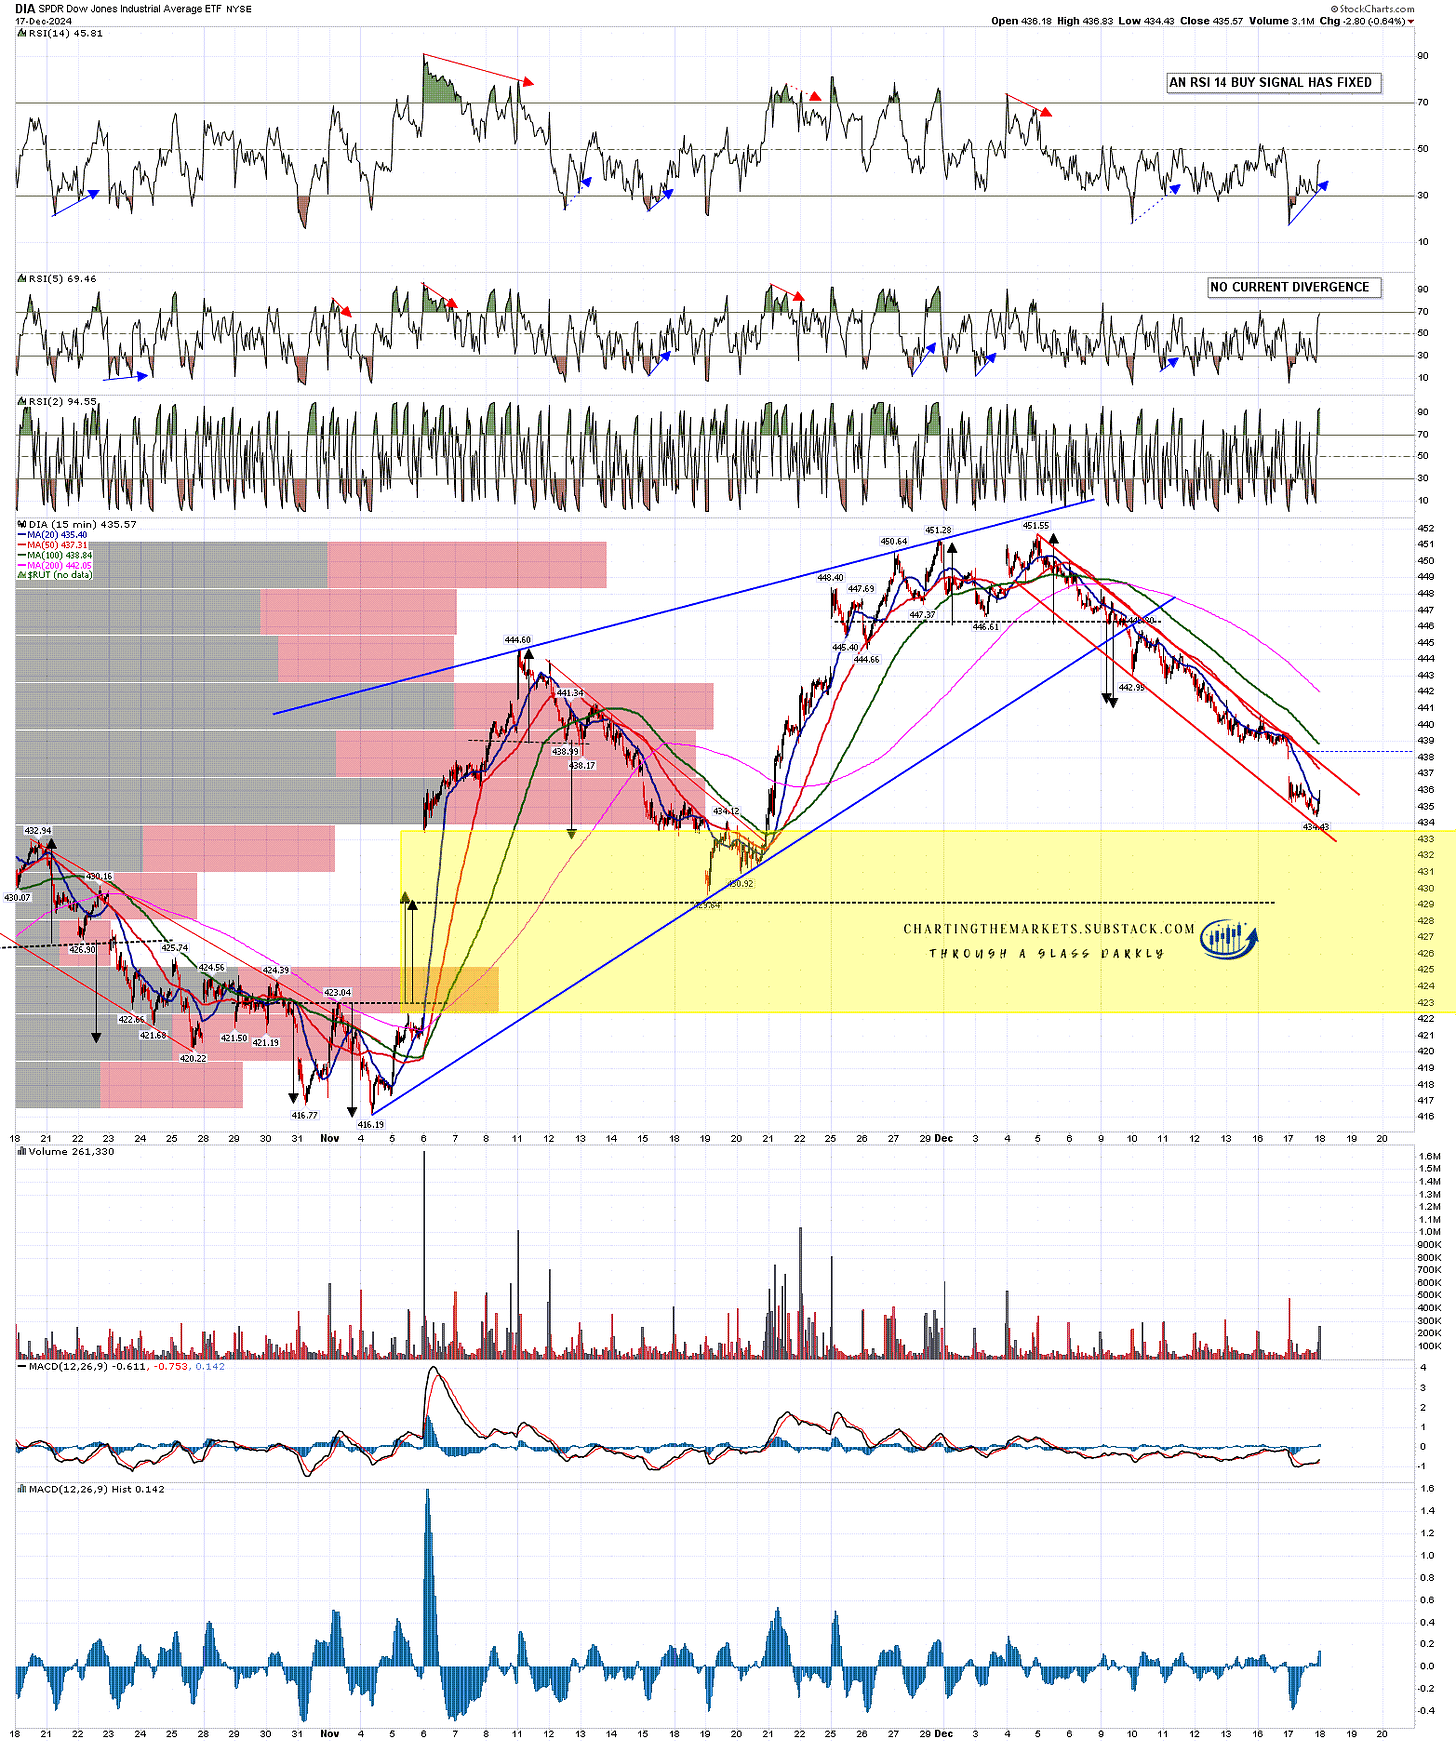
On Dow the possible bull flag falling channel still looks good and there was another 15min RSI 14 buy signal fixed at the close.

DIA 15min chart:

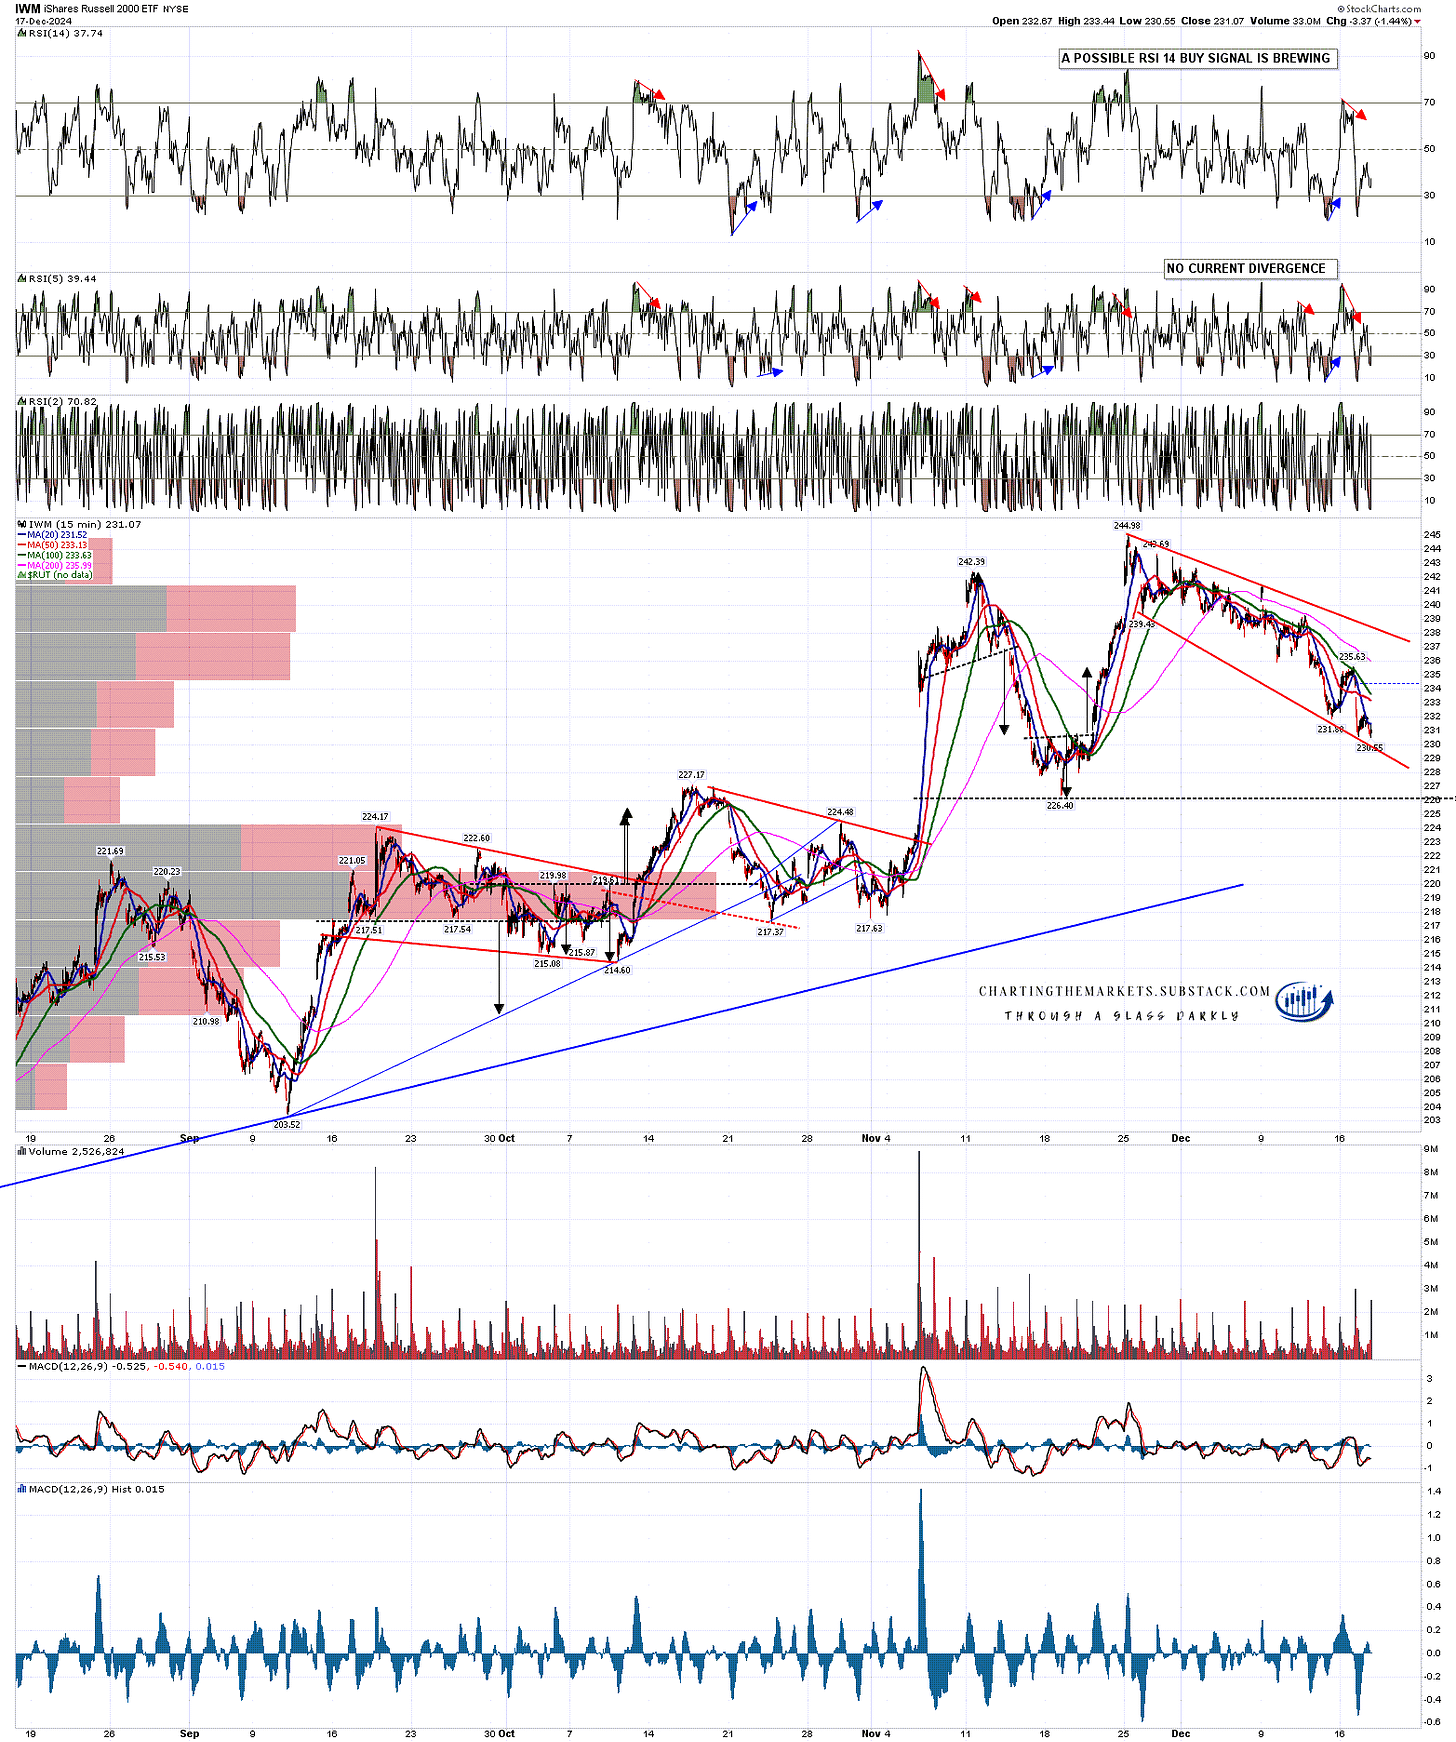
On IWM the possible bull flag falling megaphone again was looking good at the close.

IWM 15min chart:

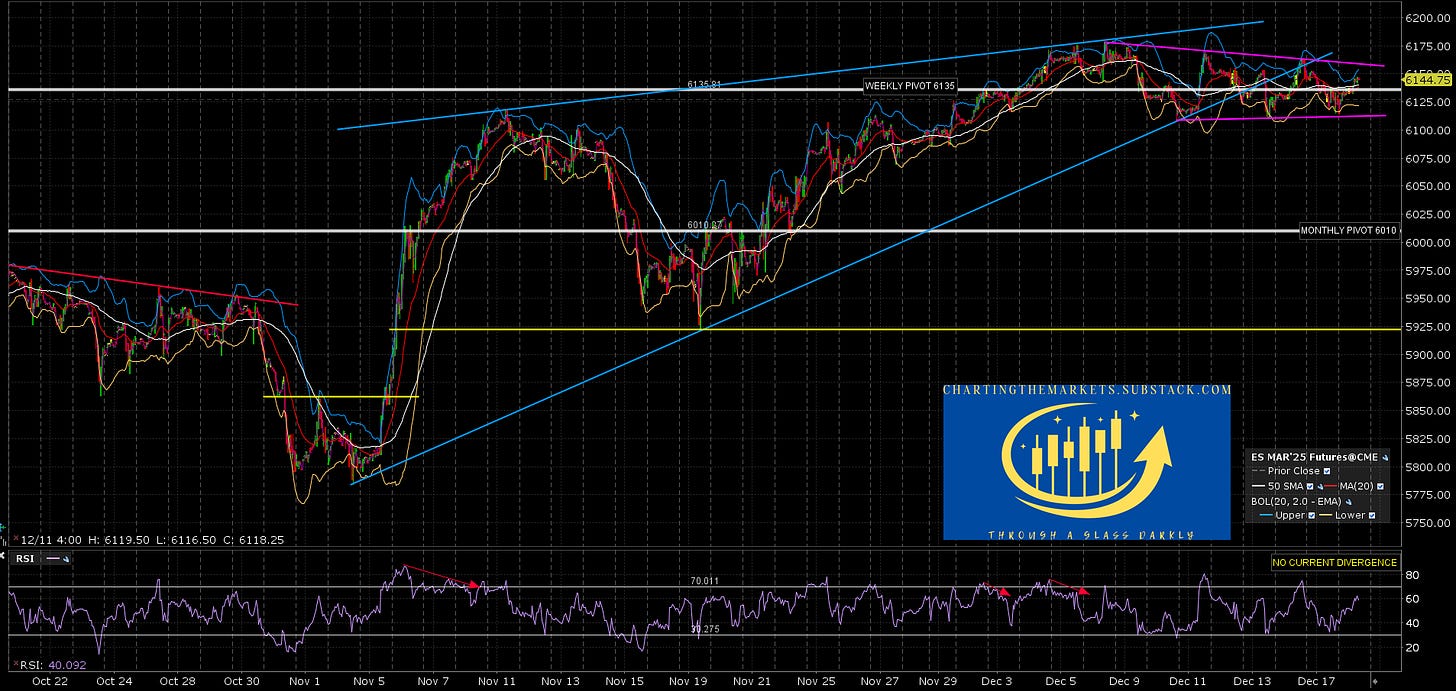
Looking at the overnight action on ES and the setup there the small double bottom formed that mirrors the one on SPX has broken up overnight so, at the moment, a test of triangle resistance on both today looks likely.

ES Mar 60min chart::

I’m hoping to see more upside on US indices, maybe into Xmas and, if not, then likely into January, though there should be a larger retracement in that period somewhere and that could be starting here.

The closer we come to inauguration the more I’m also going to be looking at the incoming administration and the policies that are being talked about for the first 100 days of the new administration. Tariffs, Ukraine and others may make this one of the most interesting years on the markets that anyone can remember.

Presidential election years tend to be bullish historically, the years after not so much, and equity indices are up a lot over the last two years. I am doubtful about equity markets seeing much upside next year as valuations look very stretched going into a year where the news stream is likely to be turbulent, and interest rates may be on an upward track all year. We'll see.

If you like my analysis and would like to see more, please take a free subscription at my chartingthemarkets substack, where I publish these posts first.

I also do a premarket video every day on equity indices, bonds, currencies, energies, precious commodities and other commodities at 8.45am EST. If you’d like to see those I post the links every morning on my twitter, and the videos are posted shortly afterwards on my Youtube channel.

Tuesday, 17 December 2024

Still Searching For Santa

In my last post on Friday I was looking at the support breaks on Dow & Russell and considering the wider implications of those. I was also leaning strongly towards the setup on SPX being a bull flag forming.

Since then a very nice bullish triangle has formed on SPX and, 70% of the time, these will break up towards the target, in this case a retest of the all time high at 6099.97. I wrote the comments on the chart when I posted it on my twitter last night and since then SPX has broken slightly below triangle support, which is a concern, but is rallying well from there so far. Assuming this morning’s low holds, the bullish scenario still looks nice.

Charting The Markets Substack is a reader-supported publication. To receive new posts and support my work, consider becoming a free or paid subscriber.

This promising bull setup isn’t alone ………

SPX 15min chart:

On Dow there is now a very nice falling channel, though it is steep and narrow enough that I wouldn’t be surprised to see a rally from here that preceded another leg down. Nonetheless this may be a bull flag channel rather than part of a larger downside pattern.

DIA 15min chart:

The initial bull flag channel on IWM broke down but I now have a decent looking falling megaphone that could also be a bull flag. I’ll be watching this too.

If we see further breaks down from here the picture for the rest of December looks grimmer as the current move up has been mostly tech and I was reading at the weekend that the move up on equity indices since the start of November has been achieved while the majority of index stocks outside NDX have closed down most days.

I’d love to see one more push up into new highs across the board, but we may not see it.

IWM 15min chart:

If we do see a decent move up from here I’m not really looking for much more than high retests on DIA or IWM, but I have more ambitious targets for SPX and NDX, taking them to levels that might then hold as resistance for much or all of next year.

On SPX that target is the obvious resistance trendline for the move up from the 2020 low. That is currently in the 6225 area and, if hit, I’m thinking we might see either a repeat of 2022 as an extended bull flag forms, or a larger high.

SPX weekly chart:

On NDX I am watching possible trendline resistance currently in the 22500, matching the support trendline from the late 2022 low. If seen that might also be a significant high.

NDX weekly chart:

I’m hoping to see more upside on US indices, maybe into Xmas and, if not, then likely into January, though there should be a larger retracement in that period somewhere and that could be starting here.

The closer we come to inauguration the more I’m also going to be looking at the incoming administration and the policies that are being talked about for the first 100 days of the new administration. Tariffs, Ukraine and others may make this one of the most interesting years on the markets that anyone can remember.

Presidential election years tend to be bullish historically, the years after not so much, and equity indices are up a lot over the last two years. I am doubtful about equity markets seeing much upside next year as valuations look very stretched going into a year where the news stream is likely to be turbulent, and interest rates may be on an upward track all year. We'll see.

If you like my analysis and would like to see more, please take a free subscription at my chartingthemarkets substack, where I publish these posts first.

I also do a premarket video every day on equity indices, bonds, currencies, energies, precious commodities and other commodities at 8.45am EST. If you’d like to see those I post the links every morning on my twitter, and the videos are posted shortly afterwards on my Youtube channel.

Monday, 16 December 2024

Waiting For Solana

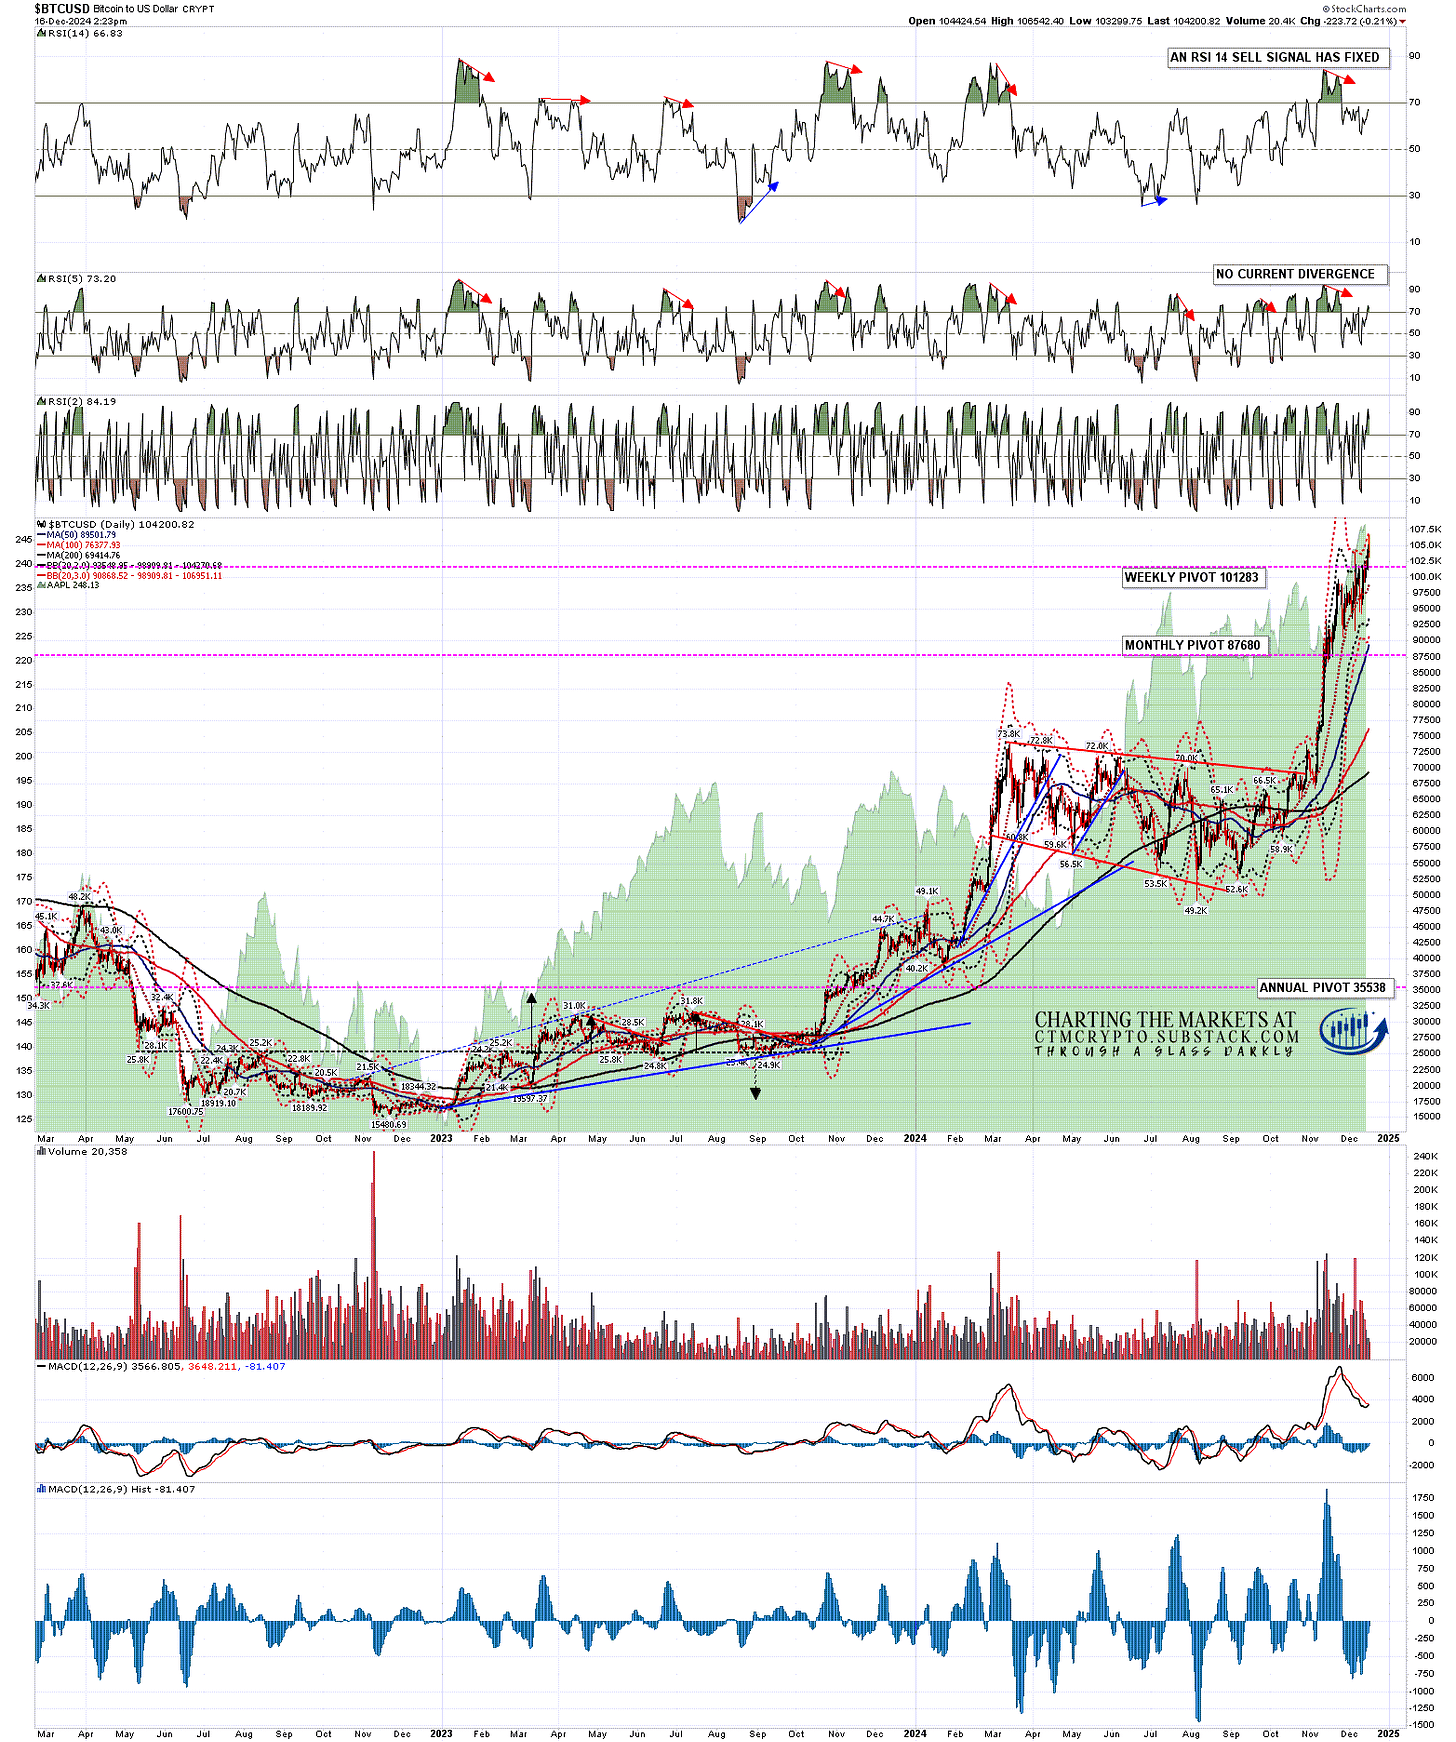
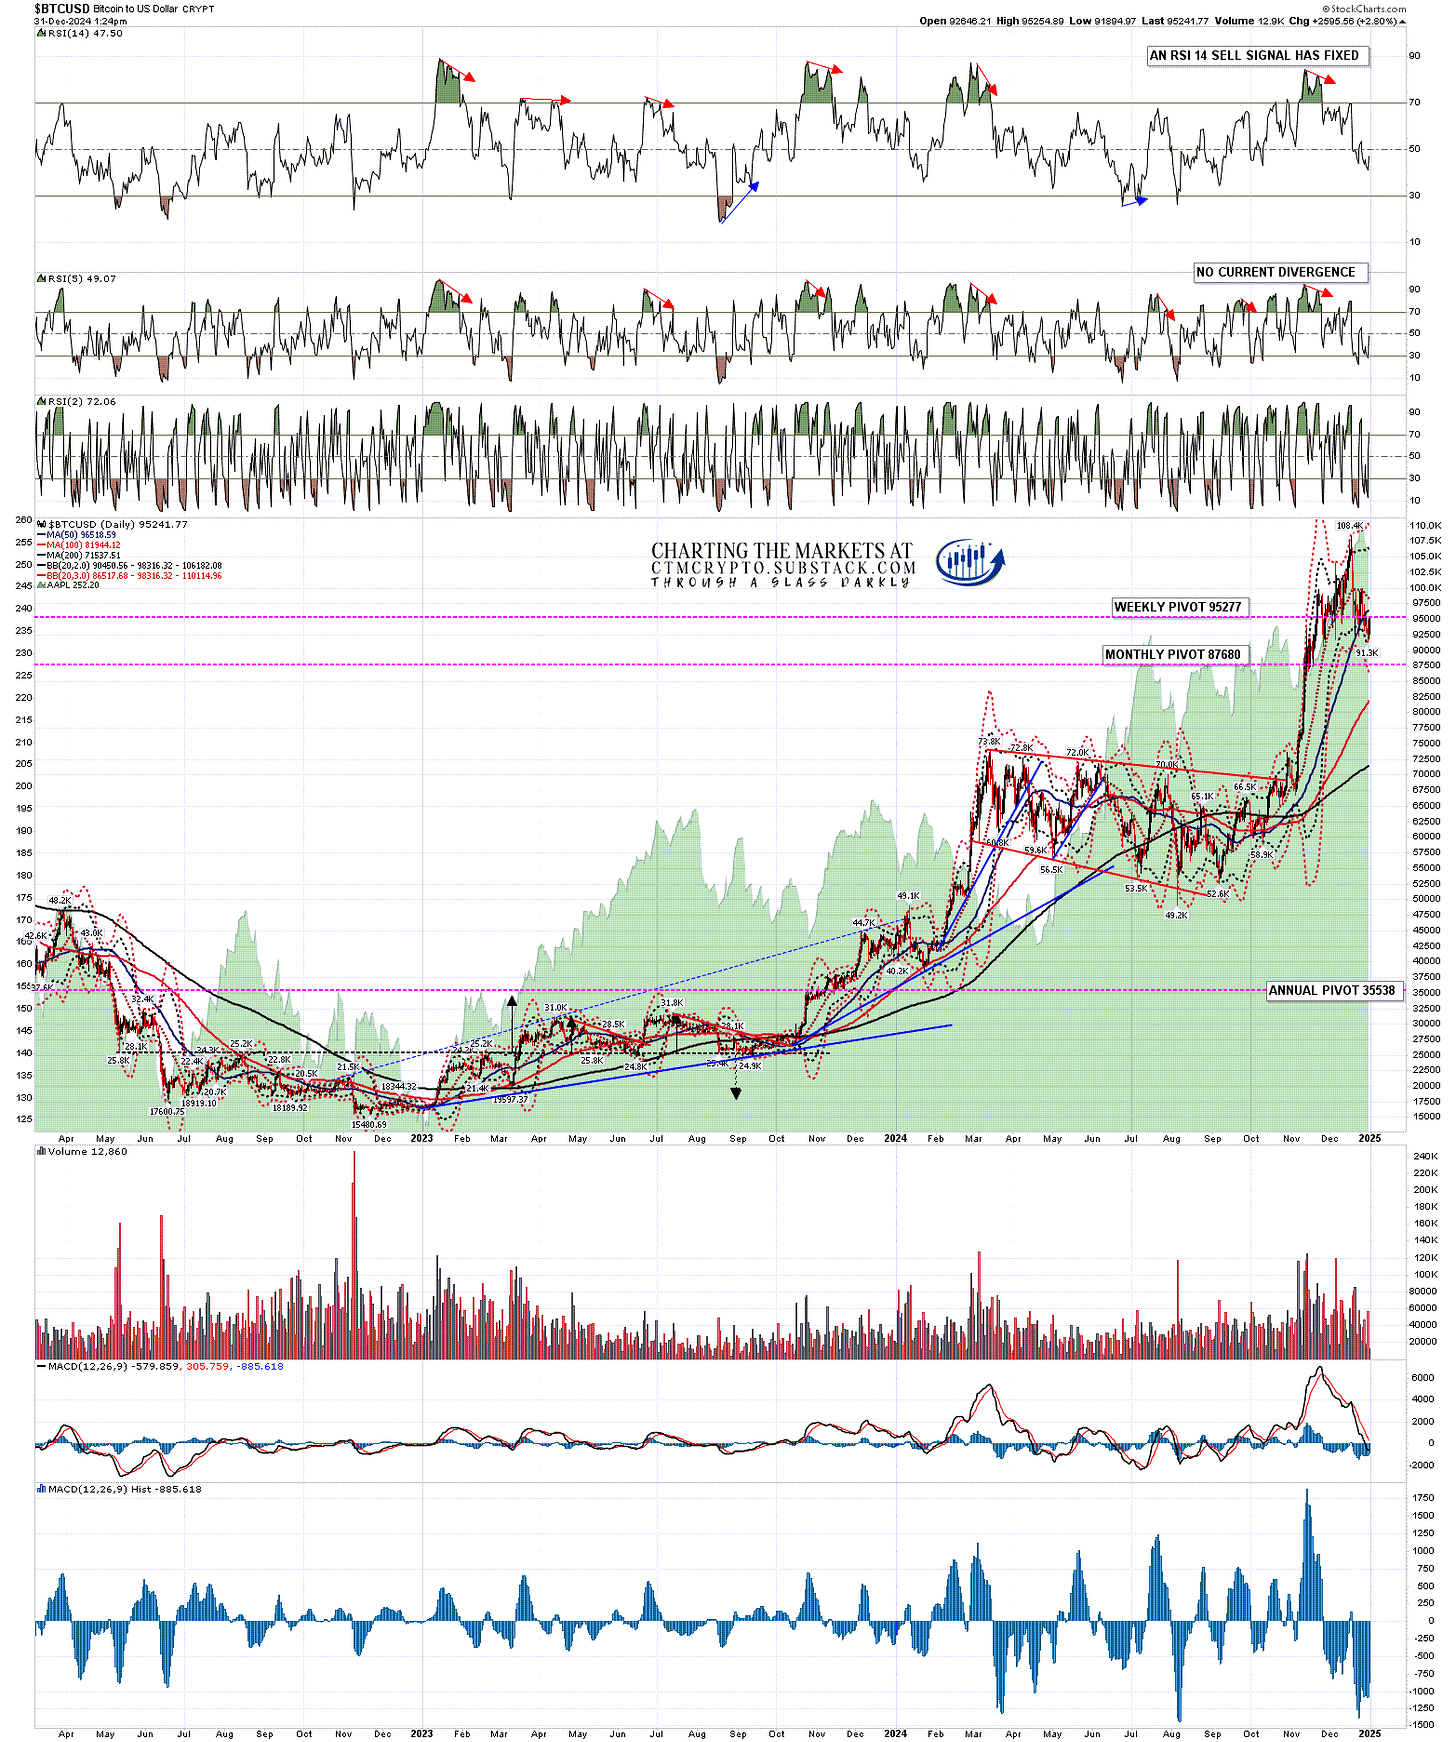
In my last post on Wednesday I was looking at the bullish leaning setups on Bitcoin (BTCUSD), Ethereum (ETHUSD) and Solana (SOLUSD) Both Bitcoin and Solana had daily RSI 14 sell signals two weeks ago of course, and Ethereum (ETHUSD) also had one fix last week, so now all three have fixed daily RSI 14 sell signals. These are likely signalling a larger retracement coming in the first months of next year, but I’m not expecting to see that in December …. most likely.

On the daily chart Bitcoin had backtested and held the daily middle band last week and I was looking for a new all time high. We saw that over the weekend and Bitcoin is getting close to the 3sd upper band, currently at 108315. That hasn’t been hit yet but, if hit, that may signal the start of another modest consolidation before going higher.

BTCUSD daily chart:

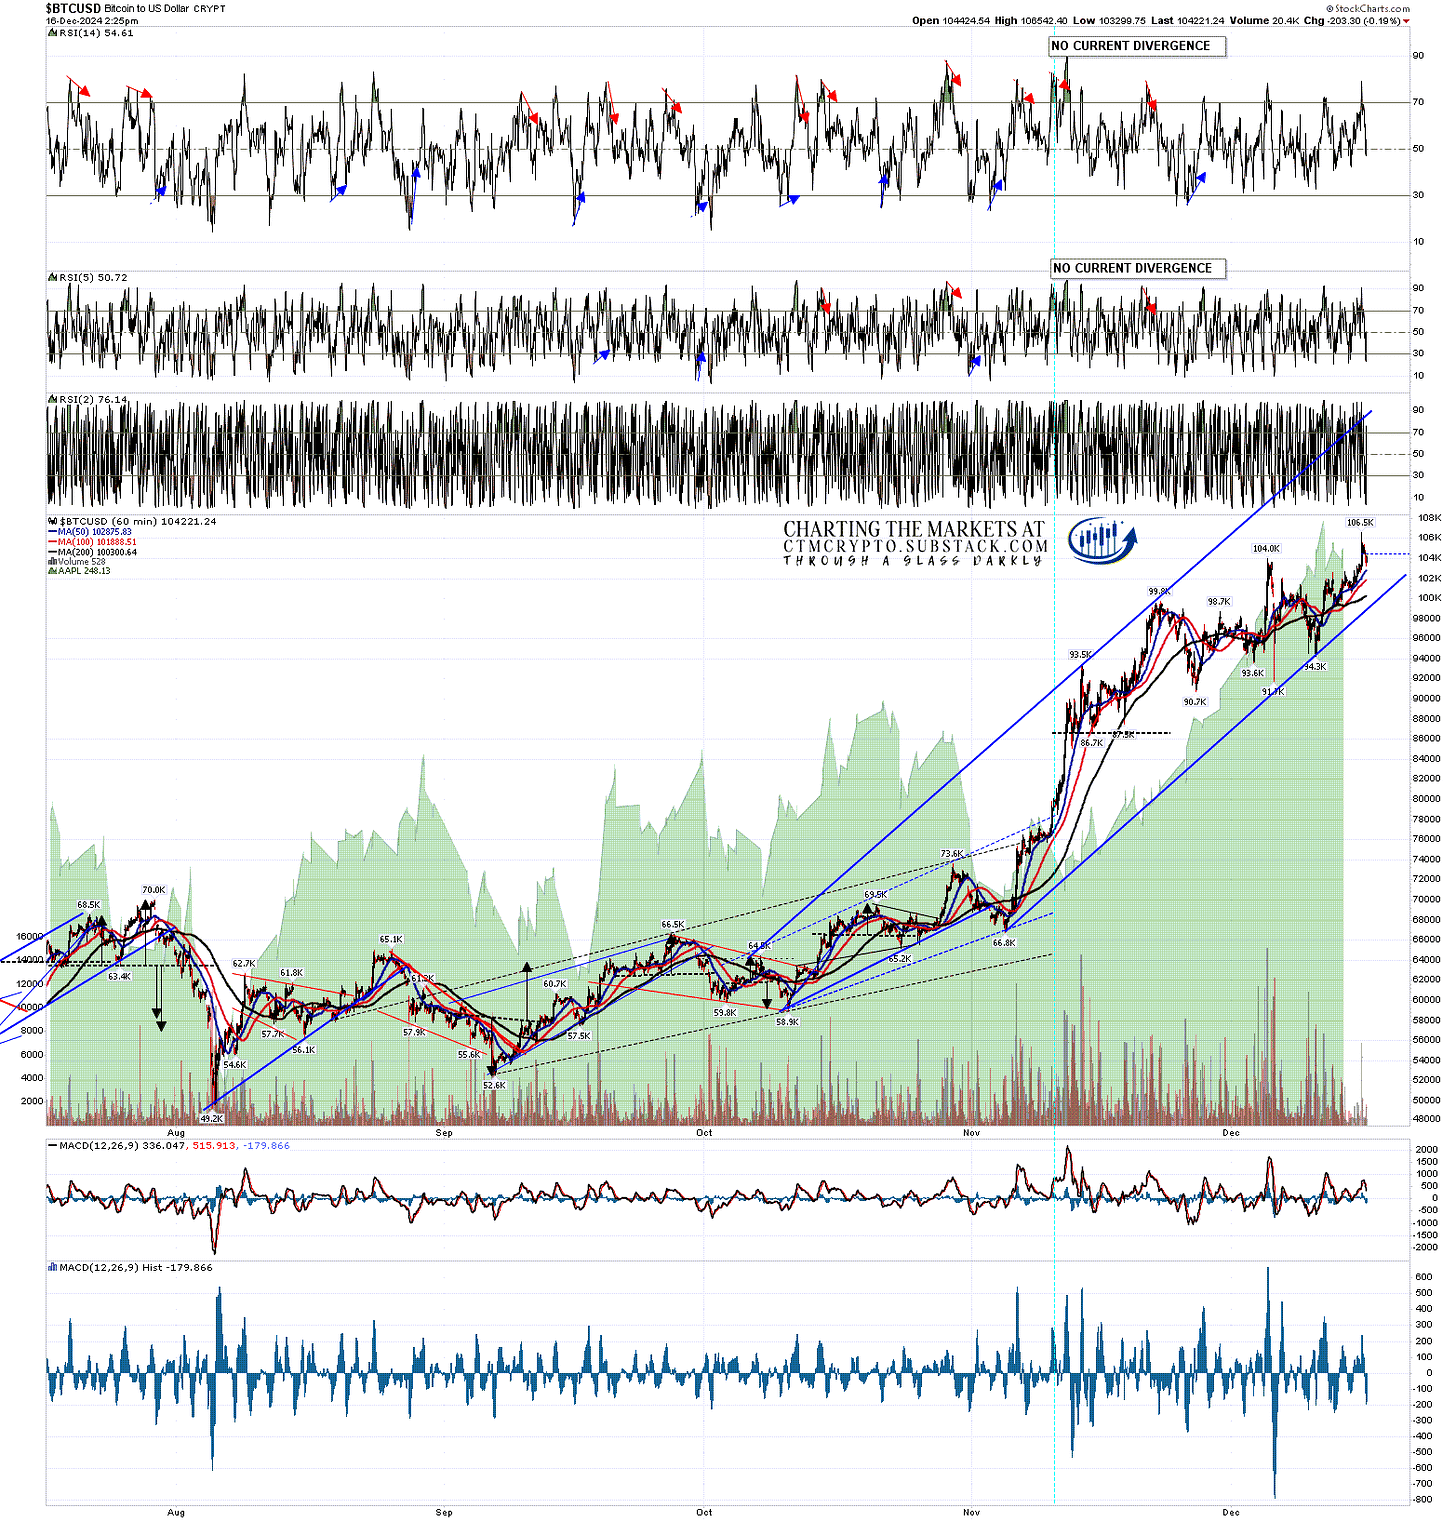
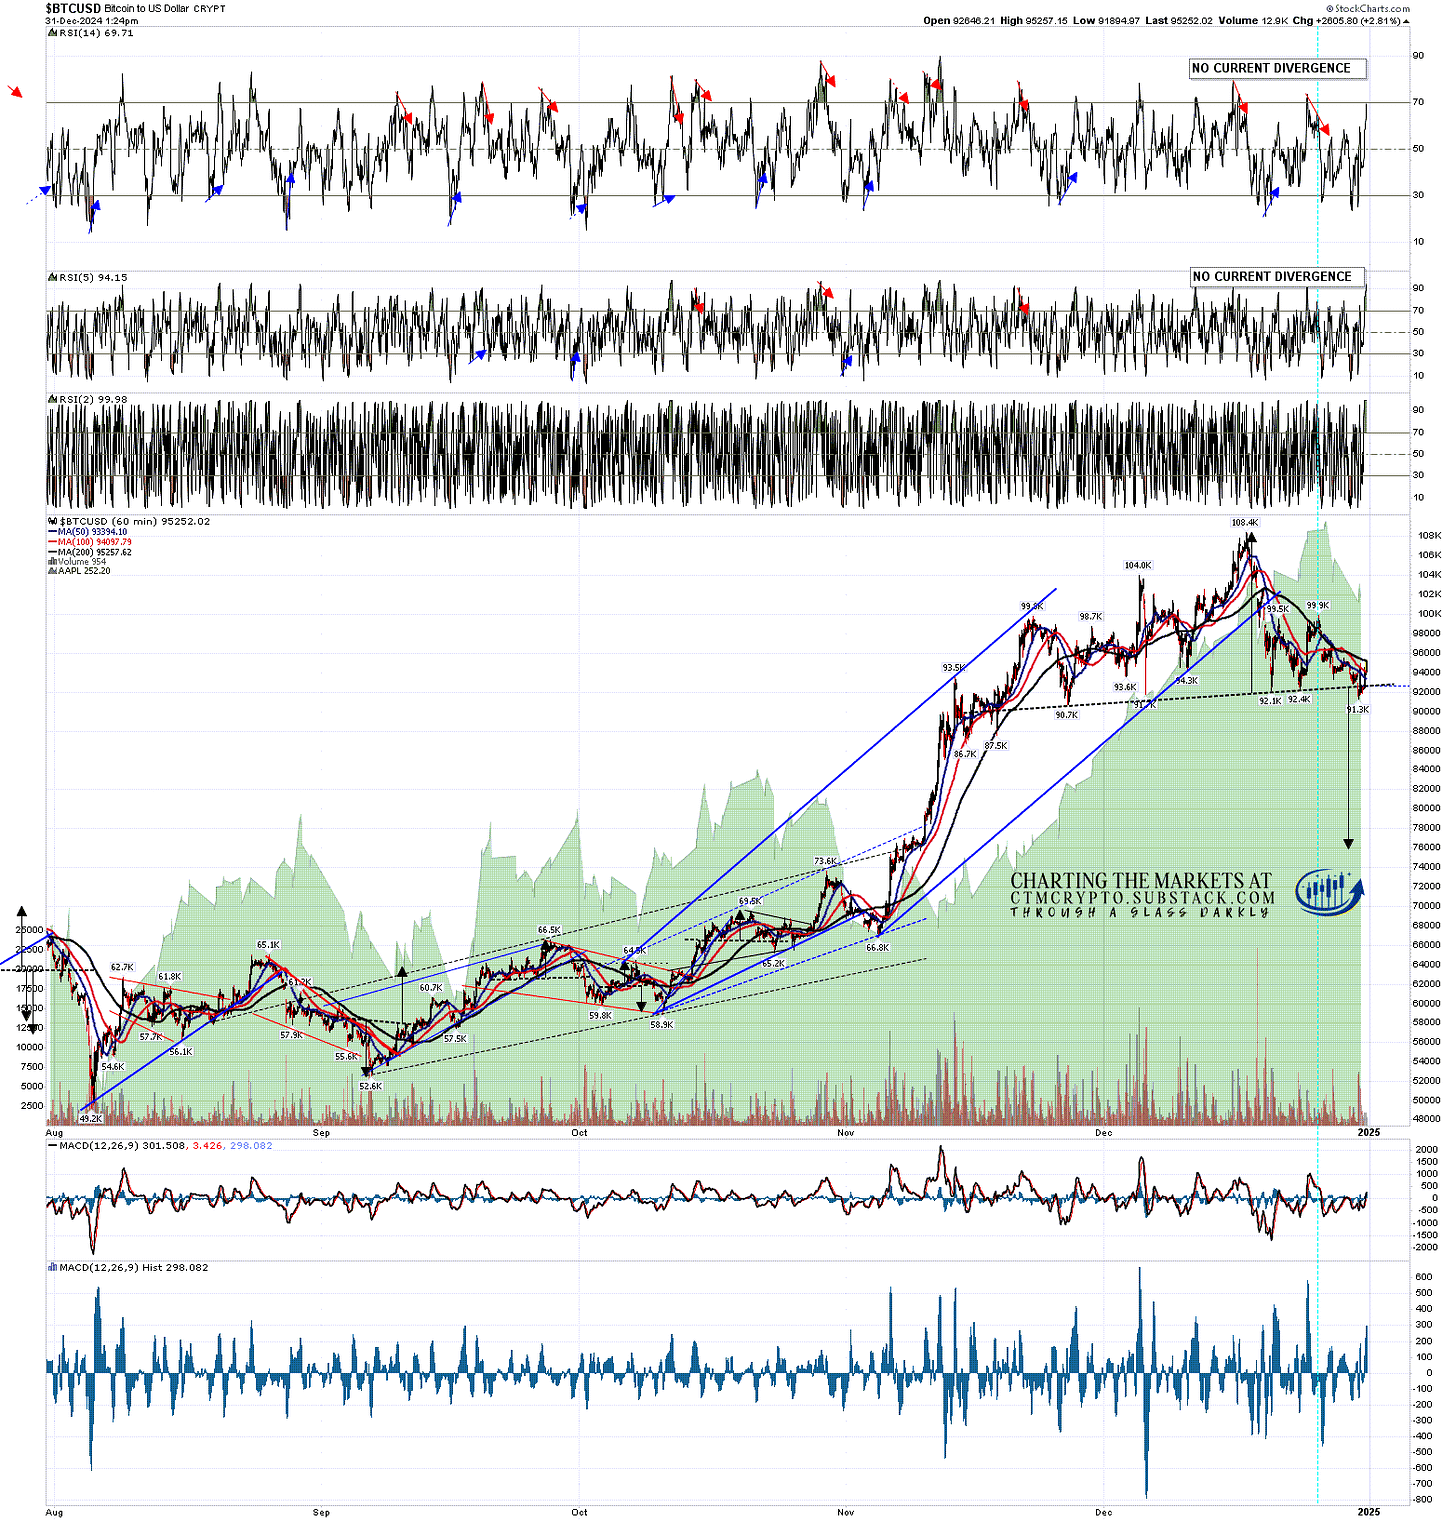
On the hourly chart I have rising support from the November low at 66.8k currently in the 99k area and am wondering whether the next big target might be the channel resistance parallel to that rising support, currently in the 118k area.

BTCUSD 60min chart:

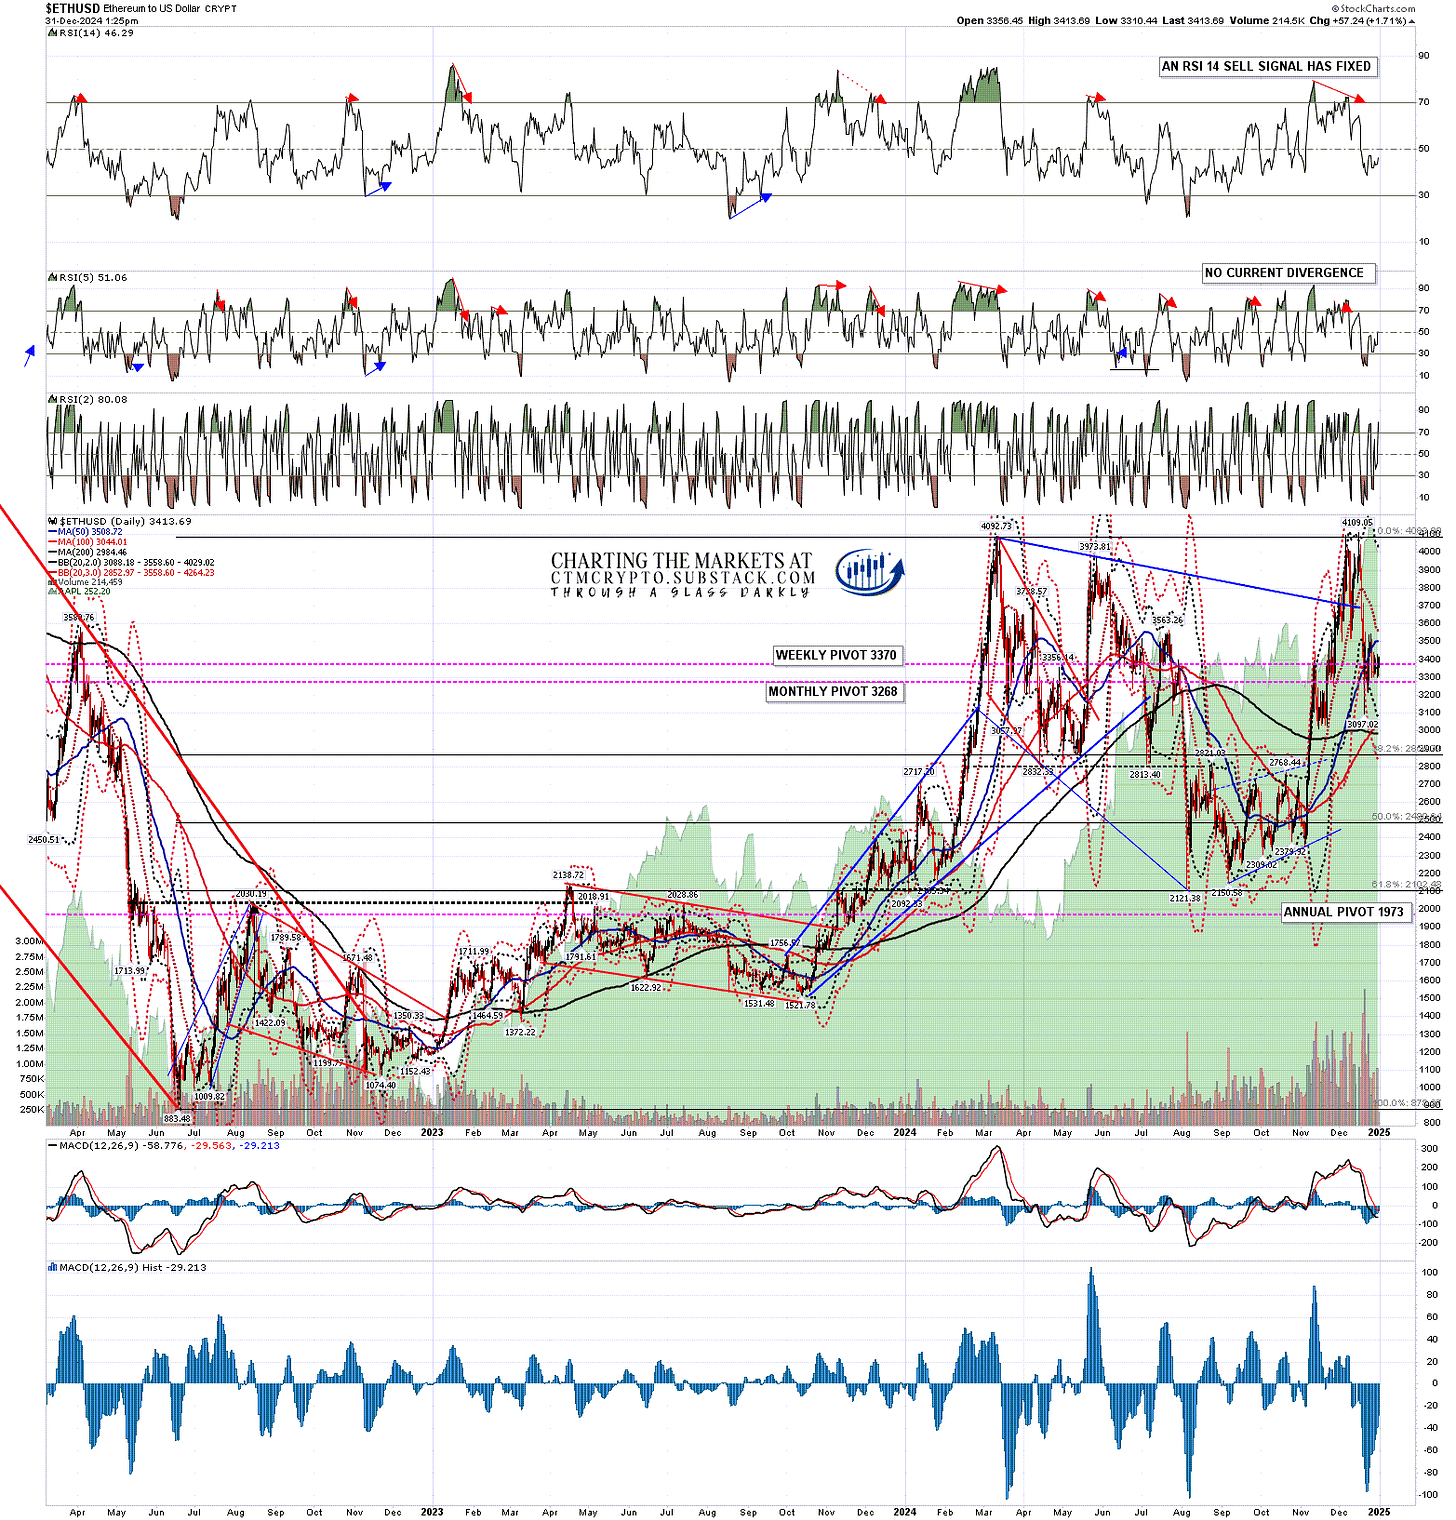
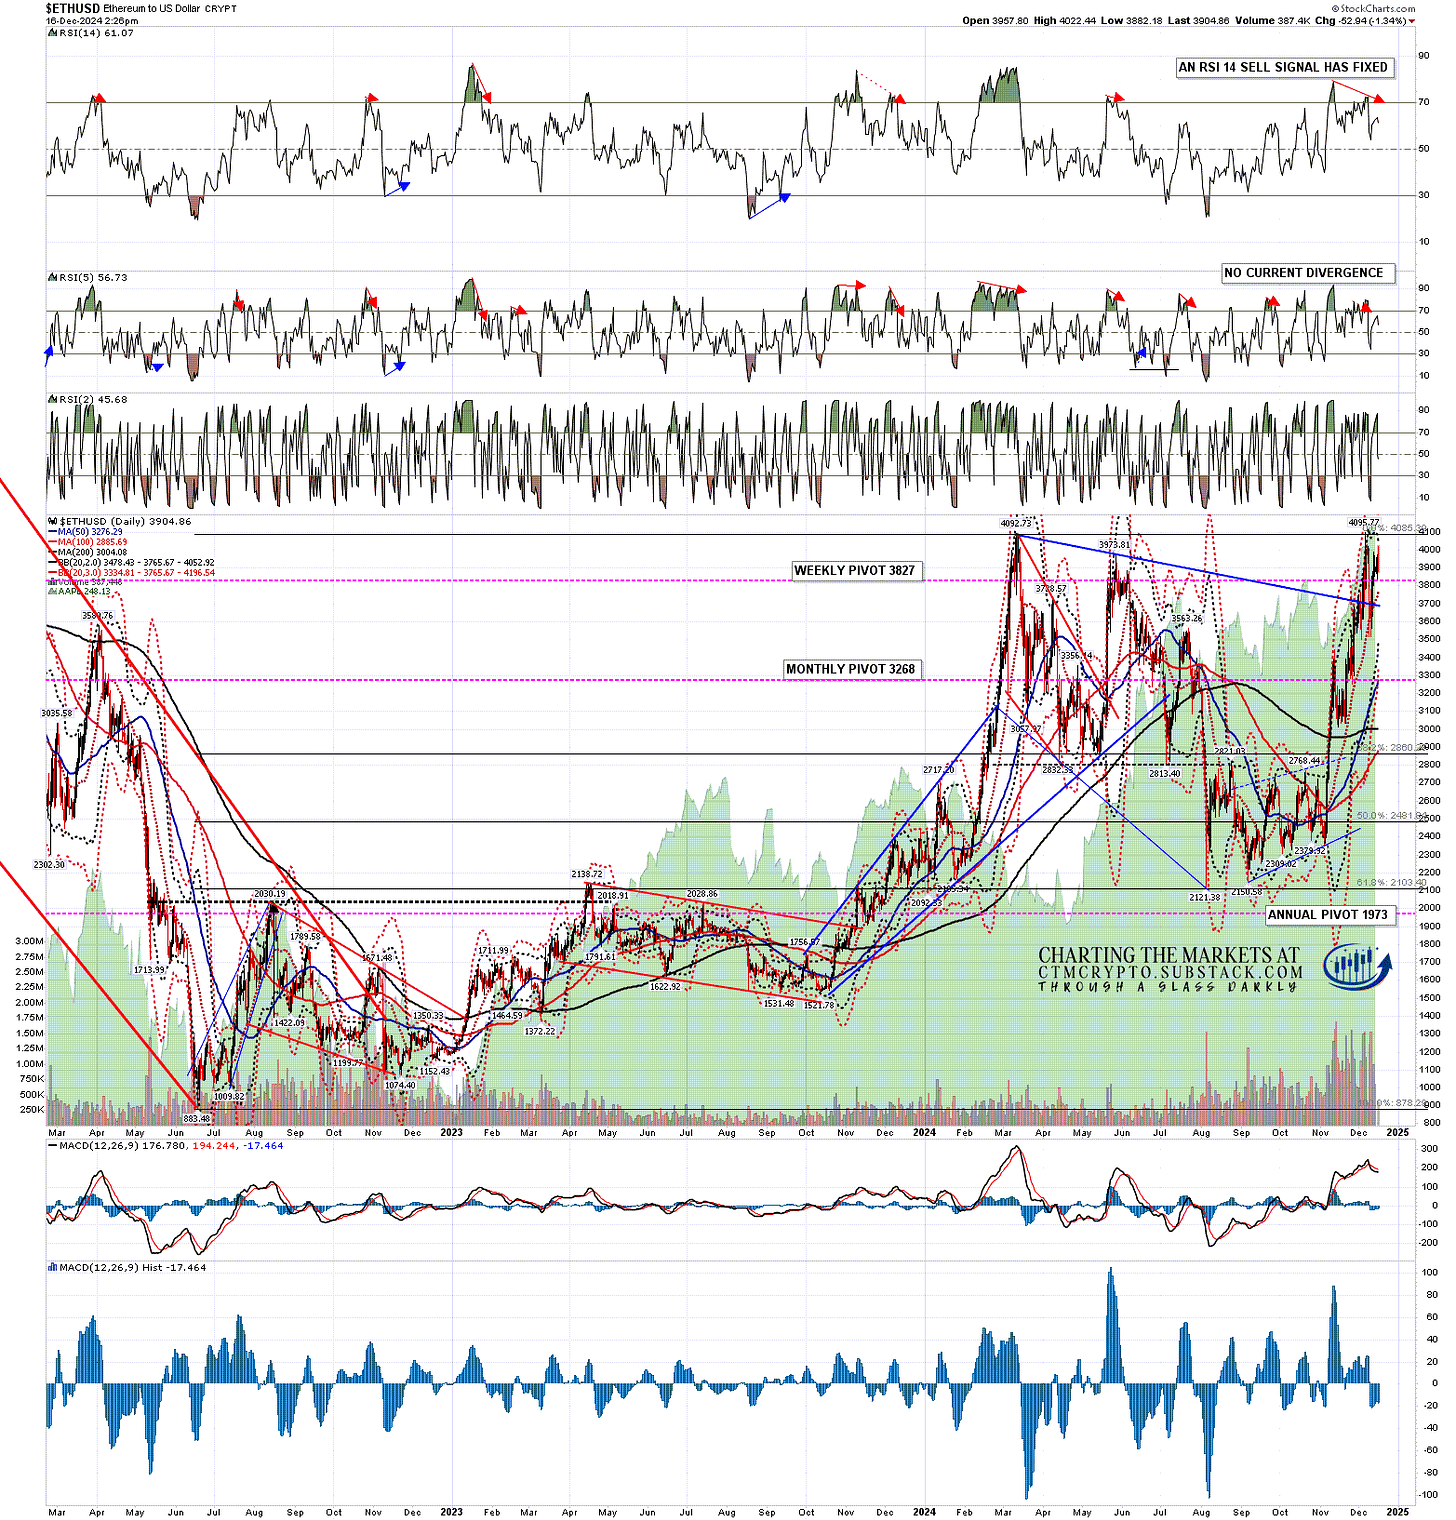
Ethereum backtested the daily middle band on the last retracement and held it. I was saying last Wednesday that the next obvious target was a retest of the 2024 high at 4095.77, reached today, and I have an eye on now the next big target, which is a retest of the 2021 all time high at 4865.94.

ETHUSD daily chart:

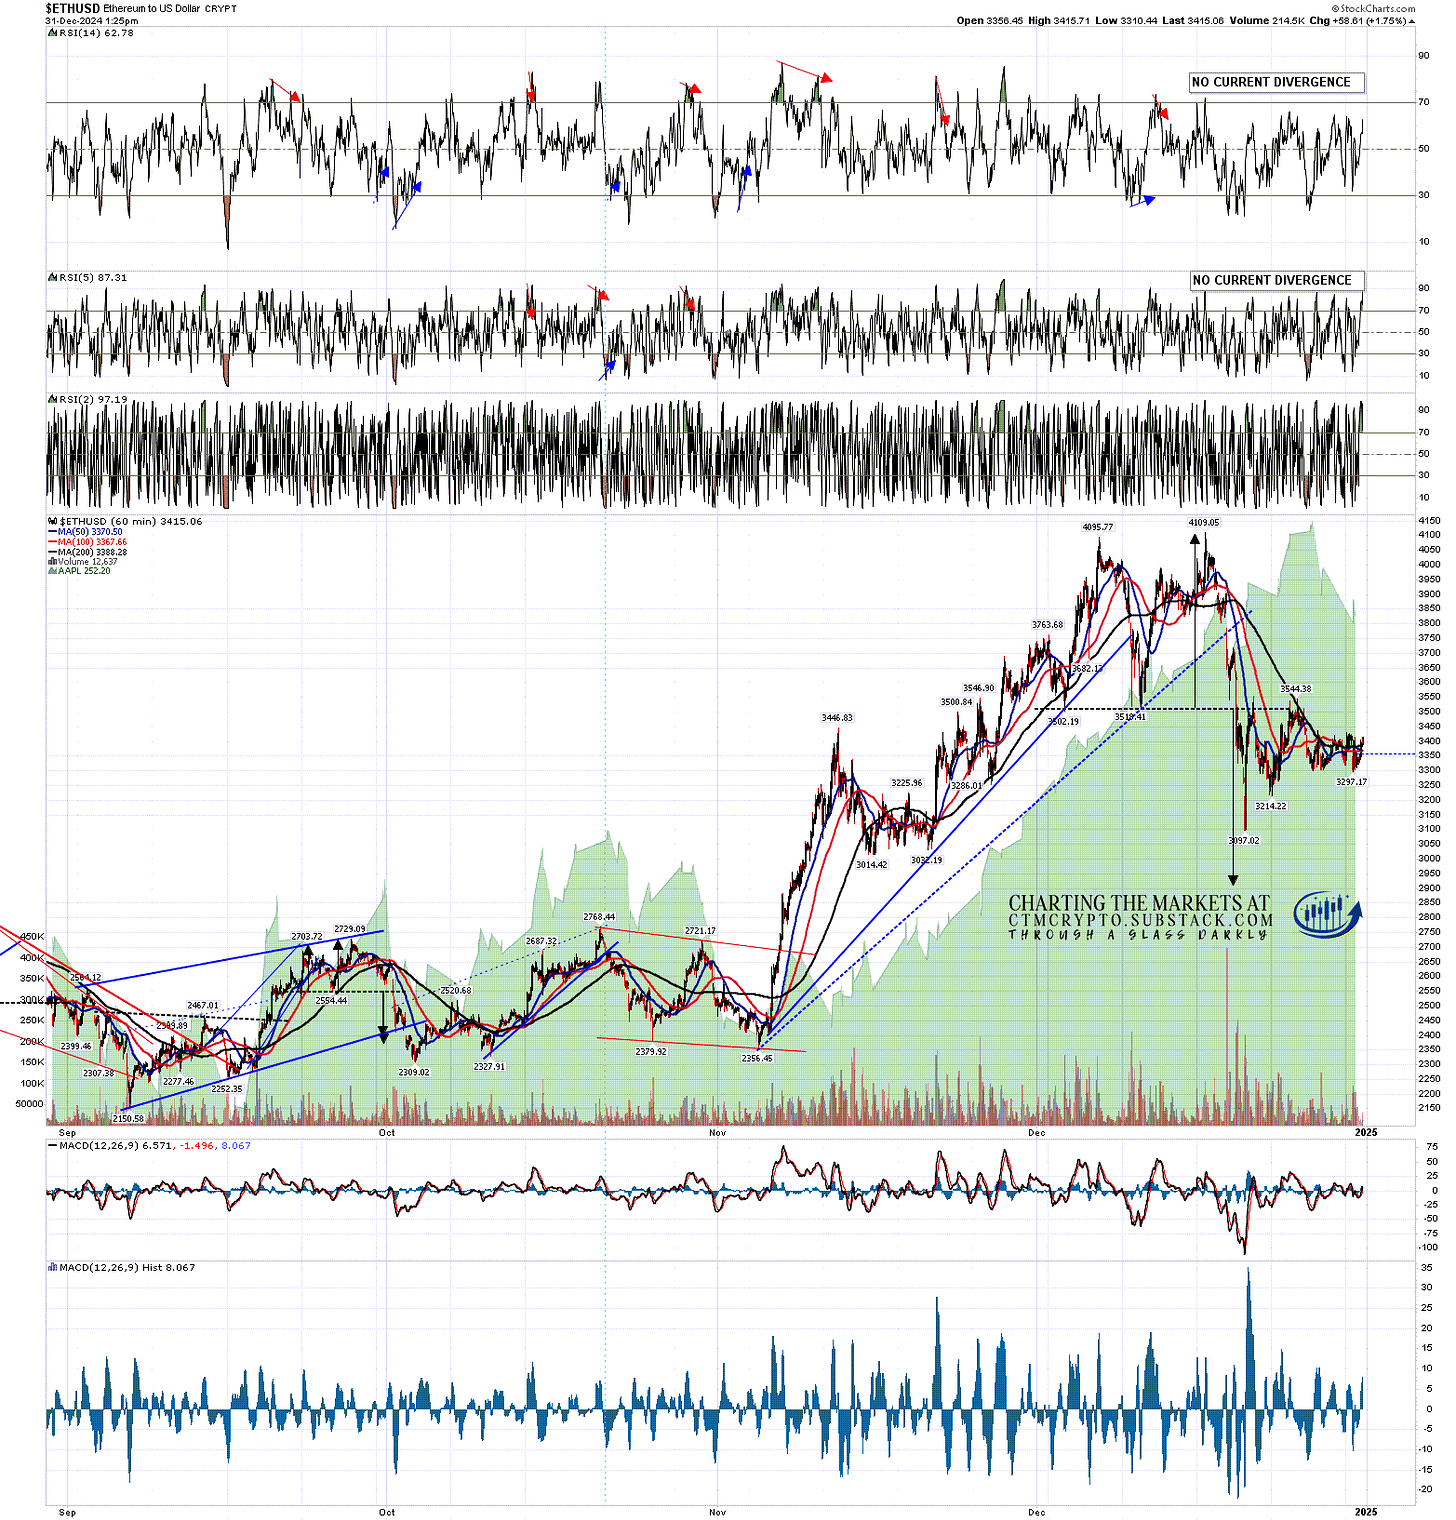
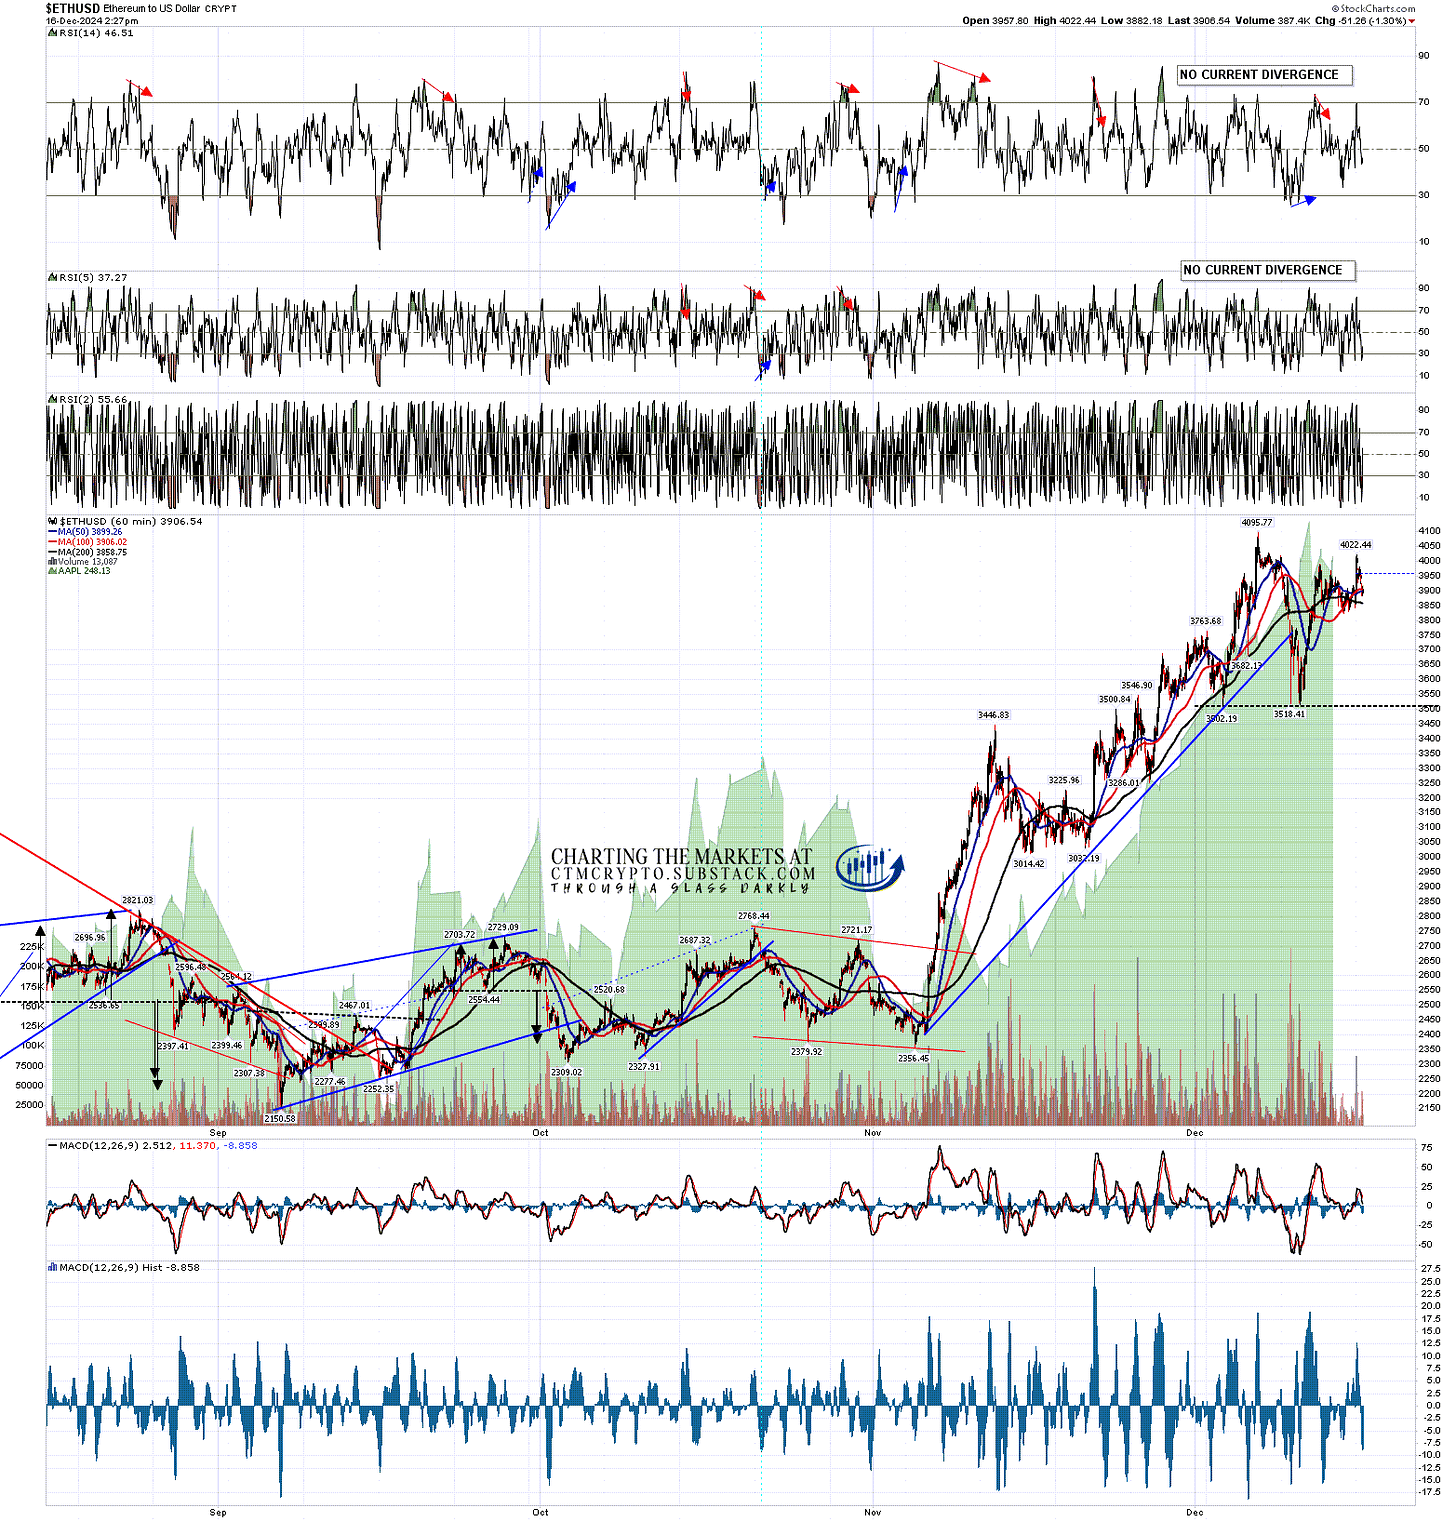
On the Ethereum 15min chart last week (not shown) there was a double bottom that had broken up with a target in the 4050 area, which was reached of course, and now that the 4095.77 high has been retested I would note that there is a now possible double top setup here on Ethereum, though I’m not seeing any obvious reason to expect that to play out at the moment.

ETHUSD 60min chart:

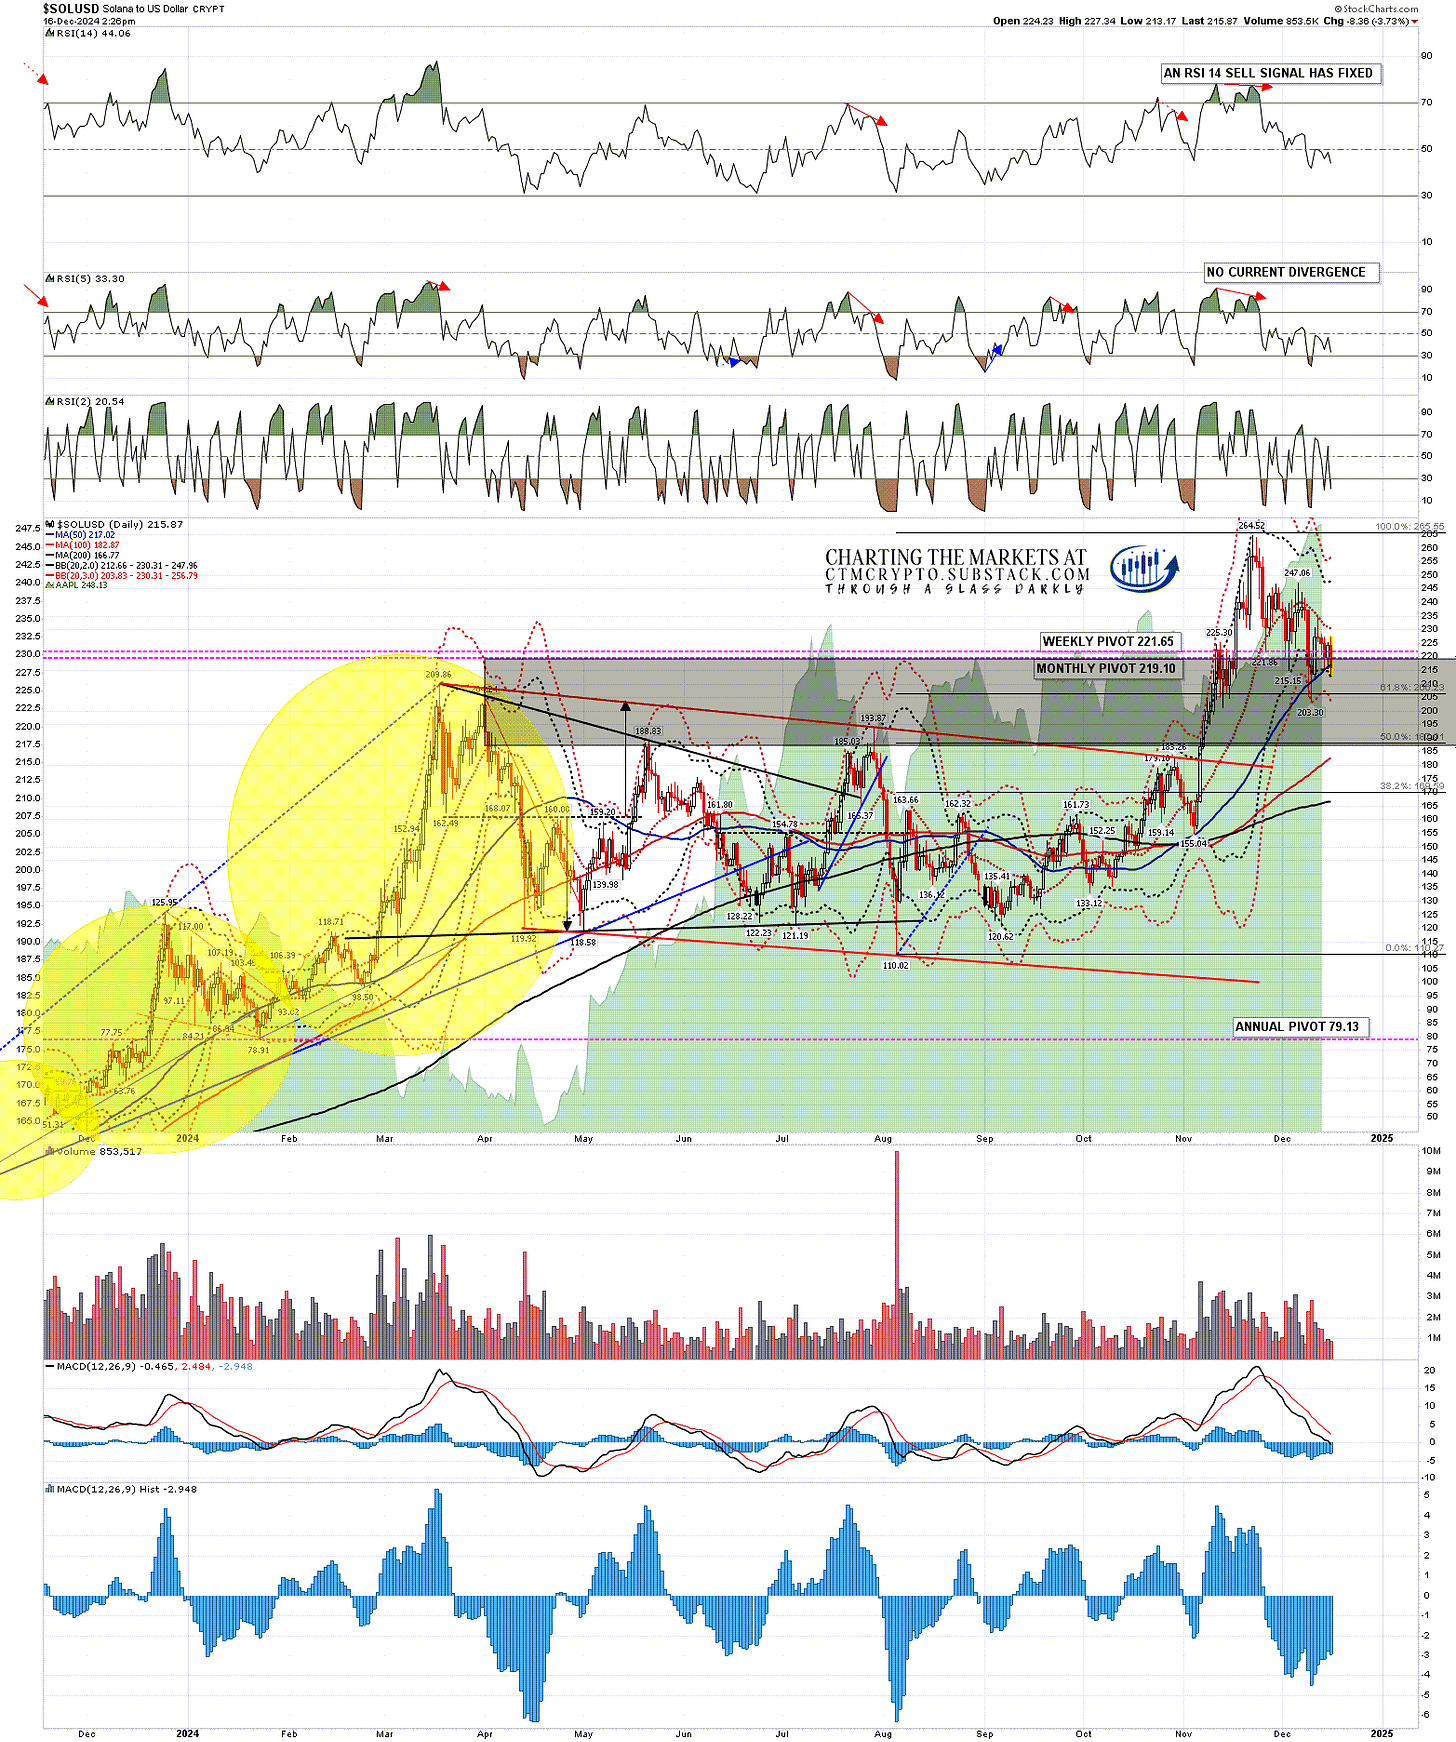
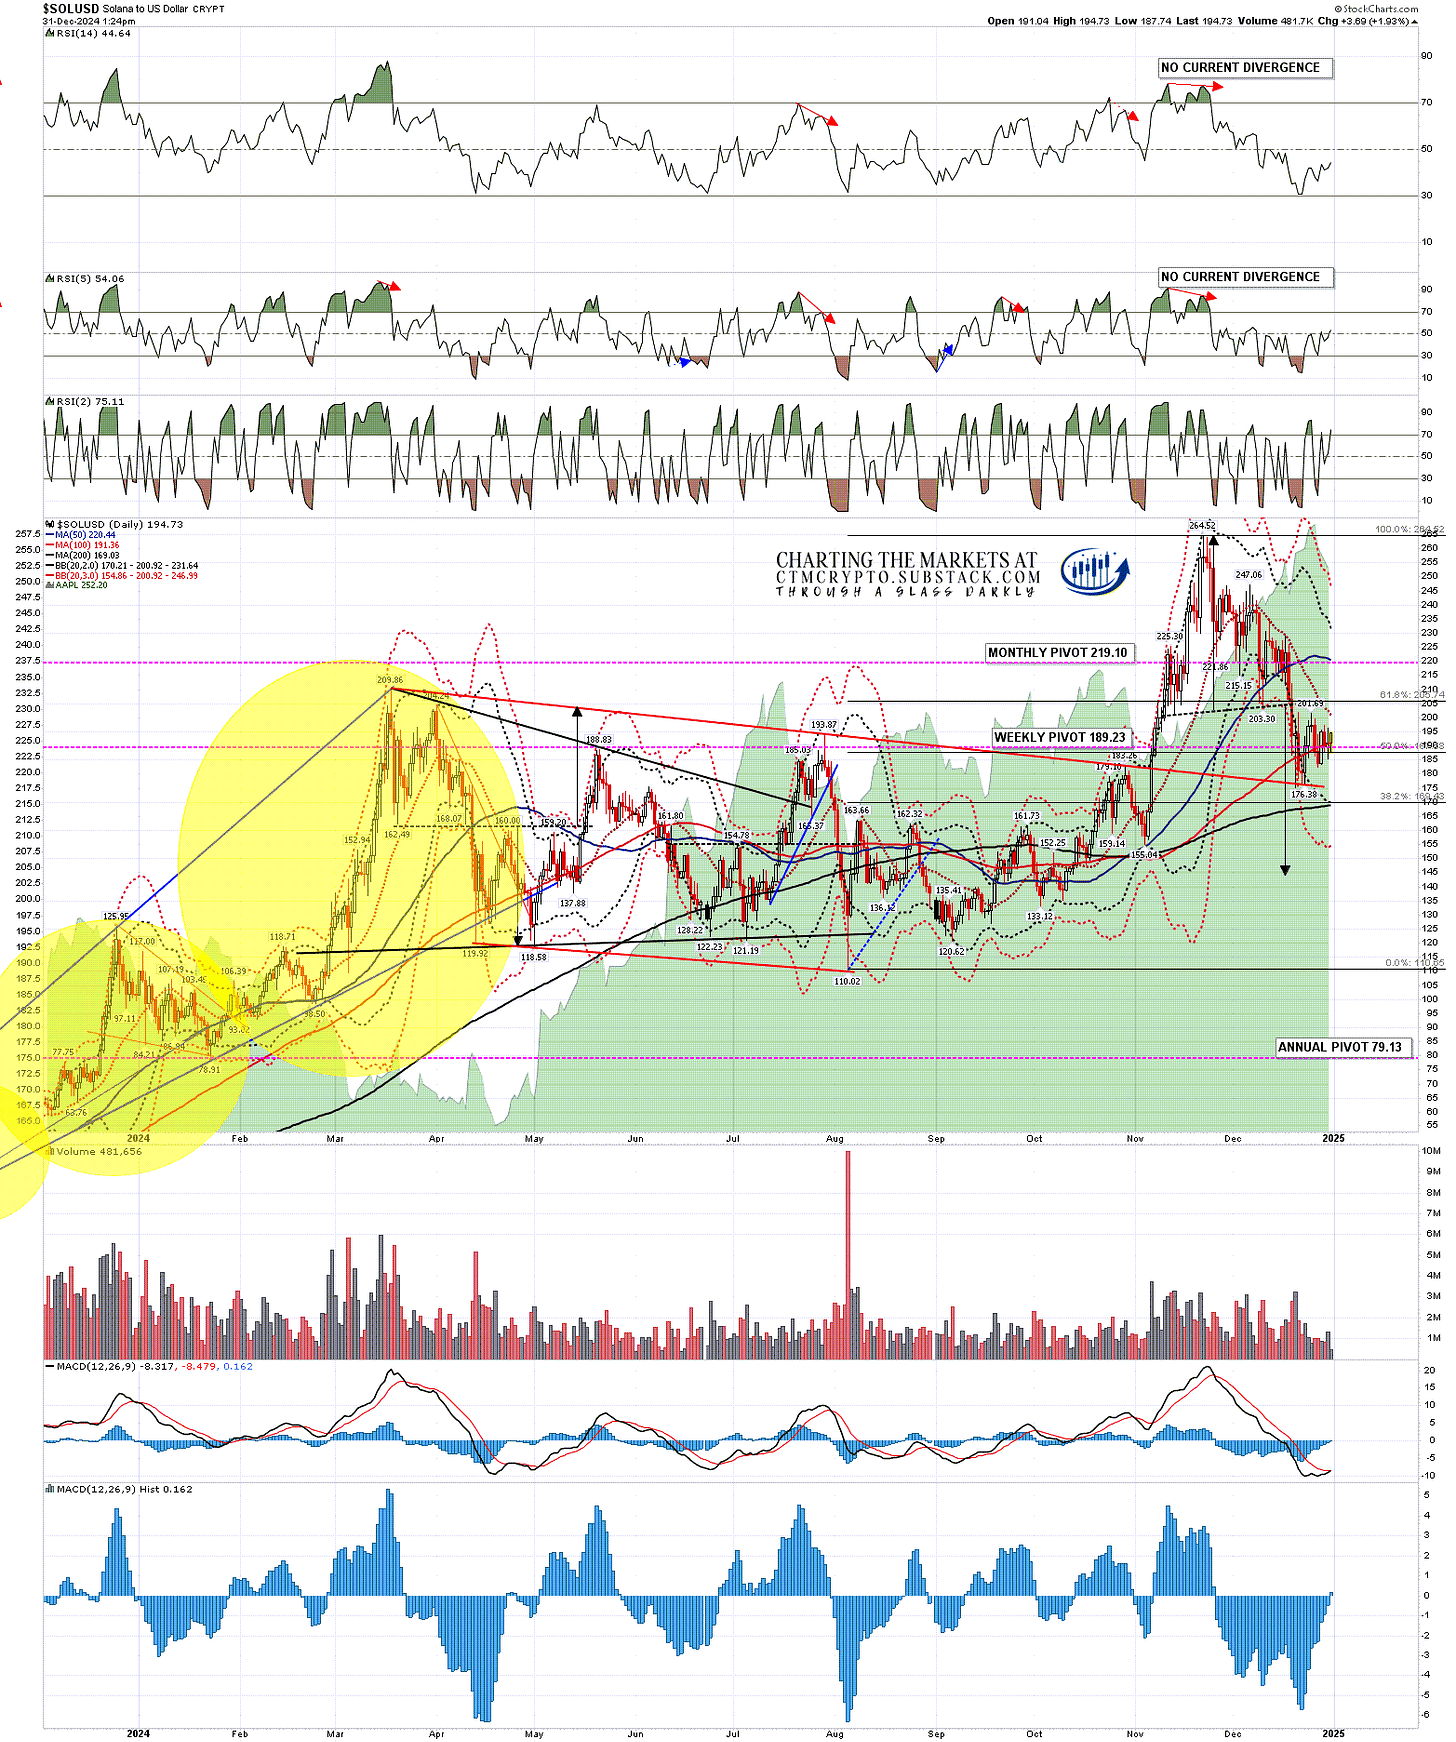
Solana has been the problem child over the last few days. I was saying on Wednesday that the daily middle band, which had been holding repeatedly as resistance over the previous ten days, needed to be broken and converted to support to open a retest of the all time high at 264.52, and we haven’t seen that yet, with the rally last week failing at the daily middle band again.

SOLUSD daily chart:

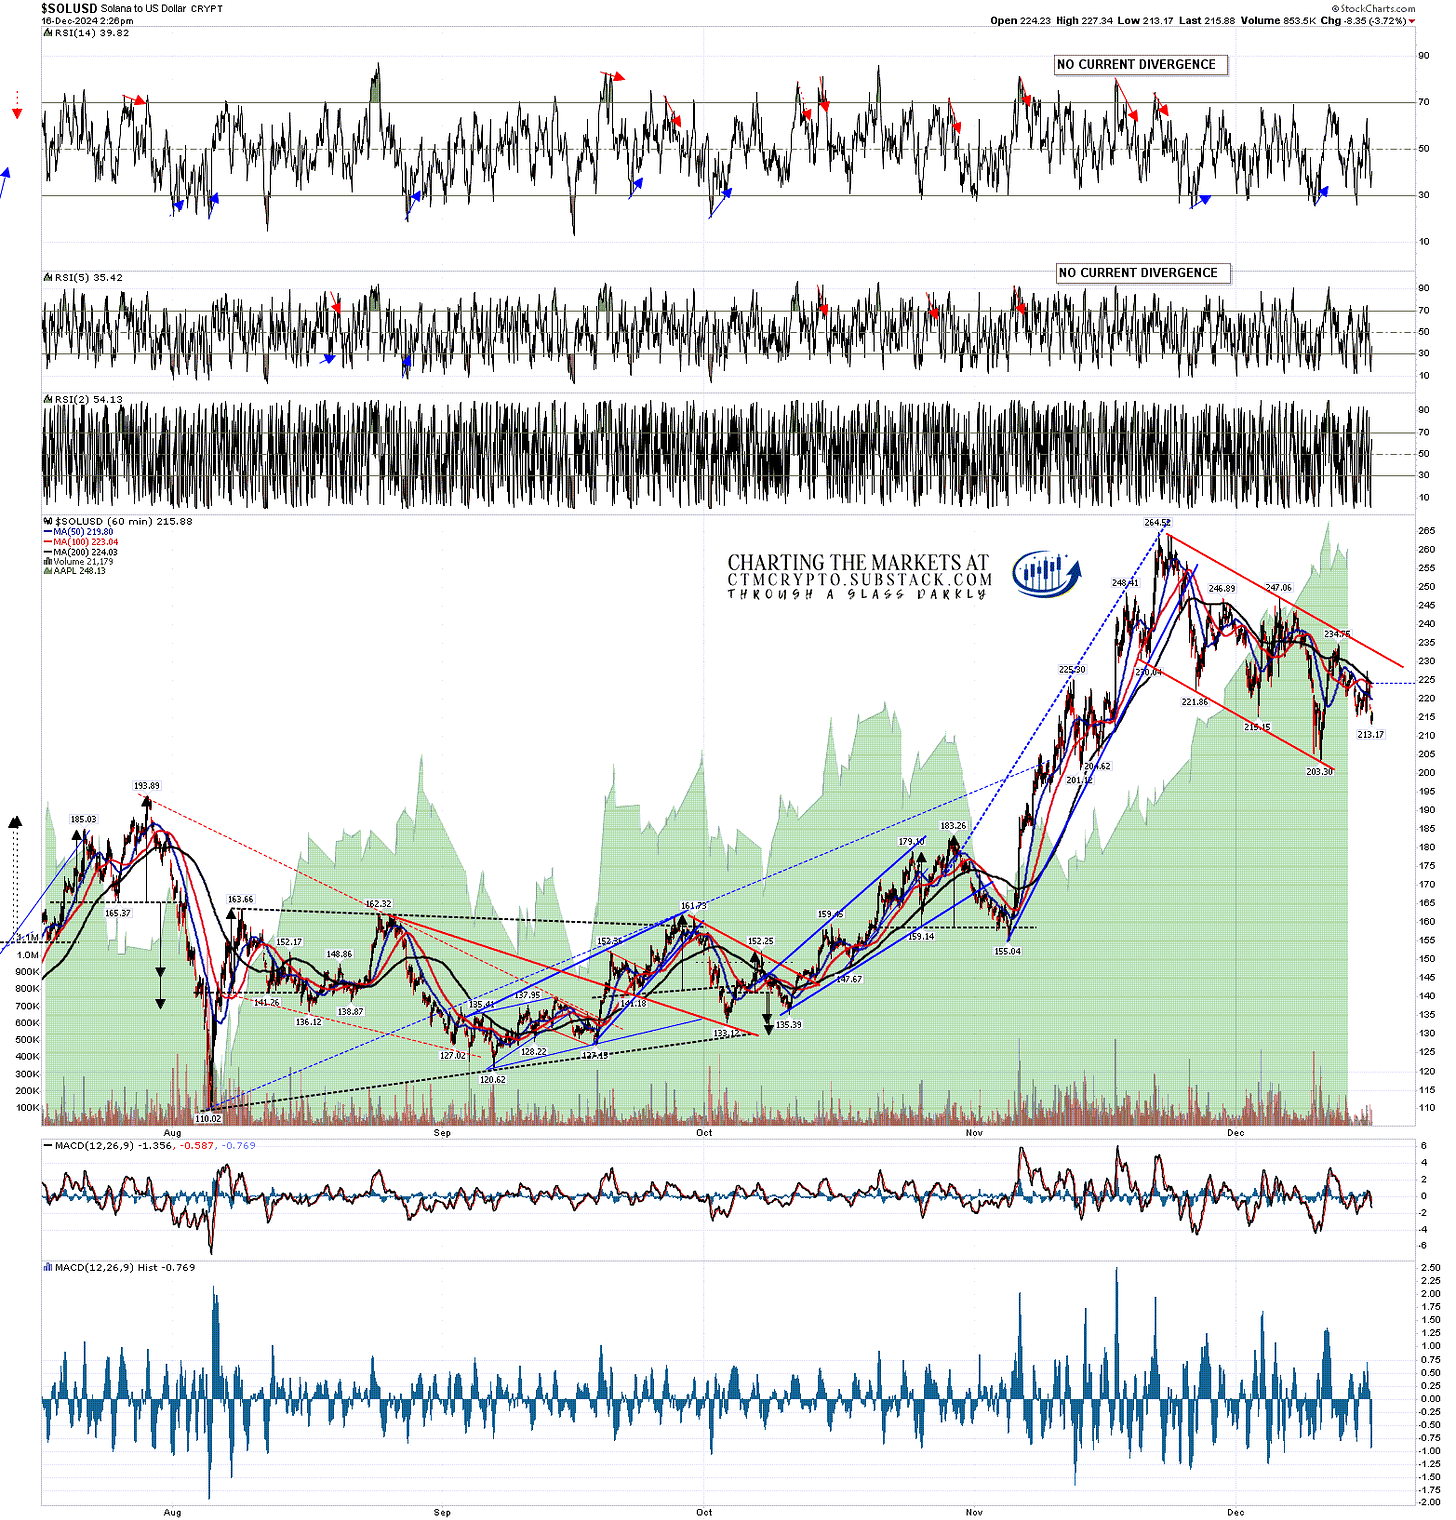
There is still a fixed double bottom target at 237.5 to 240 (shown on the 15min chart in my last post), and either Solana makes that target or it then likely retests the last low at 203.30. If seen that may well be the second low of a larger double bottom with a target on a sustained break over 234.75 at a retest of the all time high.

The current setup on Solana is a high quality bull flag channel and 70% this breaks up now or after a low retest. The 30% break down option is worth a look here though as there is a possible large H&S here (not shown on the chart below) that on a sustained break below 200 would have a target in the 138 area. This isn’t something I’m thinking is likely to play out, but in the event that we were to see a hard break down on equities over the next few days, which I’m really not expecting, that could deliver.

Bull flag channel resistance is now in the 233 area, and a sustained break above looks for a retest of the all time high at 264.52.

SOLUSD 60min chart:

On the bigger picture I’m leaning bullish across the board with the caveat that the fixed daily RSI 14 sell signals on Bitcoin, Solana and Ethereum are warning that a longer and deeper consolidation may be coming within a few weeks. There is always a chance that retracement might arrive earlier, though December would not be an obvious time to see that.

If you’d like to see more of these posts and the other Crypto videos and information I post, please subscribe for free to my Crypto substack.

I do a premarket video every day on Crypto at 9.15am EST. If you’d like to see those I post the links every morning on my twitter, and the videos are posted shortly afterwards on my Youtube channel.

I'm also to be found at Arion Partners, though as a student rather than as a teacher. I've been charting Crypto for some years now, but am learning to trade and invest in them directly, and Arion Partners are my guide around a space that might reasonably be compared to the Wild West in one of their rougher years.

Sunday, 15 December 2024

Support Breaks on US Indices

In my last post on Wednesday I was looking at the move up from Tuesday afternoon’s low and noting that the almost complete absence of participation on DIA and IWM was a serious concern, as on a pullback on the tech-led rally, we might then see significant support breaks on Dow and Russell stocks.

At the same time the new inflation figures landed and, not to beat around the bush, they sucked, with a 0.2% rise in inflation led by food prices. The consensus seems to be that the Fed will cut rates this month anyway, but I’m doubtful about that, and regardless of that, the rally in bonds seems to have failed to reach the obvious targets and to be resuming the larger downtrend, so in practical terms interest rates, as delivered in bond yields, are already back on an upward path.

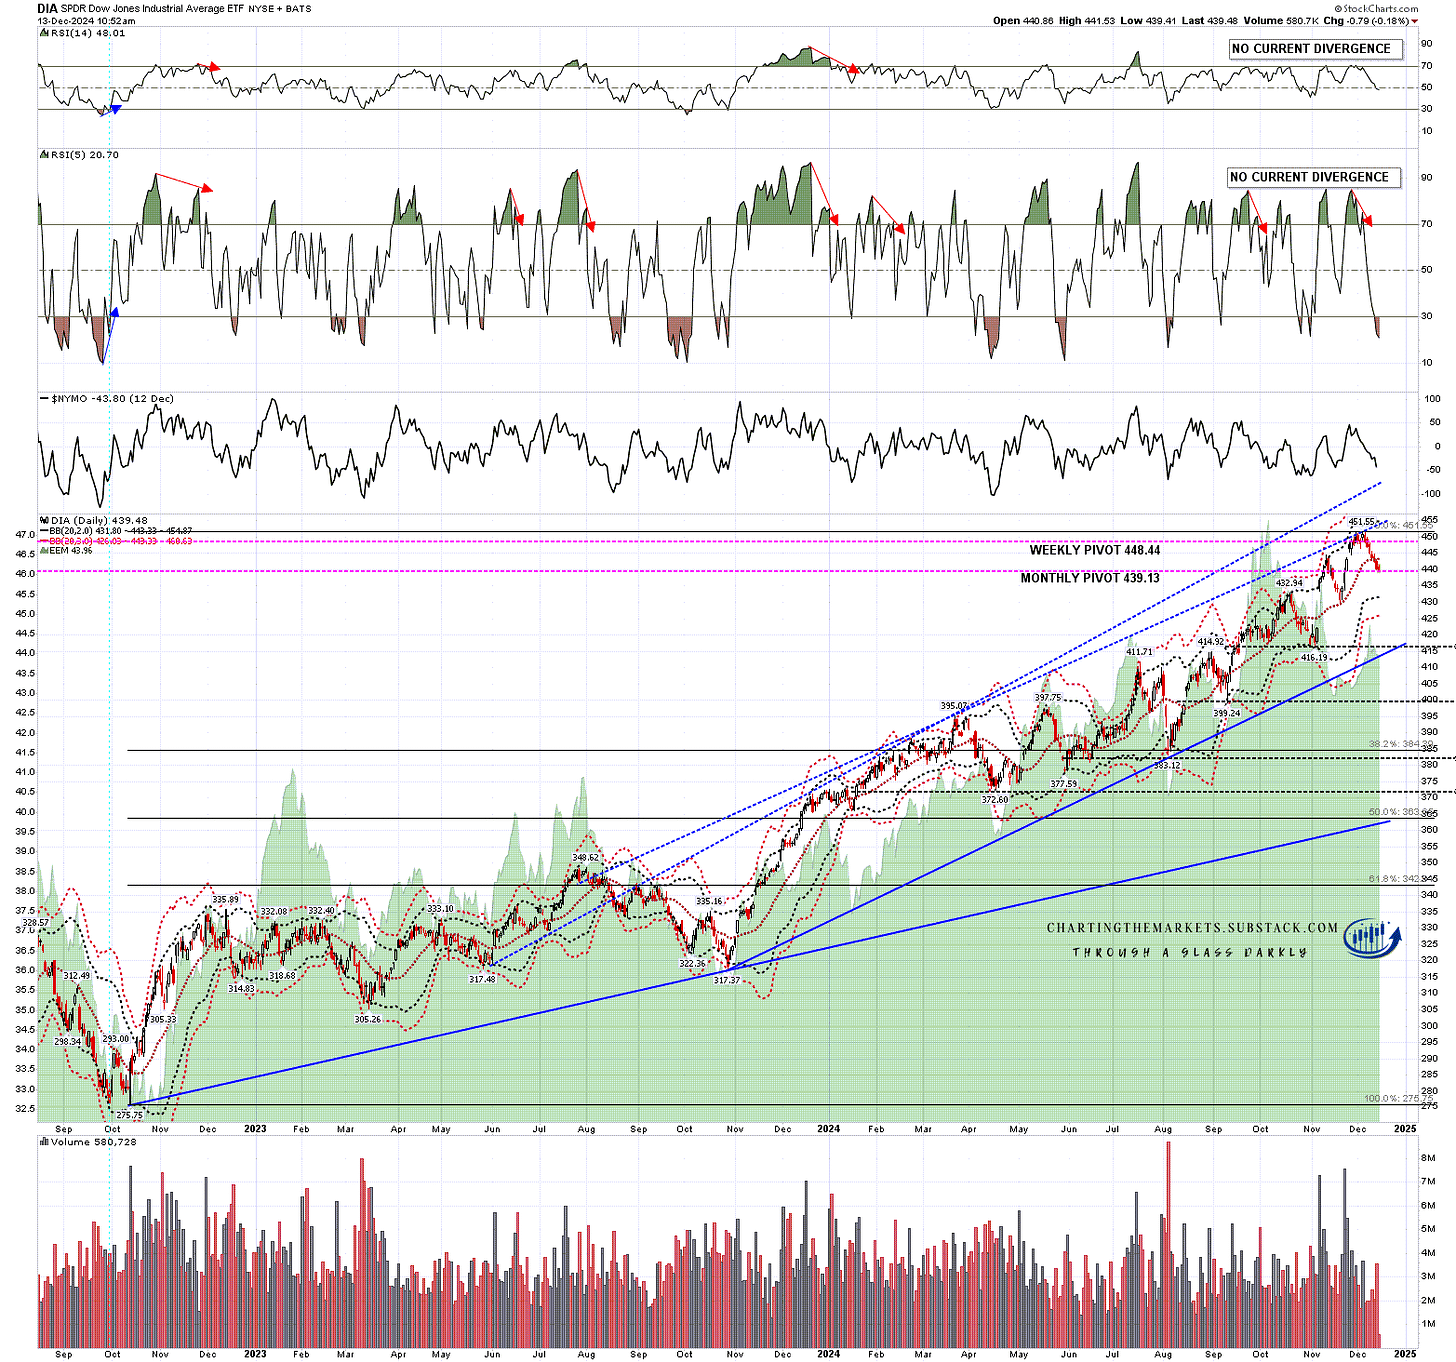
We saw those support breaks yesterday with both DIA and IWM breaking their daily middle bands hard. DIA is currently testing the monthly pivot at 439.13, and next support levels below that are the daily lower band, currently at 433, and a possible H&S neckline at the mid-November low at 429.64. A break below though might well then look for the November low at 416.19, a strong match with rising support from the October 2023 low currently in the same area.

DIA daily chart:

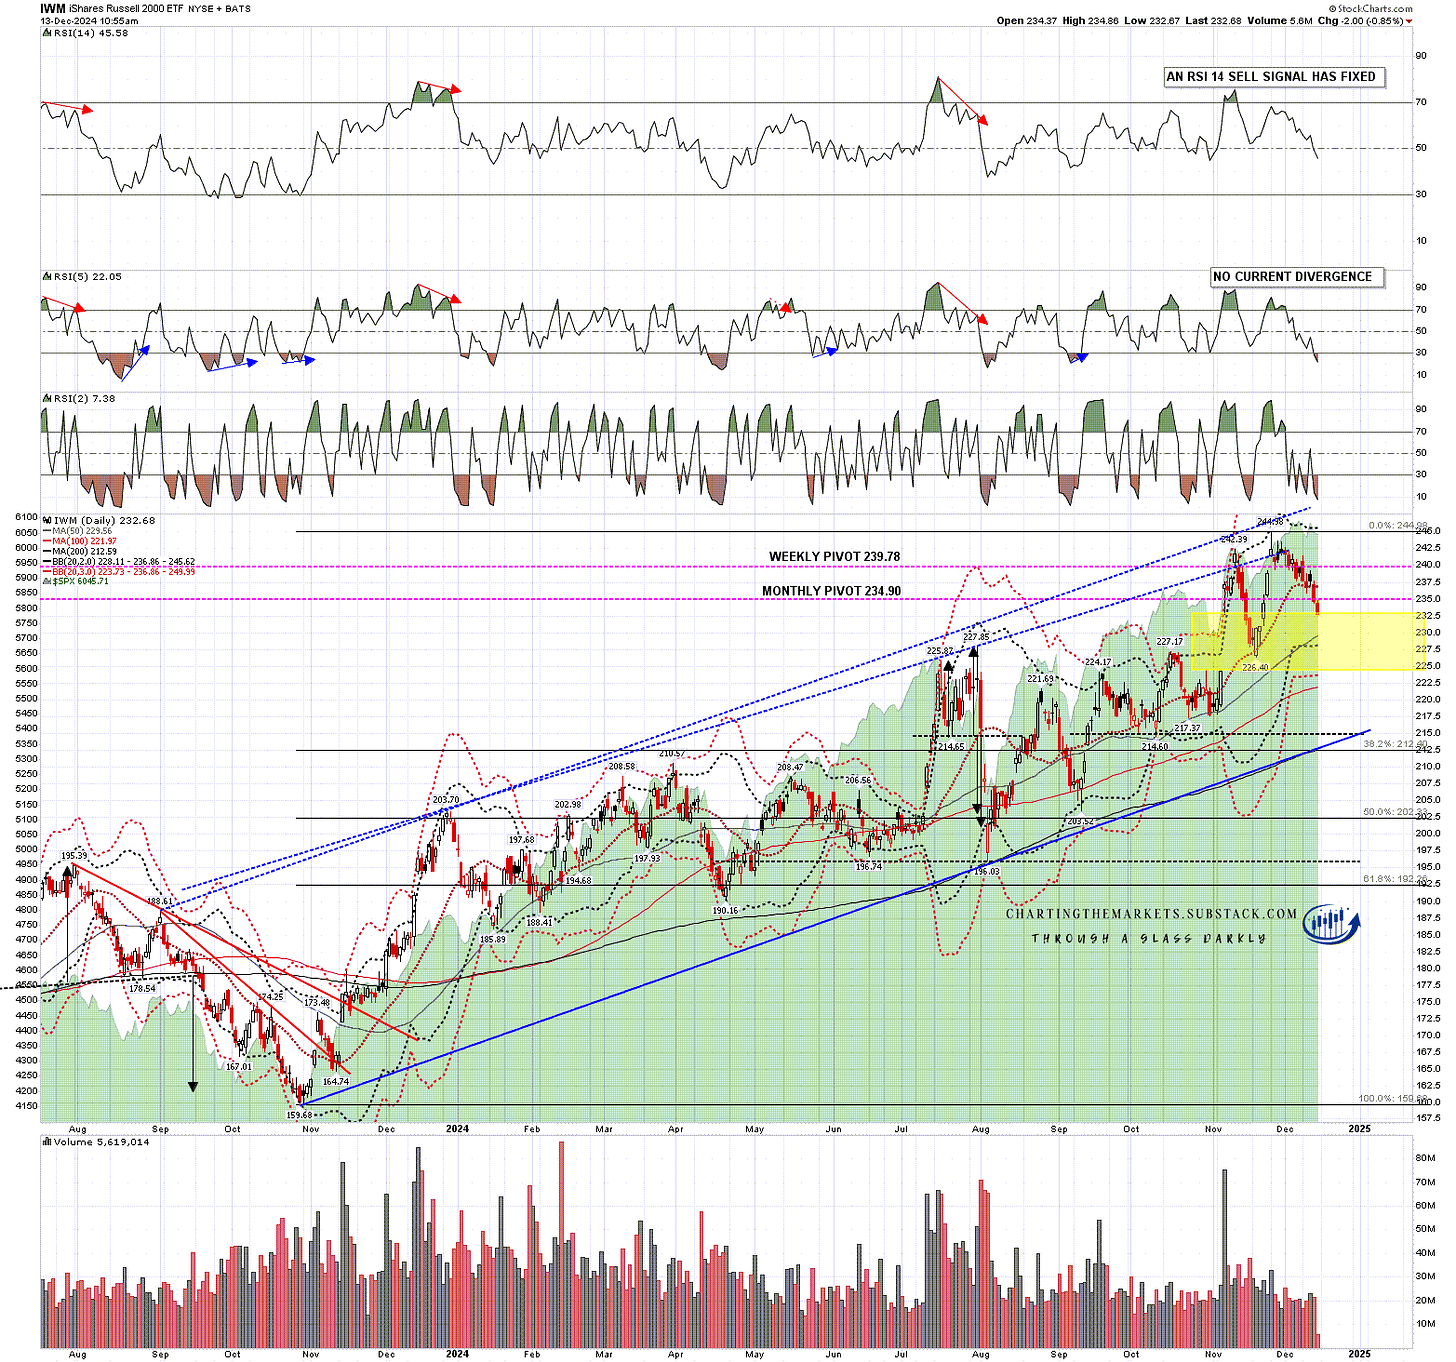
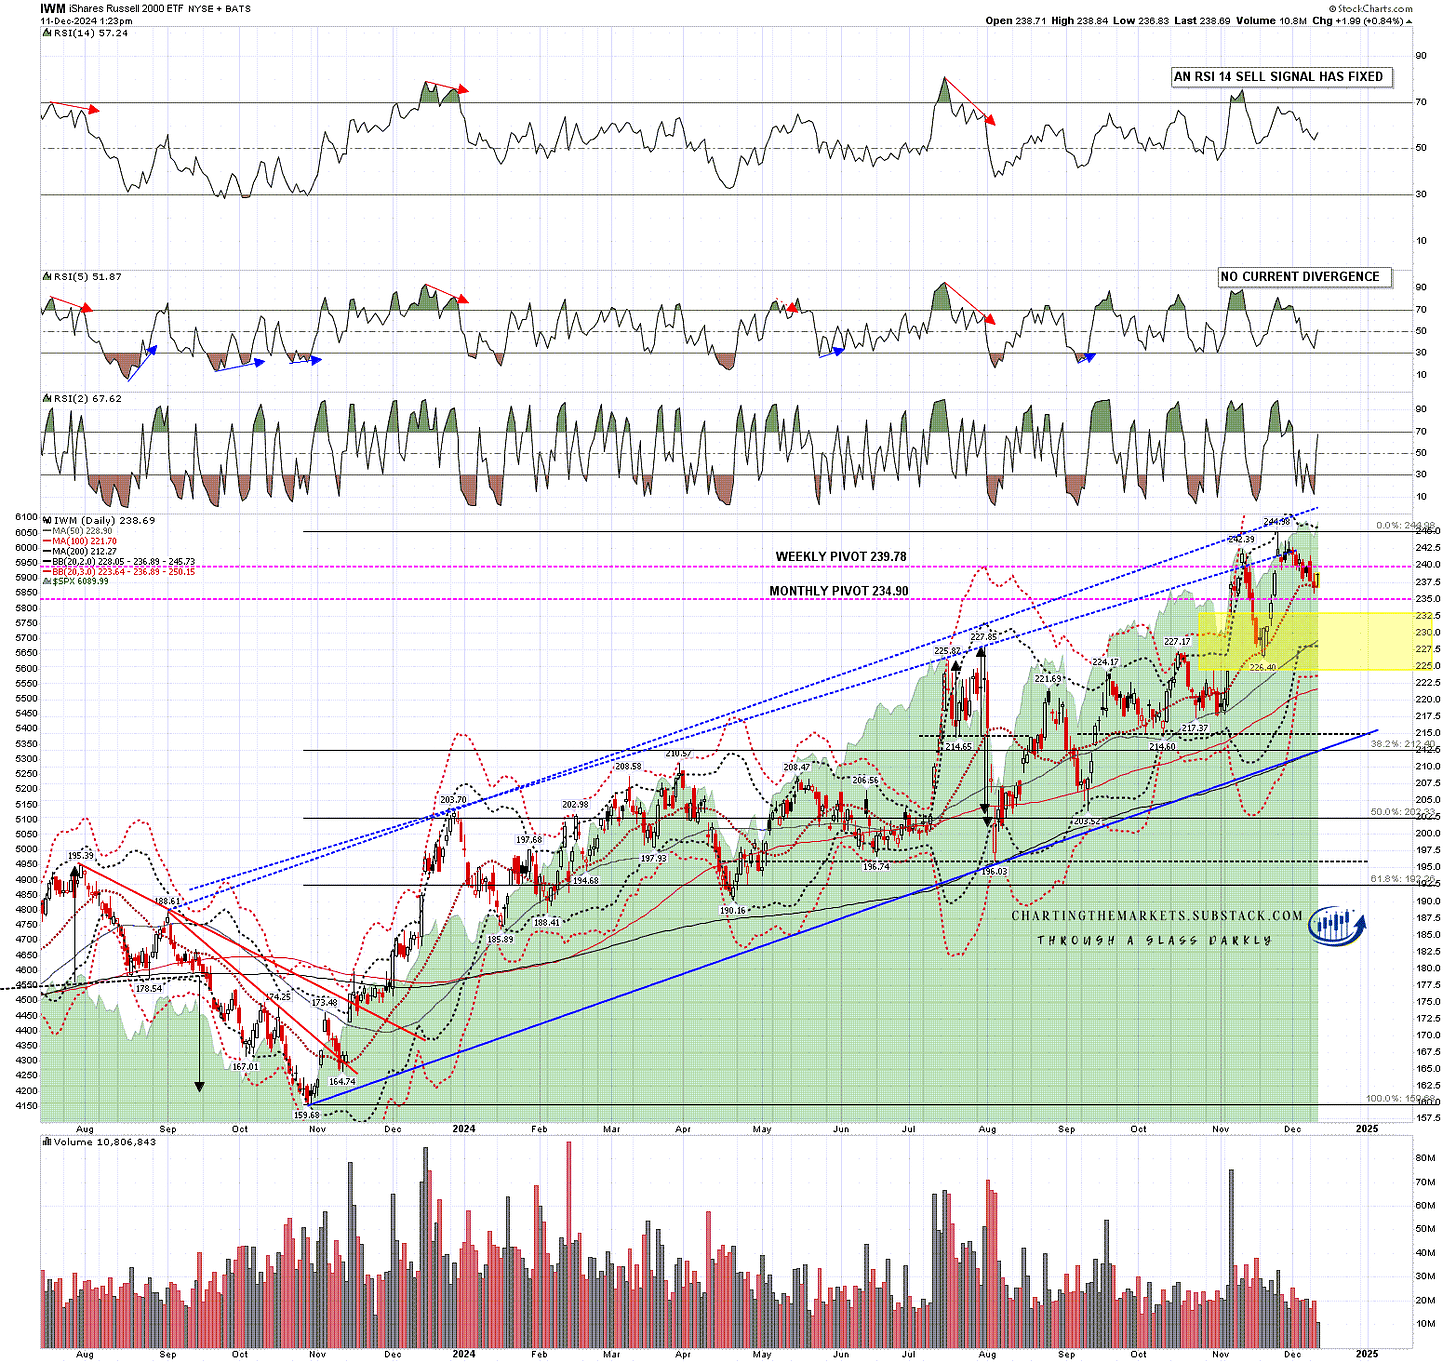
IWM is testing the monthly pivot at 234.90 and, on a break below, the next support levels are at the daily lower band, currently at 237, and the mid-November low at 217.37. Rising support from the Oct 2023 low, currently in the 213 area, could be a target but there’s no current reason to think it is.

IWM daily chart:

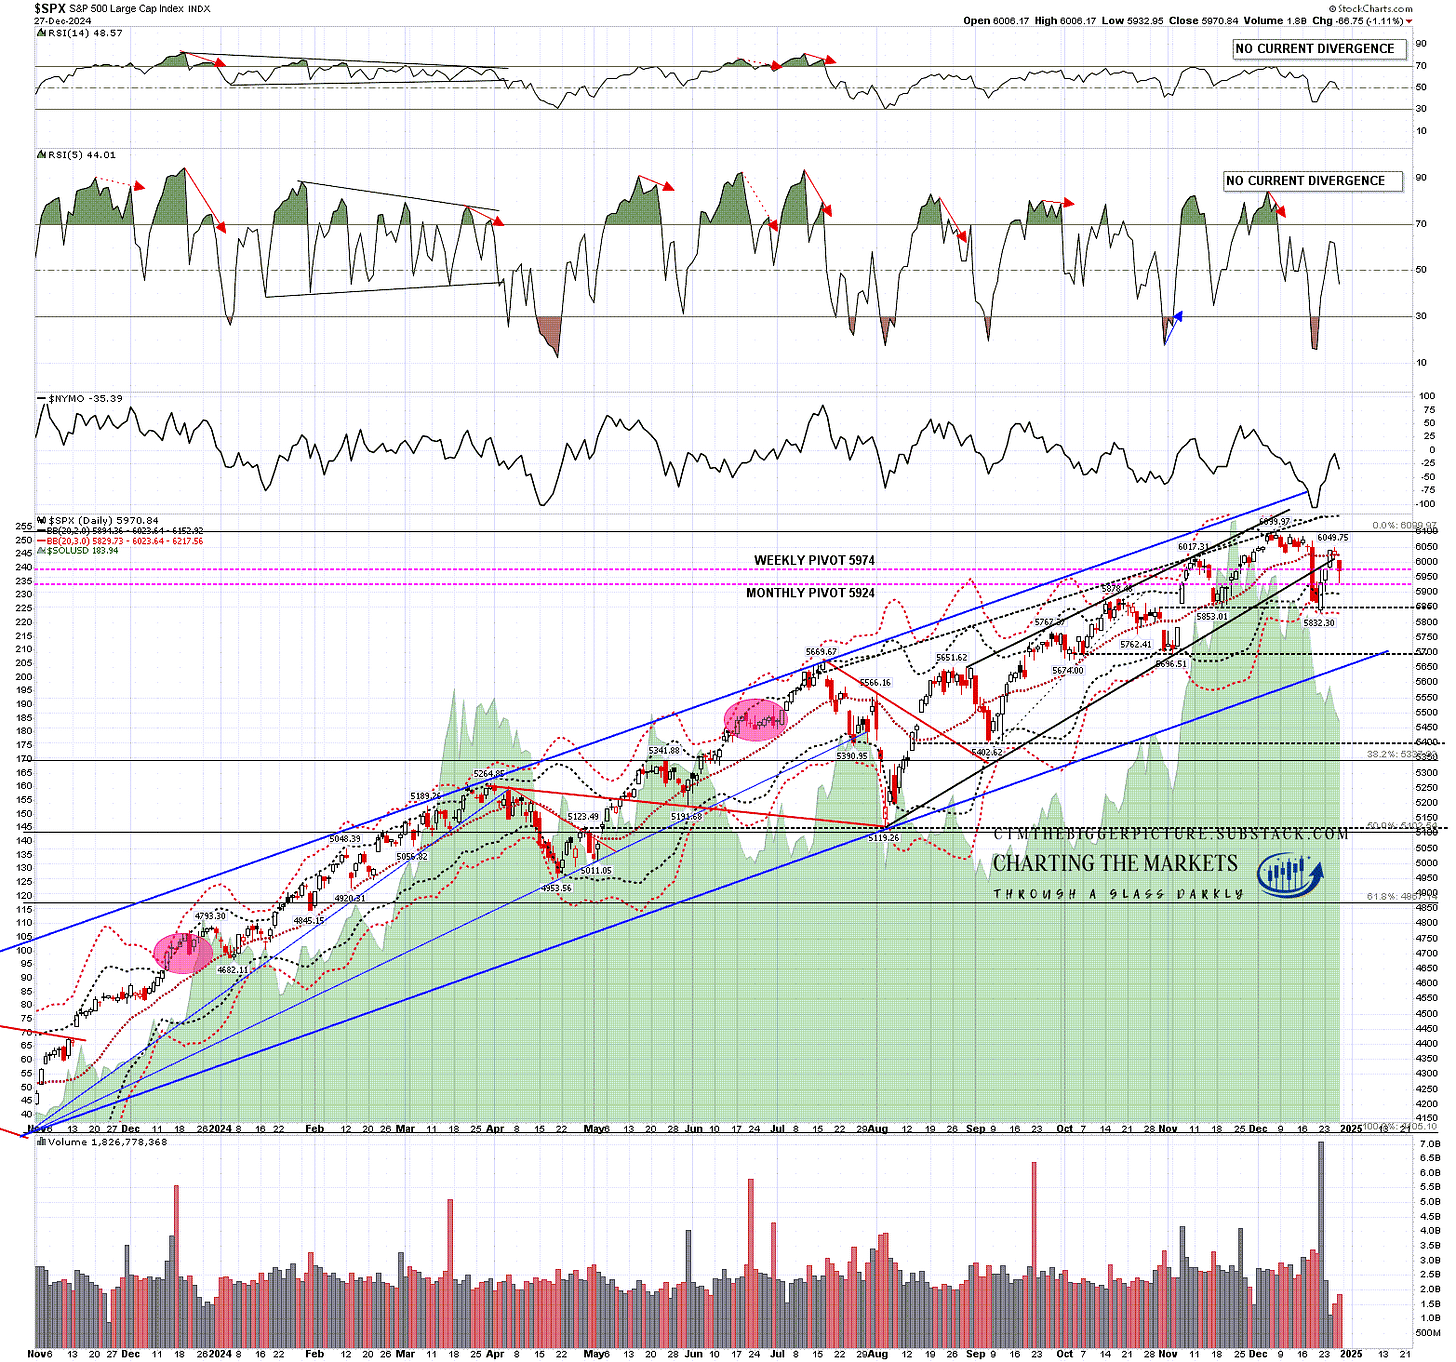
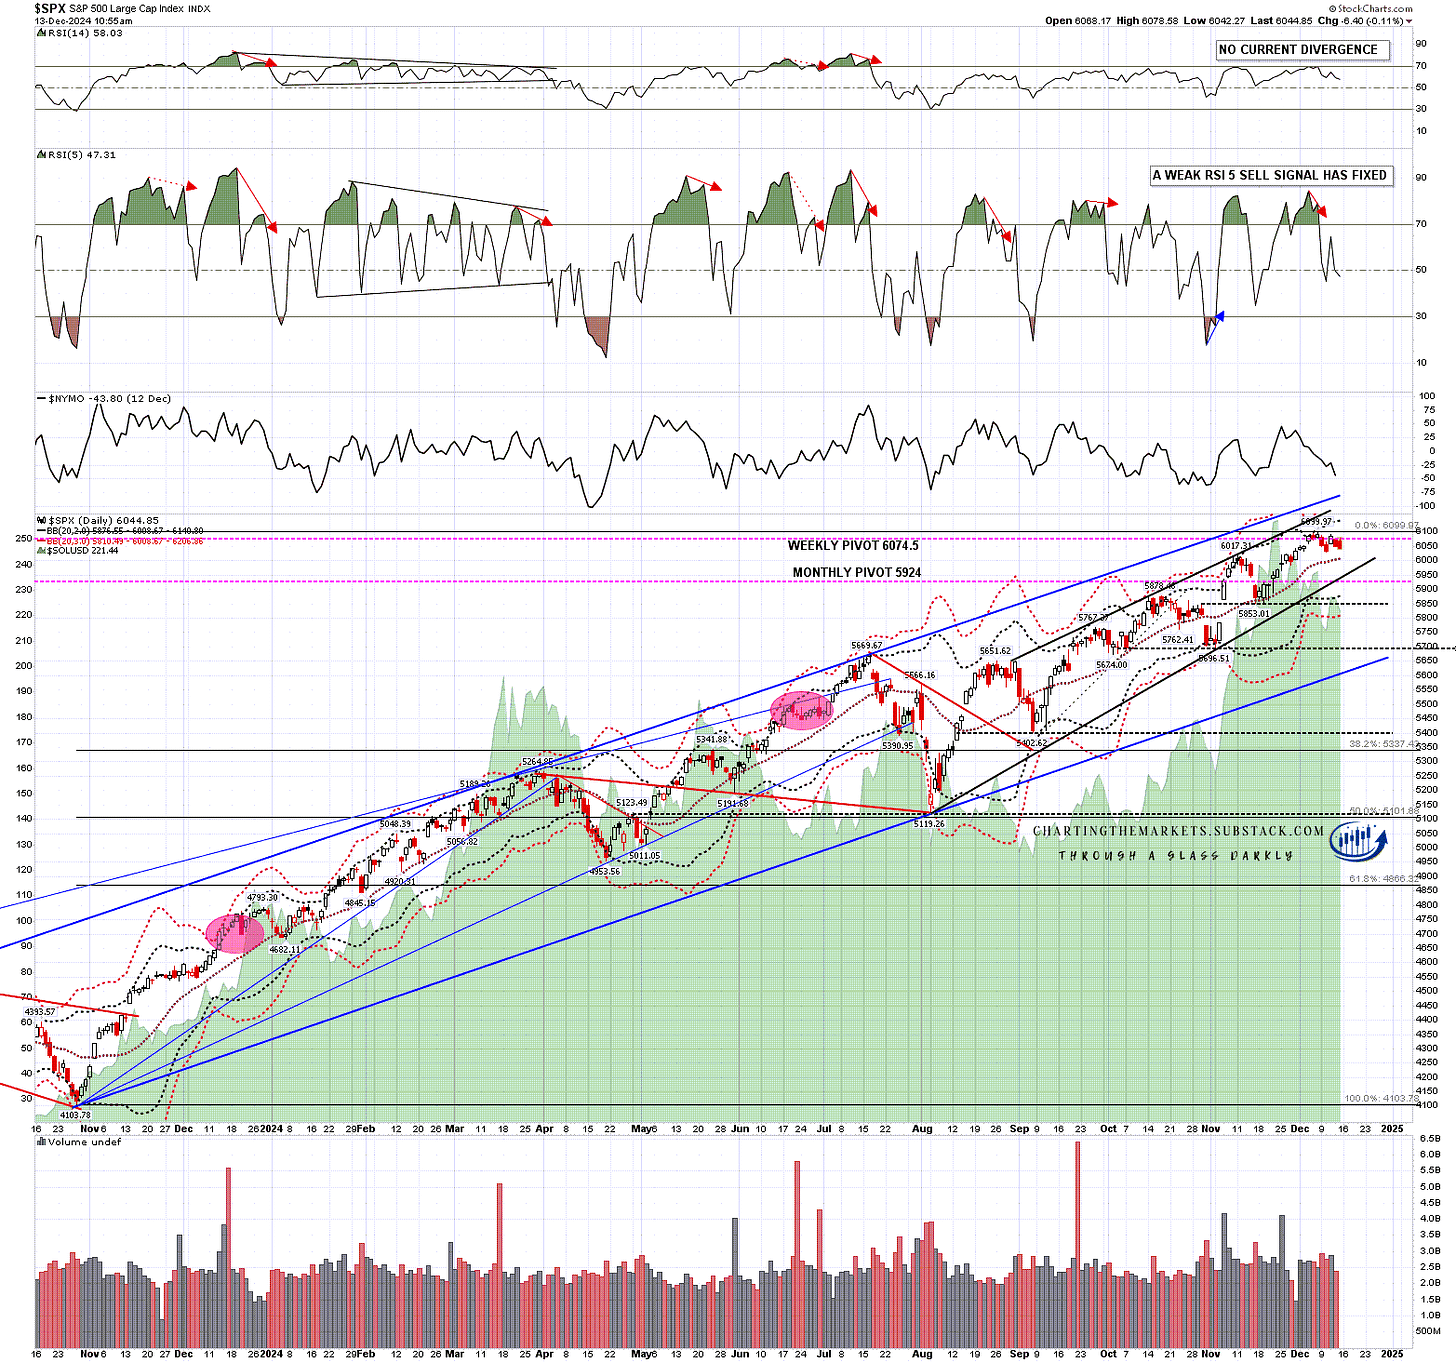
SPX hasn’t tested any important support levels yet and the obvious levels below are the daily middle band, currently at 6008, rising support from the August low in the 5950 area, the middle and early November lows at 5853 and 5696 respectively, then the main rising support trendline from the October 2023 low, currently in the 5610 area.

SPX daily chart:

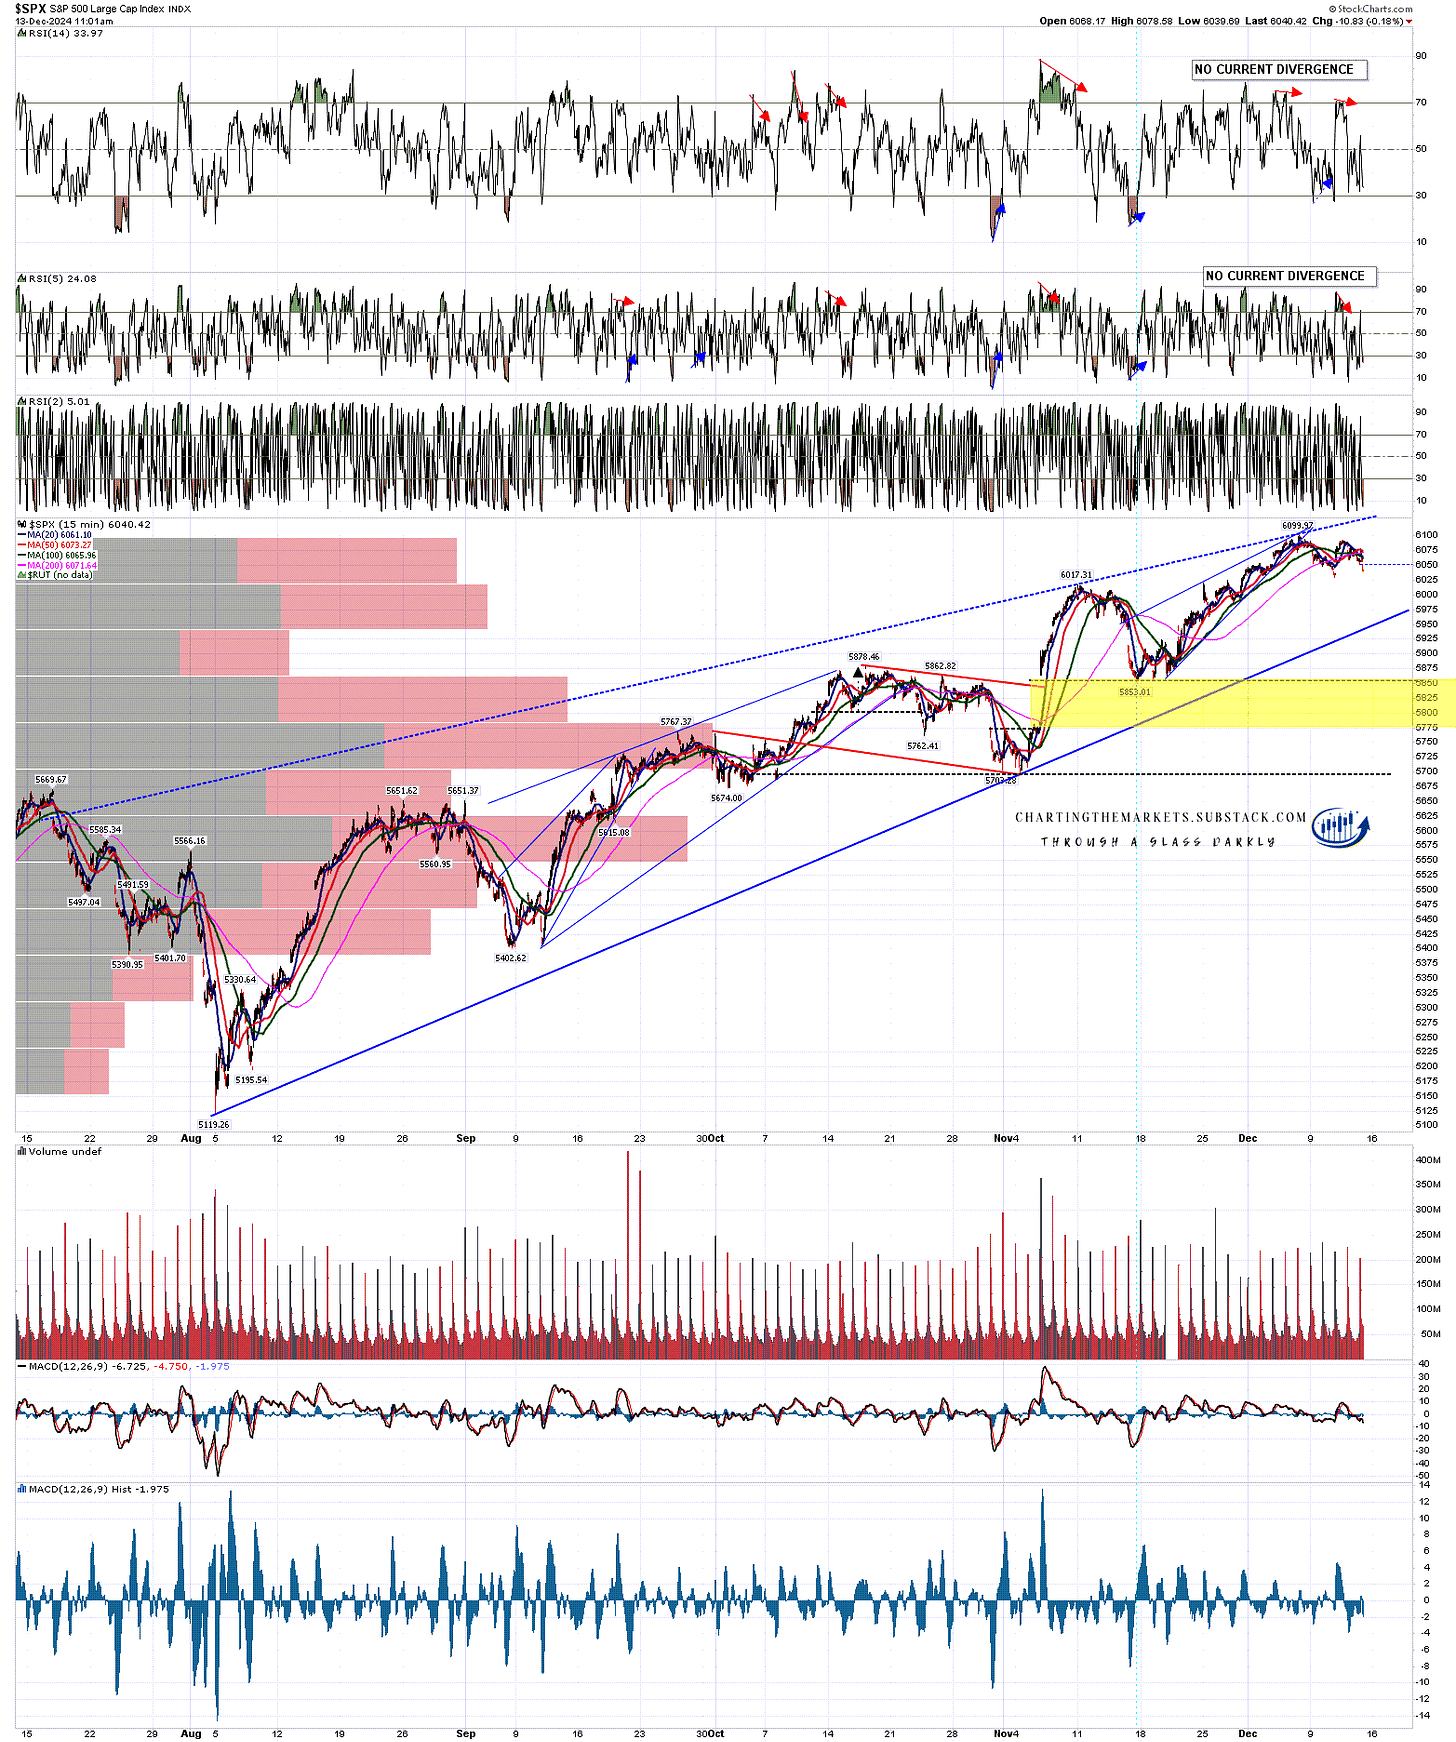
If we are going to see a larger decline there is still a decent case for retesting the all time high on SPX first to set up a small double top.

SPX 15min chart:

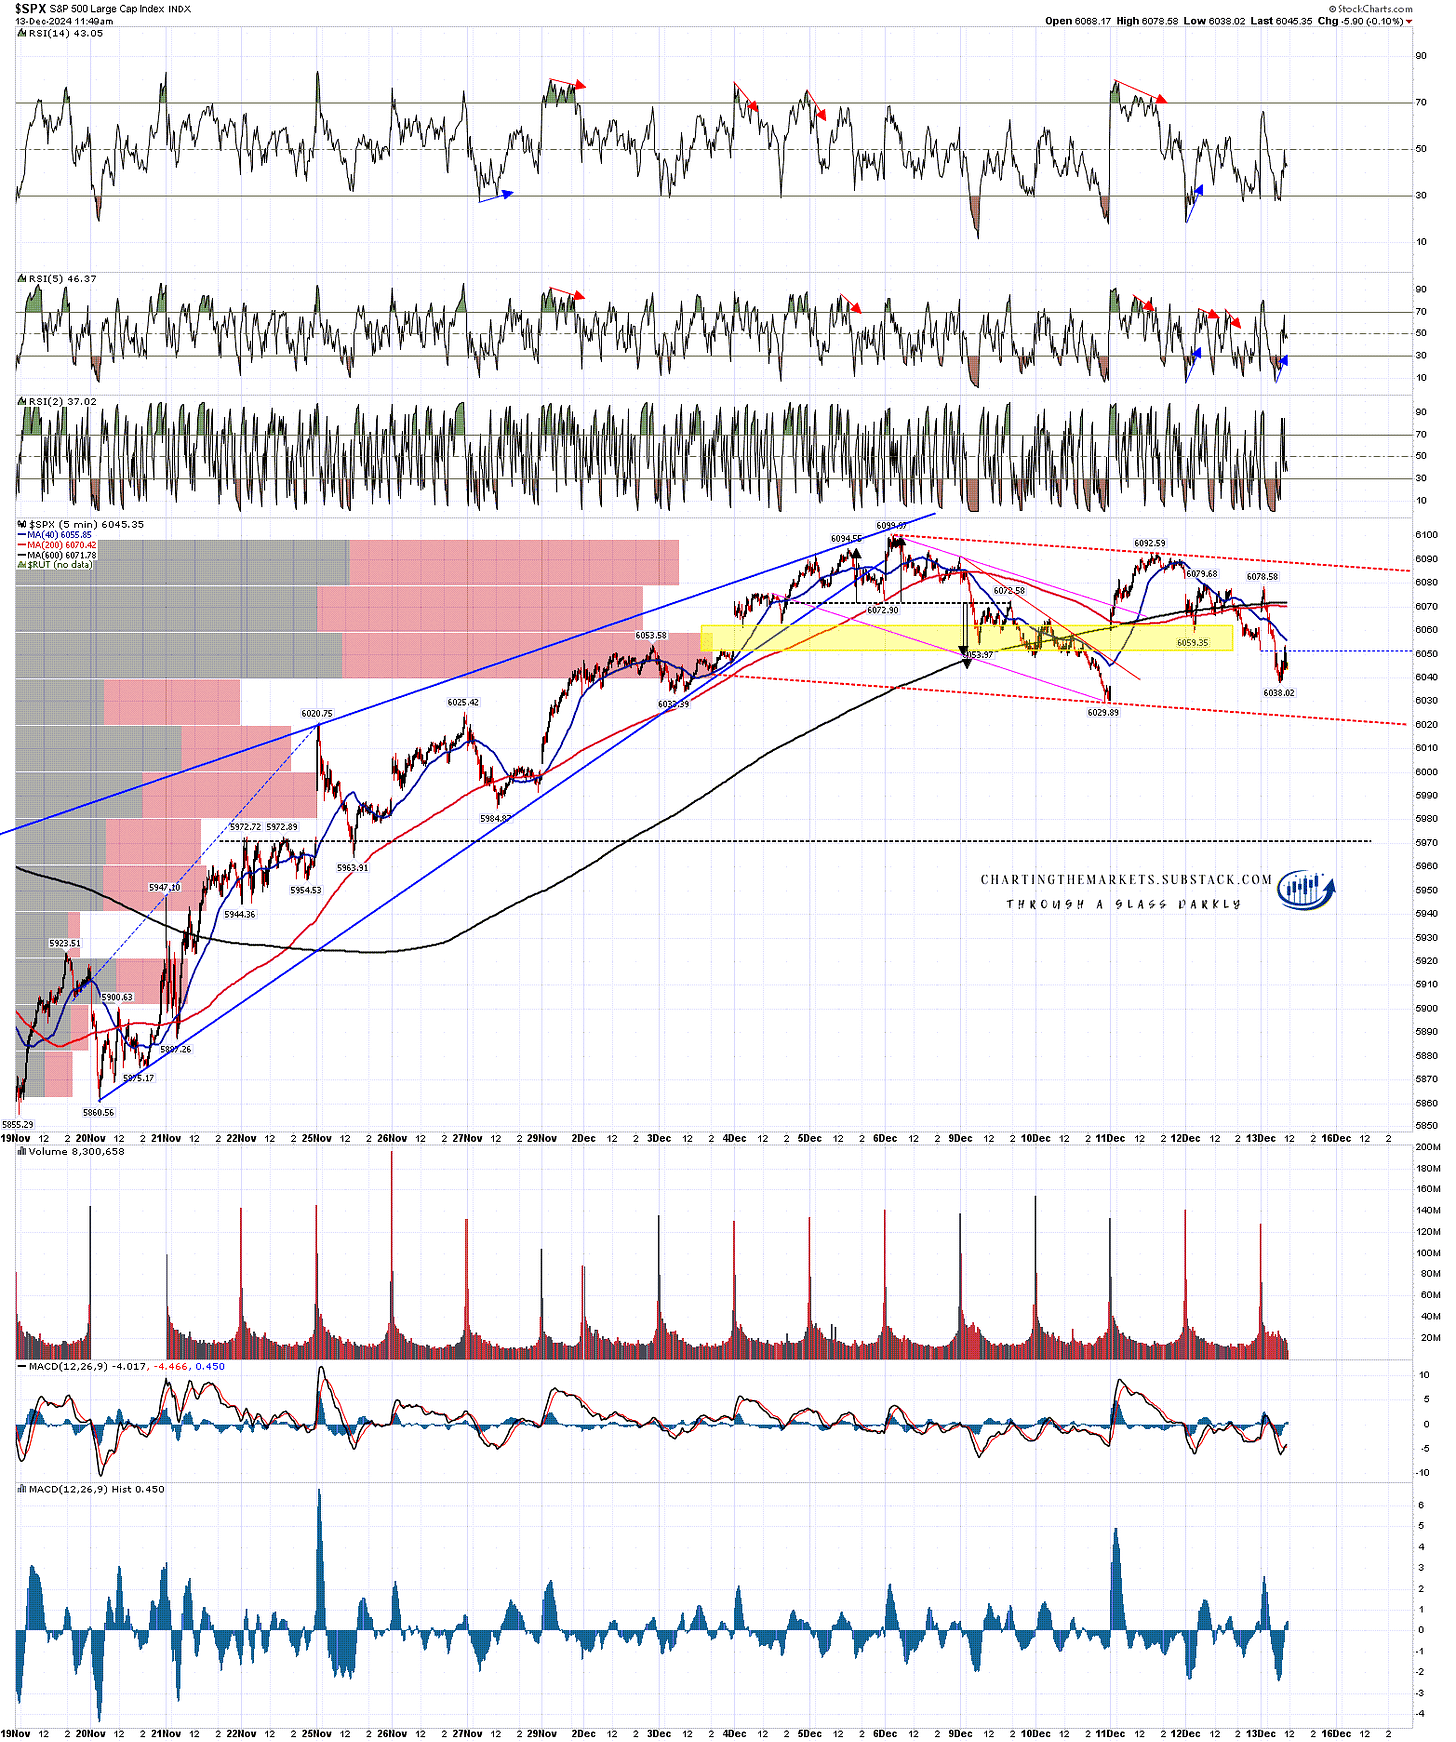
There is a possibility that SPX might be forming a larger bull flag channel to set up that high retest. If so the obvious flag support is currently in the 6023 area.

SPX 5min chart:

I’m expecting some more upside on US indices, maybe into Xmas, and if not then likely into January, though there should be a larger retracement in that period somewhere and that could be starting here.

The closer we come to inauguration the more I’m also going to be looking at the incoming administration and the policies that are being talked about for the first 100 days of the new administration. Tariffs, Ukraine and others may make this one of the most interesting years on the markets that anyone can remember. I am doubtful about equity markets seeing much upside next year as valuations look very stretched going into a year where the news stream is likely to be turbulent, and interest rates may be on an upward track all year. We'll see.

If you like my analysis and would like to see more, please take a free subscription at my chartingthemarkets substack, where I publish these posts first.

I also do a premarket video every day on equity indices, bonds, currencies, energies, precious commodities and other commodities at 8.45am EST. If you’d like to see those I post the links every morning on my twitter, and the videos are posted shortly afterwards on my Youtube channel.

Wednesday, 11 December 2024

Life On Mars

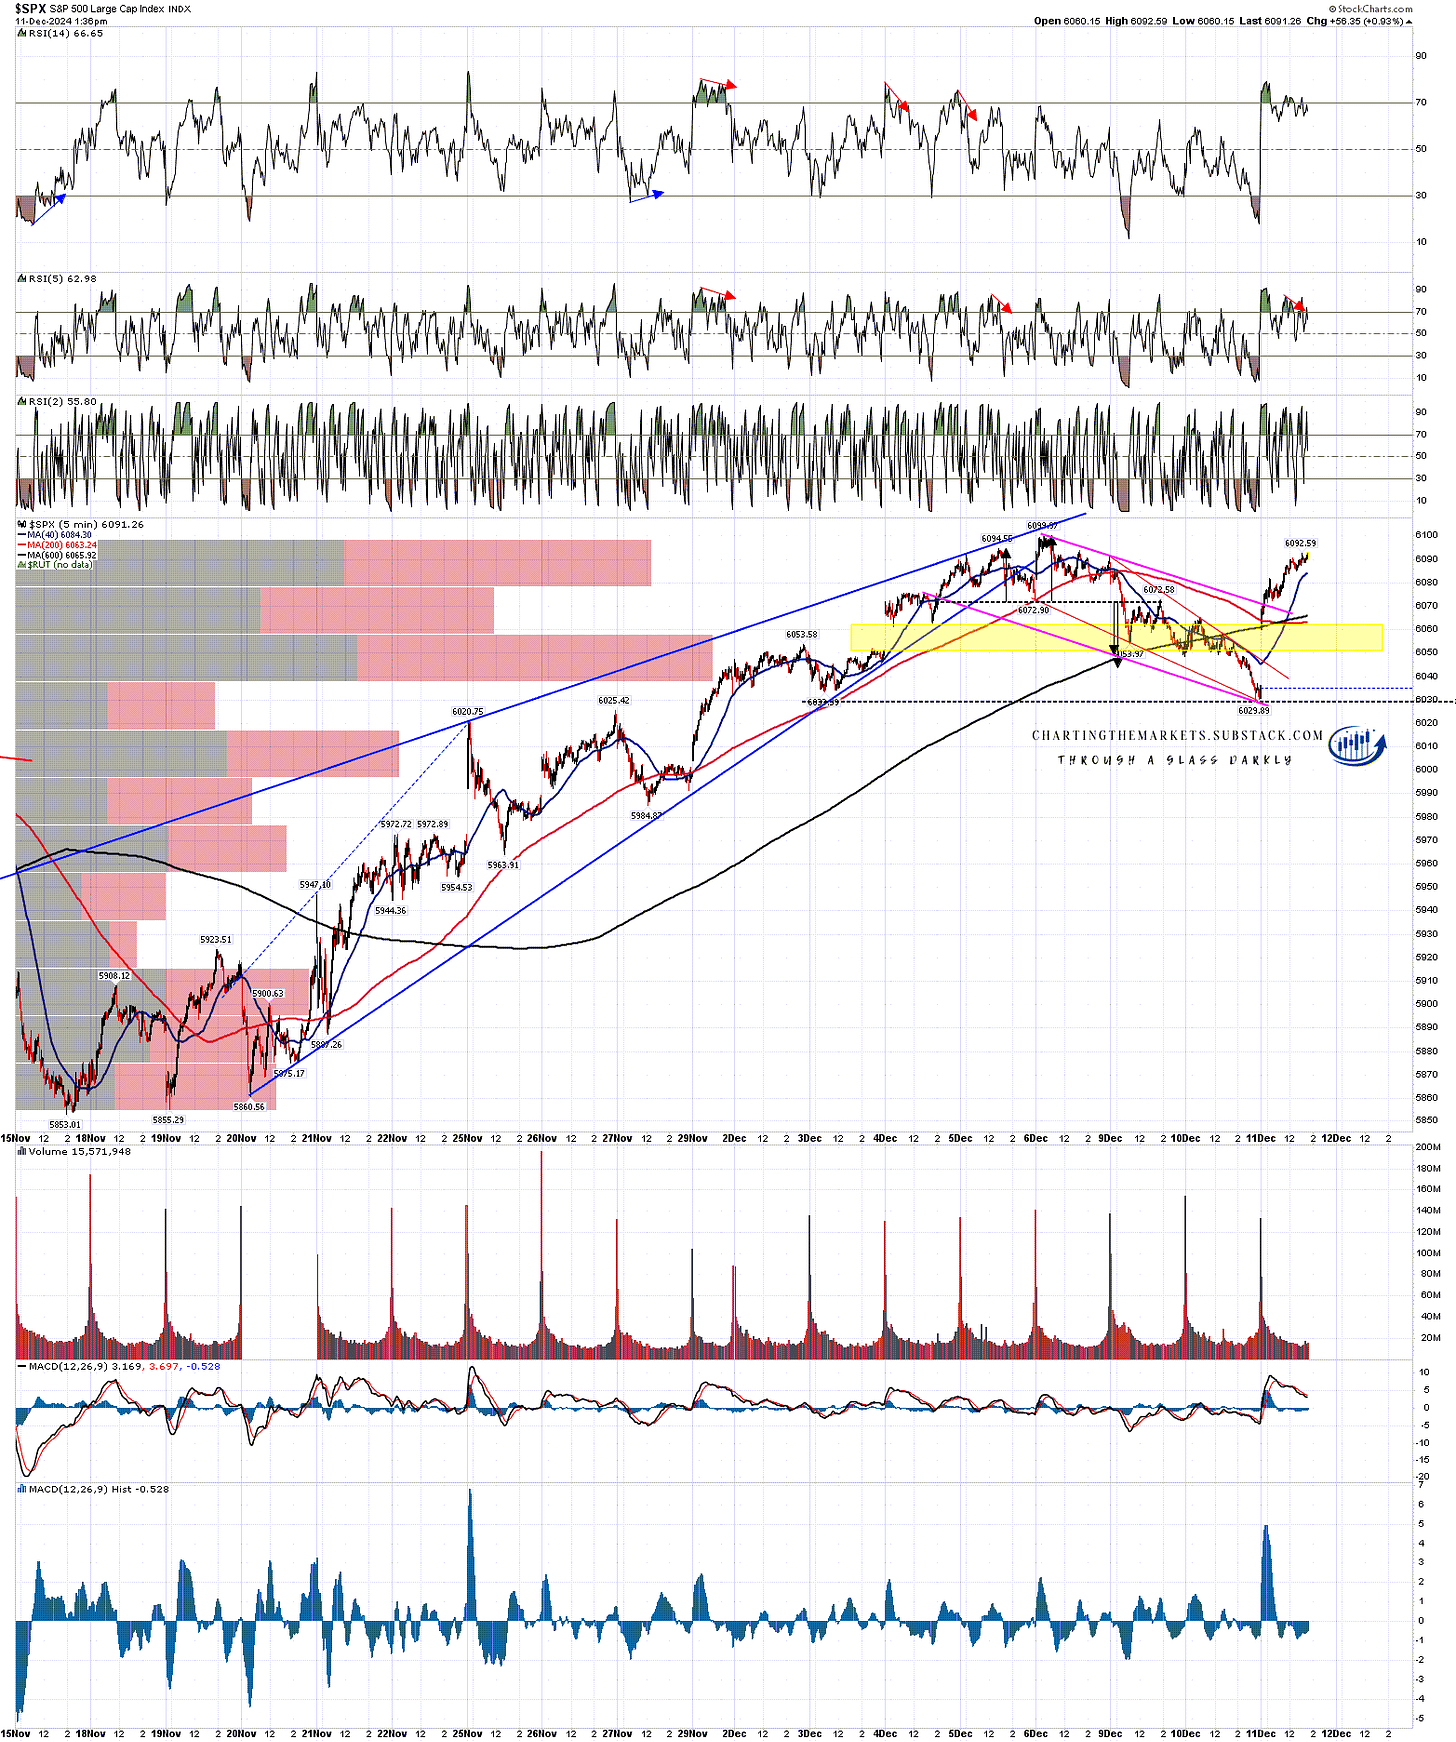
In my post yesterday I was saying that I was expecting SPX to make a low above the 6026 level and the low yesterday was at 6029.89. I was expecting this to be a bullish consolidation and the low established a perfect bull flag channel which broke up with a target at a retest of the all time high at 6099.97. SPX is most of the way to that target.

So far so good.

SPX 5min chart:

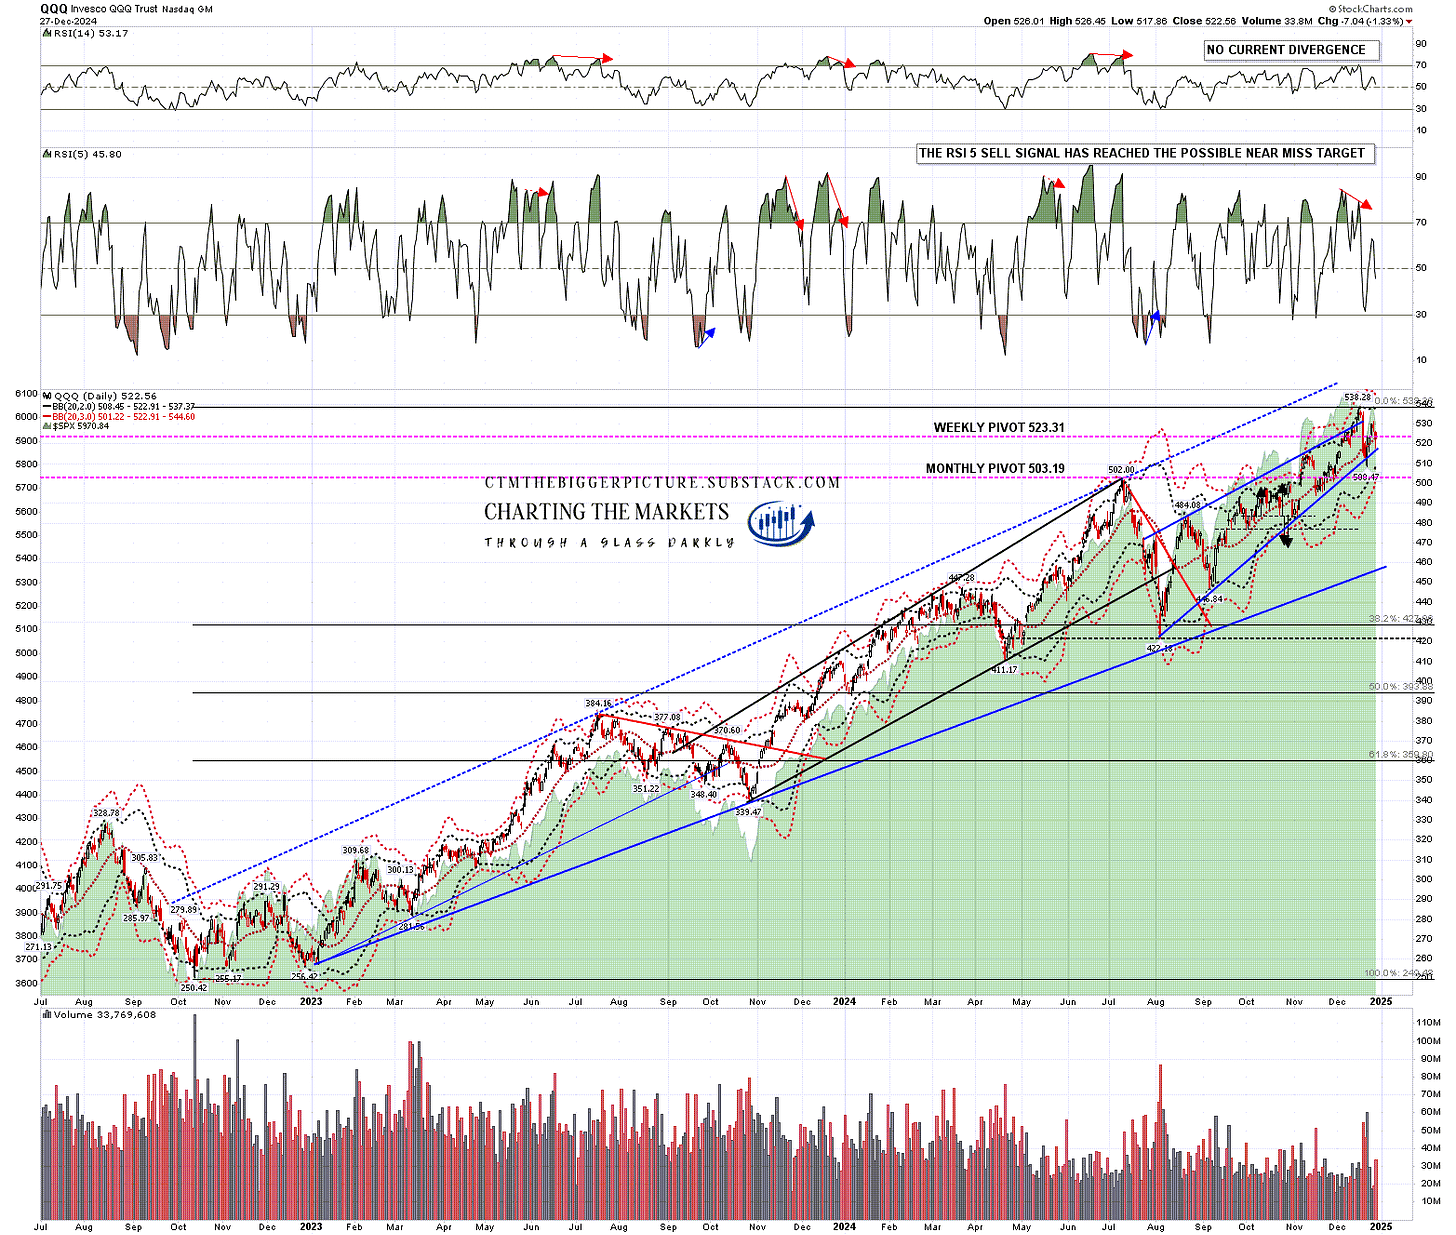
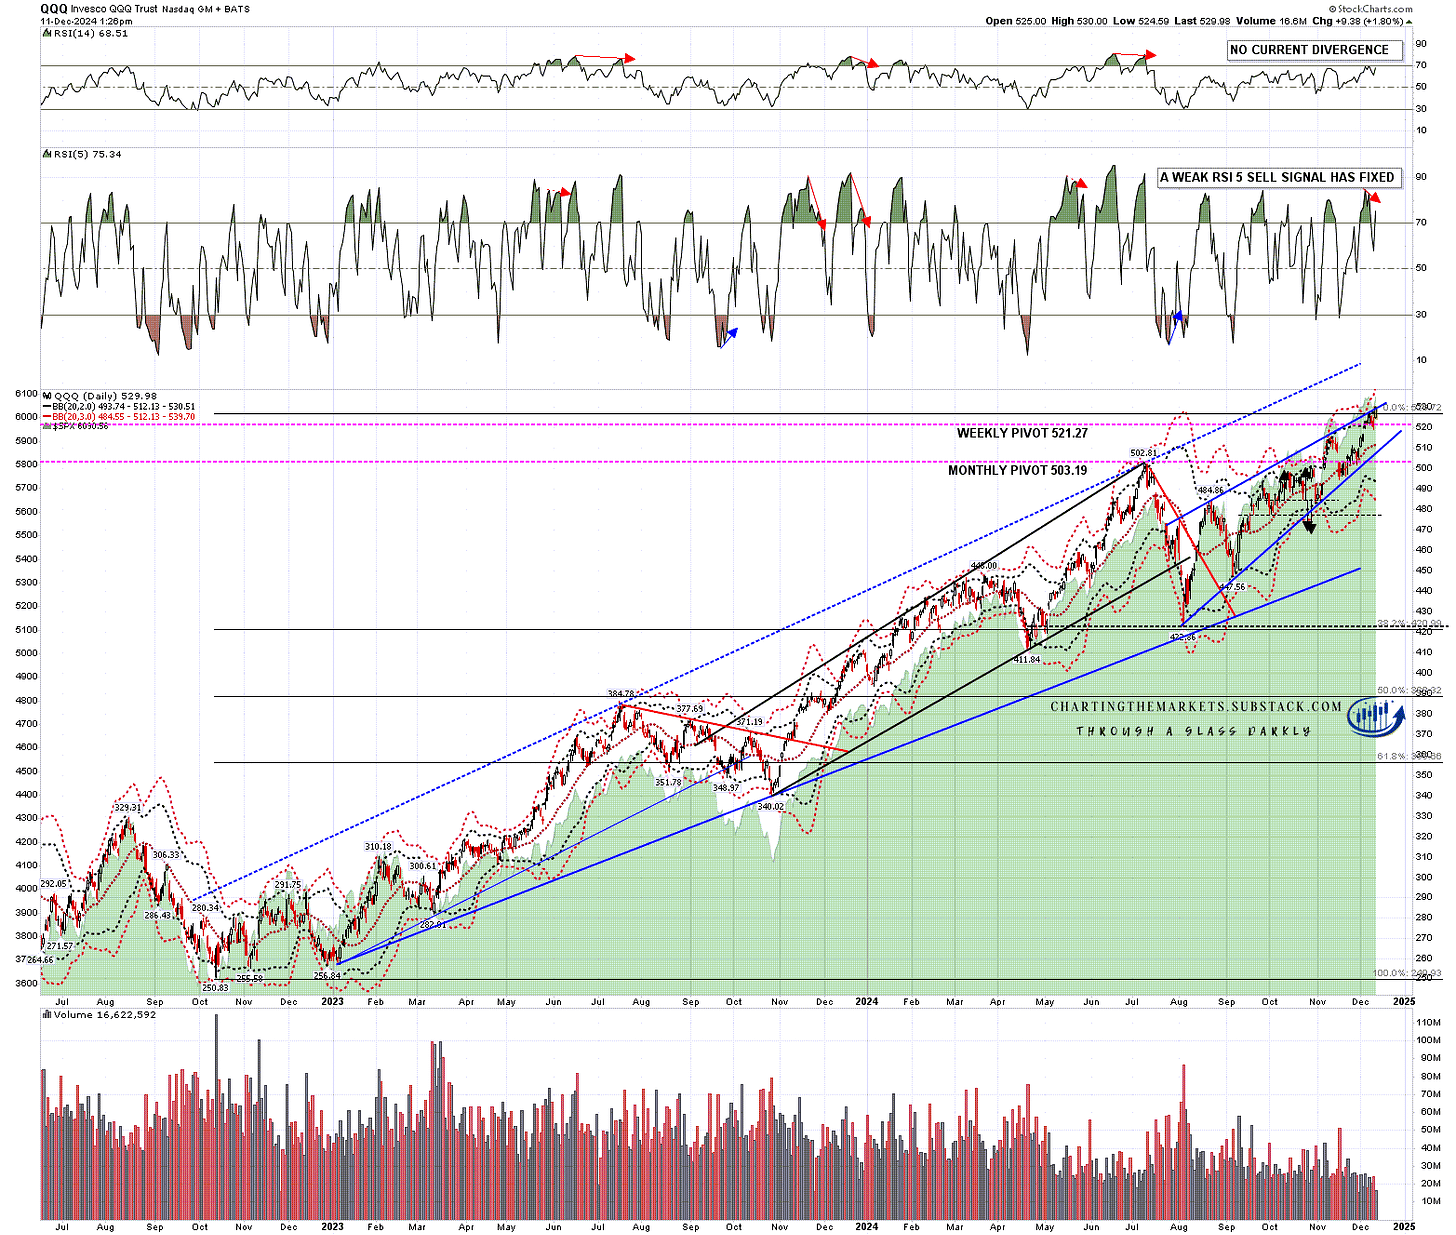
QQQ has led the charge to the upside today and has already made a new all time high.

QQQ daily chart:

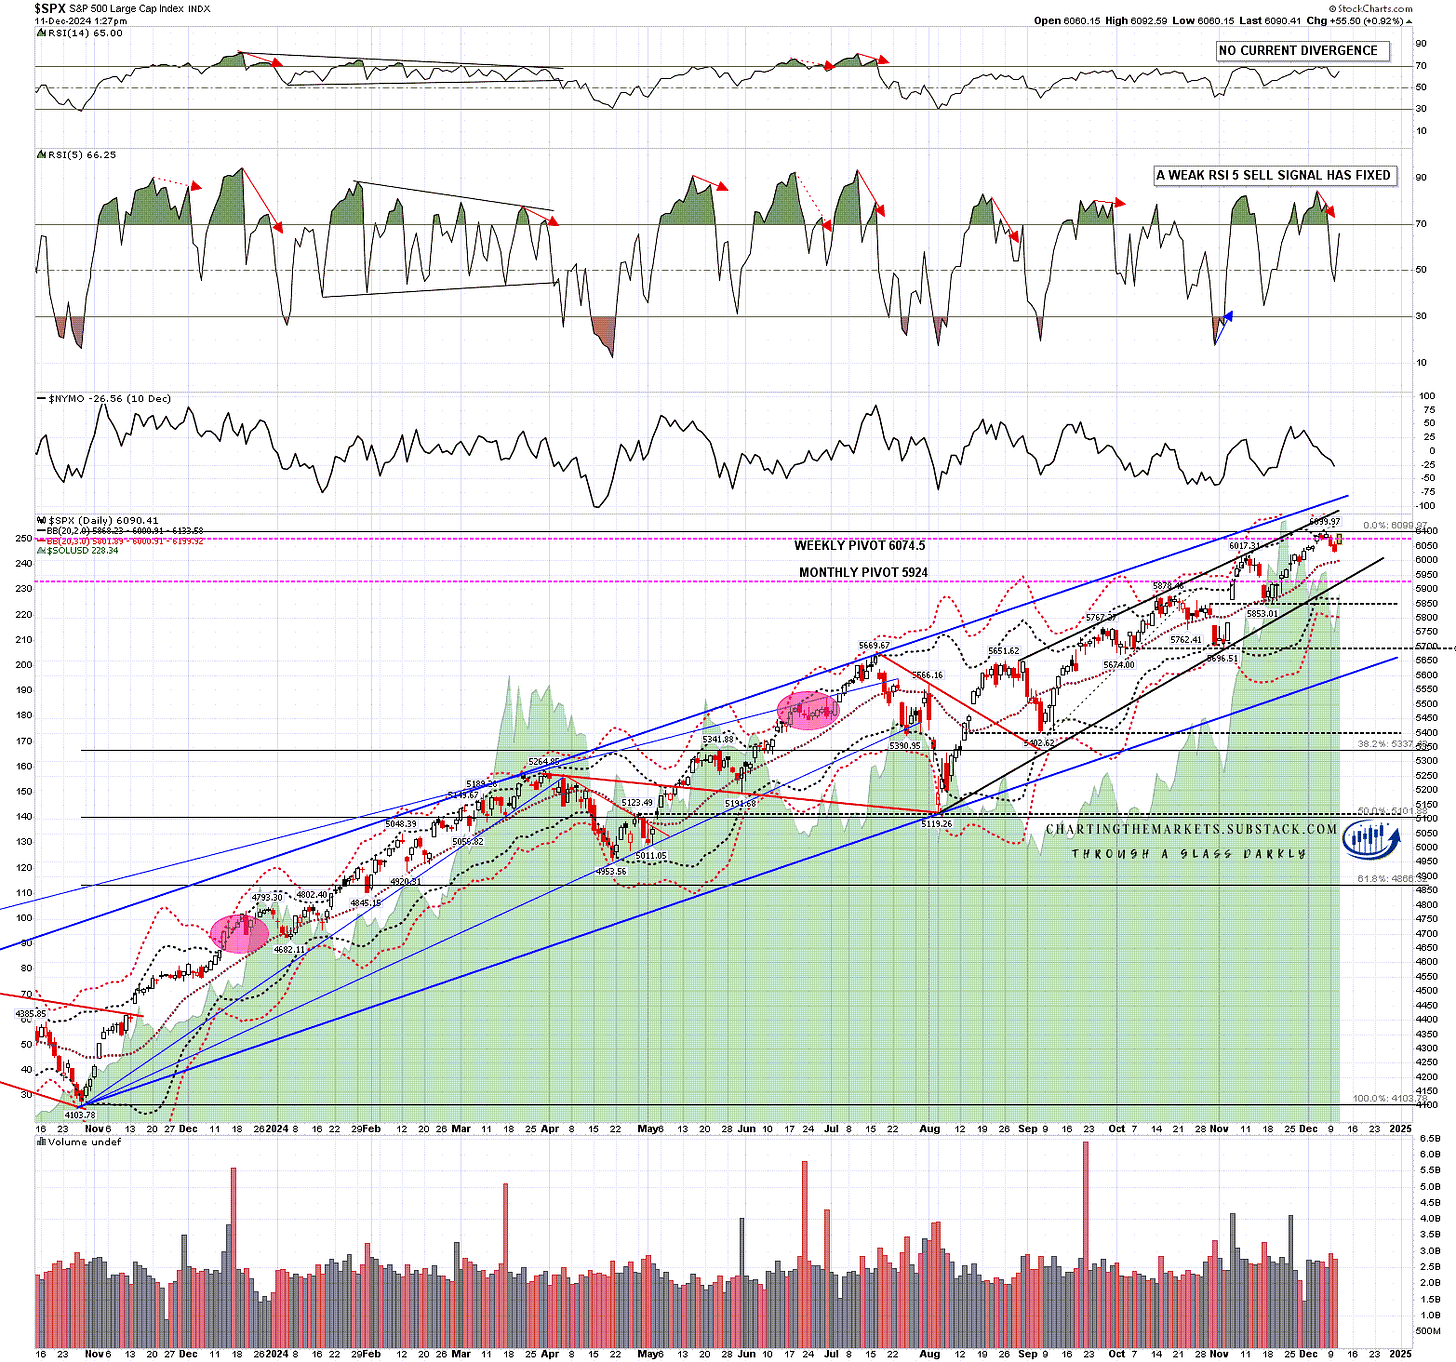
SPX has broken higher and is most of the way back to a new all time high at the time of writing.

SPX daily chart:

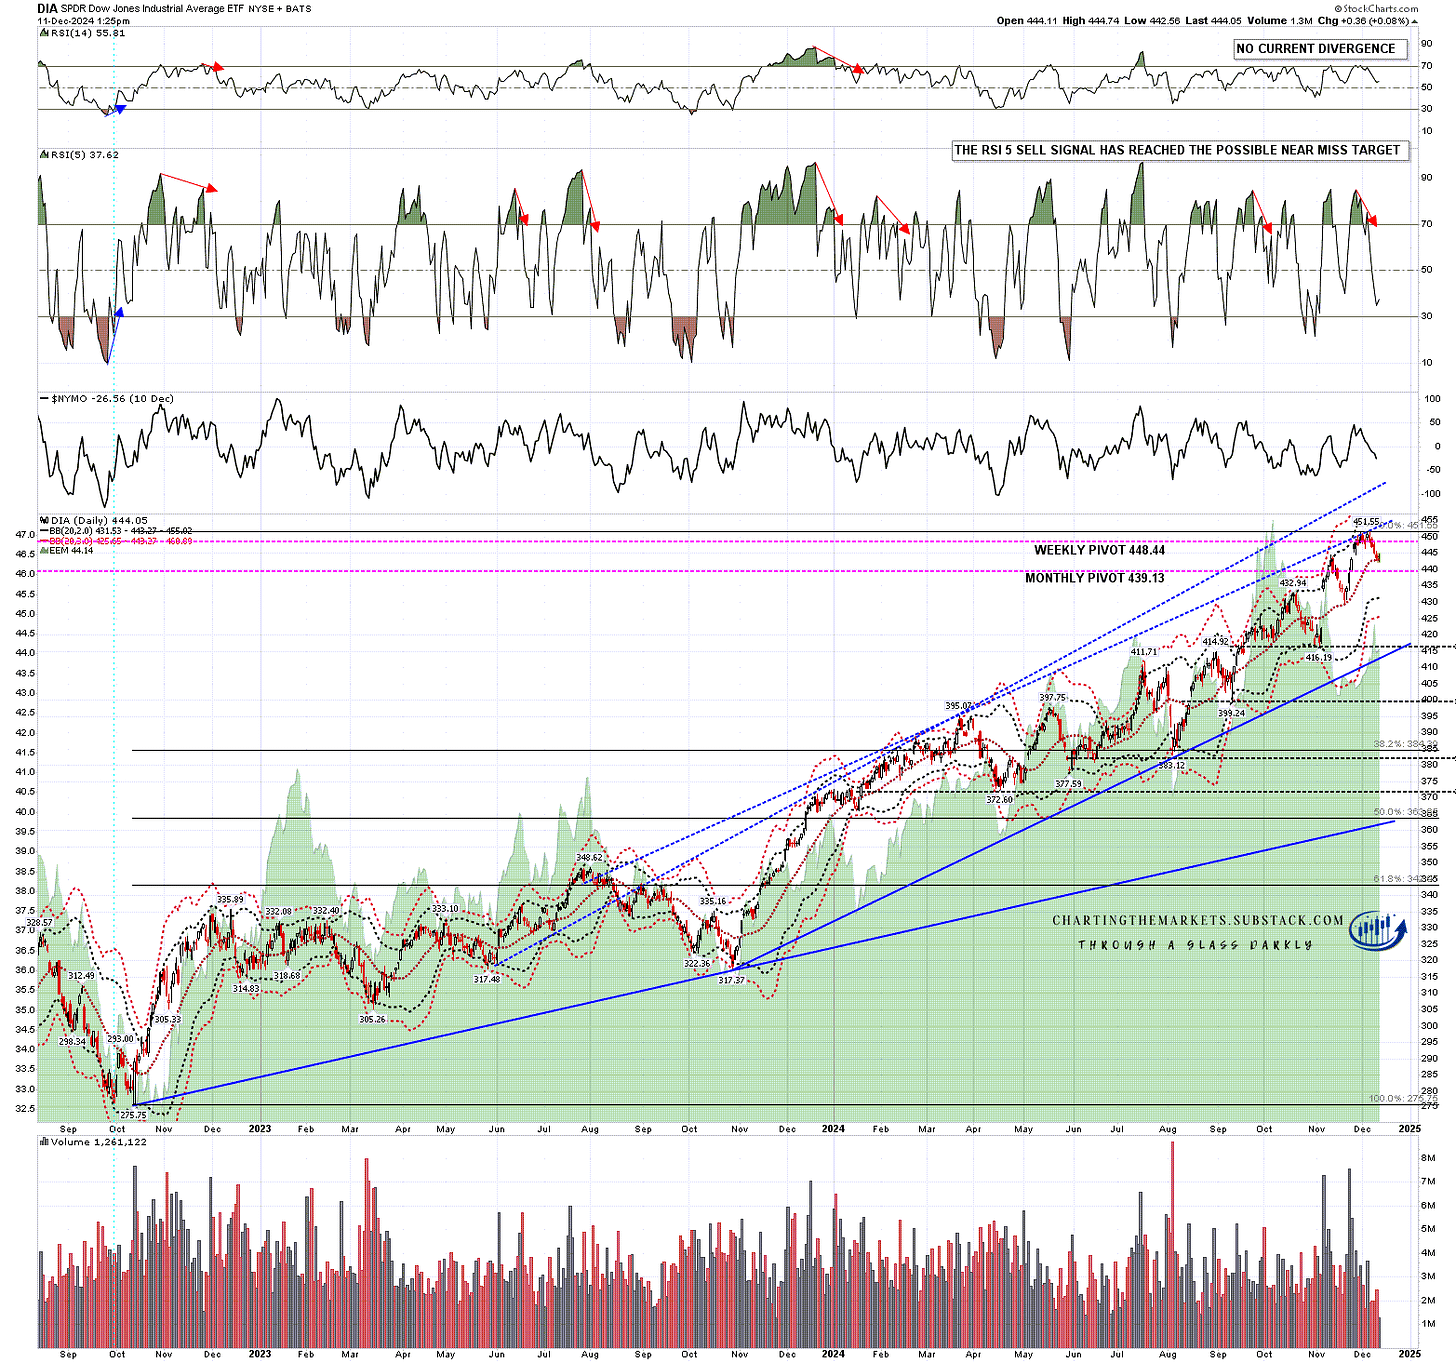
Elsewhere the picture is more cloudy however. The move down was led by DIA and IWM, both of which tested and have held support so far at the daily middle bands. The next obvious targets are retests of the highs on both but so far today both have barely moved off the low. They aren’t going down, but they’ve barely gone up.

The problem with DIA and IWM being on another planet today is that increases the possibility that they are trading sideways through this move, mainly confined to tech stocks, and that after that ends they will resume the downtrend and start doing some significant technical damage. That raises the possibility that the larger retracement that I have pencilled in for late Dec or early Jan could be in progress now, with SPX and NDX topping out here before following the others down.

DIA daily chart:

On IWM the picture is similar, though my eye is drawn to the very nice looking double top that may be about to try to play out if DIA and IWM can’t get off the mat soon.

What I would say here is that there is still a lovely bull flag setup on both RTY and IWM, and until that breaks there is still a very decent chance that will power a strong move into Xmas, but I am concerned about what I’m seeing today.

IWM daily chart:

The US equity indices have finally had a decent run from the 15th November low and in the absence of further evidence to the contrary, I’m expecting more upside into Xmas, and likely into January, though there should be a larger retracement in that period somewhere. I’m watching DIA and IWM very carefully here to see whether that roadmap might fail here.

The closer we come to inauguration the more I’m also going to be looking at the incoming administration and the policies that are being talked about for the first 100 days of the new administration. Tariffs, Ukraine and others may make this one of the most interesting years on the markets that anyone can remember.

I have to be out tomorrow and won’t be back until late in the day. My next premarket video will therefore be on Friday morning.

If you like my analysis and would like to see more, please take a free subscription at my chartingthemarkets substack, where I publish these posts first.

I also do a premarket video every day on equity indices, bonds, currencies, energies, precious commodities and other commodities at 8.45am EST. If you’d like to see those I post the links every morning on my twitter, and the videos are posted shortly afterwards on my Youtube channel.

Watching The Solana Bull Flag

In my last post on Monday I was looking at the possibility that a bull flag channel might well be forming on Solana, and that delivered beautifully. Not everyone saw the post of course as you can see from a tweet I saw last night:

Solana (SOLUSD) reached the daily 3sd lower band, often a good area to look for a reversal, tested that twice and has rejected higher. Key resistance remains at the daily middle band, currently at 236, which has held as resistance at the close each day for the last ten days. That needs to be broken and converted to support to clear the path for Solana to retest the all time high.

CTM Crypto Substack is a reader-supported publication. To receive new posts and support my work, consider becoming a free or paid subscriber.

SOLUSD daily chart:

On the 15min chart the possible bull flag channel setup I posted on Monday formed and a double bottom formed at the low retest. That double bottom has now broken up with a target in the 237.5 to 240 area, in effect a retest of bull flag resistance, currently in the 239.5 area.

SOLUSD 15min chart:

On Bitcoin (BTCUSD) I was suggesting last Thursday that the hit of the daily 3sd upper band at 104k might well deliver some consolidation before going higher and we’ve been seeing that.

Bitcoin backtested the daily middle band and held it. The obvious next target would be a retest of the all time high.

BTCUSD daily chart:

On the 15min chart there was no obvious pattern but this was a triangle type contracting bullish consolidation, and declining resistance broke this morning. It’s possible a larger flag could form with a lower low first, but overall that doesn’t seem likely.

BTCUSD 15min chart:

Both Bitcoin and Solana had daily RSI 14 sell signals fix last week of course, and Ethereum (ETHUSD) also had one fix yesterday, so now all three have fixed daily RSI 14 sell signals. These are likely signalling a larger retracement coming in the first months of next year

In the short term Ethereum backtested the daily middle band on this retracement and held it. As long as that remains the case the next obvious target is a retest of the 2024 high at 4095.77, with an eye on the next big target, which is a retest of the 2021 all time high at 4865.94.

ETHUSD daily chart:

On the Ethereum 15min chart a double bottom formed at the low and has broken up with a target in the 4050 area, just below the 2024 high. I’d expect this to at minimum run on into a new 2024 high.

ETHUSD 15min chart:

On the bigger picture I’m leaning bullish across the board with the caveat that the fixed daily RSI 14 sell signals on Bitcoin, Solana and Ethereum are warning that a longer and deeper consolidation may be coming within a few weeks.

I have to be out tomorrow and won’t be back until late in the day. My next premarket video will therefore be on Friday morning.

If you’d like to see more of these posts and the other Crypto videos and information I post, please subscribe for free to my Crypto substack.

I do a premarket video every day on Crypto at 9.15am EST. If you’d like to see those I post the links every morning on my twitter, and the videos are posted shortly afterwards on my Youtube channel.

I'm also to be found at Arion Partners, though as a student rather than as a teacher. I've been charting Crypto for some years now, but am learning to trade and invest in them directly, and Arion Partners are my guide around a space that might reasonably be compared to the Wild West in one of their rougher years.

Tuesday, 10 December 2024

A Pause For Breath

In my premarket video yesterday morning I was looking at the large number of short term sell signs across the equity indices and making the case for a modest retracement before going higher. We’ve seen that modest retracement and might go a bit lower, but a reversal back up directly from here may be seen instead.

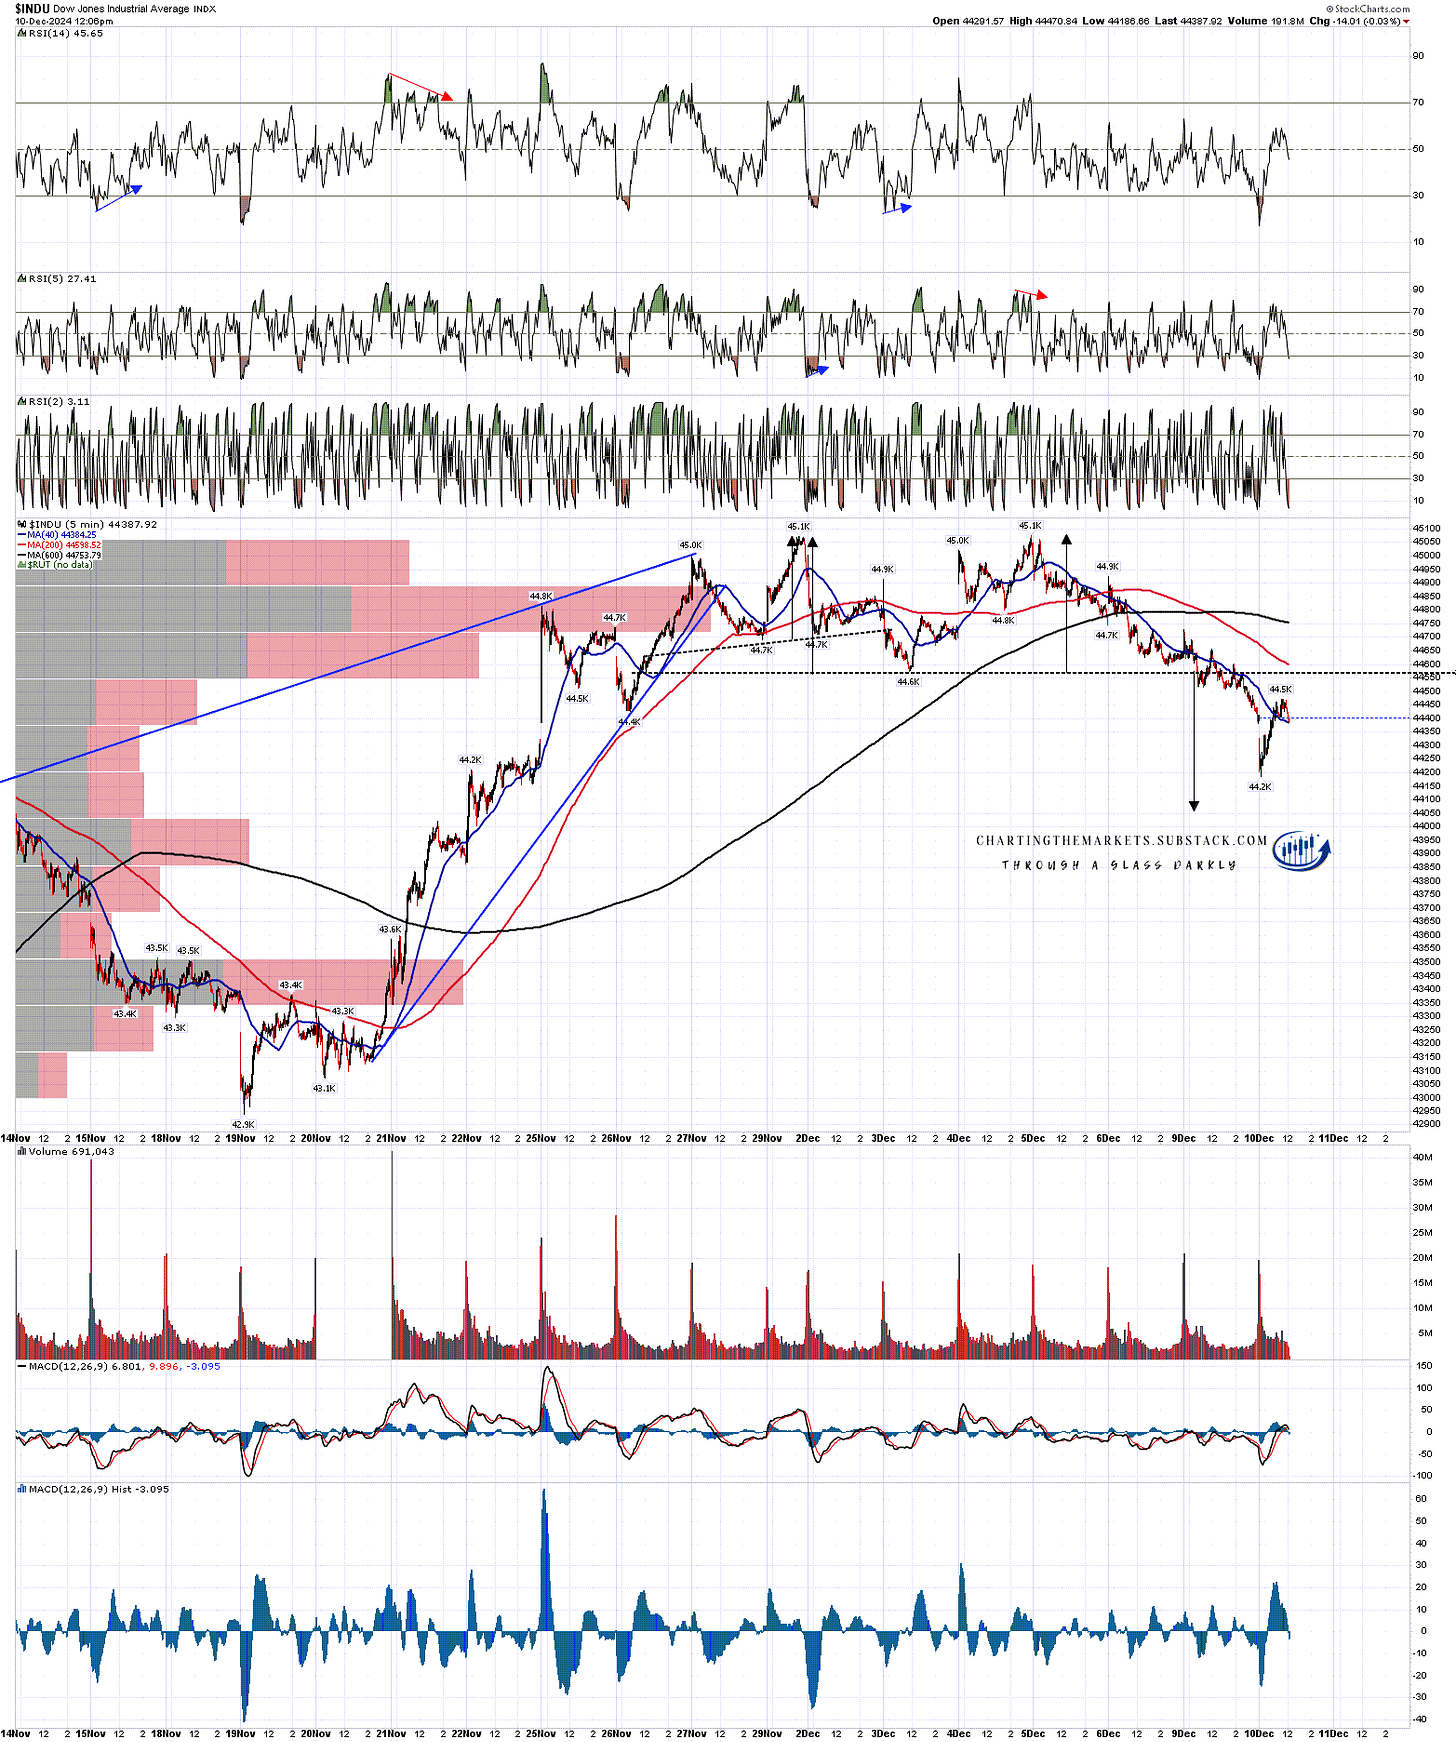
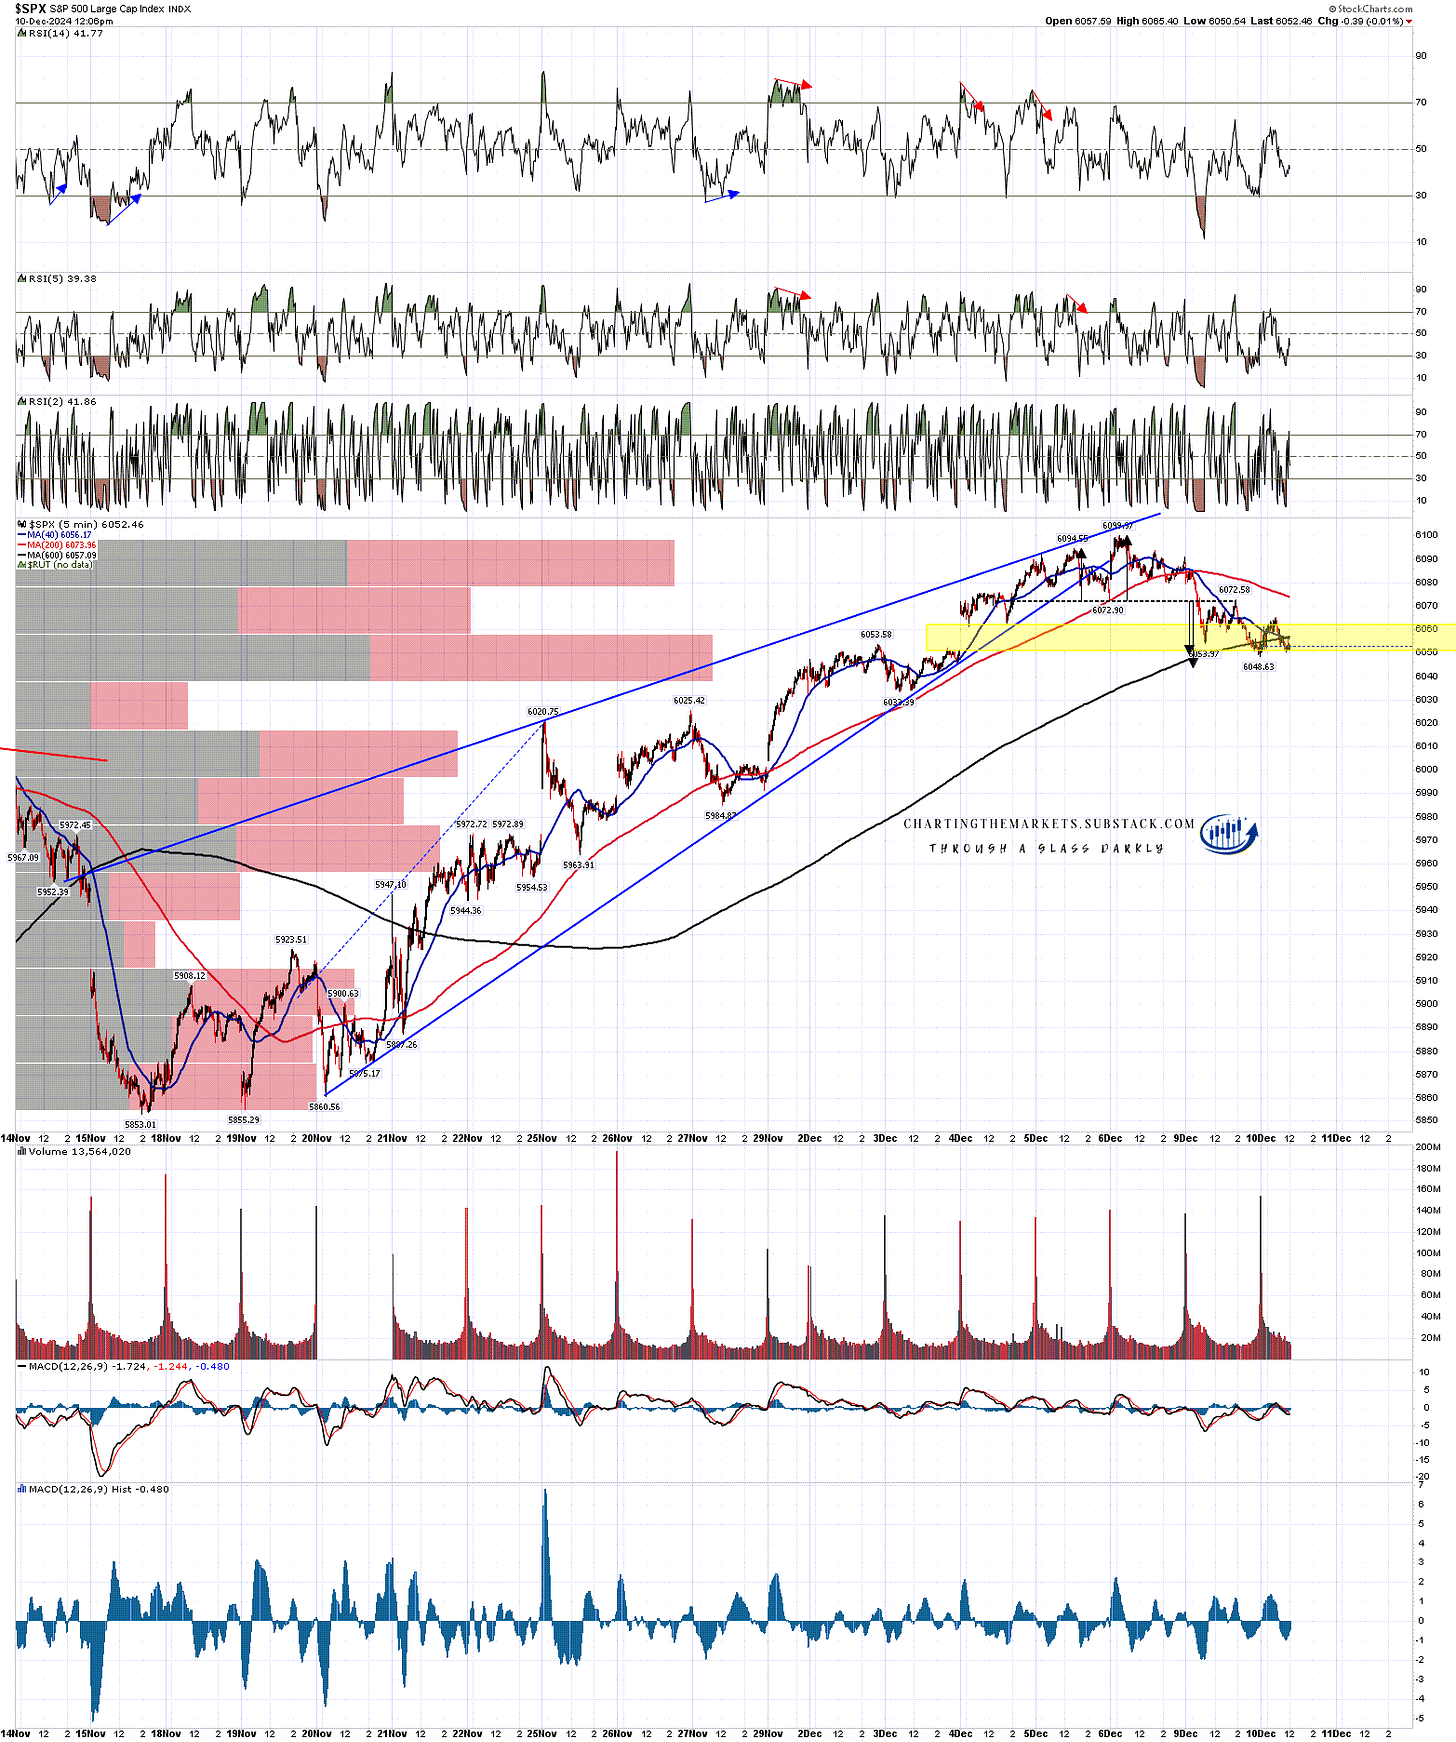
There were three short term patterns on US indices that I was looking at yesterday morning, including double tops on SPX and Dow.

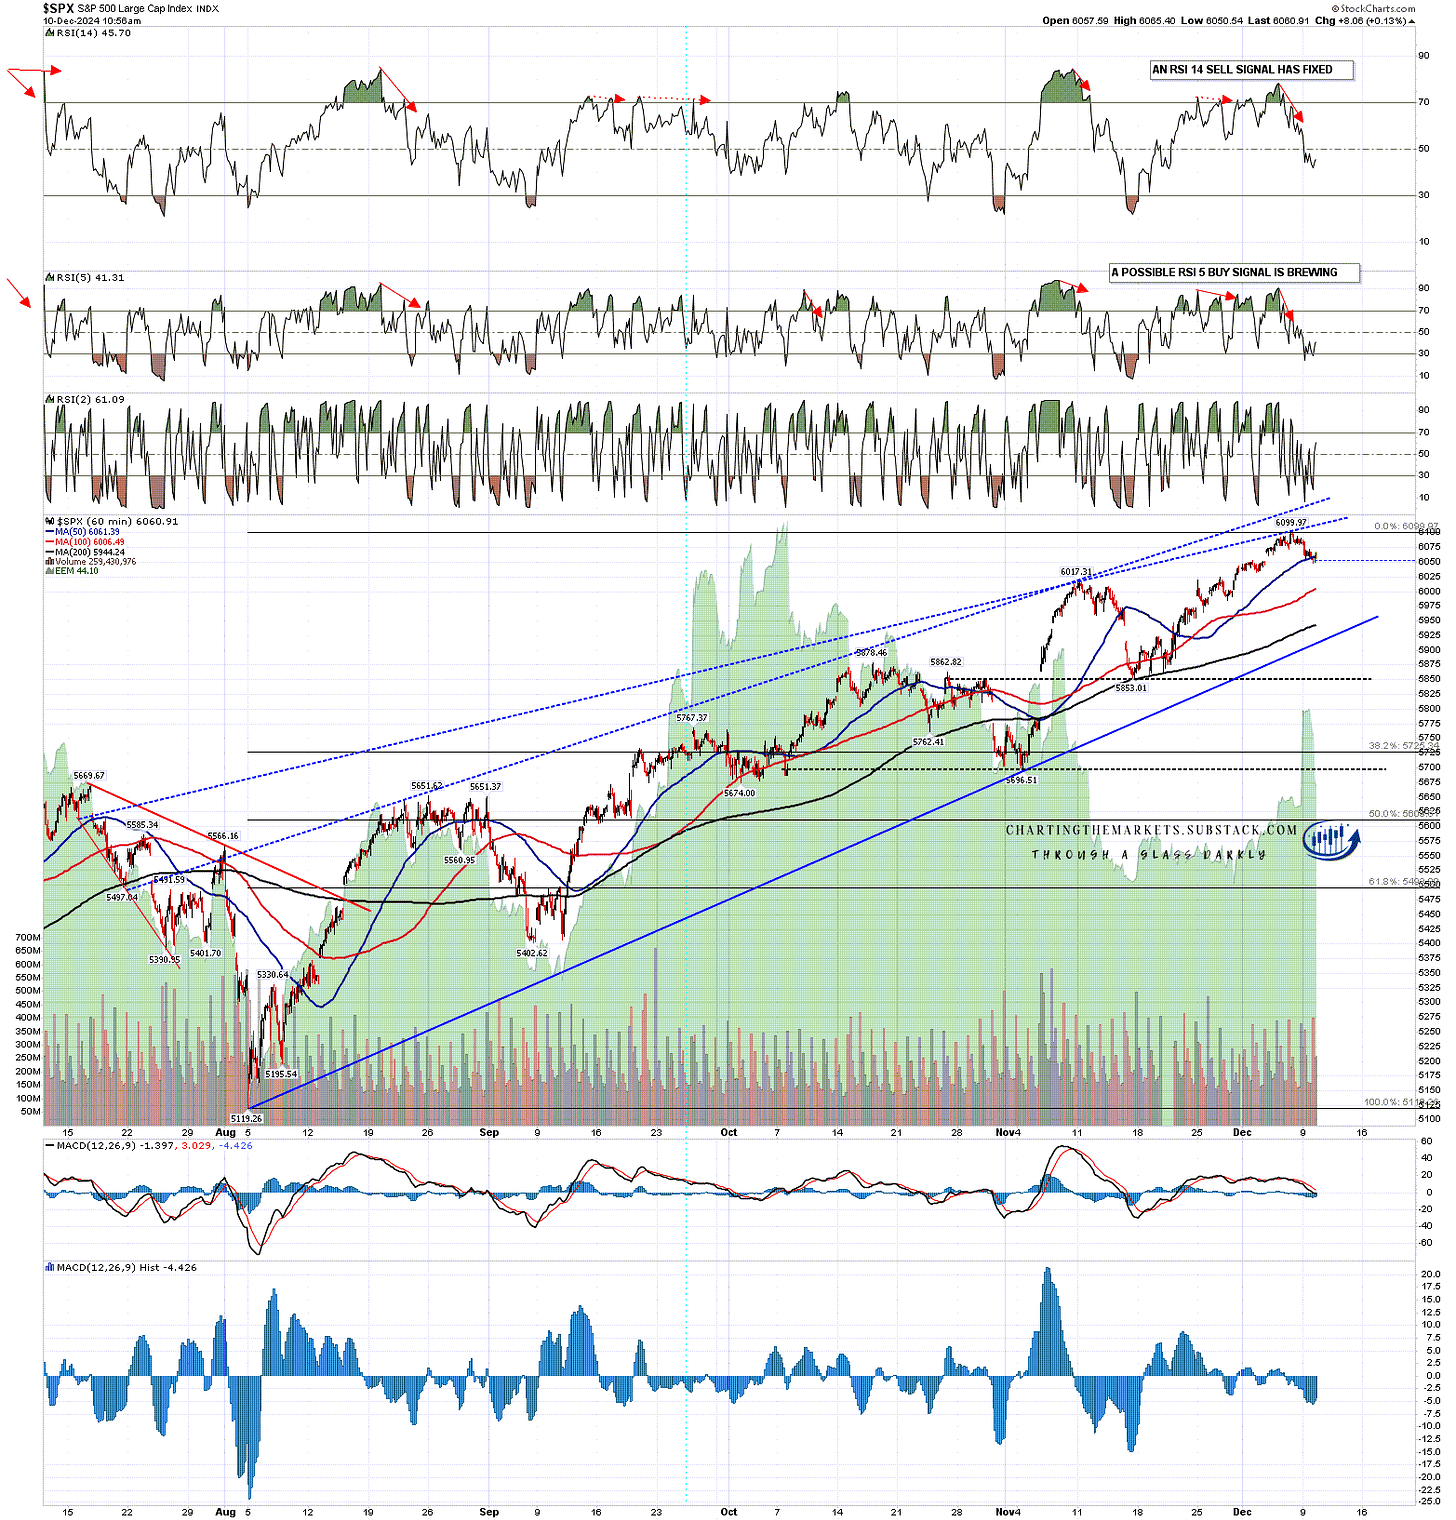
On SPX the double top has reached the minimum target, with the extended target a little lower at 6044.

SPX 5min chart:

On Dow the double top target is in the 44050 area, not quite reached at the morning low but possibly close enough.

INDU 5min chart:

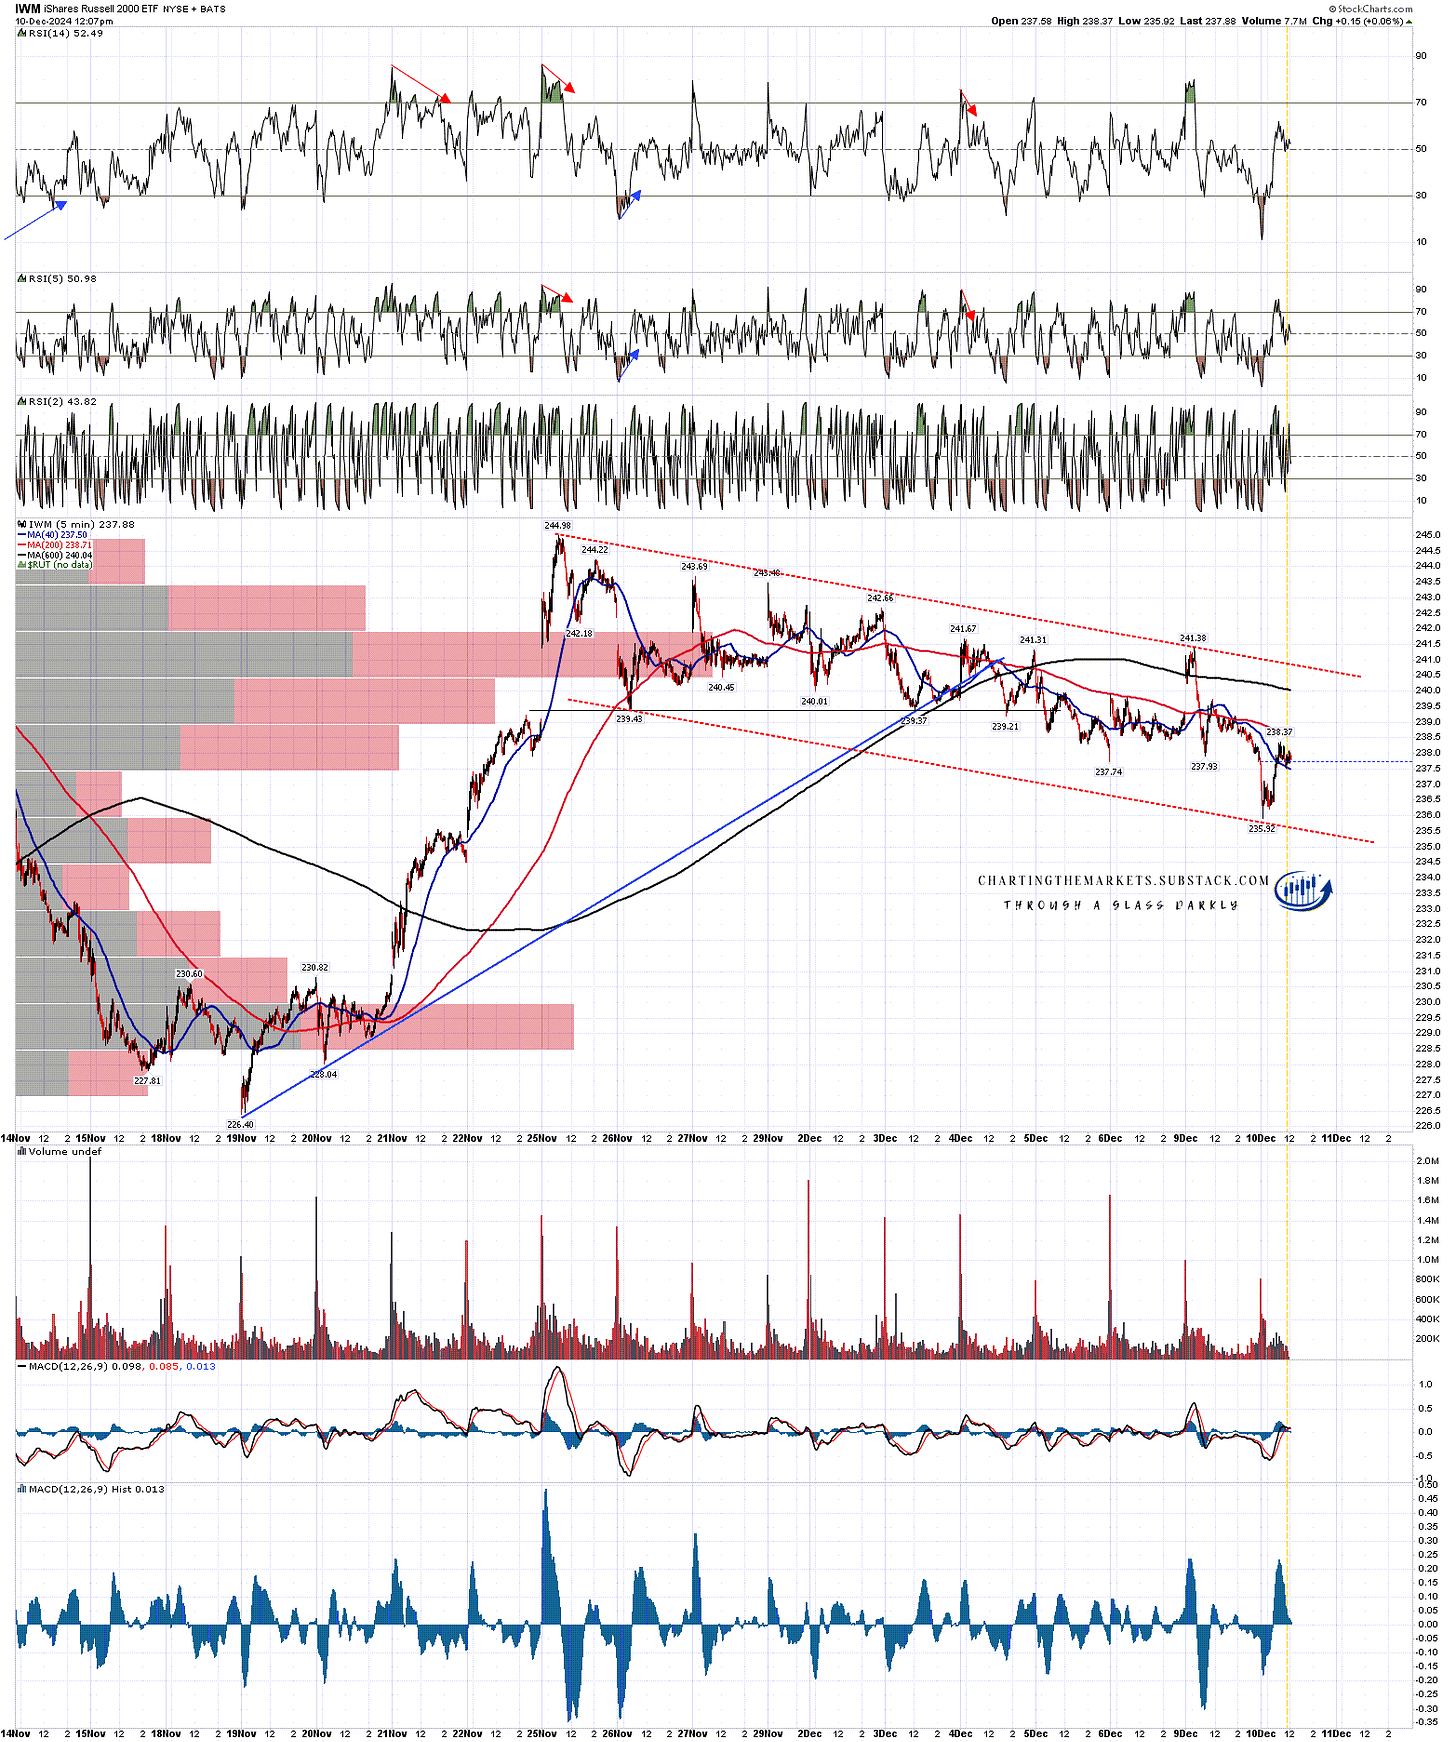
I was looking at the very nice bull flag on RTY yesterday morning as there wasn’t much to see on IWM, but we now have a pretty decent looking bull flag on IWM as well.

This is one reason I’m thinking indices may turn directly back up from here or not far below. A break down on the perfect RTY bull flag channel would open further downside and possible tests of the daily middle bands.

IWM 5min chart:

Is there a case for going lower short term? Well there are still fixed RSI 14 sell signals on the SPX and QQQ hourly charts and we could see some more downside, but this is already the largest retracement at 41 points on SPX since the 57 point decline on 25th November and the largest retracements since this move started at the 15th November low at 5853.01 were the two 63 point declines on 19/20 and 21 November as this move up was starting.

Unless this is a larger consolidation, I would therefore be expecting this move to stay above the 6026 level unless this is a larger retracement looking for either a test of the daily middle band, currently at 5996, or a test of rising support from the Aug 2024 low, currently in the 5920 area.

My lean is that I would expect to see at least a retest of the current all time high before we might see a retracement of that size.

SPX 60min chart:

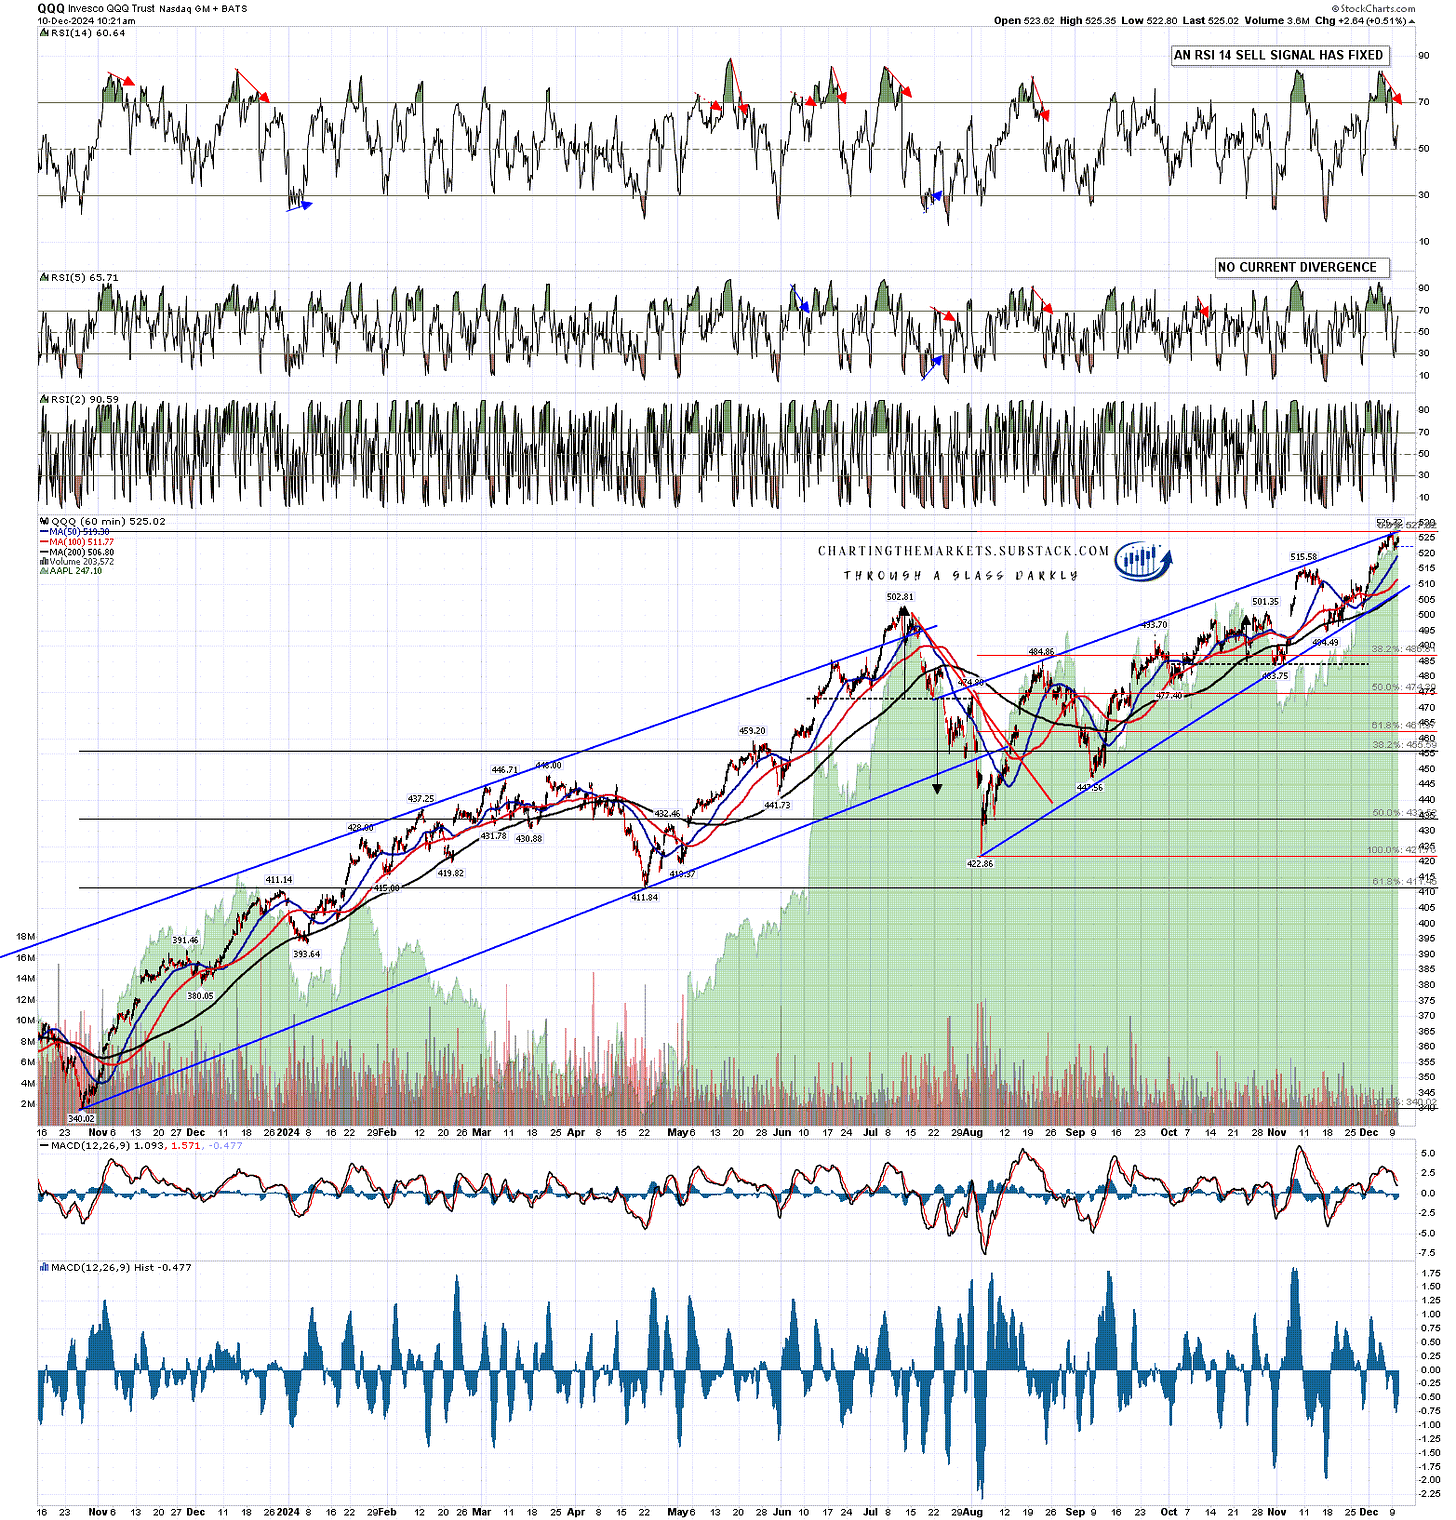
Here is the fixed sell signal on the NDX hourly chart, and the same applies to NDX.

QQQ 60min chart:

The US equity indices have finally had a decent run from the 15th November low and in the absence of strong evidence to the contrary, I’m expecting more upside into Xmas, and likely into January, though there should be a larger retracement in that period somewhere.

The closer we come to inauguration the more I’m also going to be looking at the incoming administration and the policies that are being talked about for the first 100 days of the new administration. Tariffs, Ukraine and others may make this one of the most interesting years on the markets that anyone can remember.

If you like my analysis and would like to see more, please take a free subscription at my chartingthemarkets substack, where I publish these posts first.

I also do a premarket video every day on equity indices, bonds, currencies, energies, precious commodities and other commodities at 8.45am EST. If you’d like to see those I post the links every morning on my twitter, and the videos are posted shortly afterwards on my Youtube channel.

Monday, 9 December 2024

Ongoing Bullish Consolidations on Crypto

In my last post on Thursday I was looking at the possibility that the bullish consolidation on Solana (SOLUSD) particularly might see another lower low as part of a bull flag forming, and the jury was still out on that this morning.

On the daily chart Solana has still been holding the daily middle band, currently at 239.41, as resistance. The path to a lower low is still open, and there are some attractive targets.

On the daily chart the obvious support is at the monthly pivot at 219.10, and the 50dma, currently at 210.07. 210 would be a close backtest of the broken March 2020 high at 209.86 of course.

SOLUSD daily chart:

On the 15min chart the possible bull flag channel I posted on Thursday broke but a second option was established. That channel support is currently in the 203.5 area.

SOLUSD 15min chart:

On Bitcoin (BTCUSD) I was suggesting on Thursday that the hit of the daily 3sd upper band at 104k might well deliver some consolidation before going higher and we’ve been seeing that.

BTCUSD daily chart:

On the 15min chart there is no obvious pattern forming so apart from expecting to see a new all time high soon there isn’t much in the way of short term clues.

BTCUSD 15min chart:

Both Bitcoin and Solana have daily RSI 14 sell signals fixed of course, and there is another brewing but not yet fixed on Ethereum (ETHUSD), but I’m leaning towards these delivering a decent retracemenht early next year.

in the short term the bull flag target on Ethereum at a retest of the March 2024 high at 4092.73 was reached over the weekend, and I’m expecting to see Ethereum retest the all time high at 4865.94 in the first half of next year.

ETHUSD daily chart:

There is an interesting pattern setup on the Ethereum 15min chart, with a decent quality rising megaphone formed from the 3016.13 low. In the short term we may well see a test of the megaphone support trendline, currently in the 3740 area.

ETHUSD 15min chart:

On the bigger picture I’m leaning bullish across the board with the caveat that the fixed daily RSI 14 sell signals on Bitcoin and Solana (and possible one brewing on Ethereum) are warning that a longer and deeper consolidation may be coming within a few weeks.

If you’d like to see more of these posts and the other Crypto videos and information I post, please subscribe for free to my Crypto substack.

I do a premarket video every day on Crypto at 9.15am EST. If you’d like to see those I post the links every morning on my twitter, and the videos are posted shortly afterwards on my Youtube channel.

I'm also to be found at Arion Partners, though as a student rather than as a teacher. I've been charting Crypto for some years now, but am learning to trade and invest in them directly, and Arion Partners are my guide around a space that might reasonably be compared to the Wild West in one of their rougher years.
Thursday, 5 December 2024

Another Minority Report

In my last post on Tuesday I was looking at the bullish consolidation options on Bitcoin (BTCUSD), Solana (SOLUSD) & Ethereum (ETHUSD), and those have played out mostly as expected since.

A small H&S had broken down on Bitcoin, and I was saying that might well fail into a retest of the prior high at 98.7k and then go higher and we saw that.

BTCUSD 15min chart:

On the daily chart Bitcoin finally broke over $100k last night, but at the overnight high touched the daily 3sd upper band. That’s far from the big issue that such a hit would be on SPX, but we may well see a bit of consolidation here before going higher.

BTCUSD daily chart:

There was also a small H&S that had broken down on the Ethereum chart and again I was thinking that might well fail into a retest of the previous high at 3763.68, and then go higher. That’s gone well too and the decent quality wedge resistance trendline I was watching has broken convincingly, opening the upside.

ETHUSD 15min chart:

On the daily chart the very obvious next target is the retest of the 2024 high at 4092.73, and we will likely see that test within a few days.
ETHUSD daily chart:

The question mark and minority report here is on Solana, which hasn’t yet broken back convincingly above the daily middle band, currently at 238.96, though it is trying. If that holds as resistance for now then it may well mean that Solana needs to retest the current retracement low at 215.15, and I have a decent looking setup for that.
SOLUSD daily chart:

The initial bull flag wedge has broken up, but the rising wedge formed from the low at 215.15 may be a decent looking smaller bear flag wedge or B wave setting up either a low retest or another leg down.

Sometimes when a bull flag breaks up it evolves into a larger bull flag, and that’s something I’m generally checking for. At yesterday’s rally high at 244.95 a larger bull flag channel has now been established (dotted purple lines) and, while that could break up directly, that raises the possibility that Solana may be reversing here towards that bull flag channel support, currently in the 207.5 area. We could see that move before Solana heads higher.

SOLUSD 15min chart:

On the bigger picture I’m leaning bullish across the board with the caveat that the fixed daily RSI 14 sell signals on Bitcoin and Solana (and possible one brewing on Ethereum) are warning that a longer and deeper consolidation may be coming within a few weeks.

If you’d like to see more of these posts and the other Crypto videos and information I post, please subscribe for free to my Crypto substack.

I'm also to be found at Arion Partners, though as a student rather than as a teacher. I've been charting Crypto for some years now, but am learning to trade and invest in them directly, and Arion Partners are my guide around a space that might reasonably be compared to the Wild West in one of their rougher years.