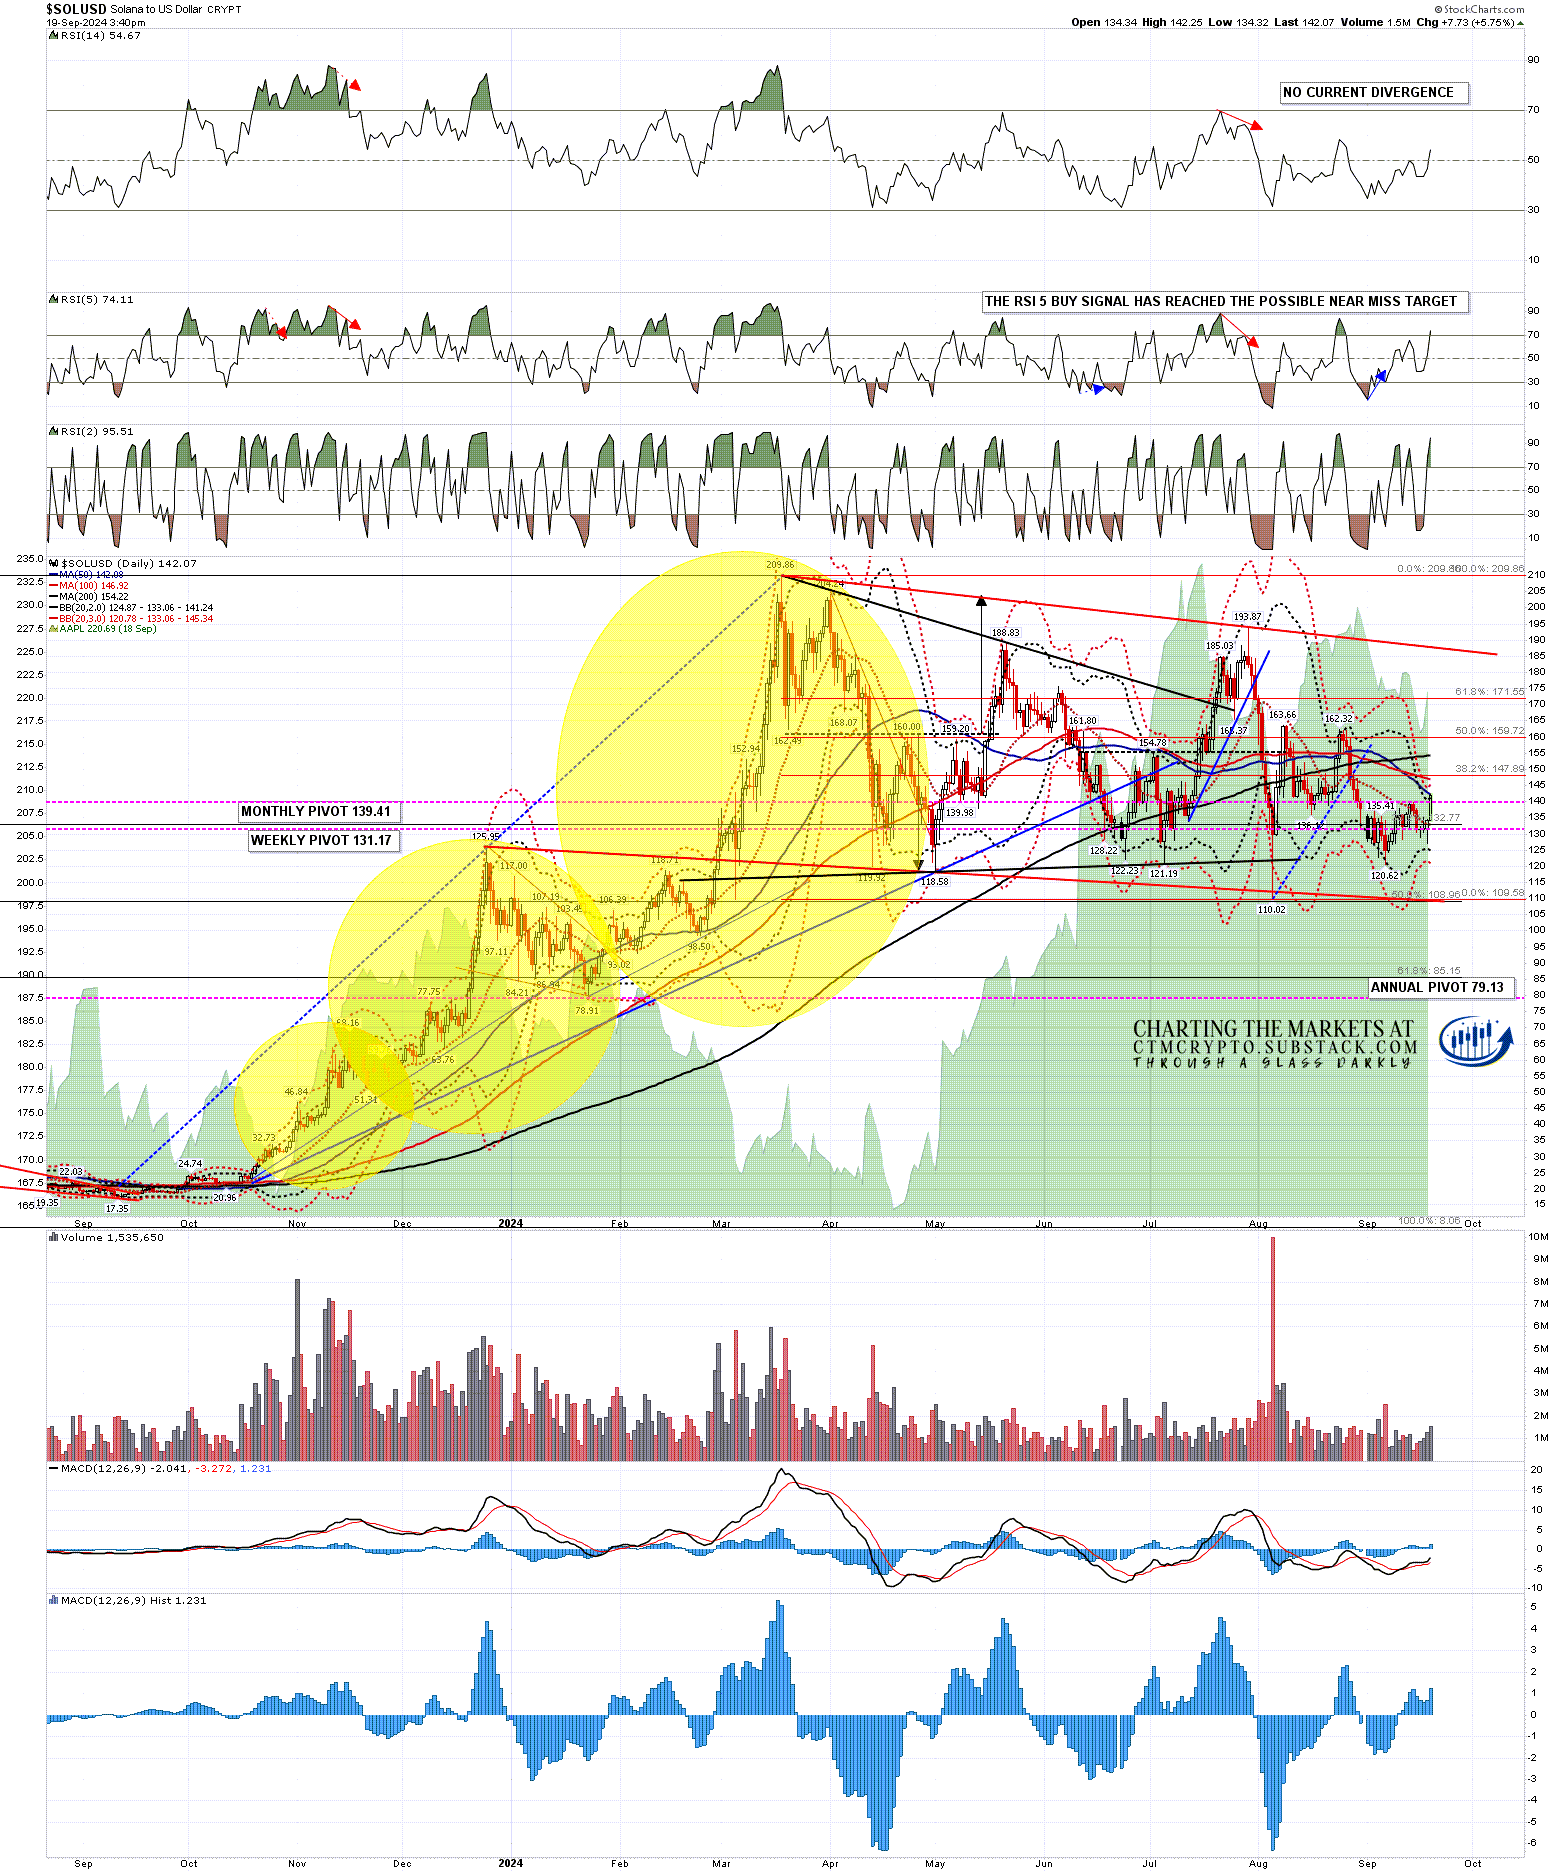
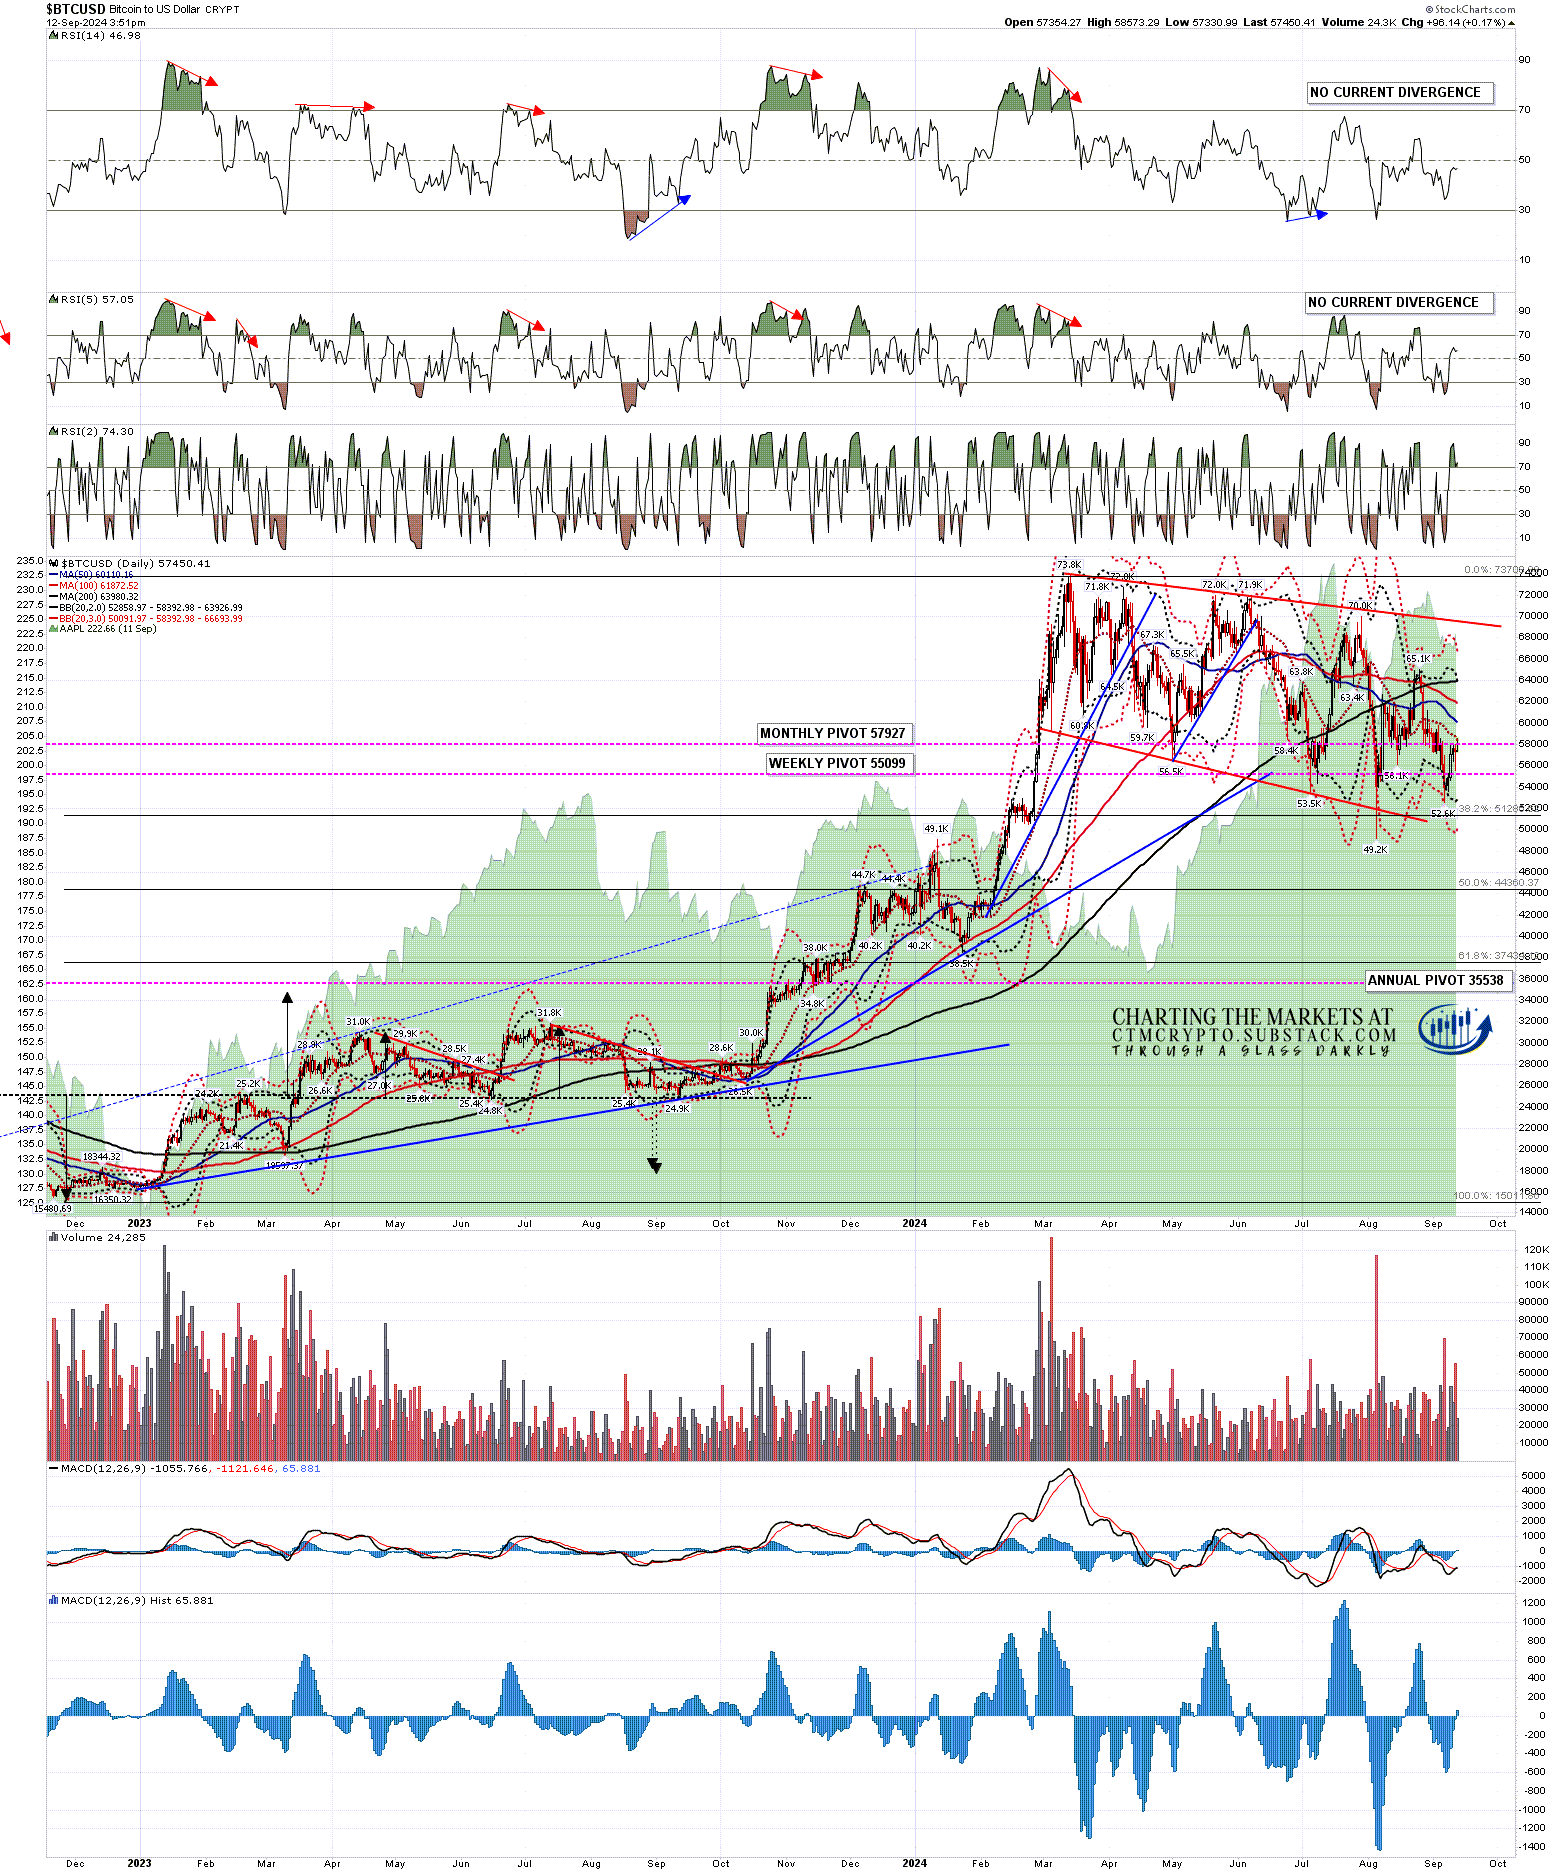
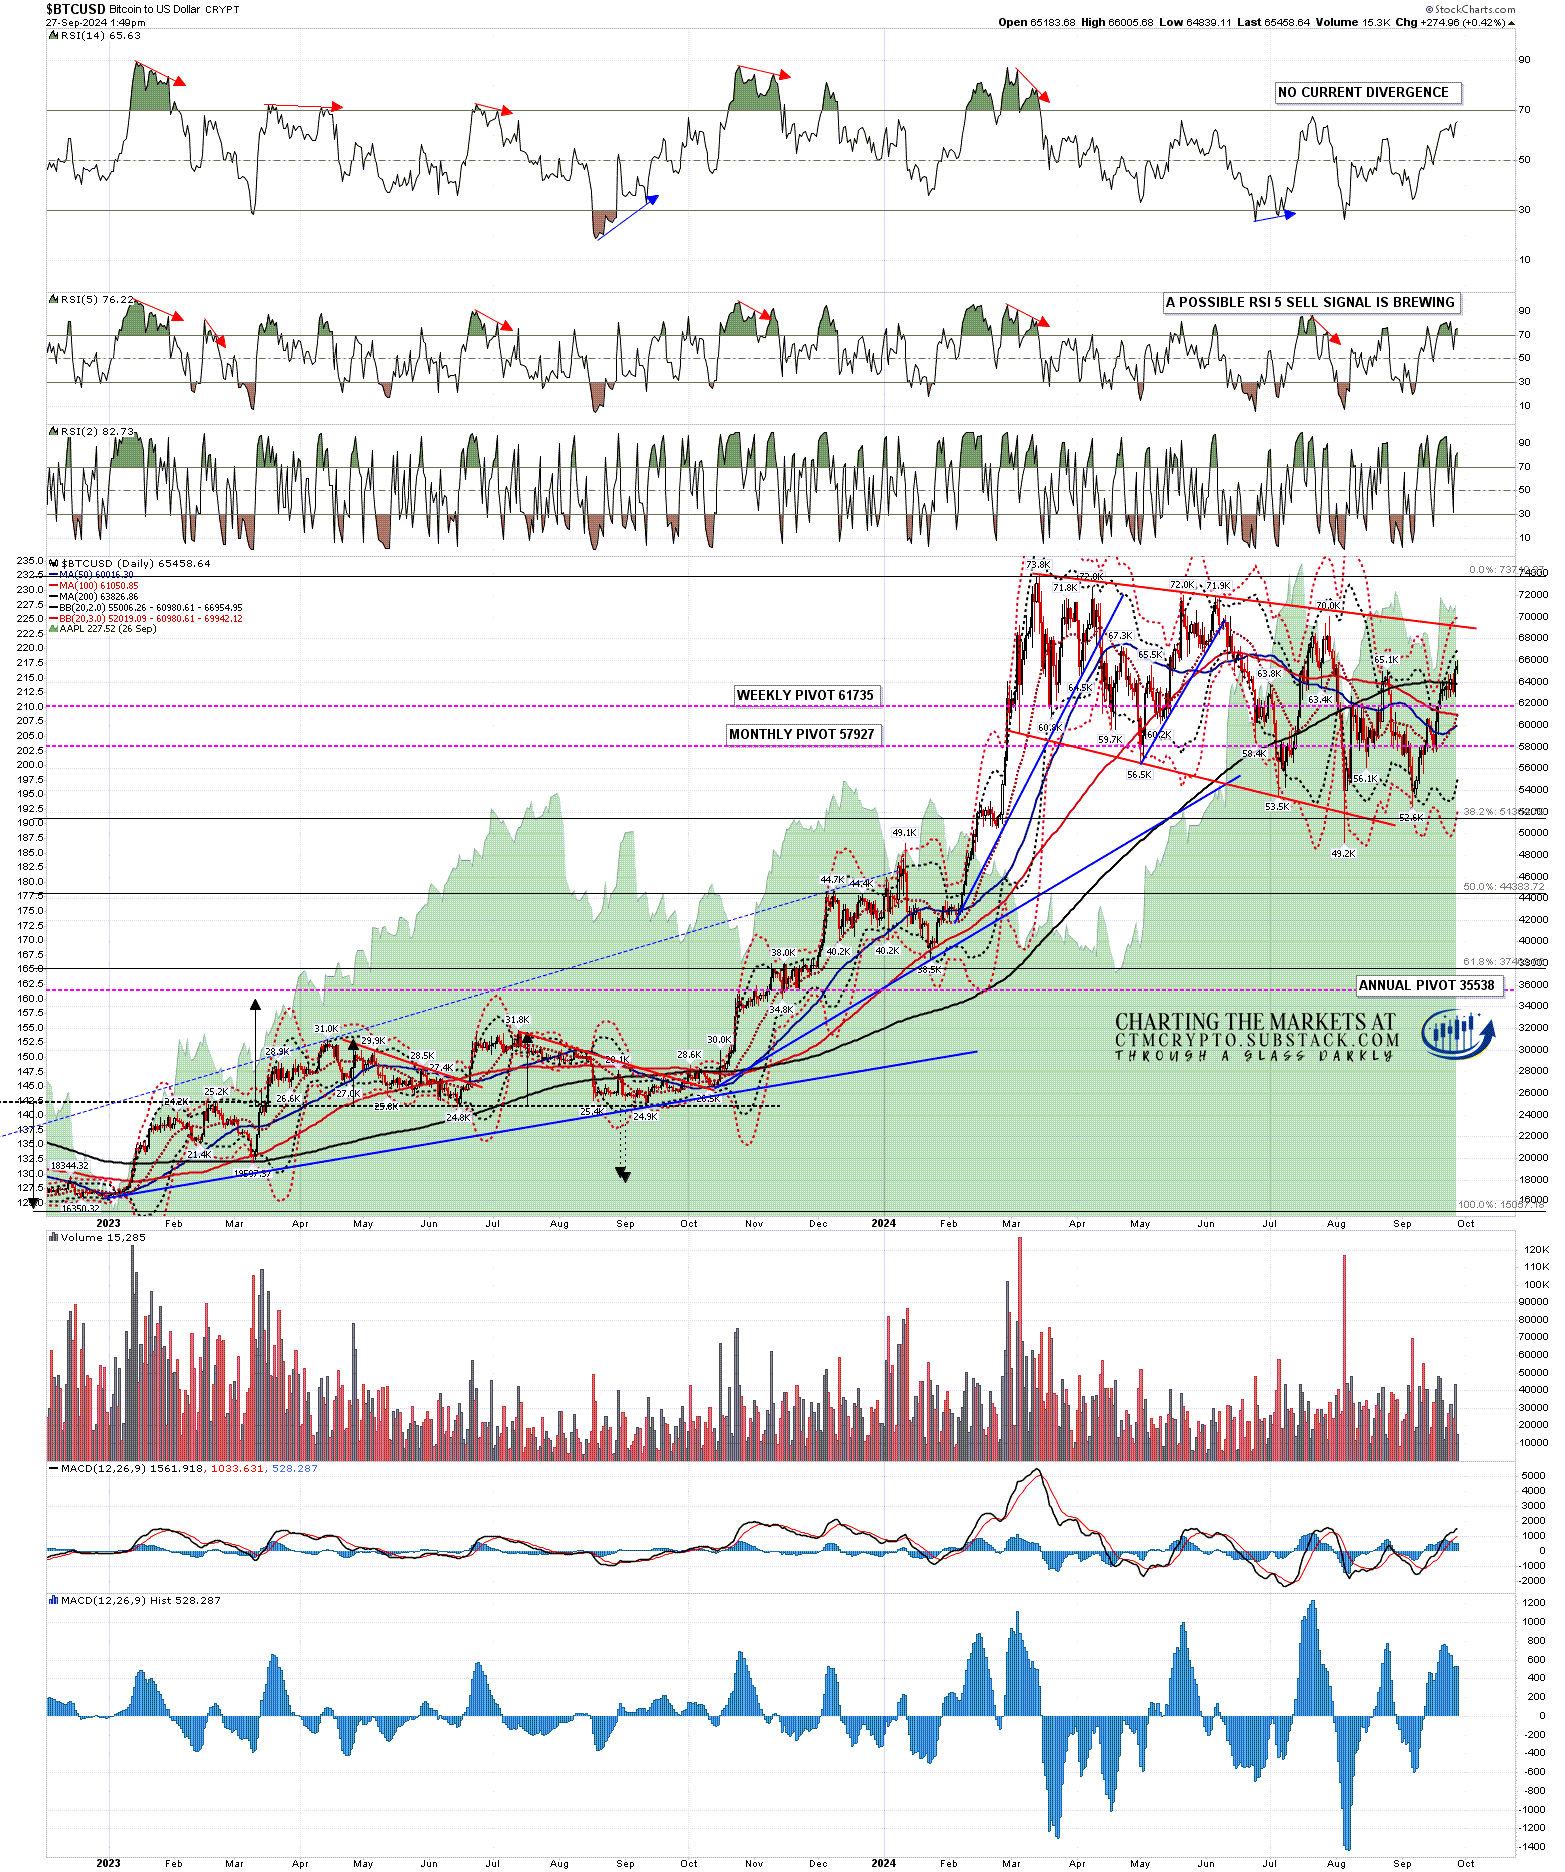
I was looking at the nice short setup on Crypto earlier this week and both BTCUSD (Bitcoin) and SOLUSD (Solana) then broke back over the very obvious resistance at the 200dma. The obvious question is whether this is a break up and possibly that might be the case, but it doesn’t look like it.
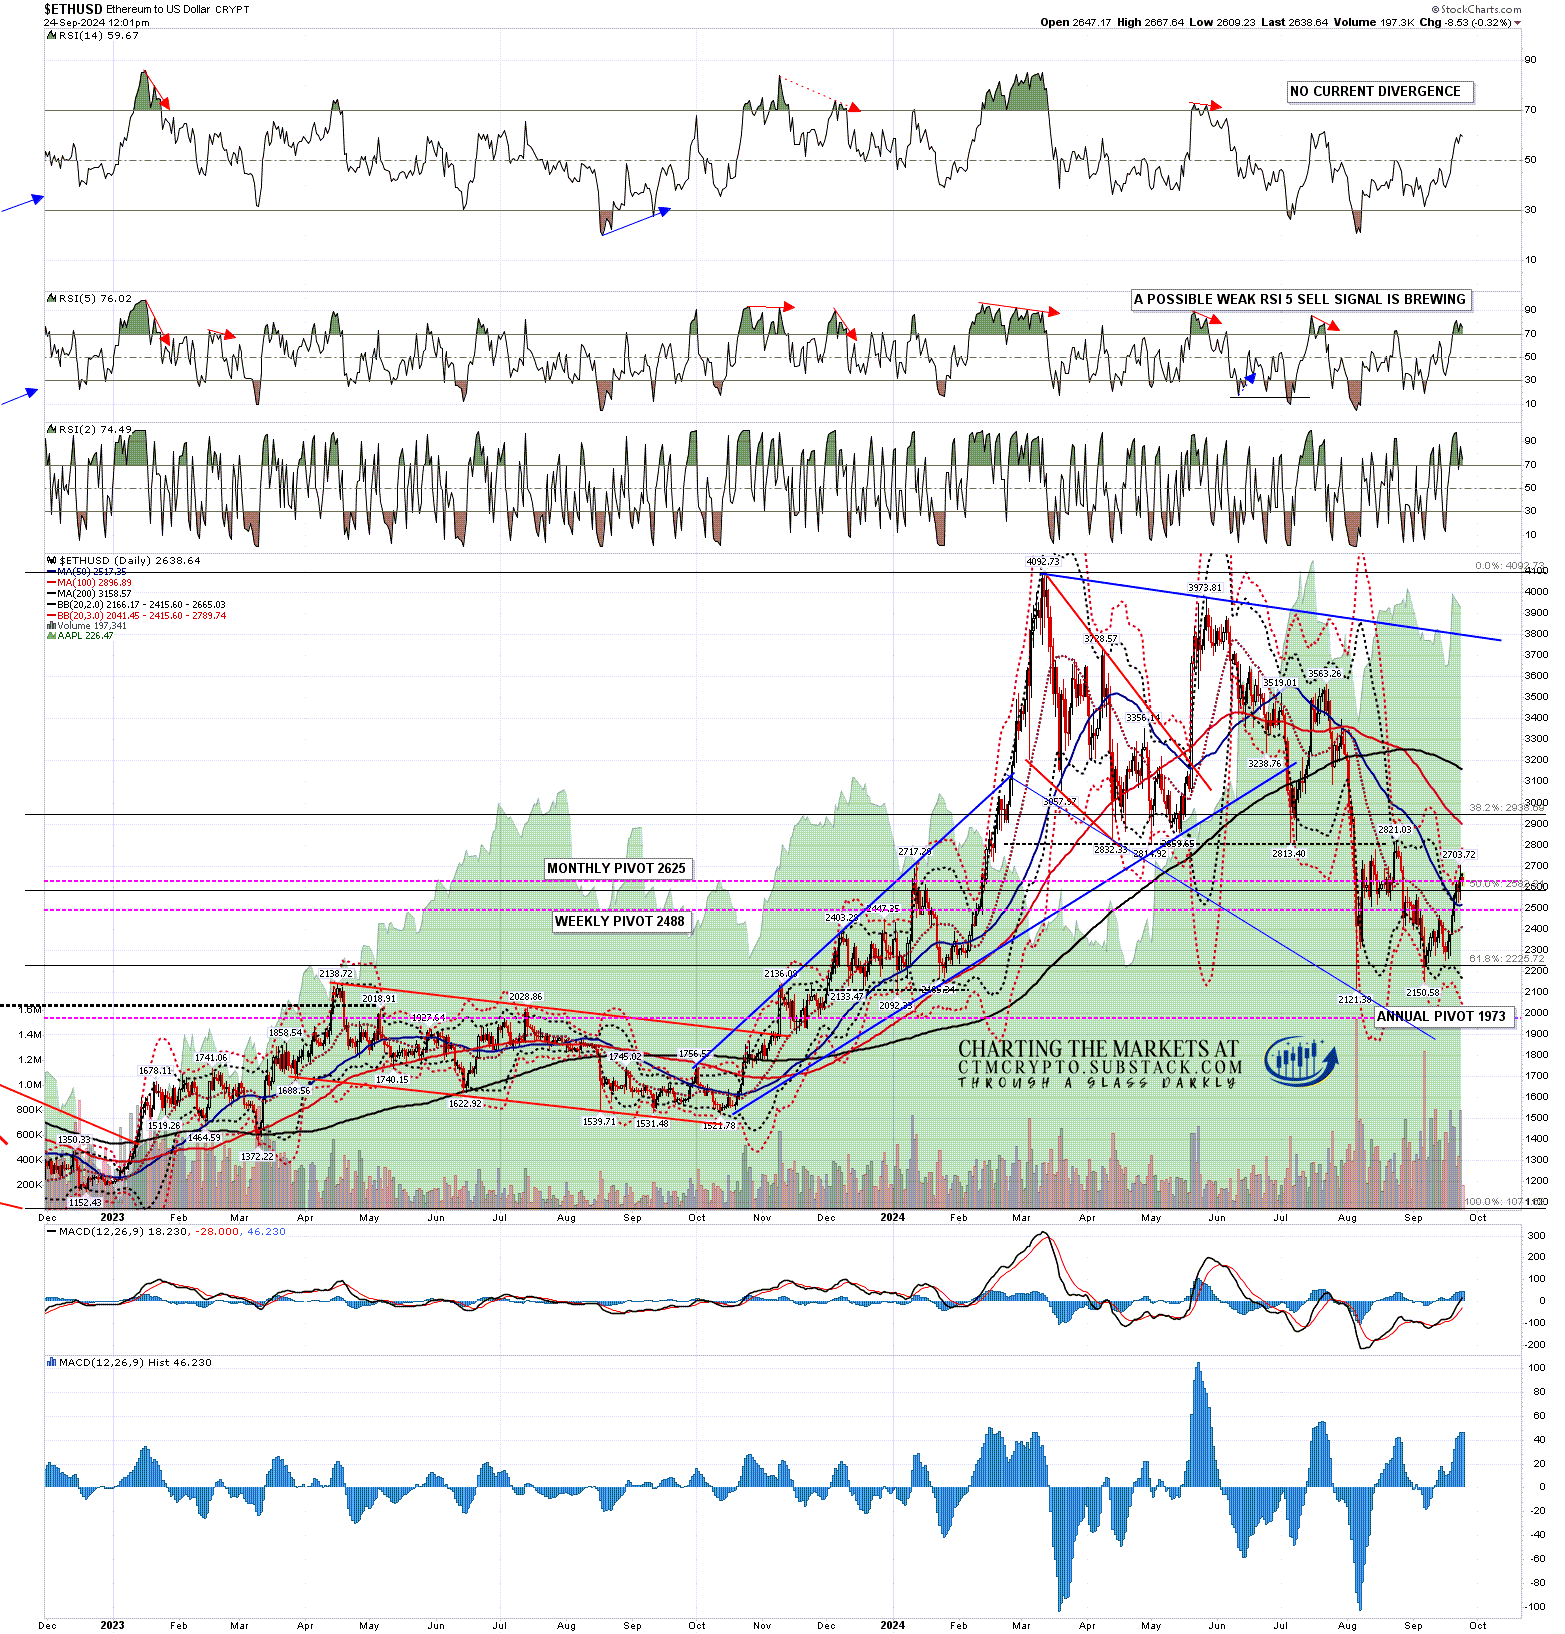
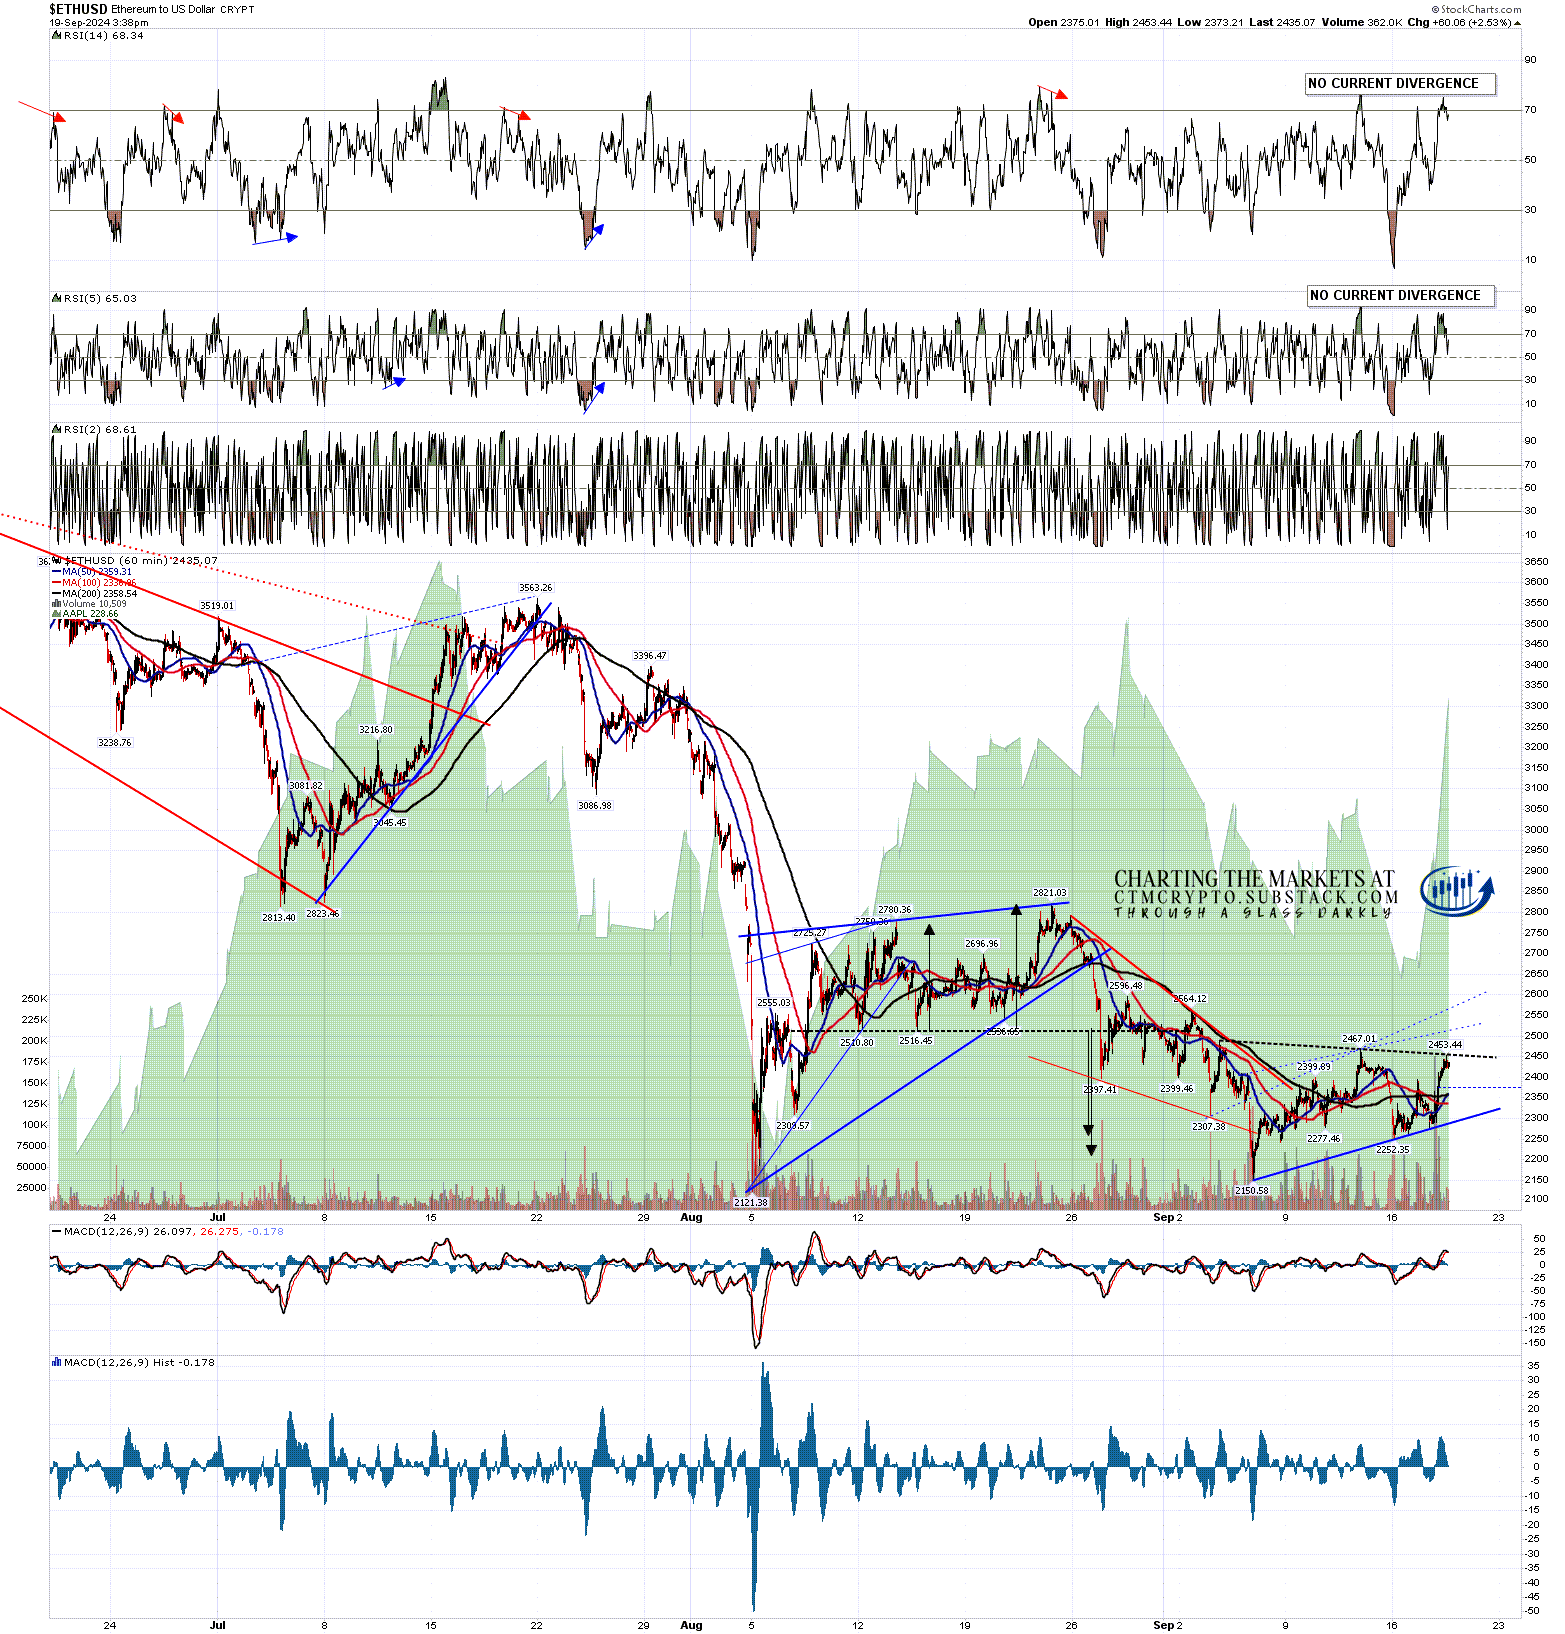
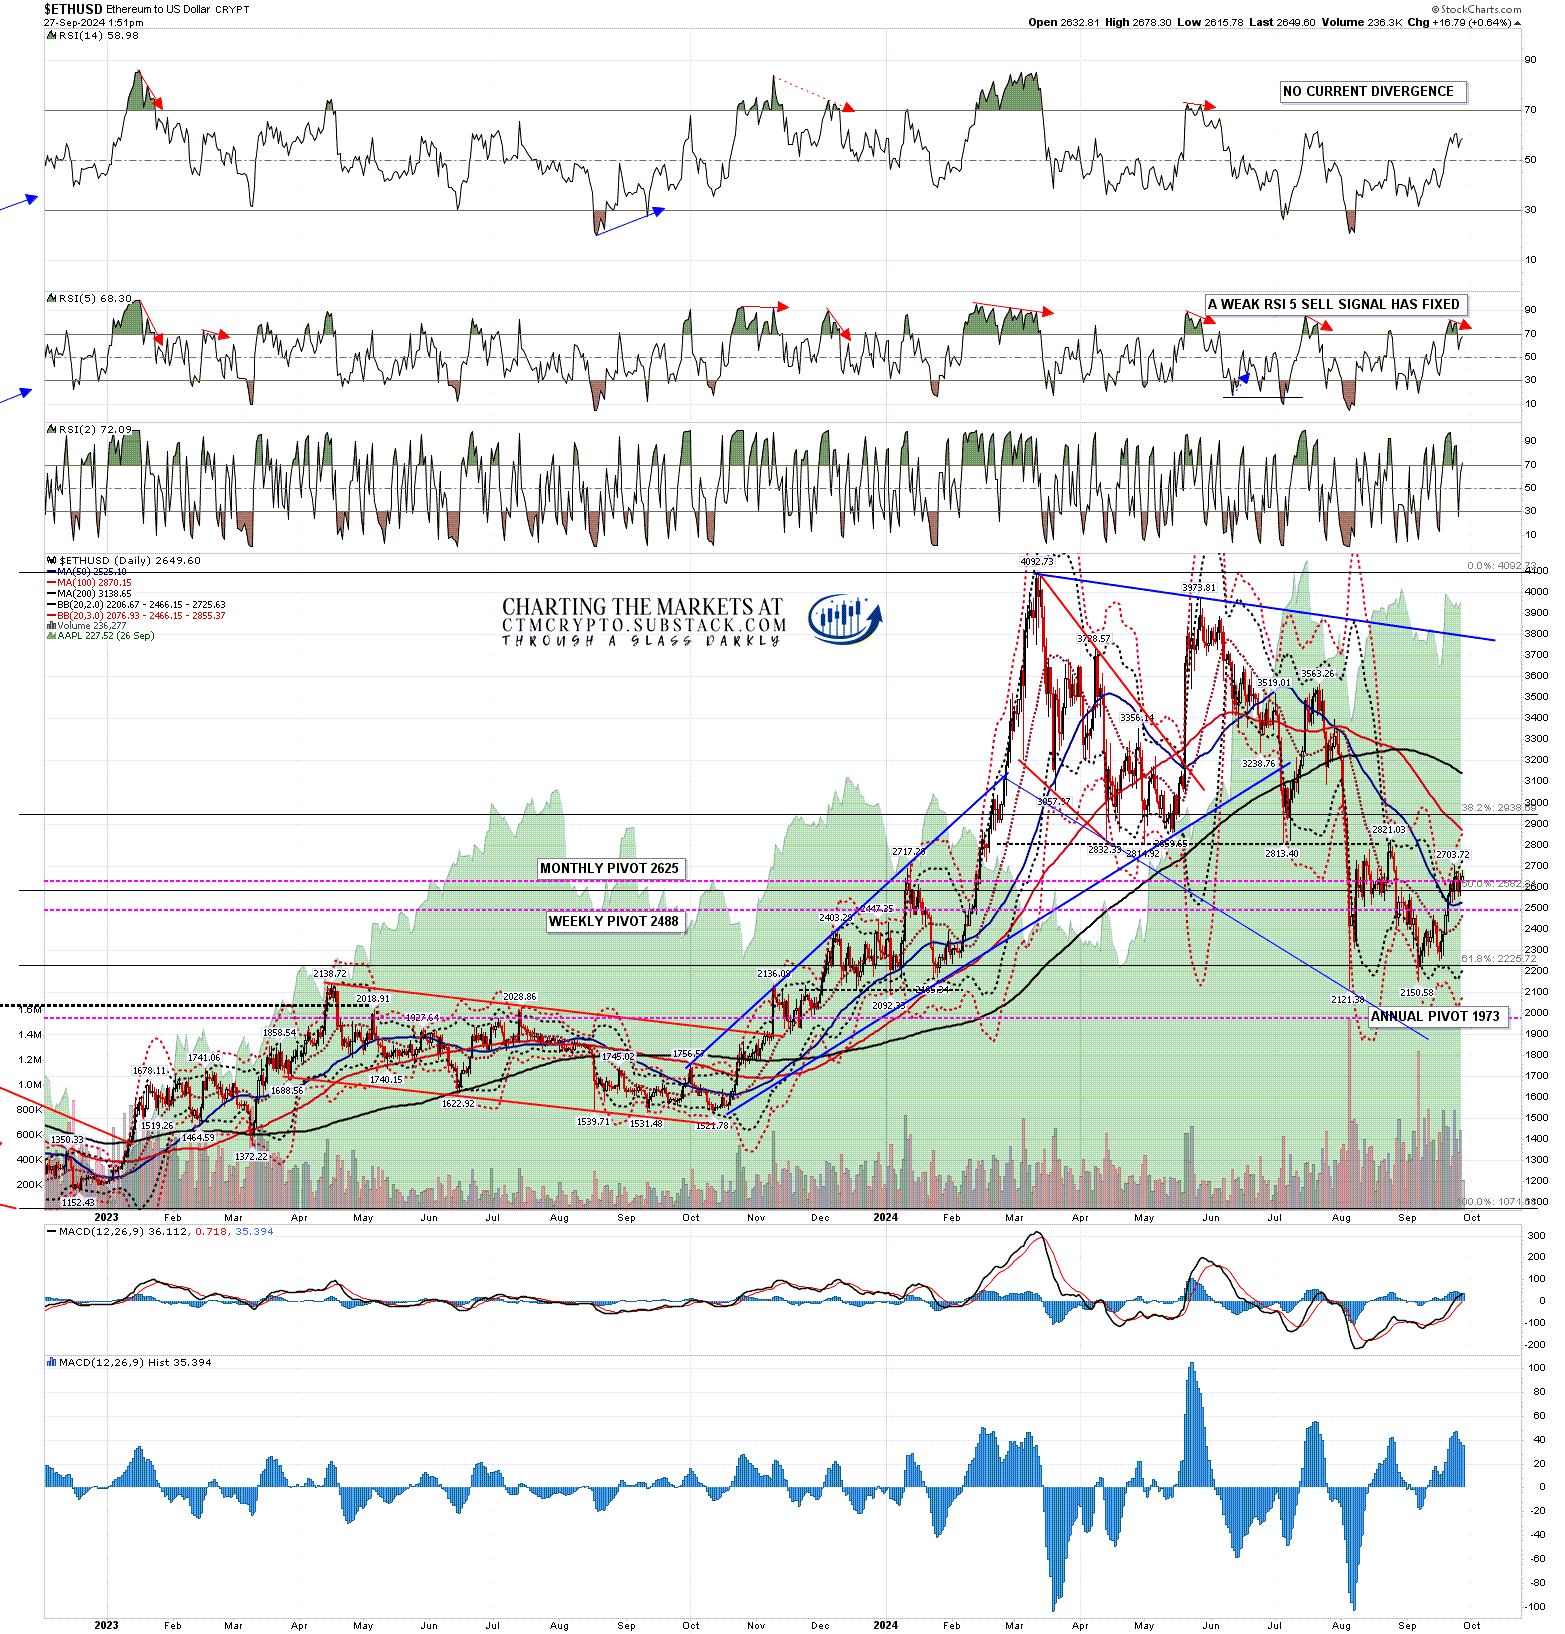
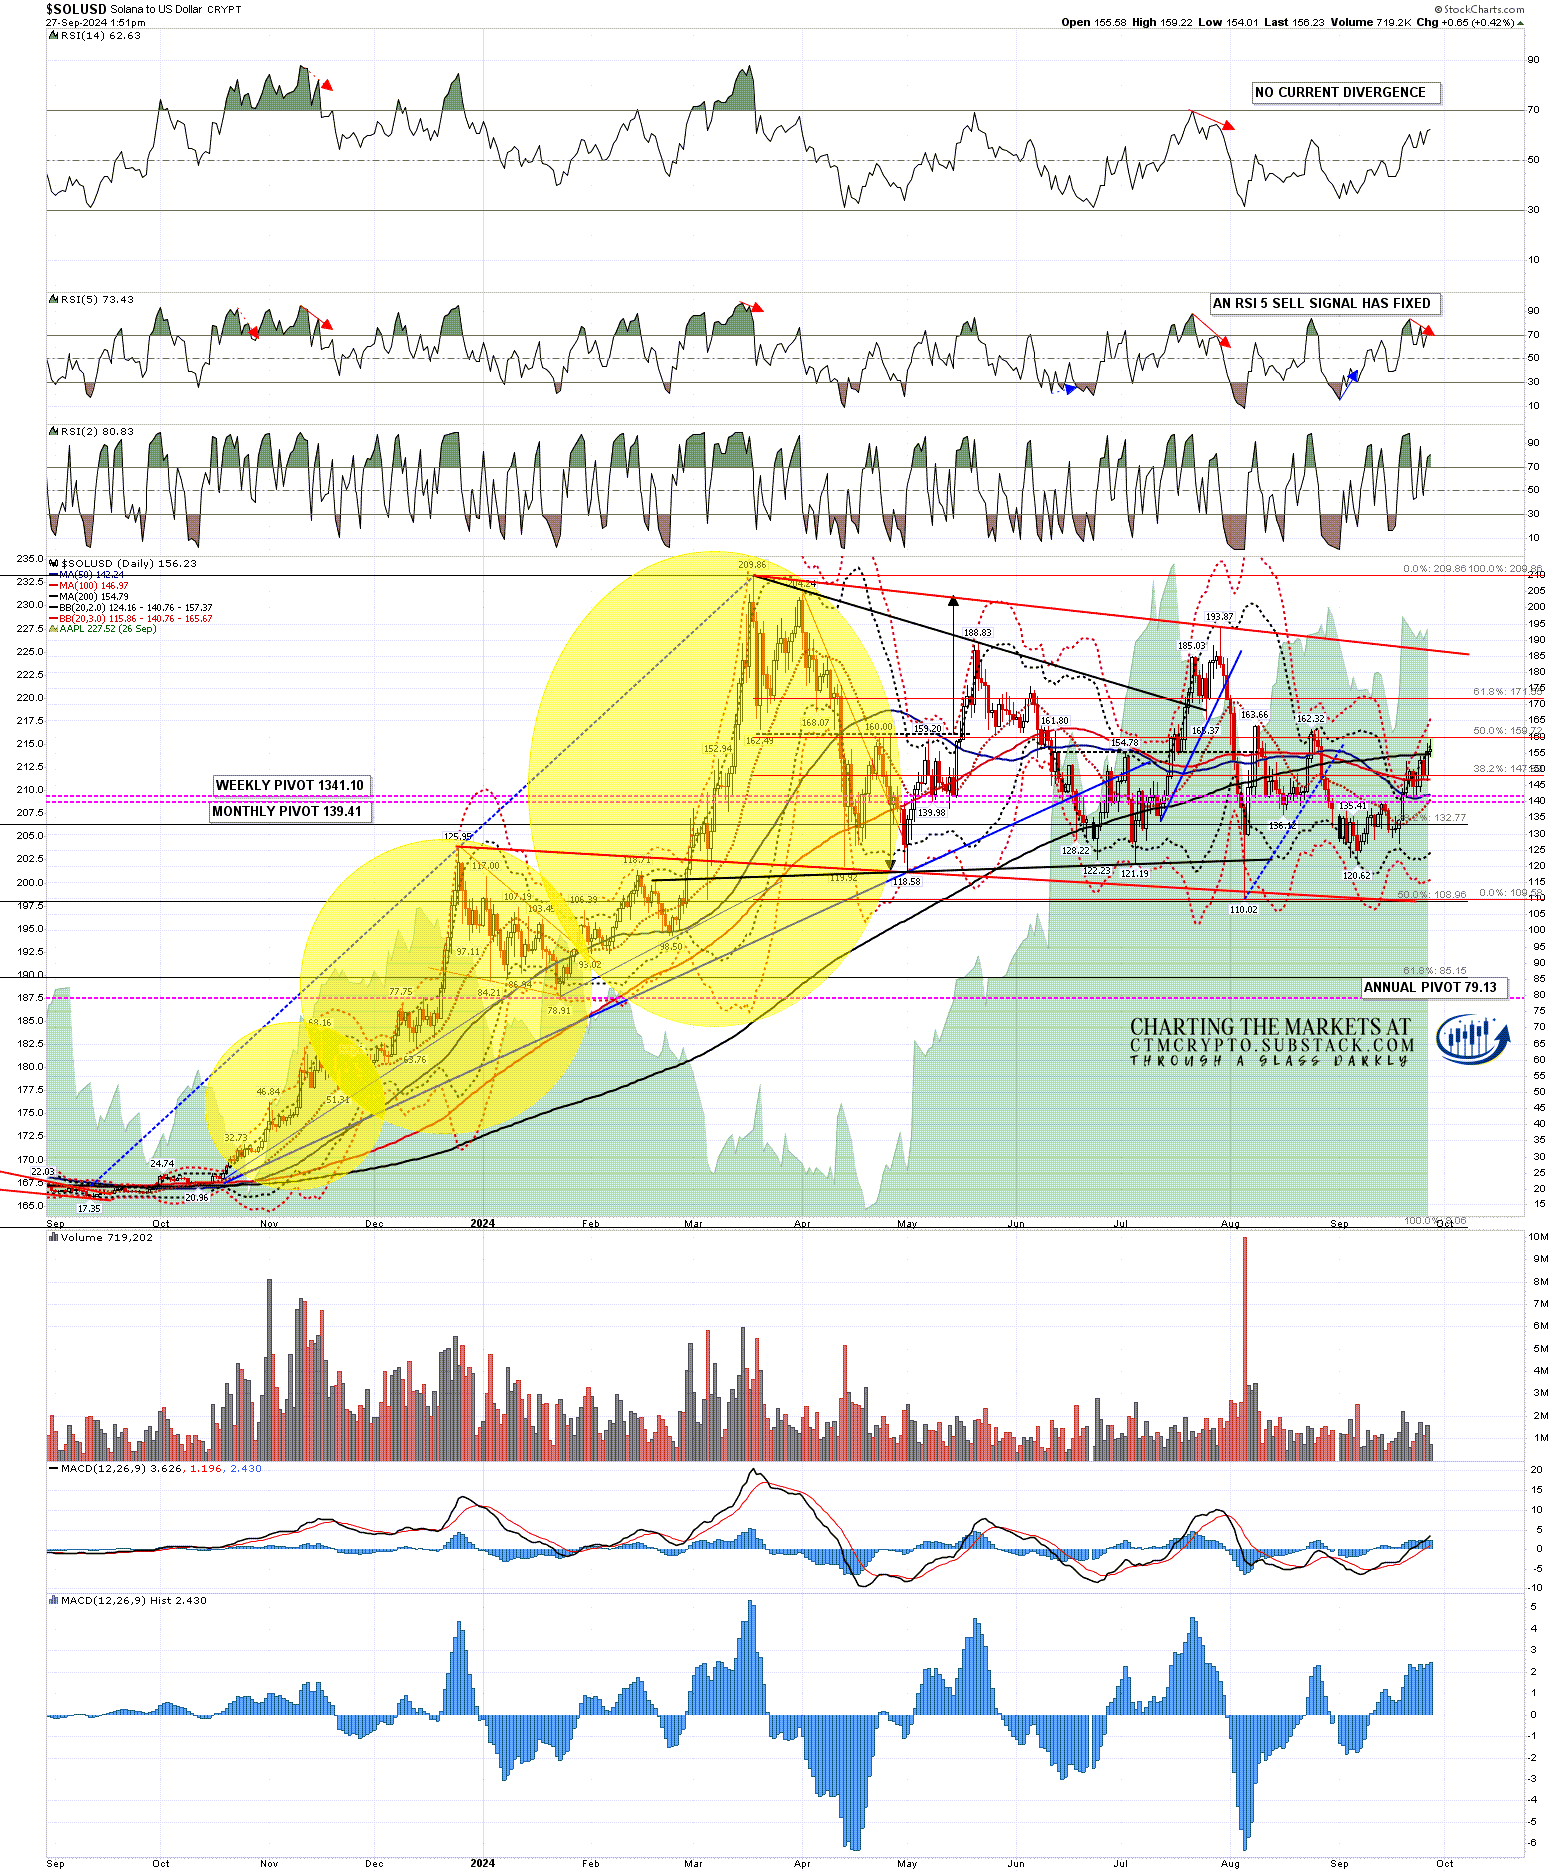
A weak RSI 5 daily sell signal has fixed on ETHUSD (Ethereum), and a full daily RSI 5 sell signal has fixed on Solana. These have a solid history of making at least the minimum target at the 35 level on the daily RSI 5.
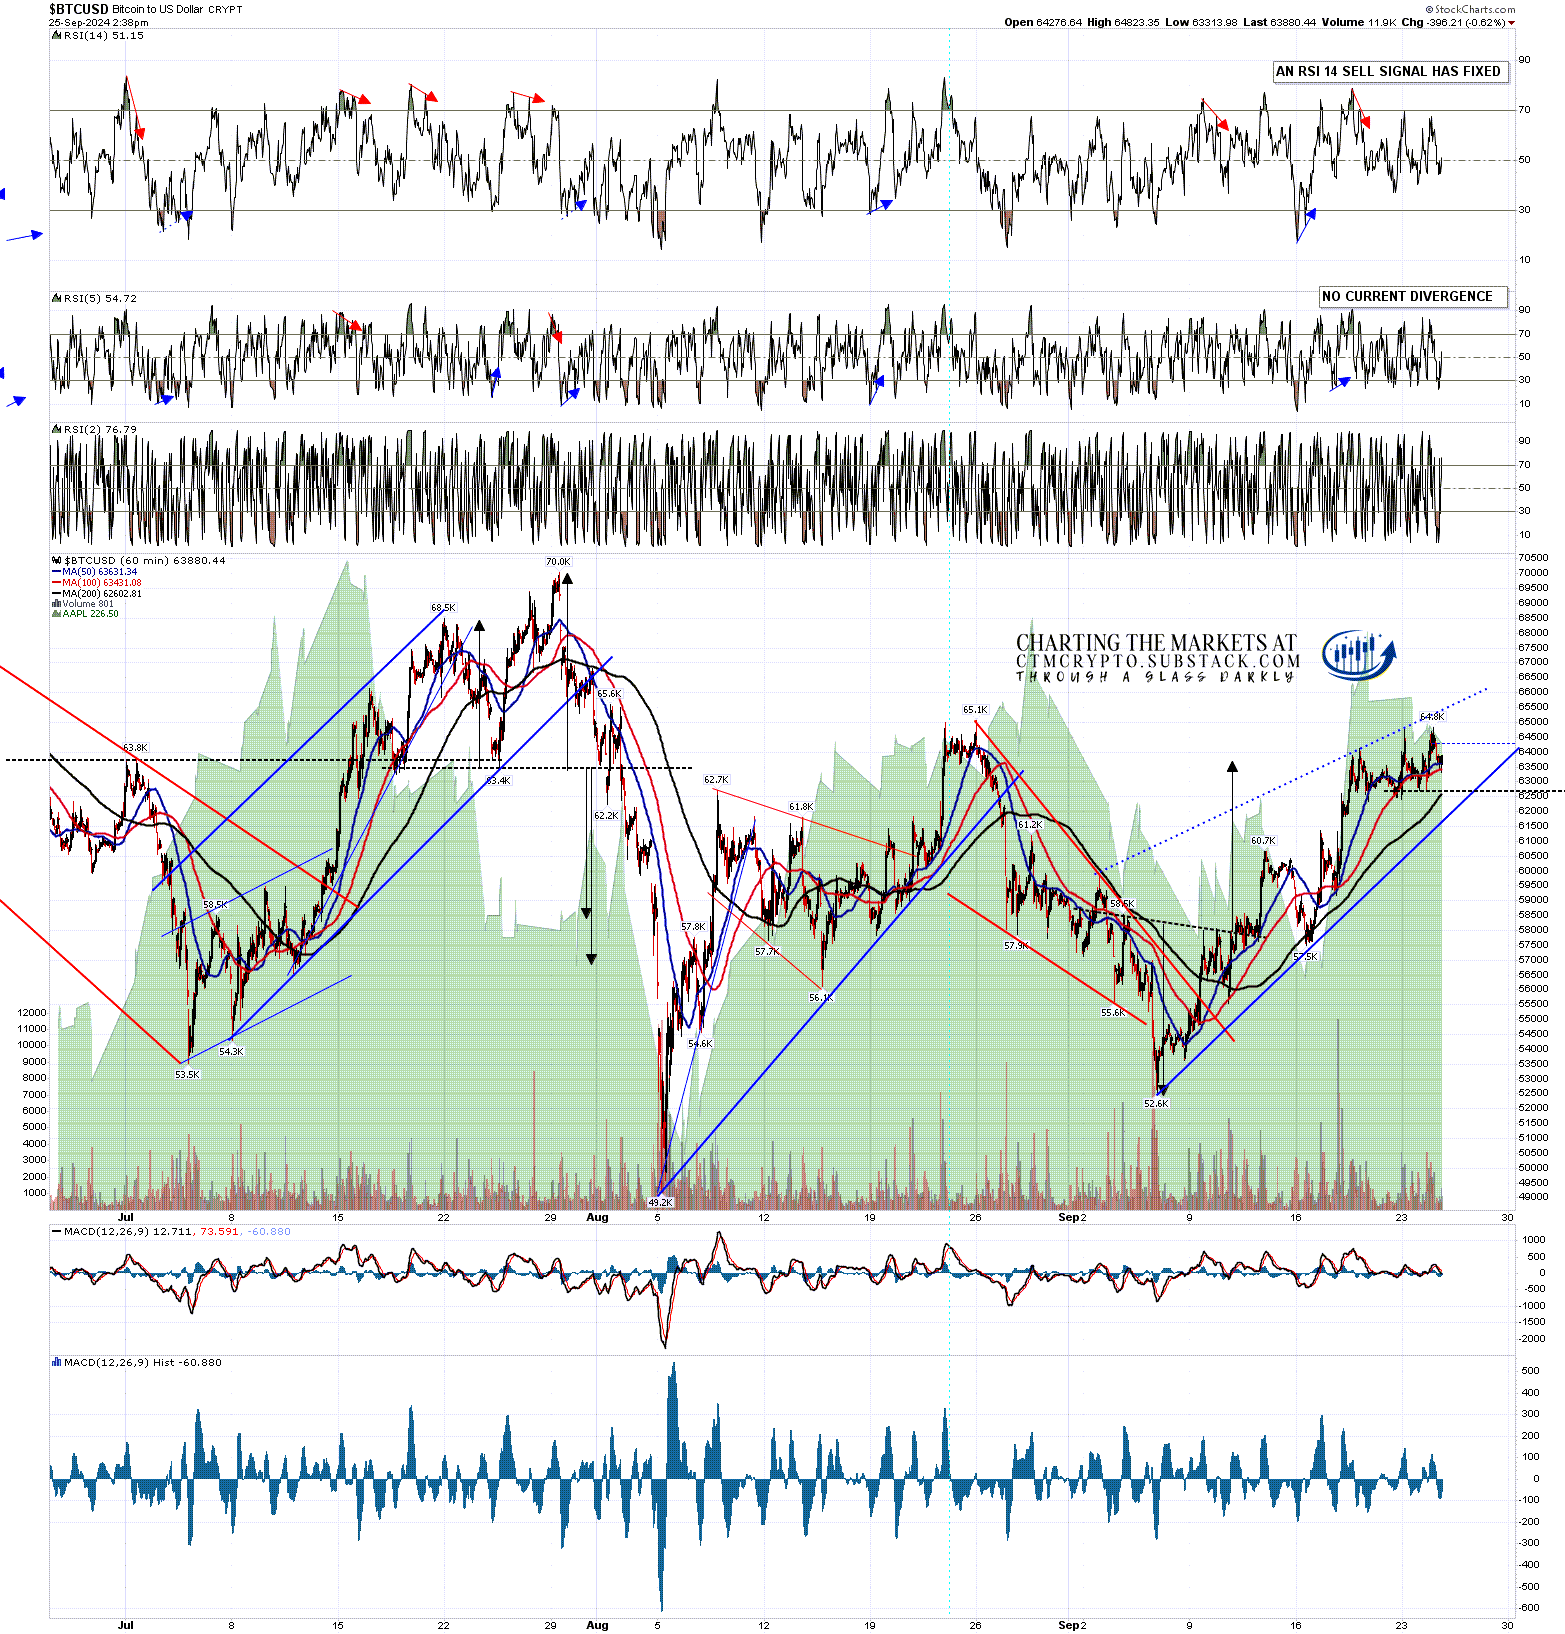
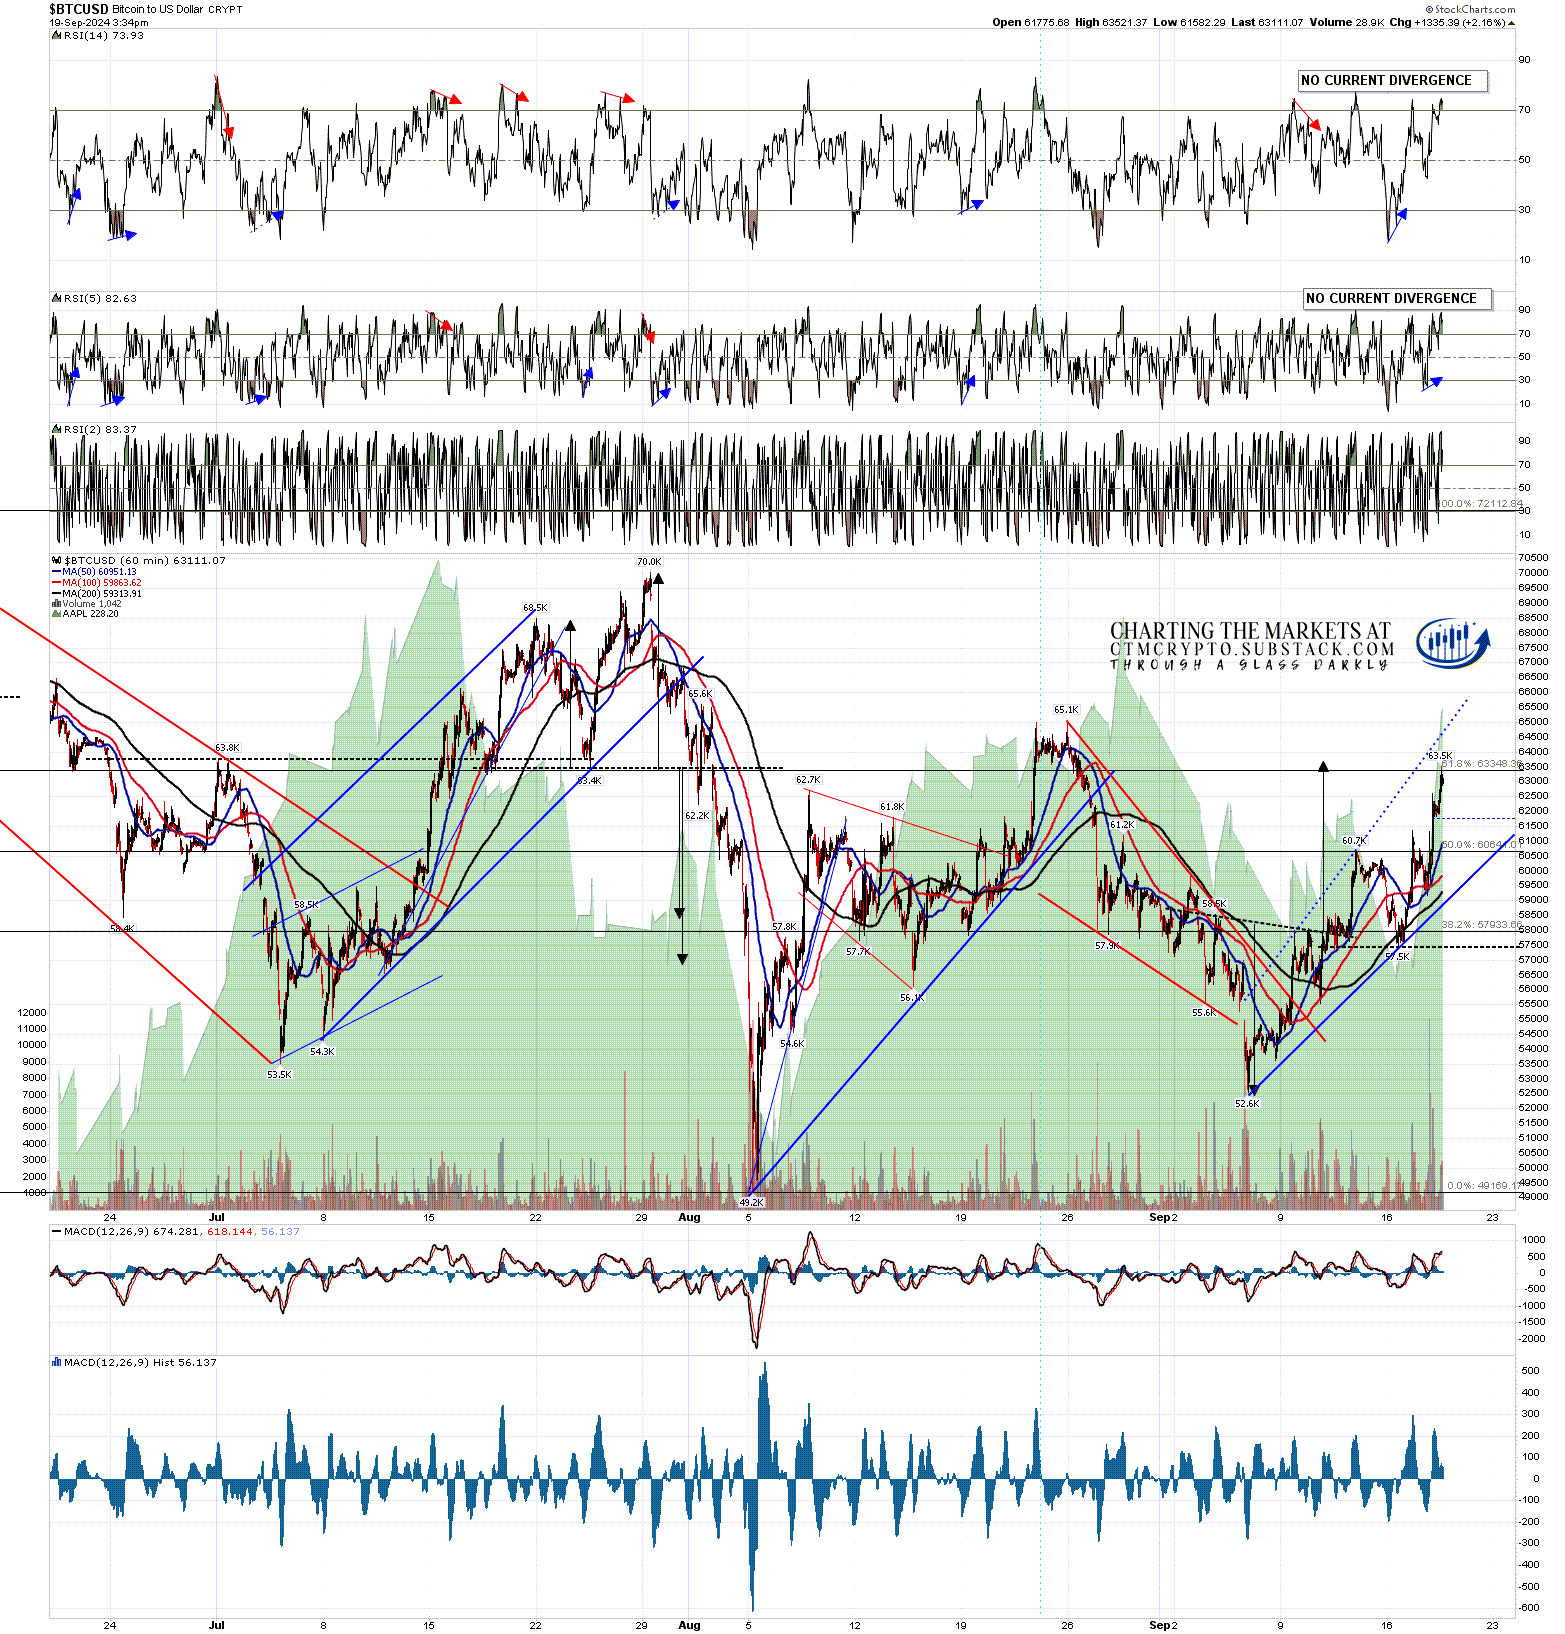
BTCUSD daily chart:
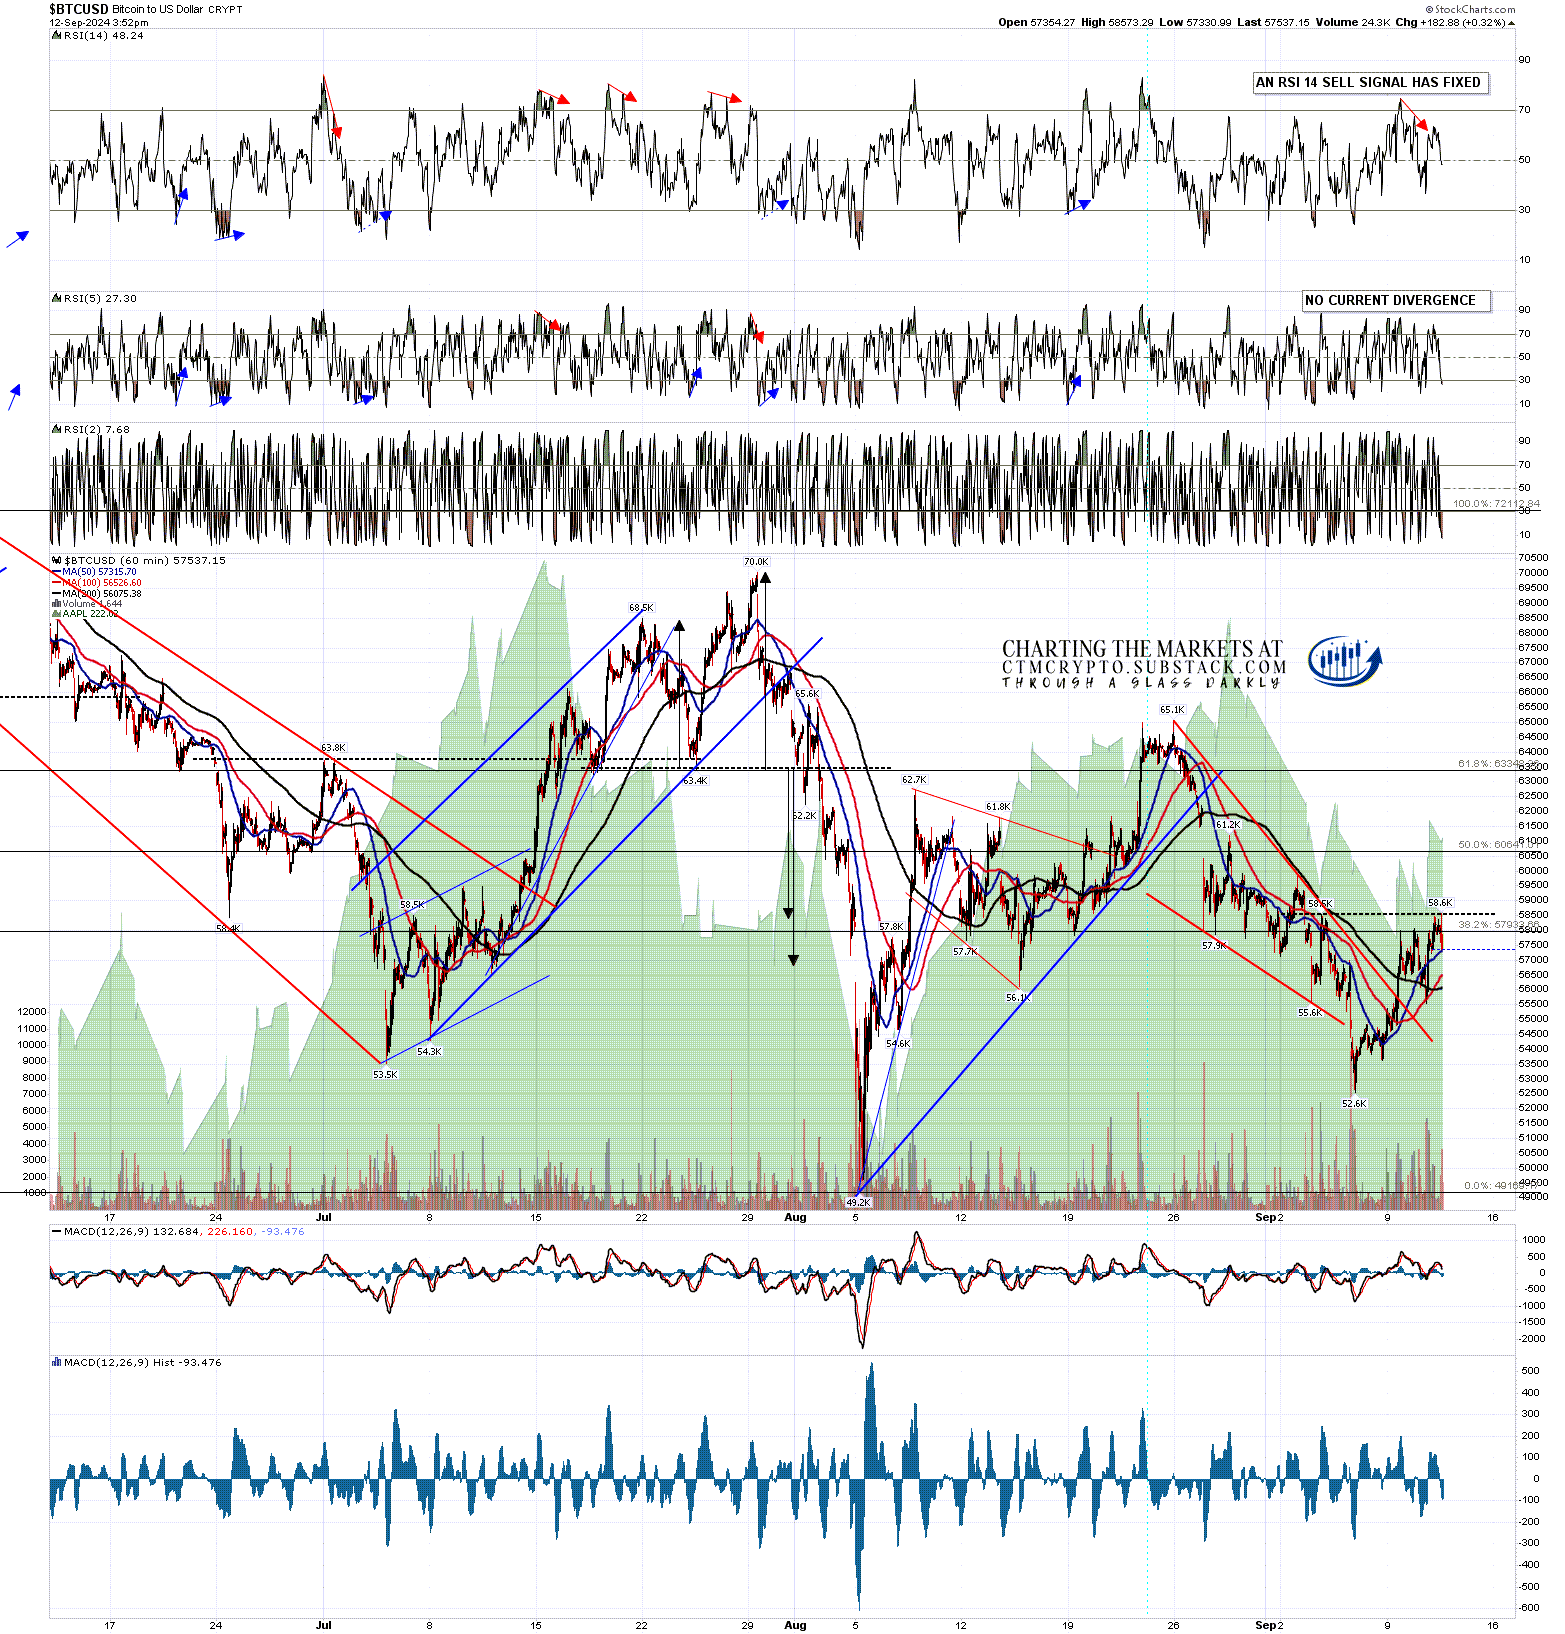
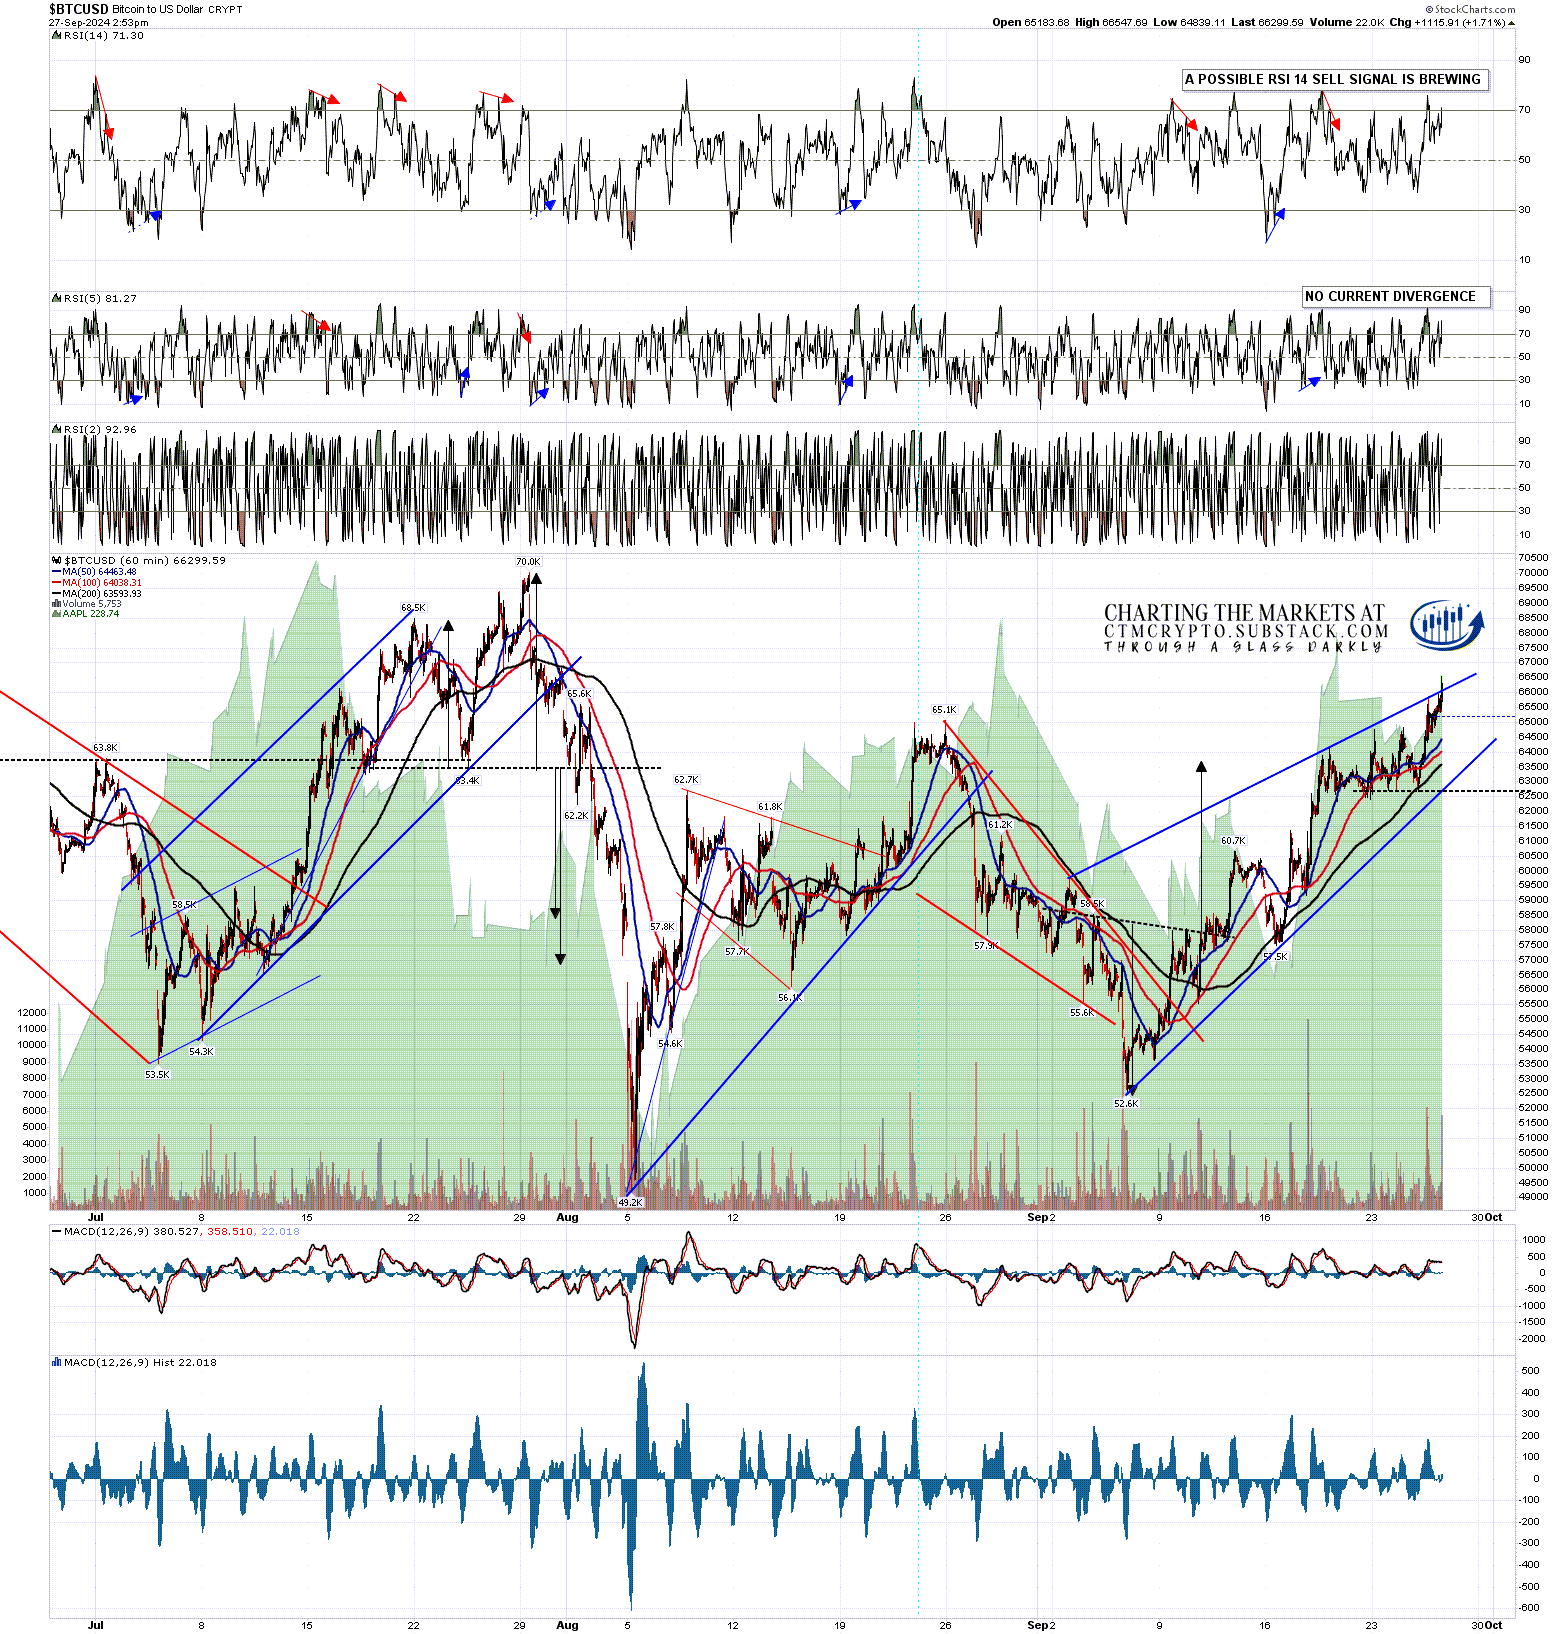
On the Bitcoin hourly chart there is now a high quality rising wedge from the last low, that is breaking up slightly. That could be a break up, but might well be a bearish overthrow before the wedge breaks down. A possible hourly RSI 14 sell signal is brewing.
BTCUSD 60min chart:
On Ethereum there have been seven daily RSI 5 sell signals on the chart below before the current one, two of which were weak sell signals. Five of those made the full target at 30 on the RSI 5, including both weak signals, and the other two made the minimum target in the 35 area.
ETHUSD daily chart:
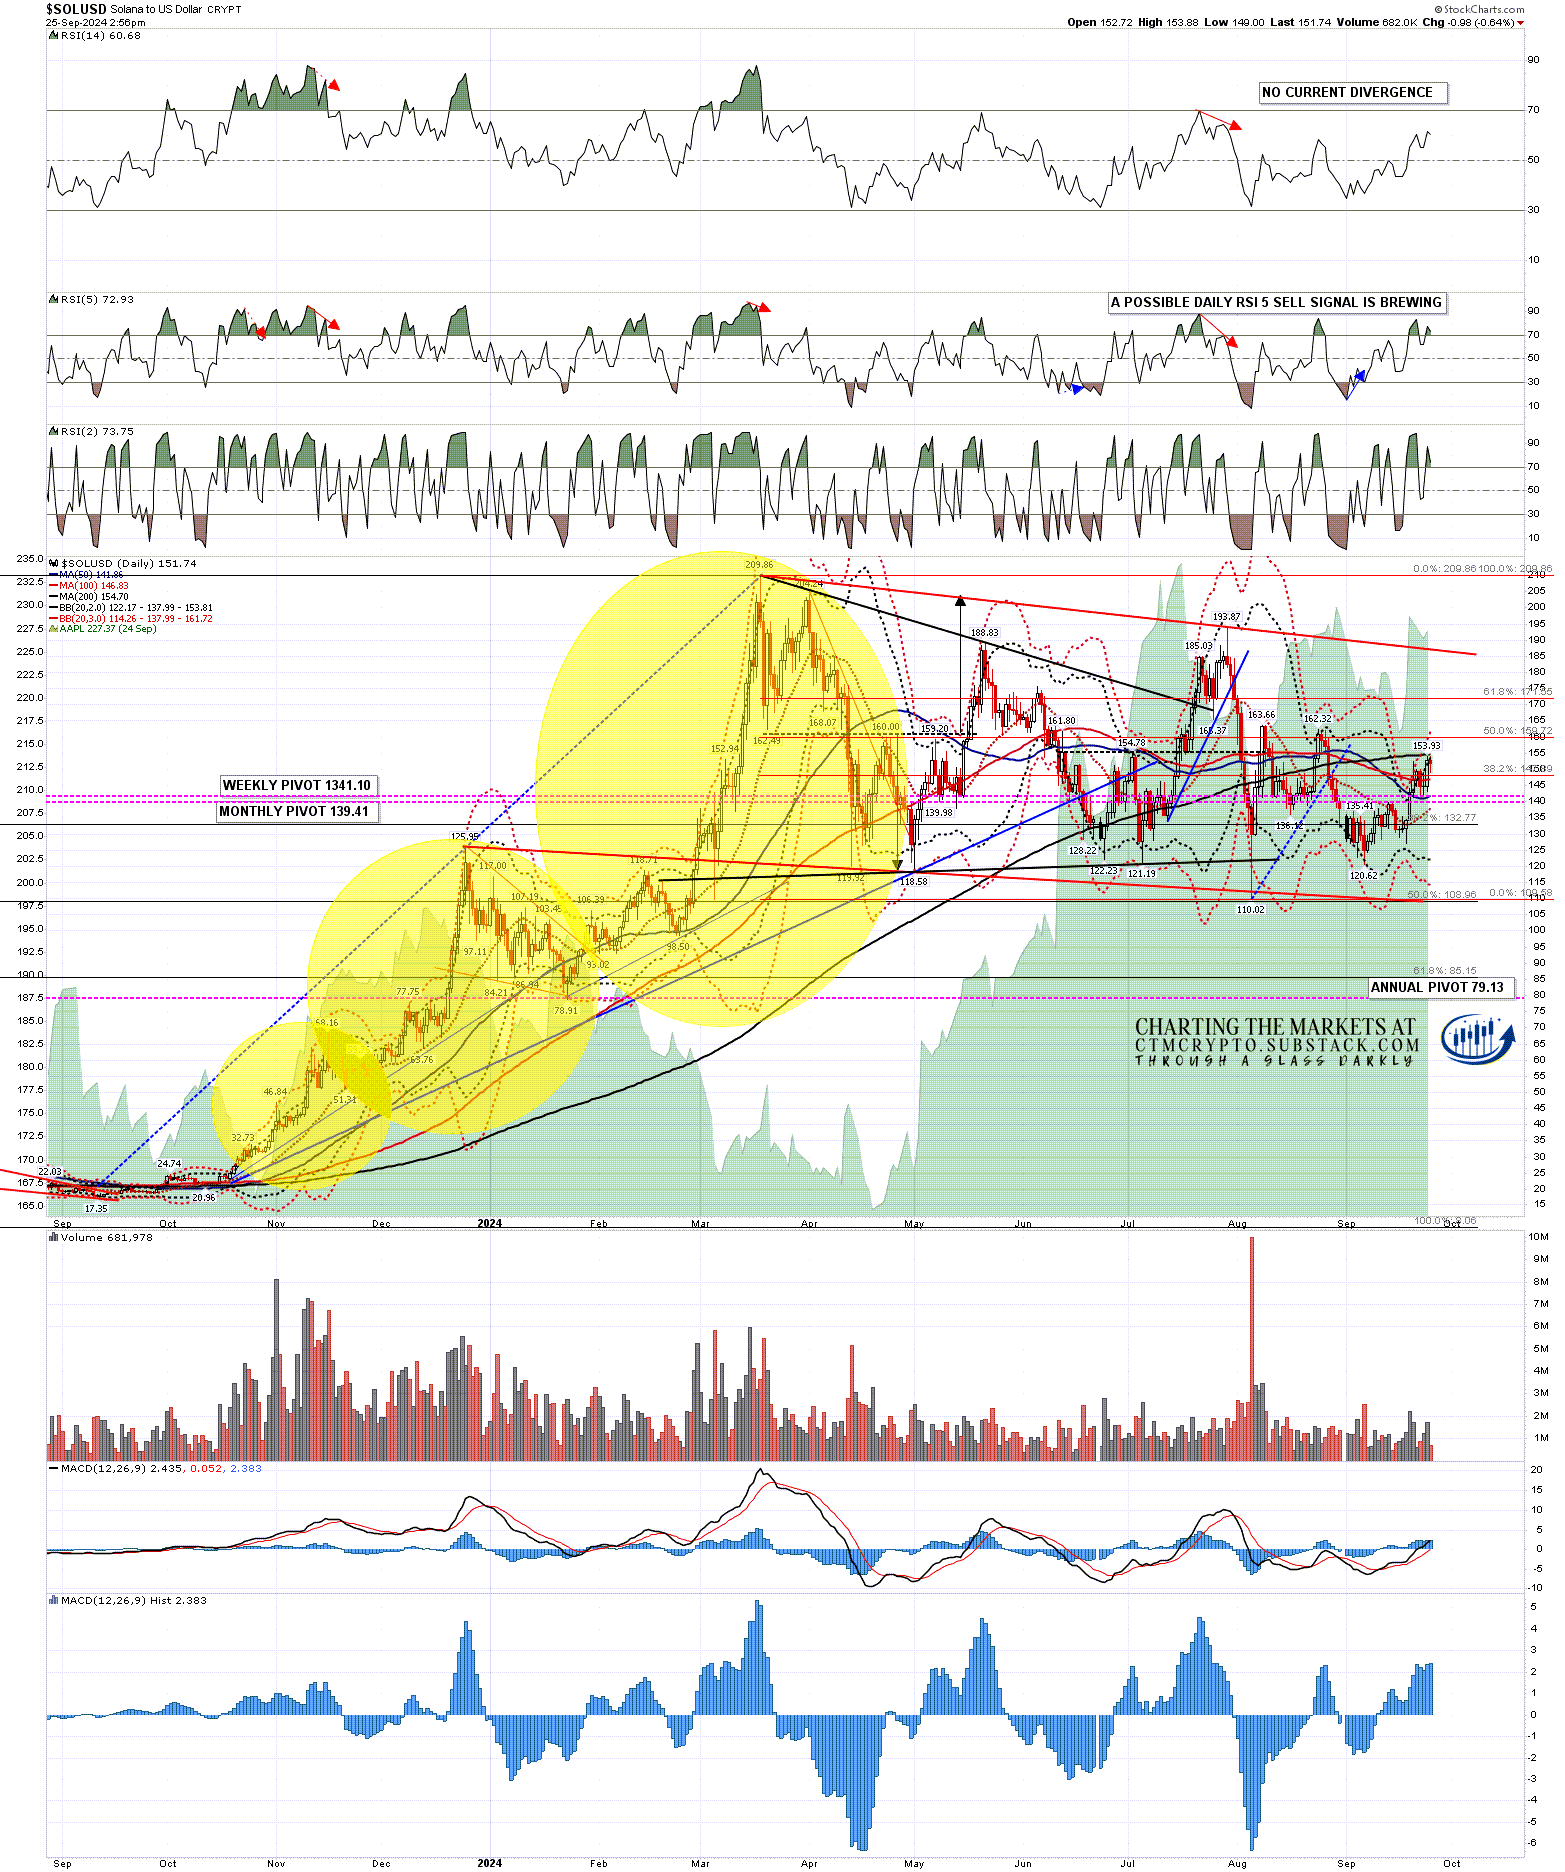
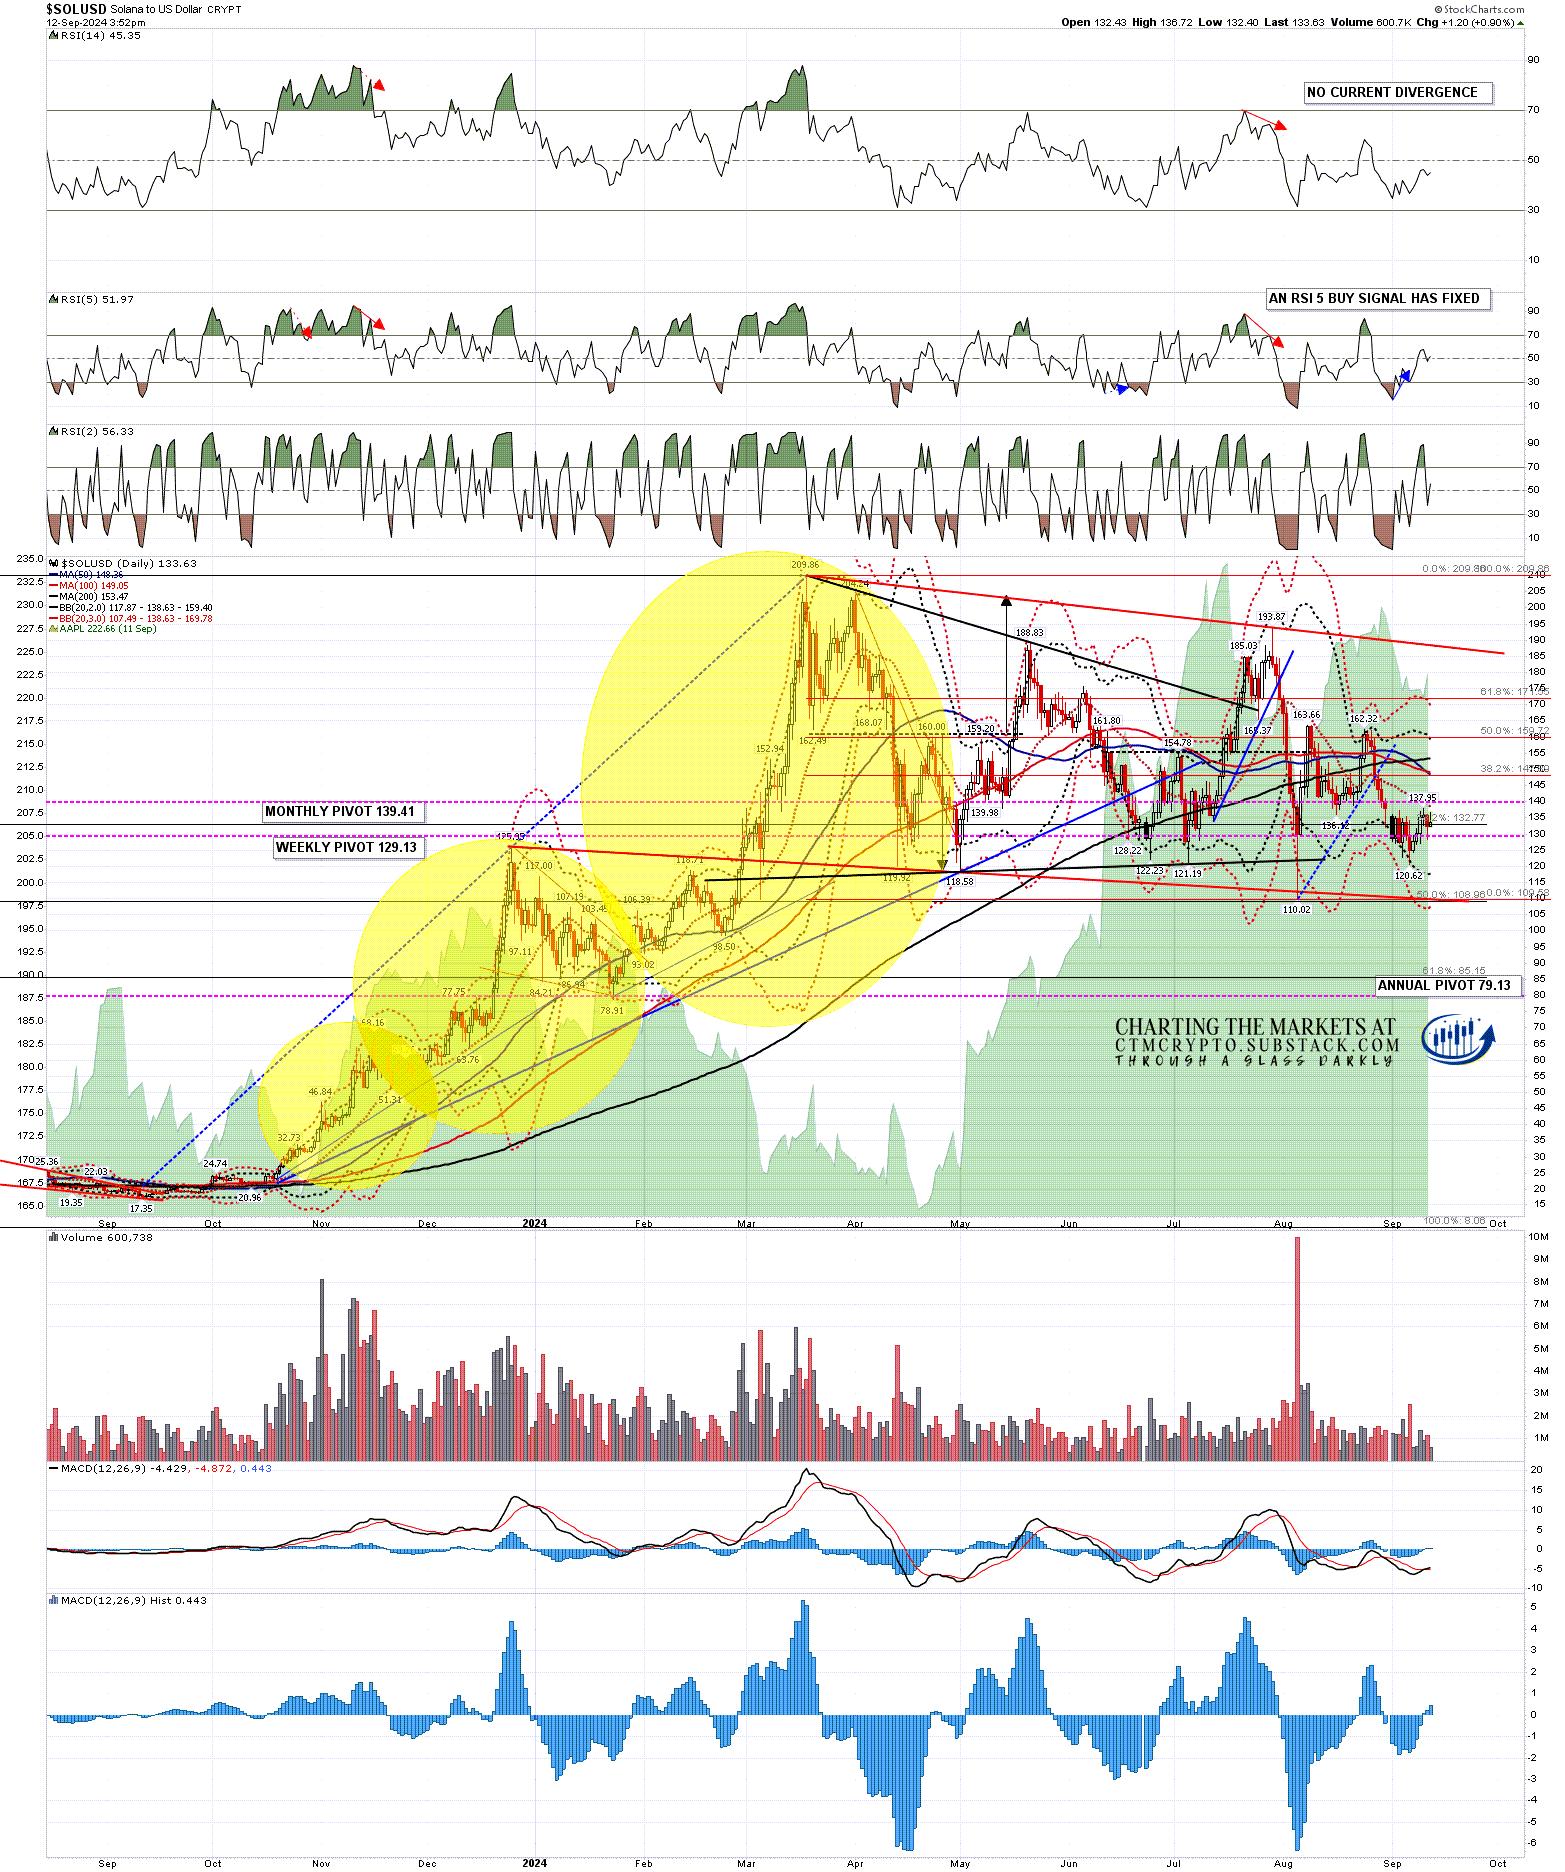
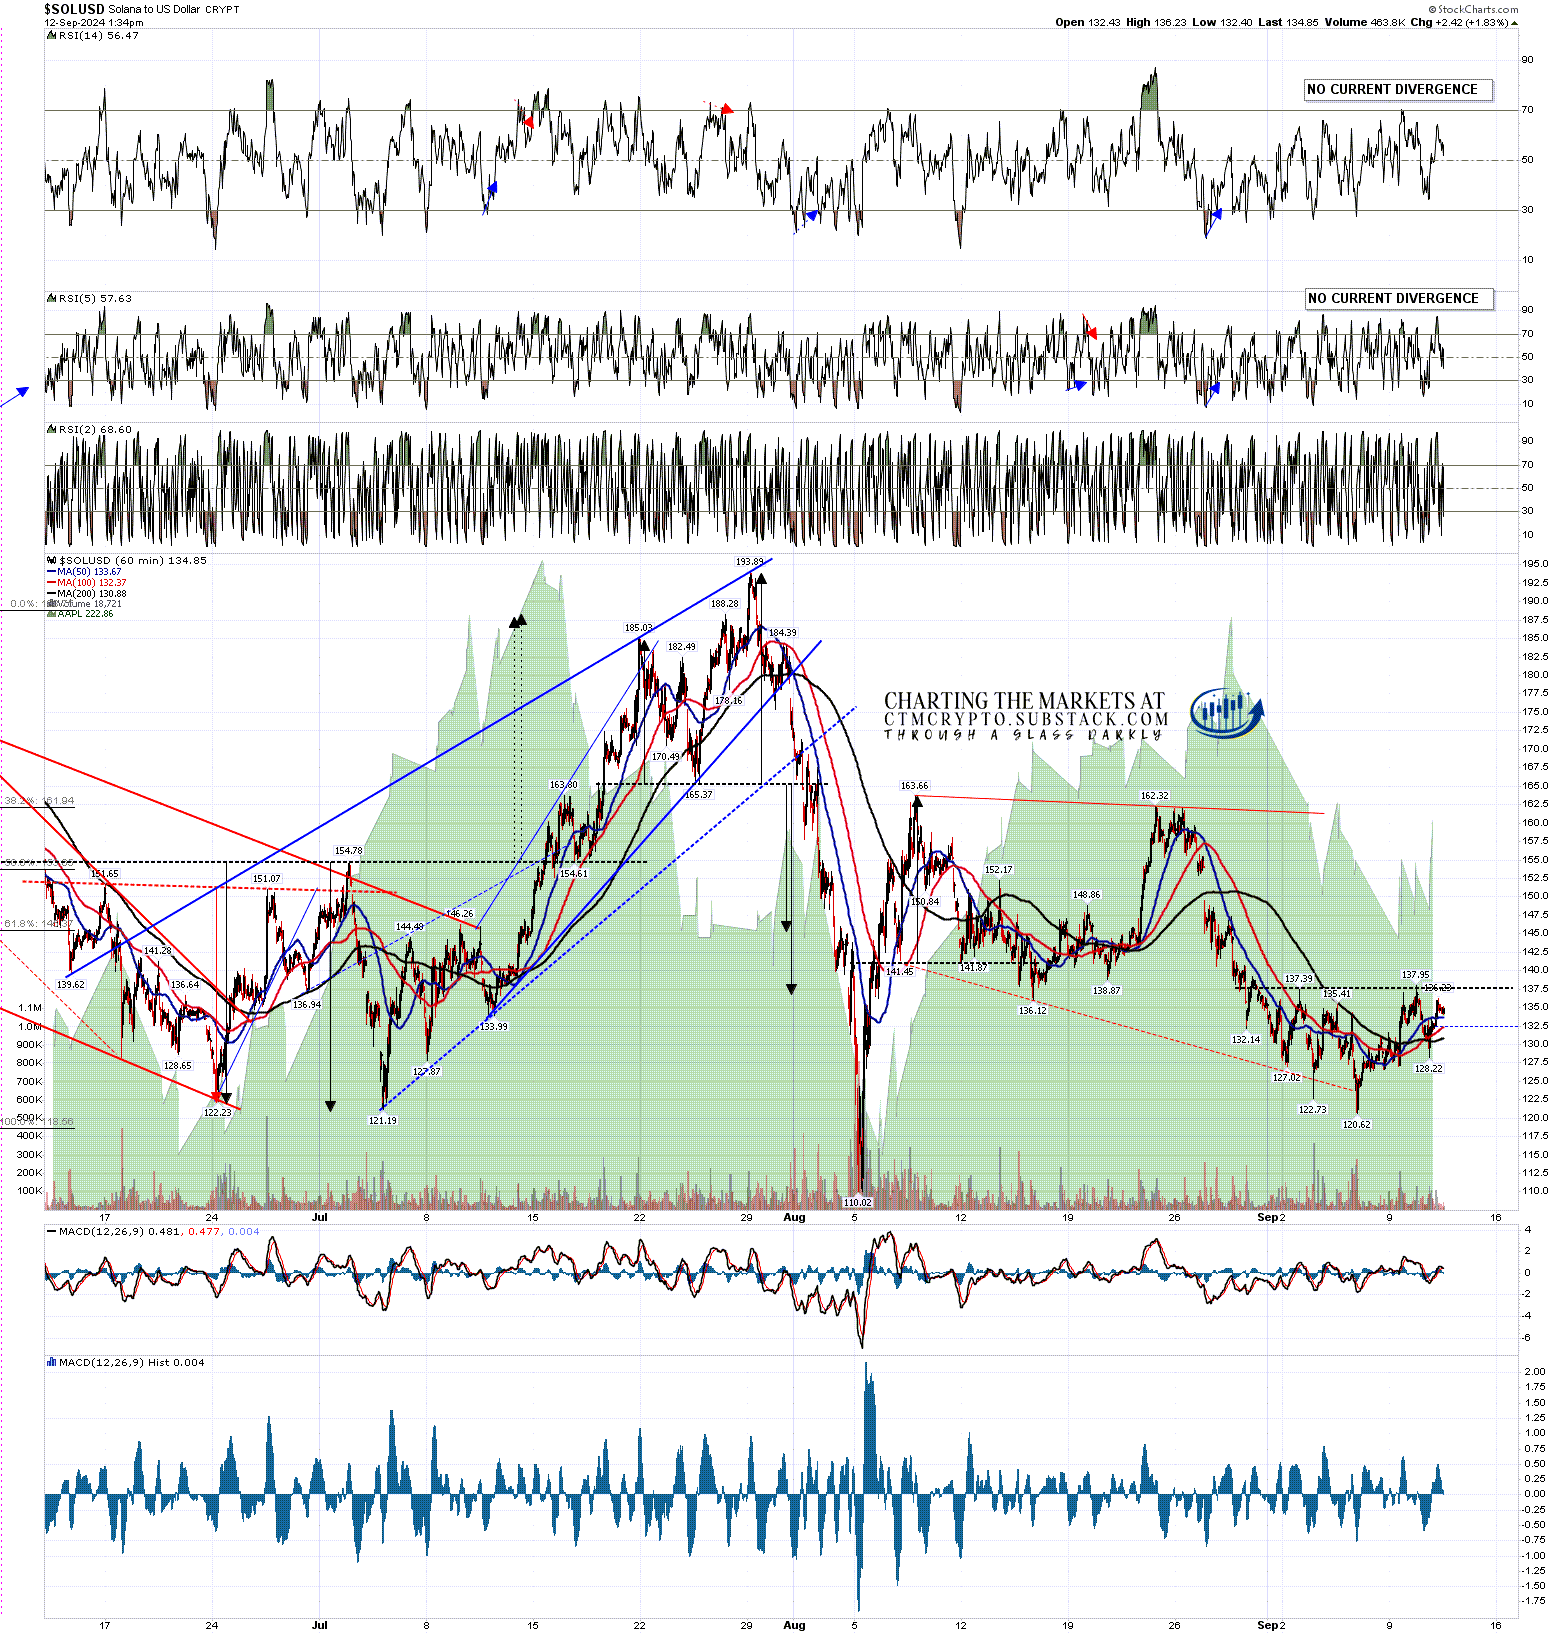
On Solana there have been four RSI 5 sell signals on the daily chart below before the current one, and one of those failed, with another two reaching the full target at 30 and the other reaching the minimum target at 35.
SOLUSD daily chart:
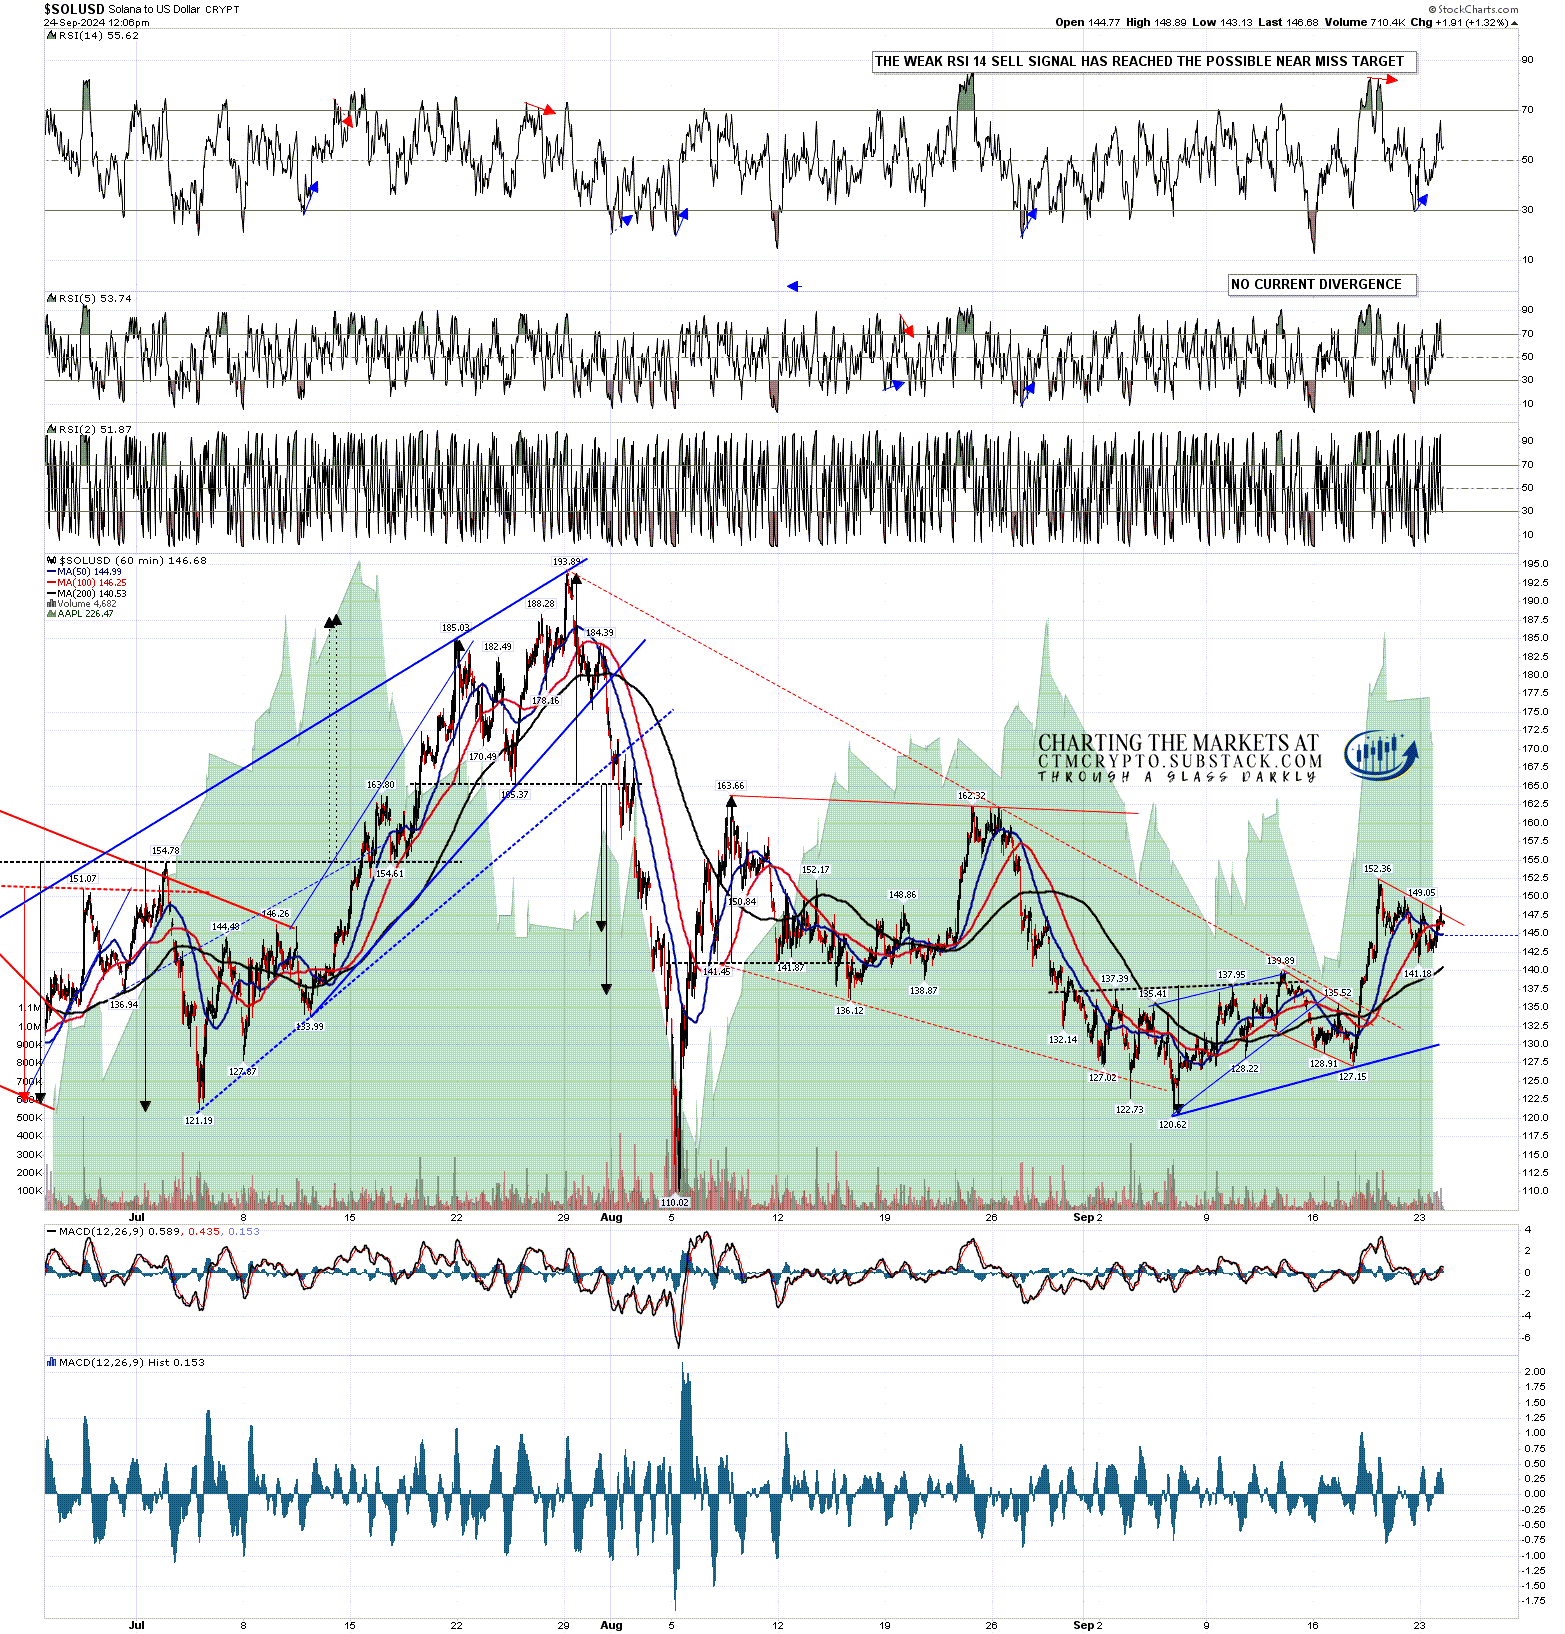
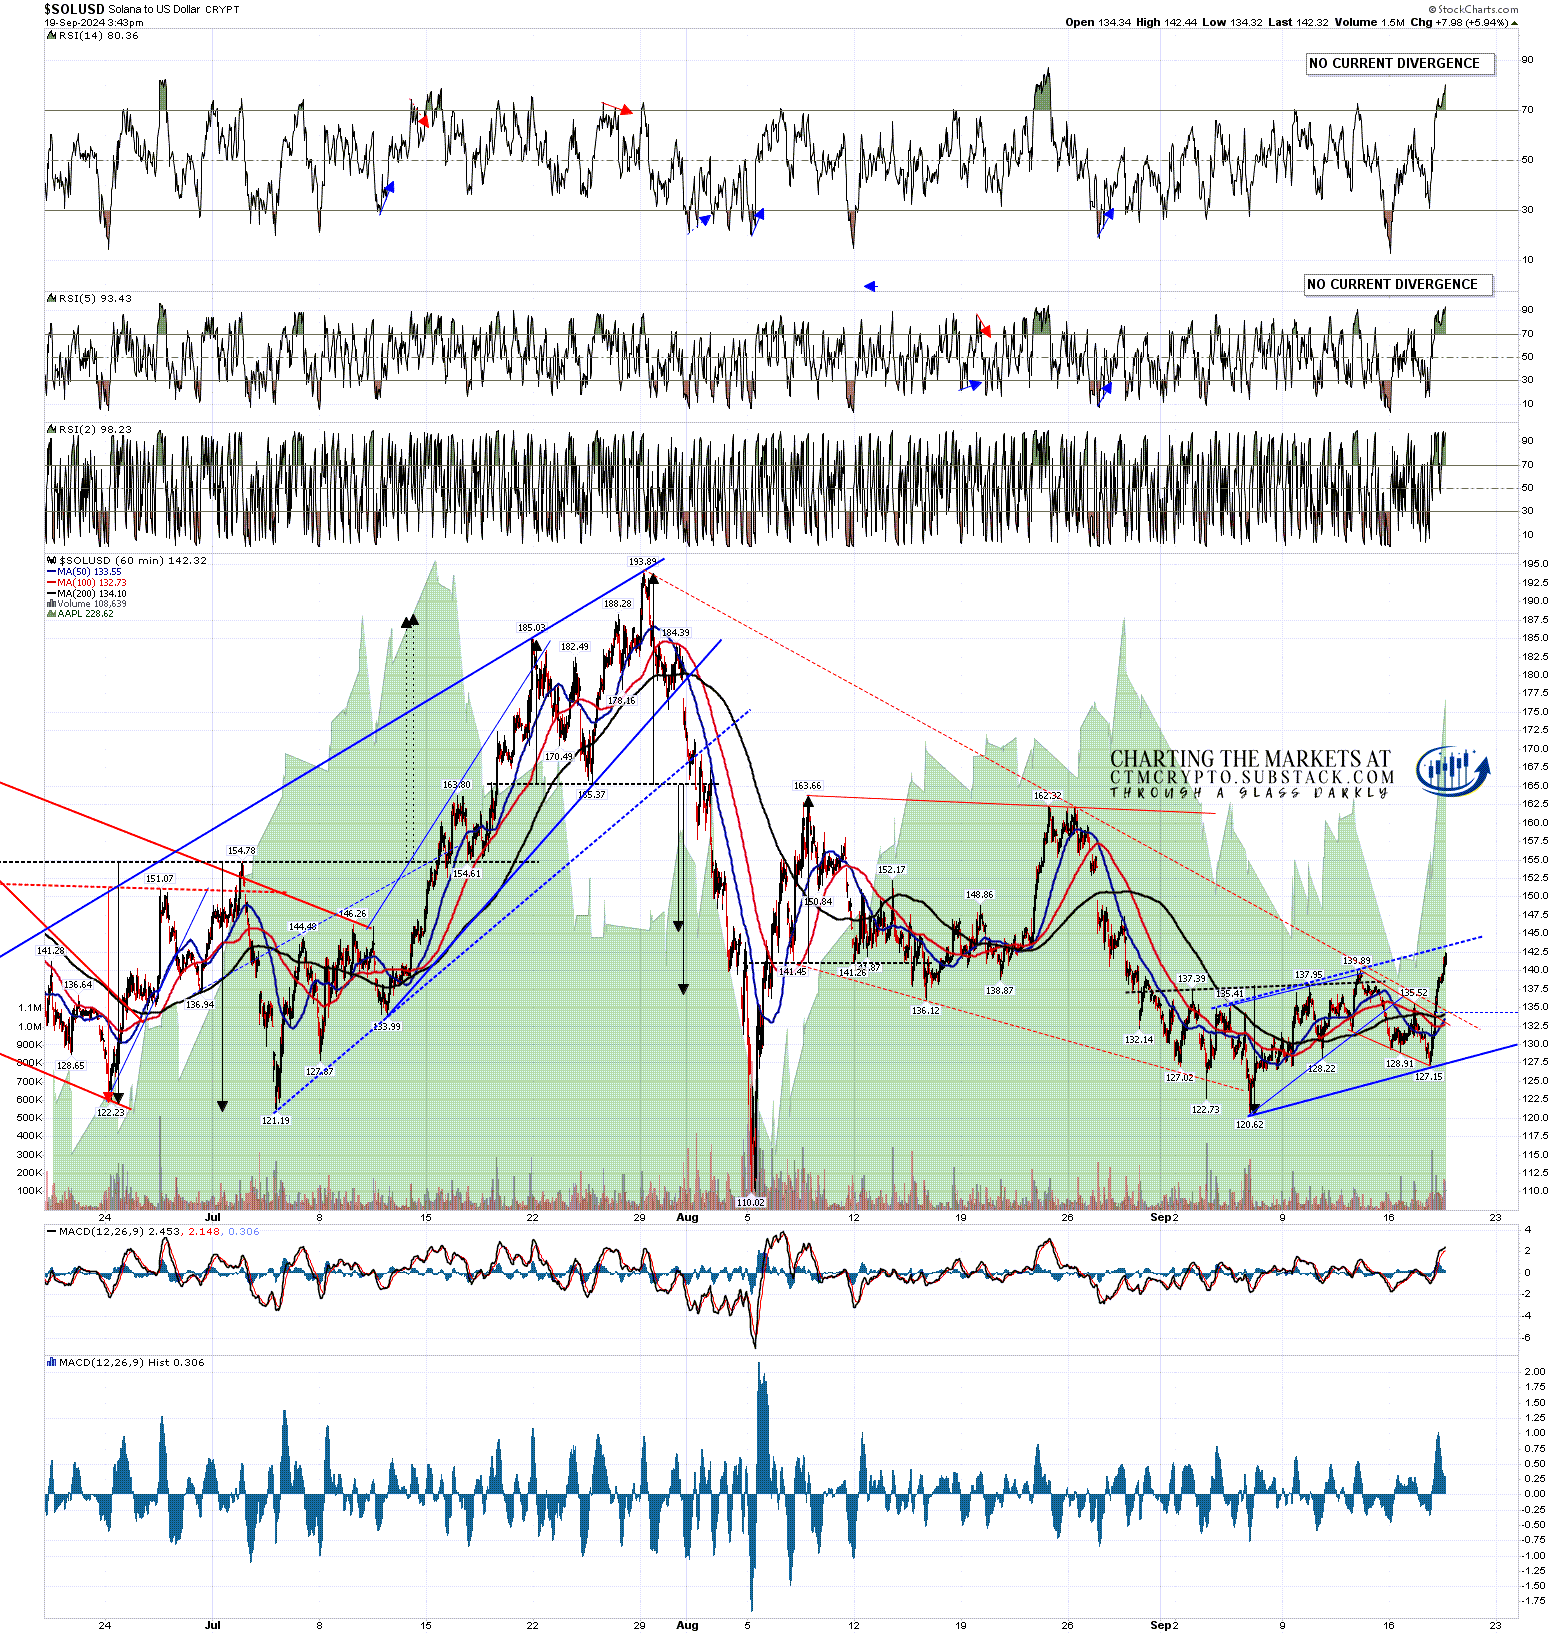
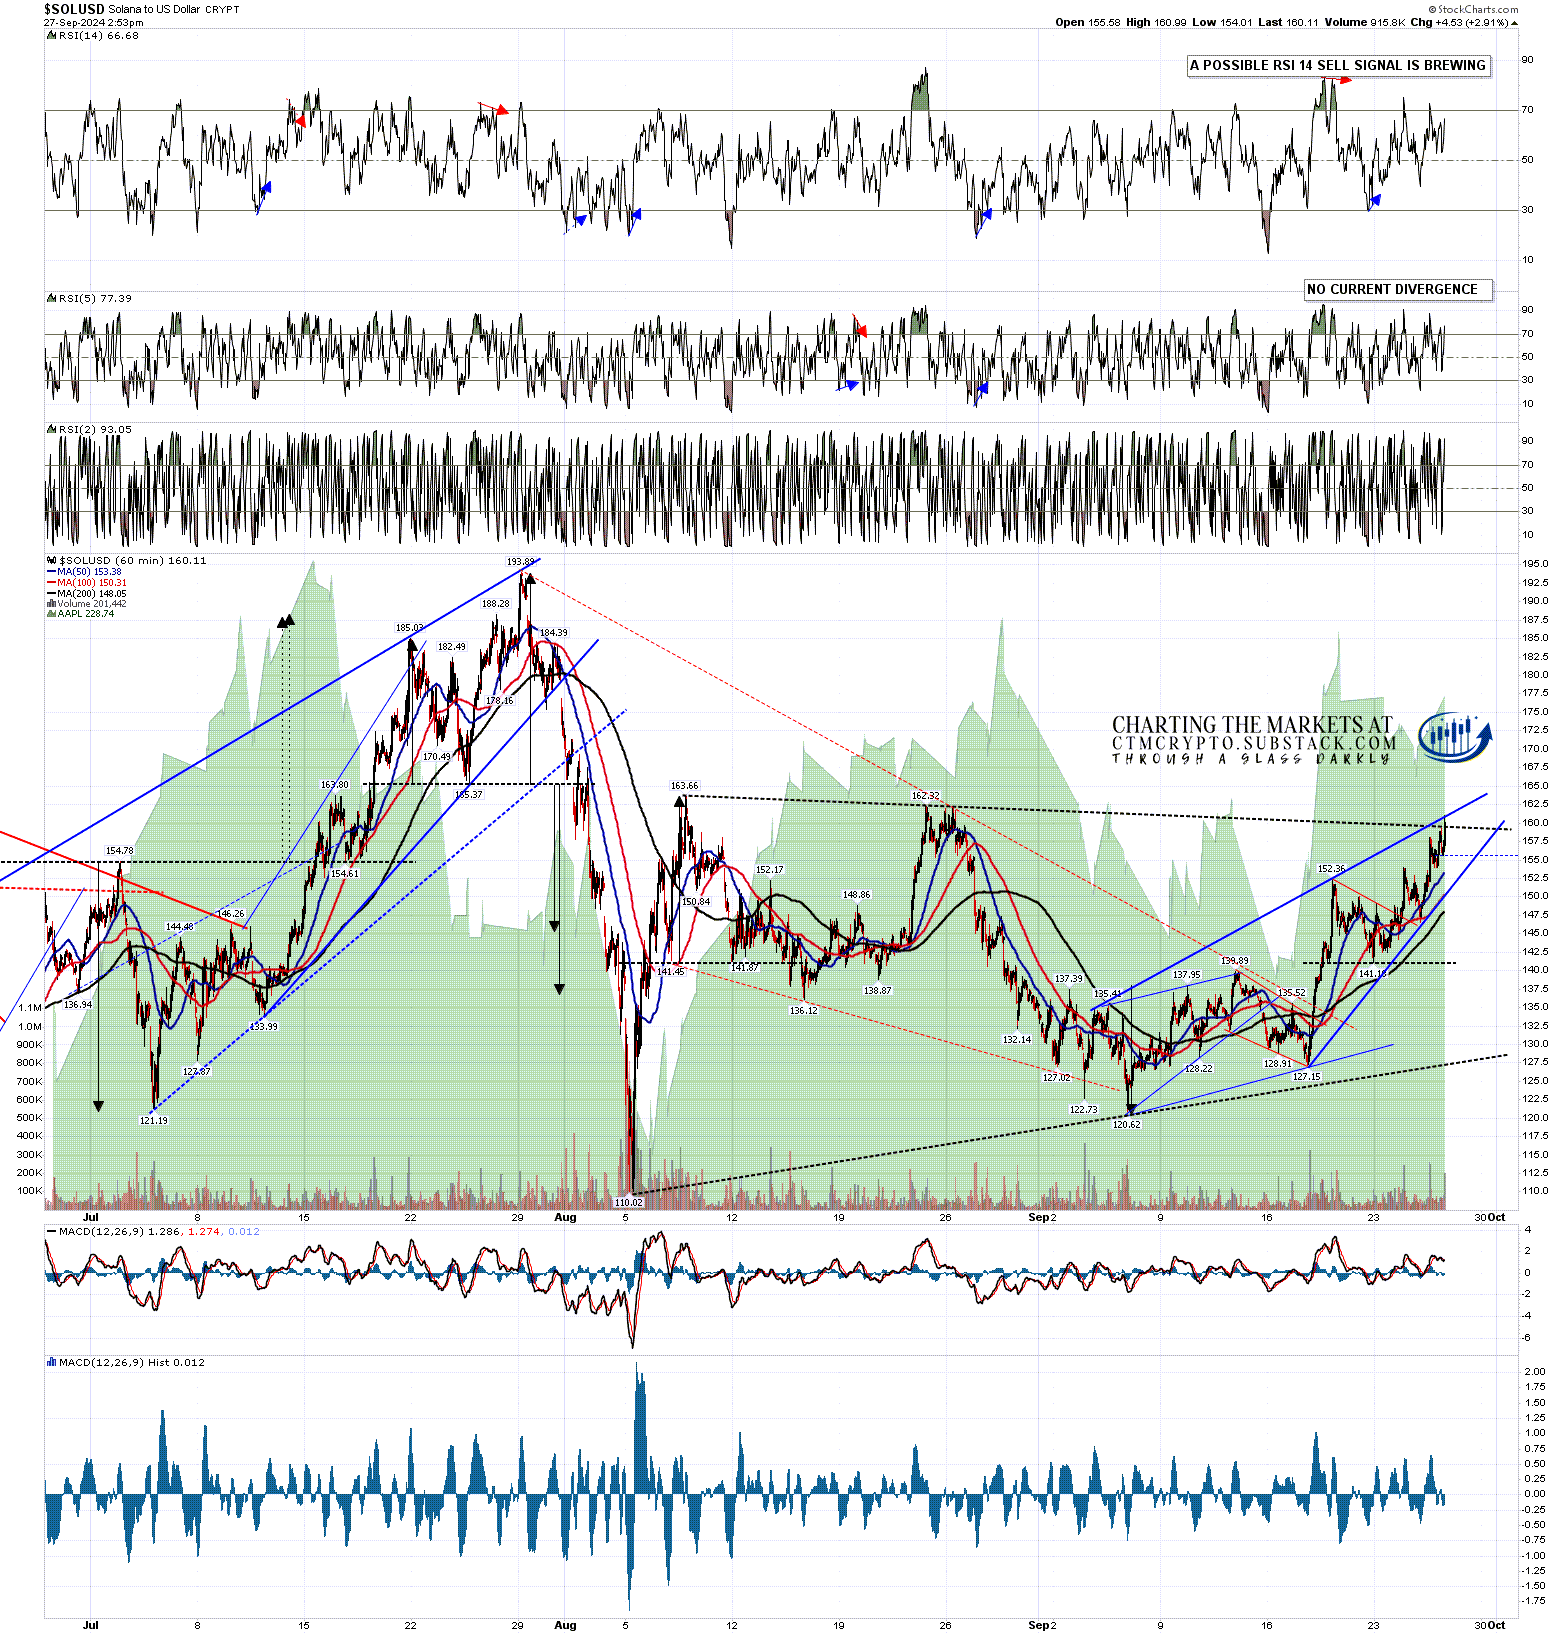
When I capped the chart below Solana was testing a possible triangle resistance trendline which is now breaking, but there is another possible hourly RSI 14 sell signal now brewing there, and the move this morning has hit the resistance trendline on a possible short term rising wedge.
SOLUSD 60min chart:
Could Crypto break up through all this? Absolutely yes, as any long or short setup can fail. At this point though I’d lean 80% short on this setup and at minimum I’d be very cautious on the long side. At least a decent retracement looks likely. We’ll see.
If you’d like to see more of these posts and the other Crypto videos and information I post, please subscribe for free to my Crypto substack.
I'm also to be found at Arion Partners, though as a student rather than as a teacher. I've been charting Cryptos for some years now, but am learning to trade and invest in them directly, and Arion Partners are my guide around a space that might reasonably be compared to the Wild West in one of their rougher years.