- WE'RE JUST RANDOM SPECKS OF DUST IN A TORNADO TO THE MARKETS .......
- CHARTISTS MUST PUT ALL BIAS ASIDE AND LET THE CHARTS DO THE TALKING OR WE'LL SEE ONLY WHAT WE WANT TO SEE
- This blog has a copy of all header posts that I publish anywhere, so that those interested in seeing what my thoughts are on the markets can find them easily.
- I will be answering questions and responding to comments, so feel free to respond to any posts and I will see your comment even if it is not on the most recent post.
- If you're interested in seeing any intraday charts I post, I do that on twitter, and my twitter handle is @shjackcharts.
- The charts in the posts are as large as I can practically make them. if you would like to look at one more closely, click on it, and the link will take you to a larger version at screencast. If you click on that again, you will get a full page version, and can use the resizing function on your browser to enlarge parts of interest further.

Friday, 31 January 2025

The January Barometer & Other Stats

In my post on Monday 13th January I was looking at the four bull flag setups on SPX, QQQ, DIA and IWM, and the possibility that the bull flags would break up into retests of the all time highs across all four of those. SPX and DIA have made their new all time highs now, QQQ is getting close and I have some doubts about whether IWM will make it. I’ll review those today but first some historical stats.

The January Barometer is triggered when January closes down, and will often deliver a down year, but unless we see a truly impressive decline today that is now irrelevant for this year.

The second statistic I’ve been looking at today is the record of stock markets in the year after a presidential election. Of the last 21 of those going back to Roosevelt in 1941, eight delivered a down year, making this overall weakly bullish.

However this is really better viewed in two parts. For 1941 through 1981 there were seven down years and four up years, making this significantly bearish. After that though, looking at 1985 through 2021, there was only one red close (2001) making this in more recent years very significantly bullish. An interesting stat for this year.

More immediately though, today is the last trading day of January. The stats for the first trading day of the month are often bullish, and one of the most bullish of the year is the first trading day of February, where US equity indices close green over 80% of the time. Tuesday and Thursday also lean significantly bullish and Wednesday leans bearish. There is therefore a very strong possibility of a strong Monday and a bullish leaning weak overall. With that in mind let’s review the four indices against the bull flags I posted on Monday 13th January.

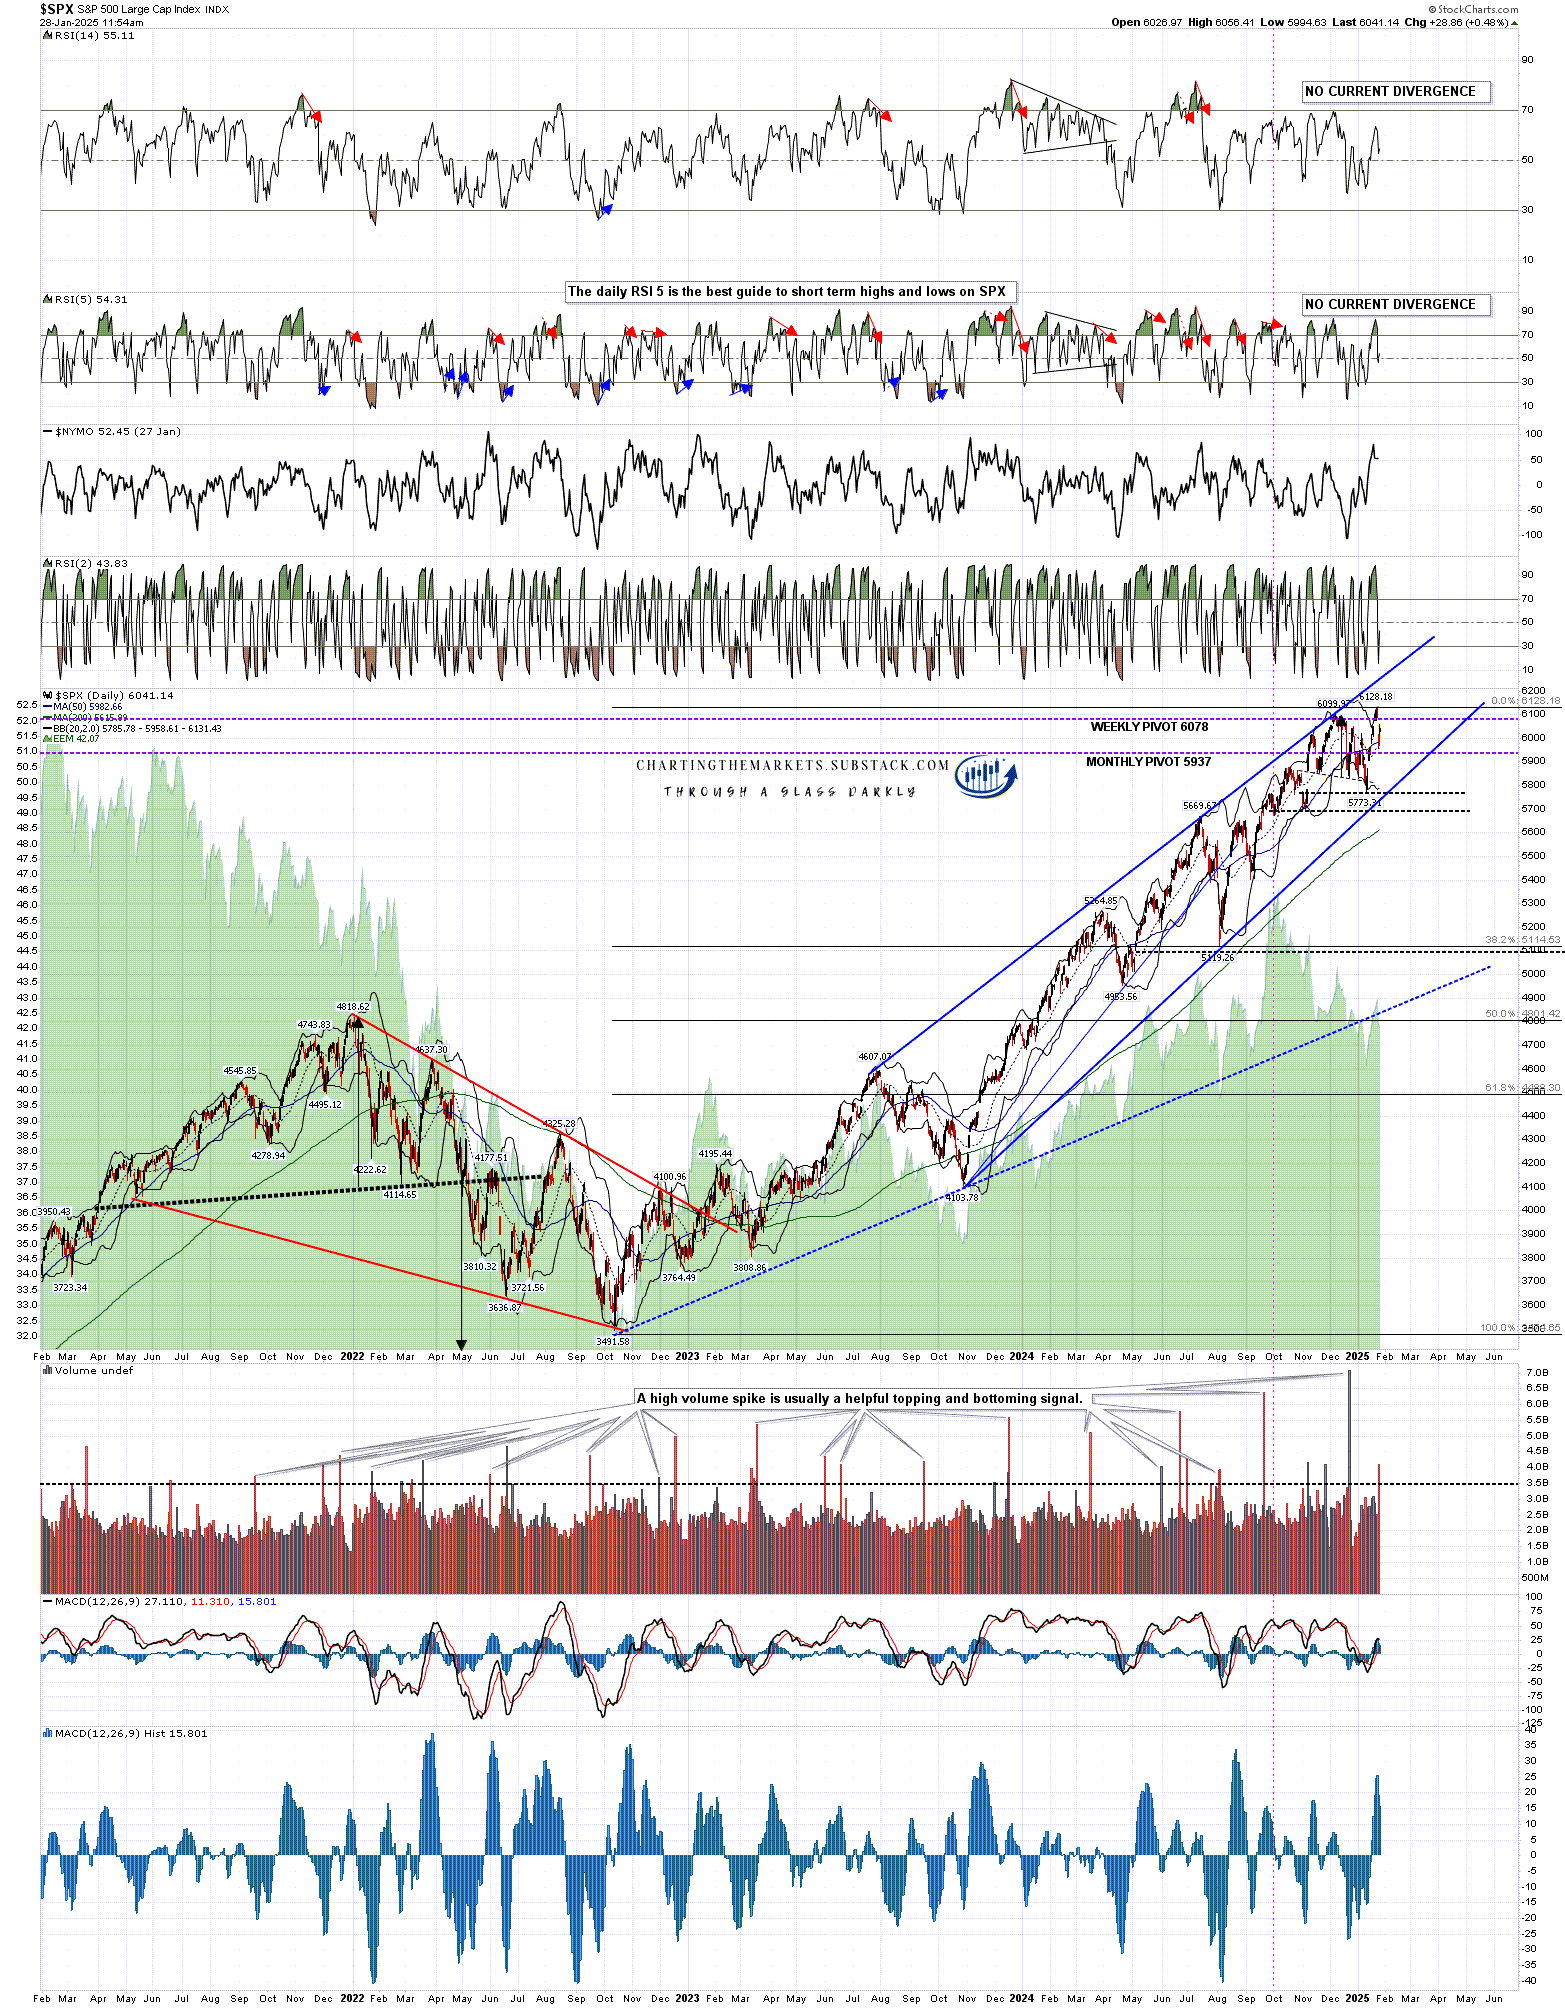
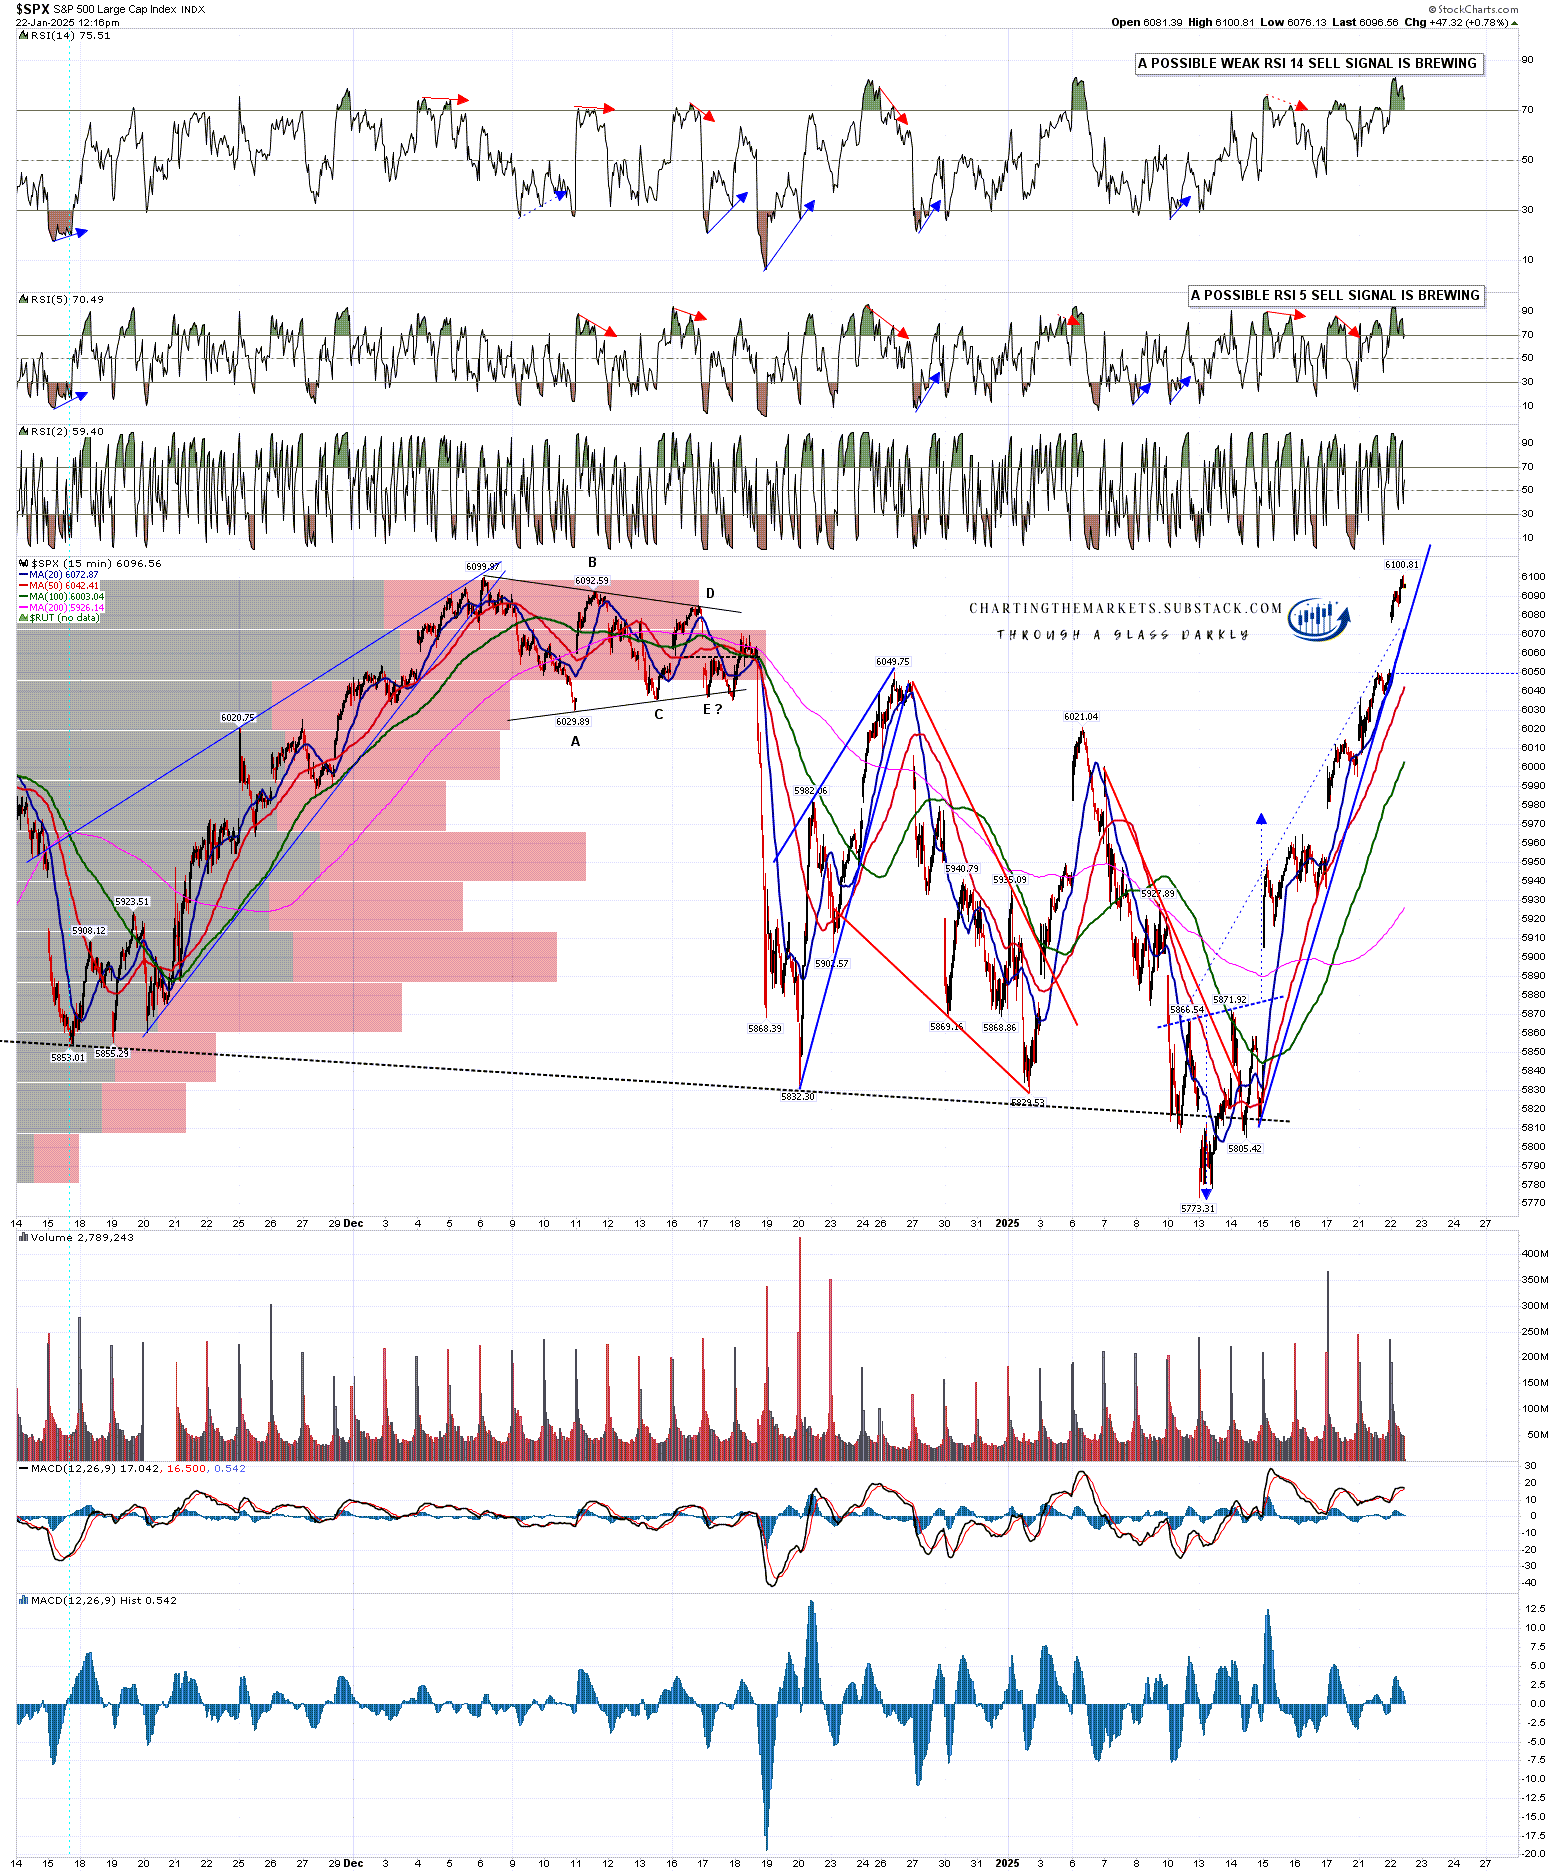
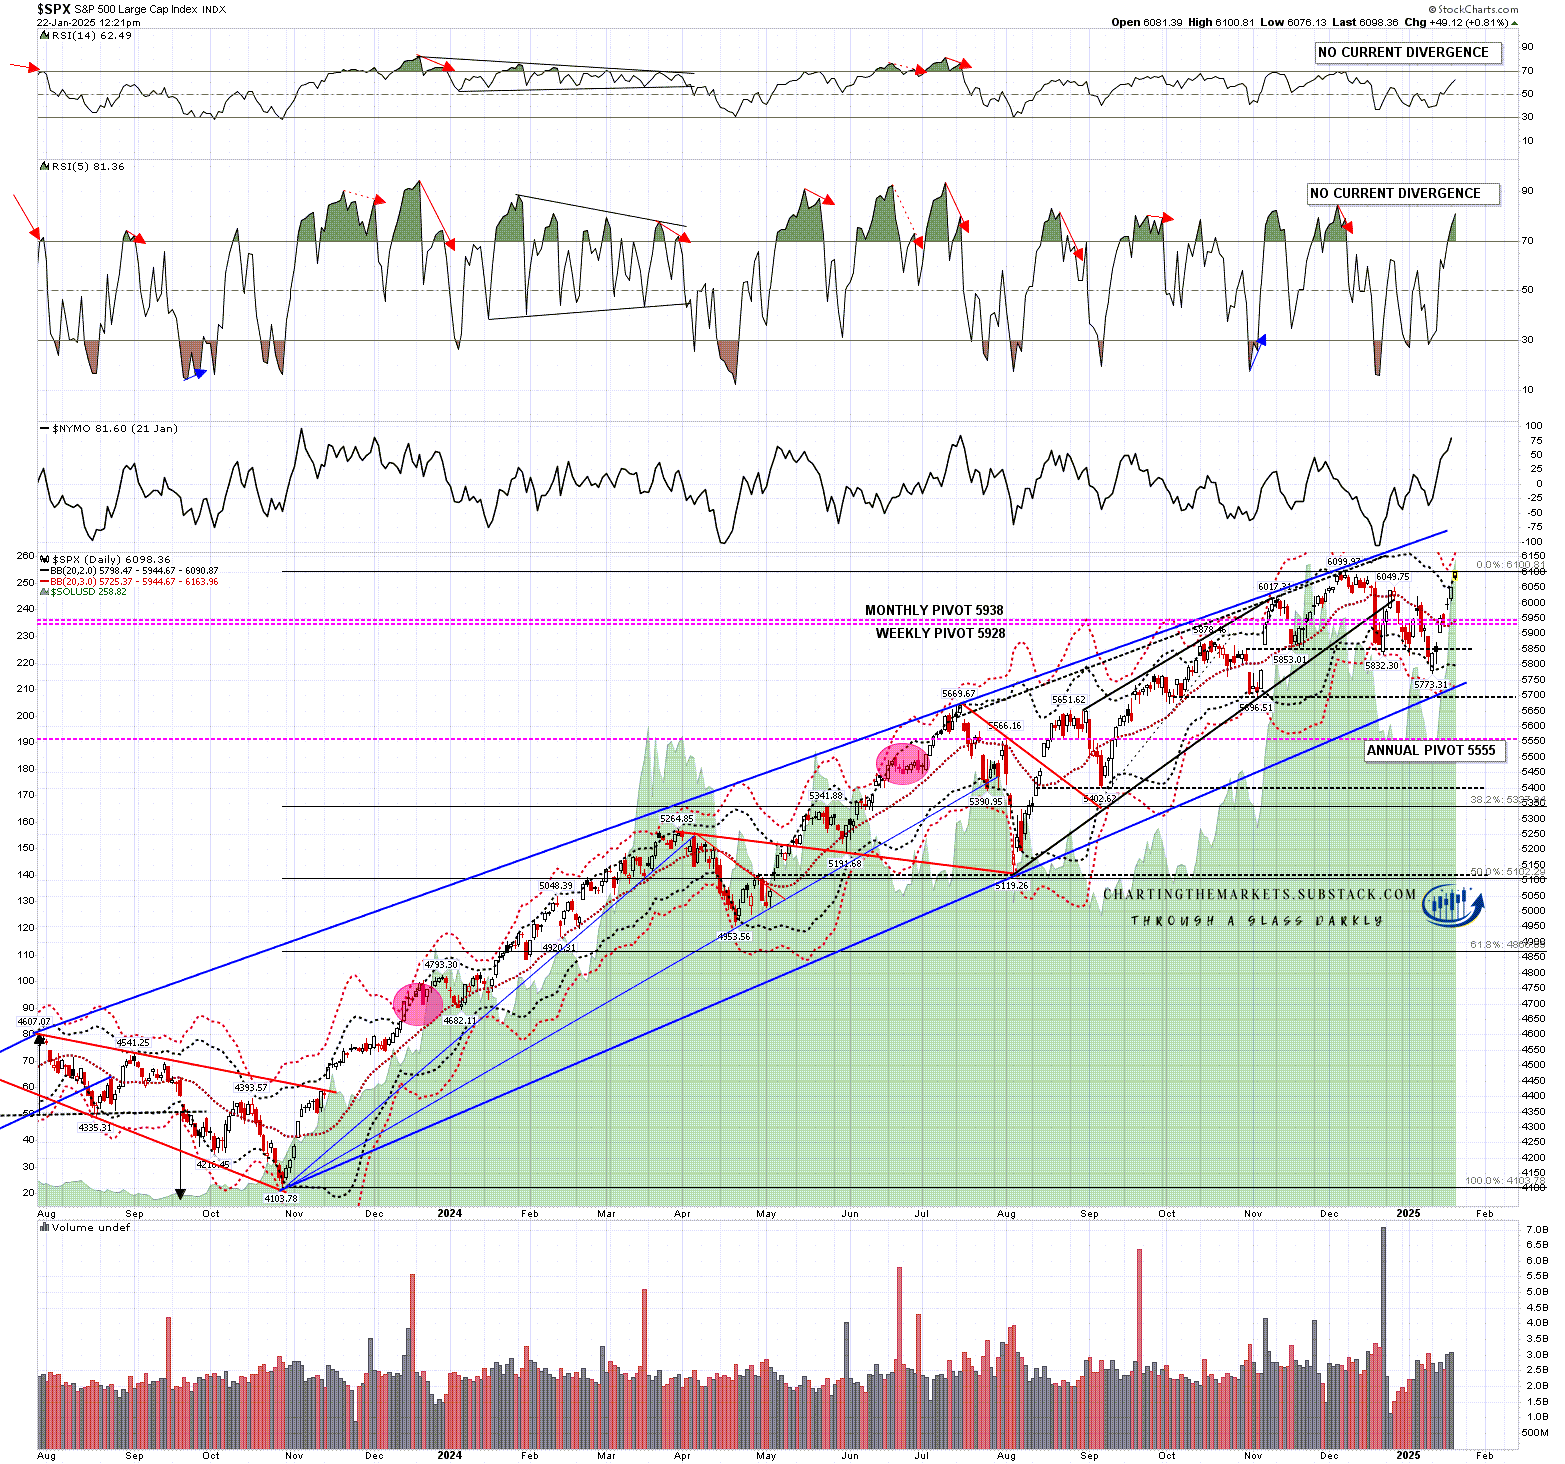
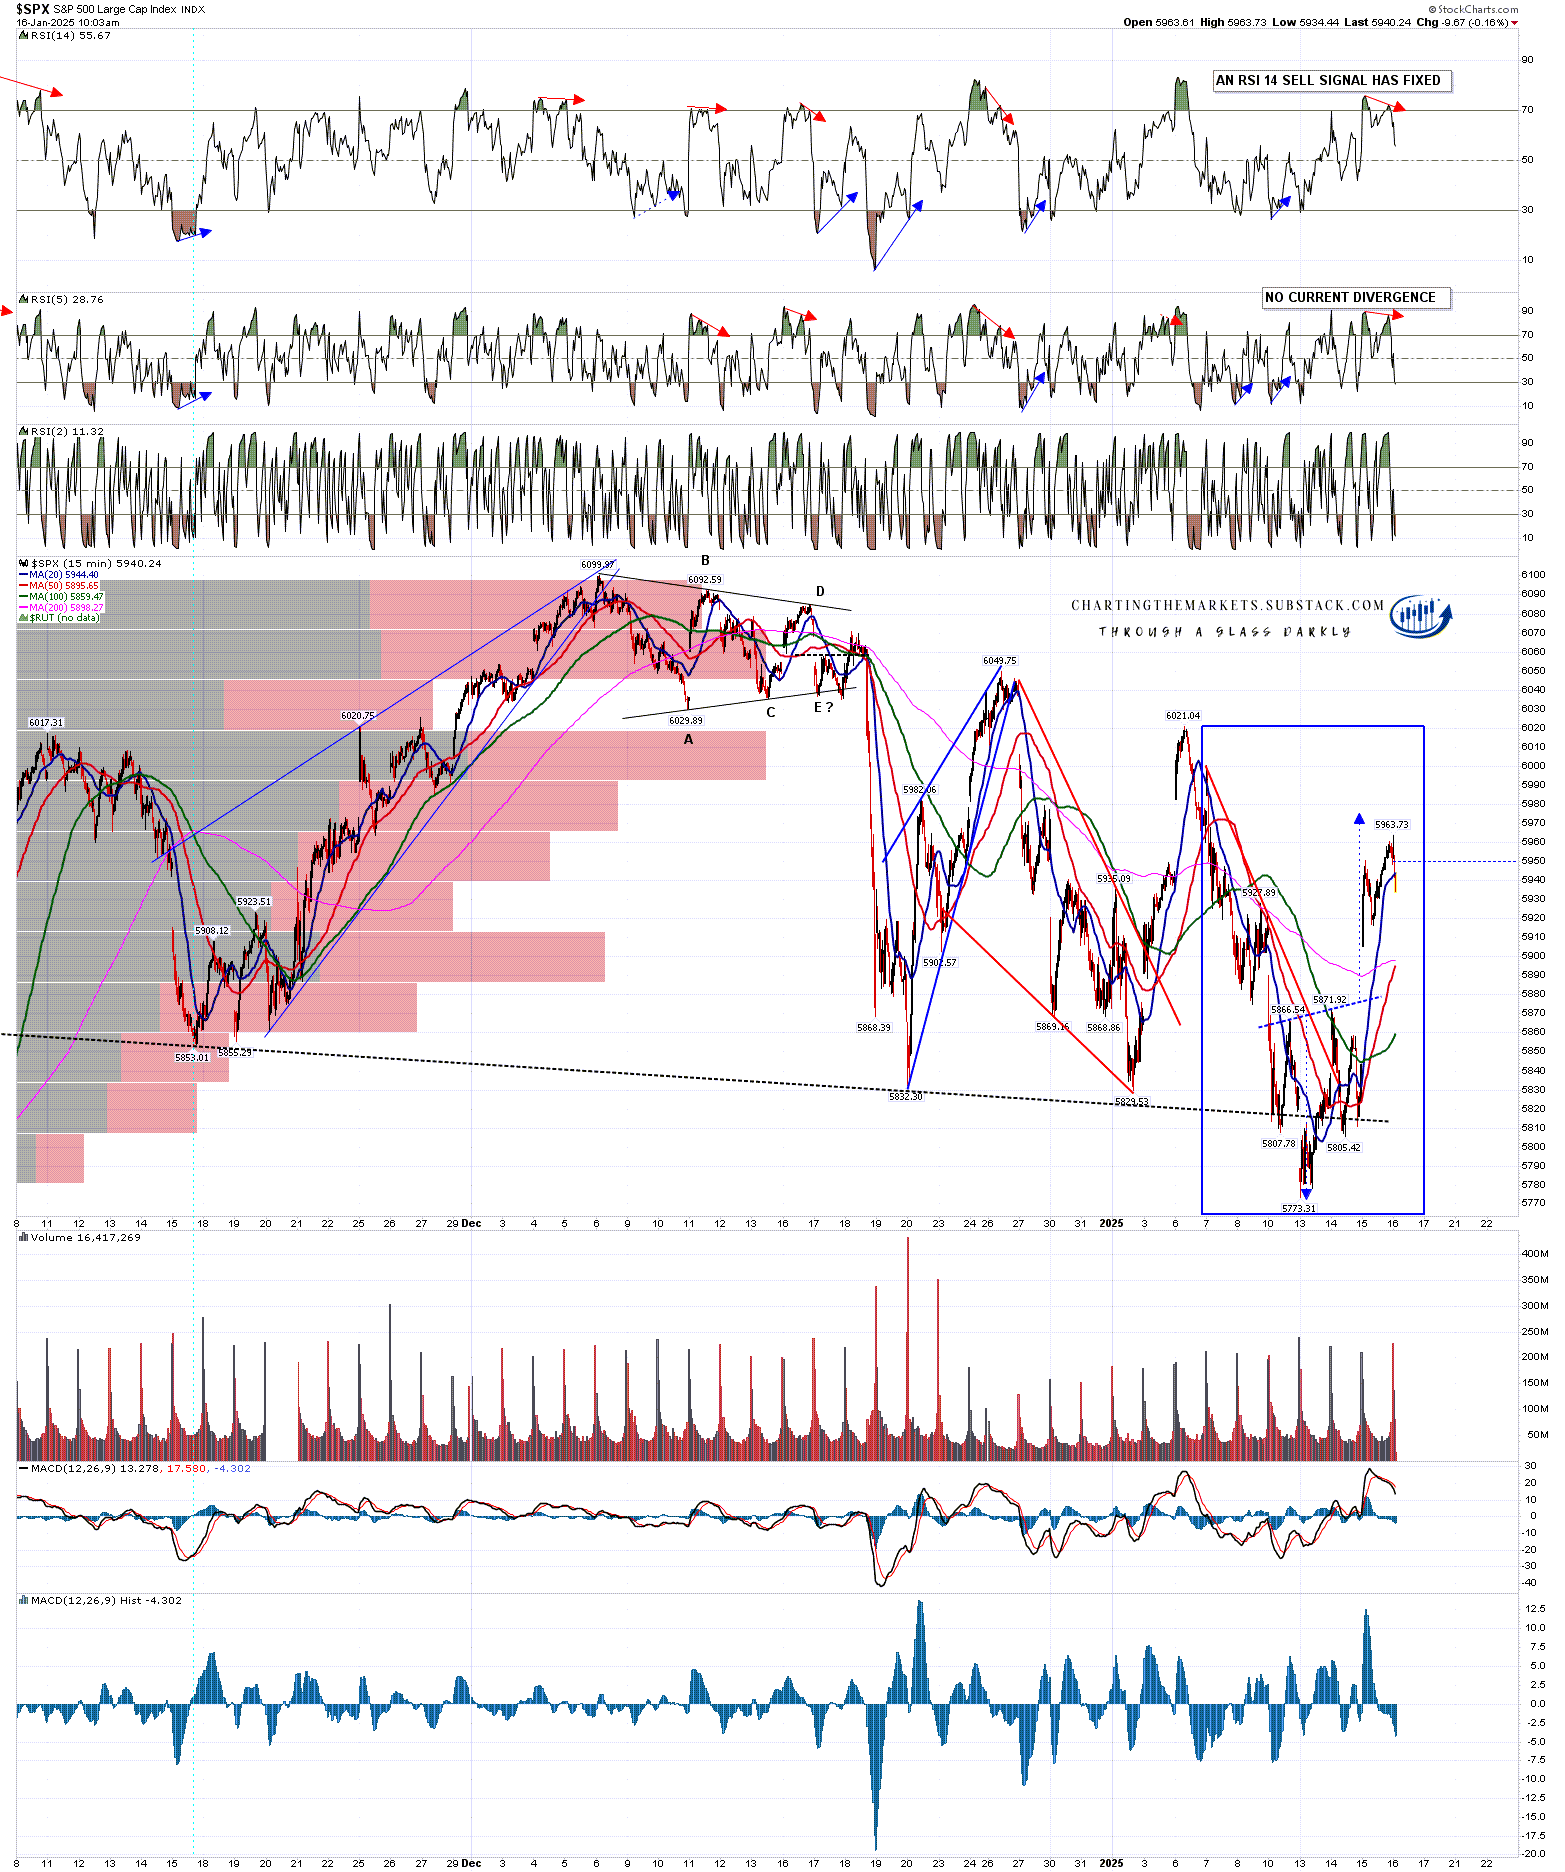
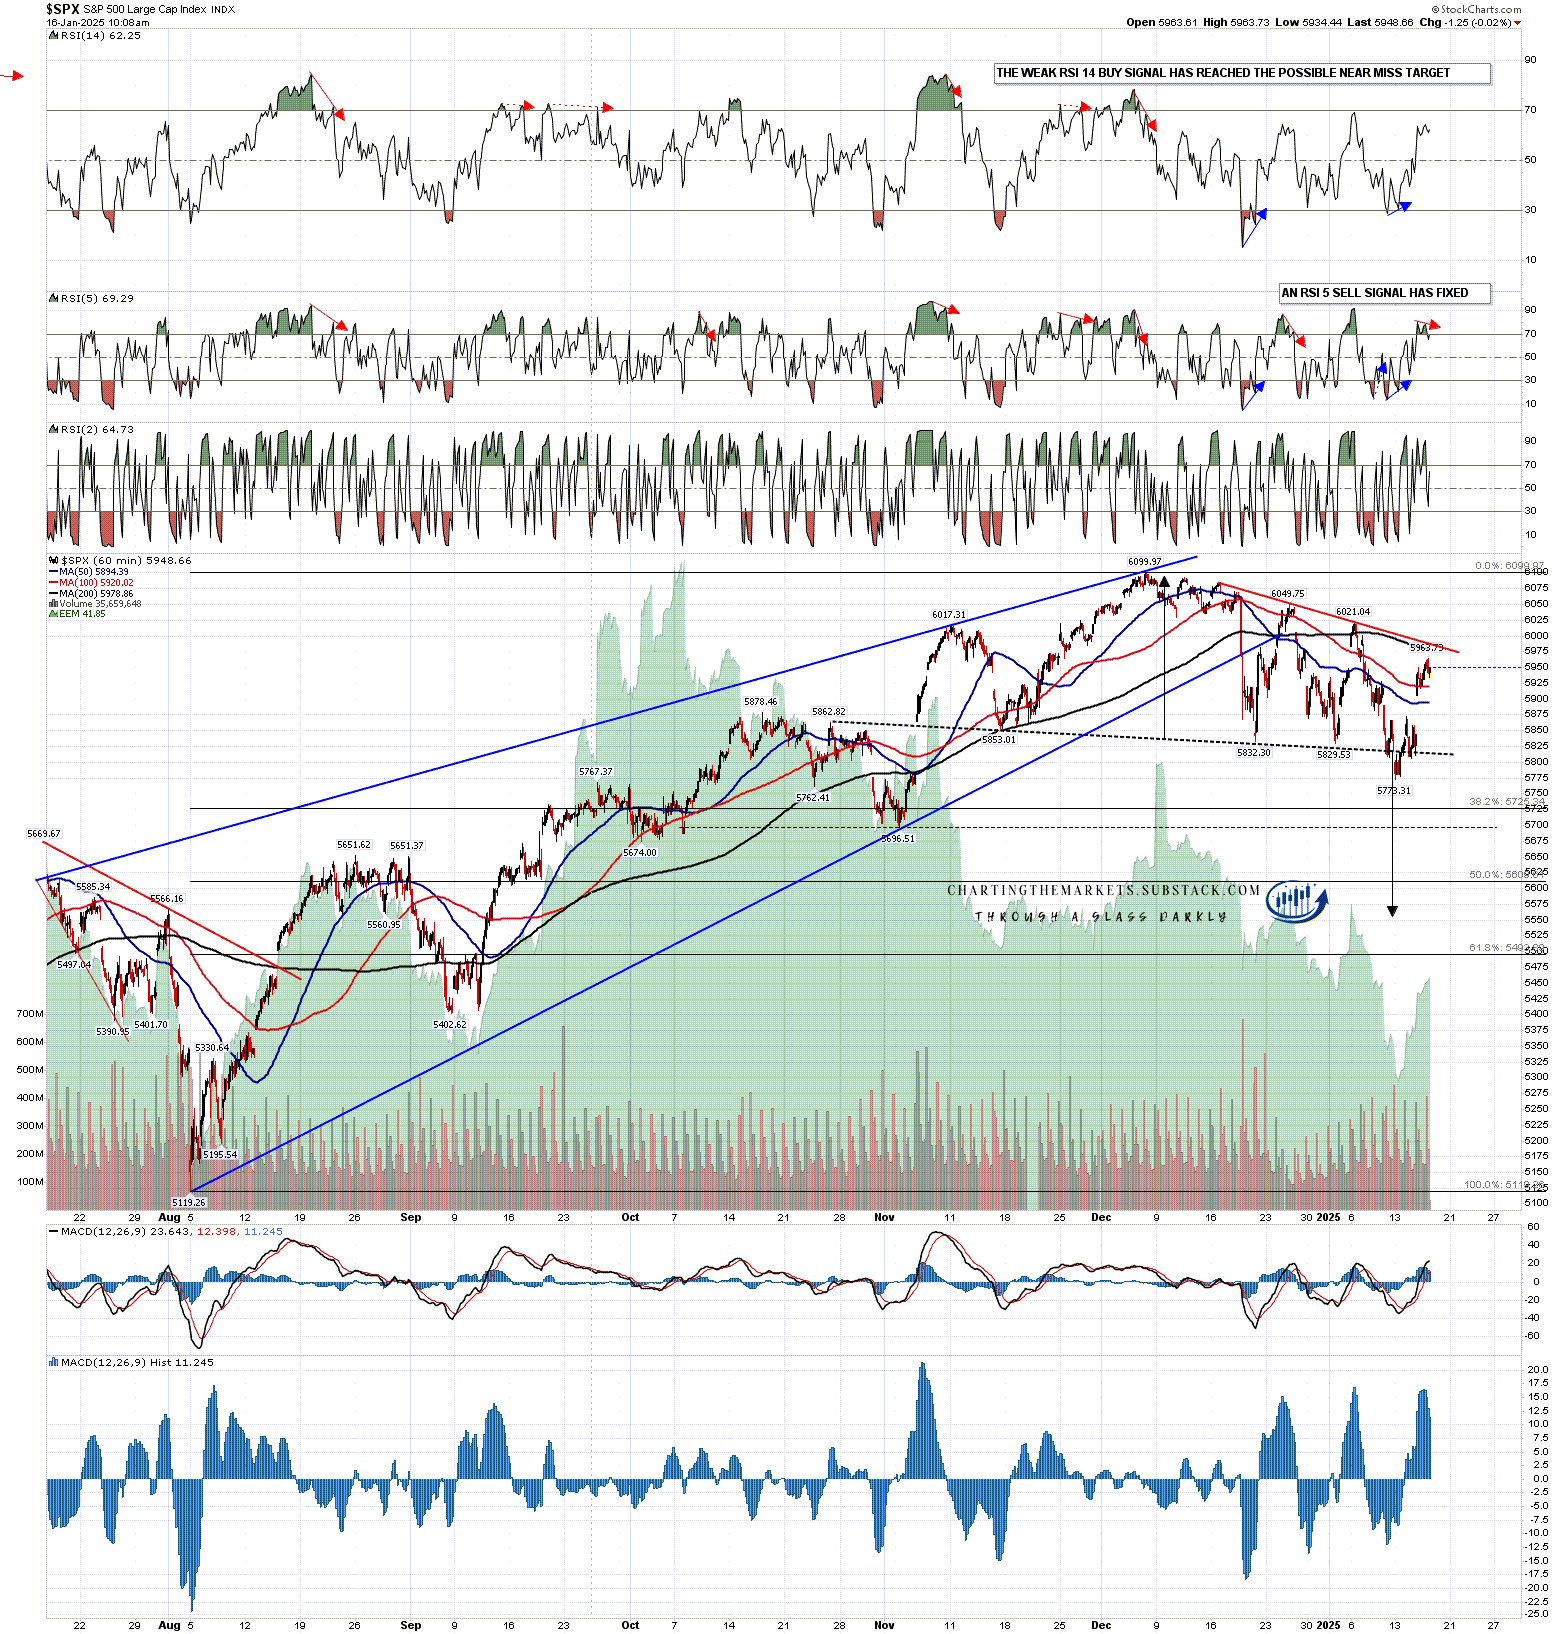
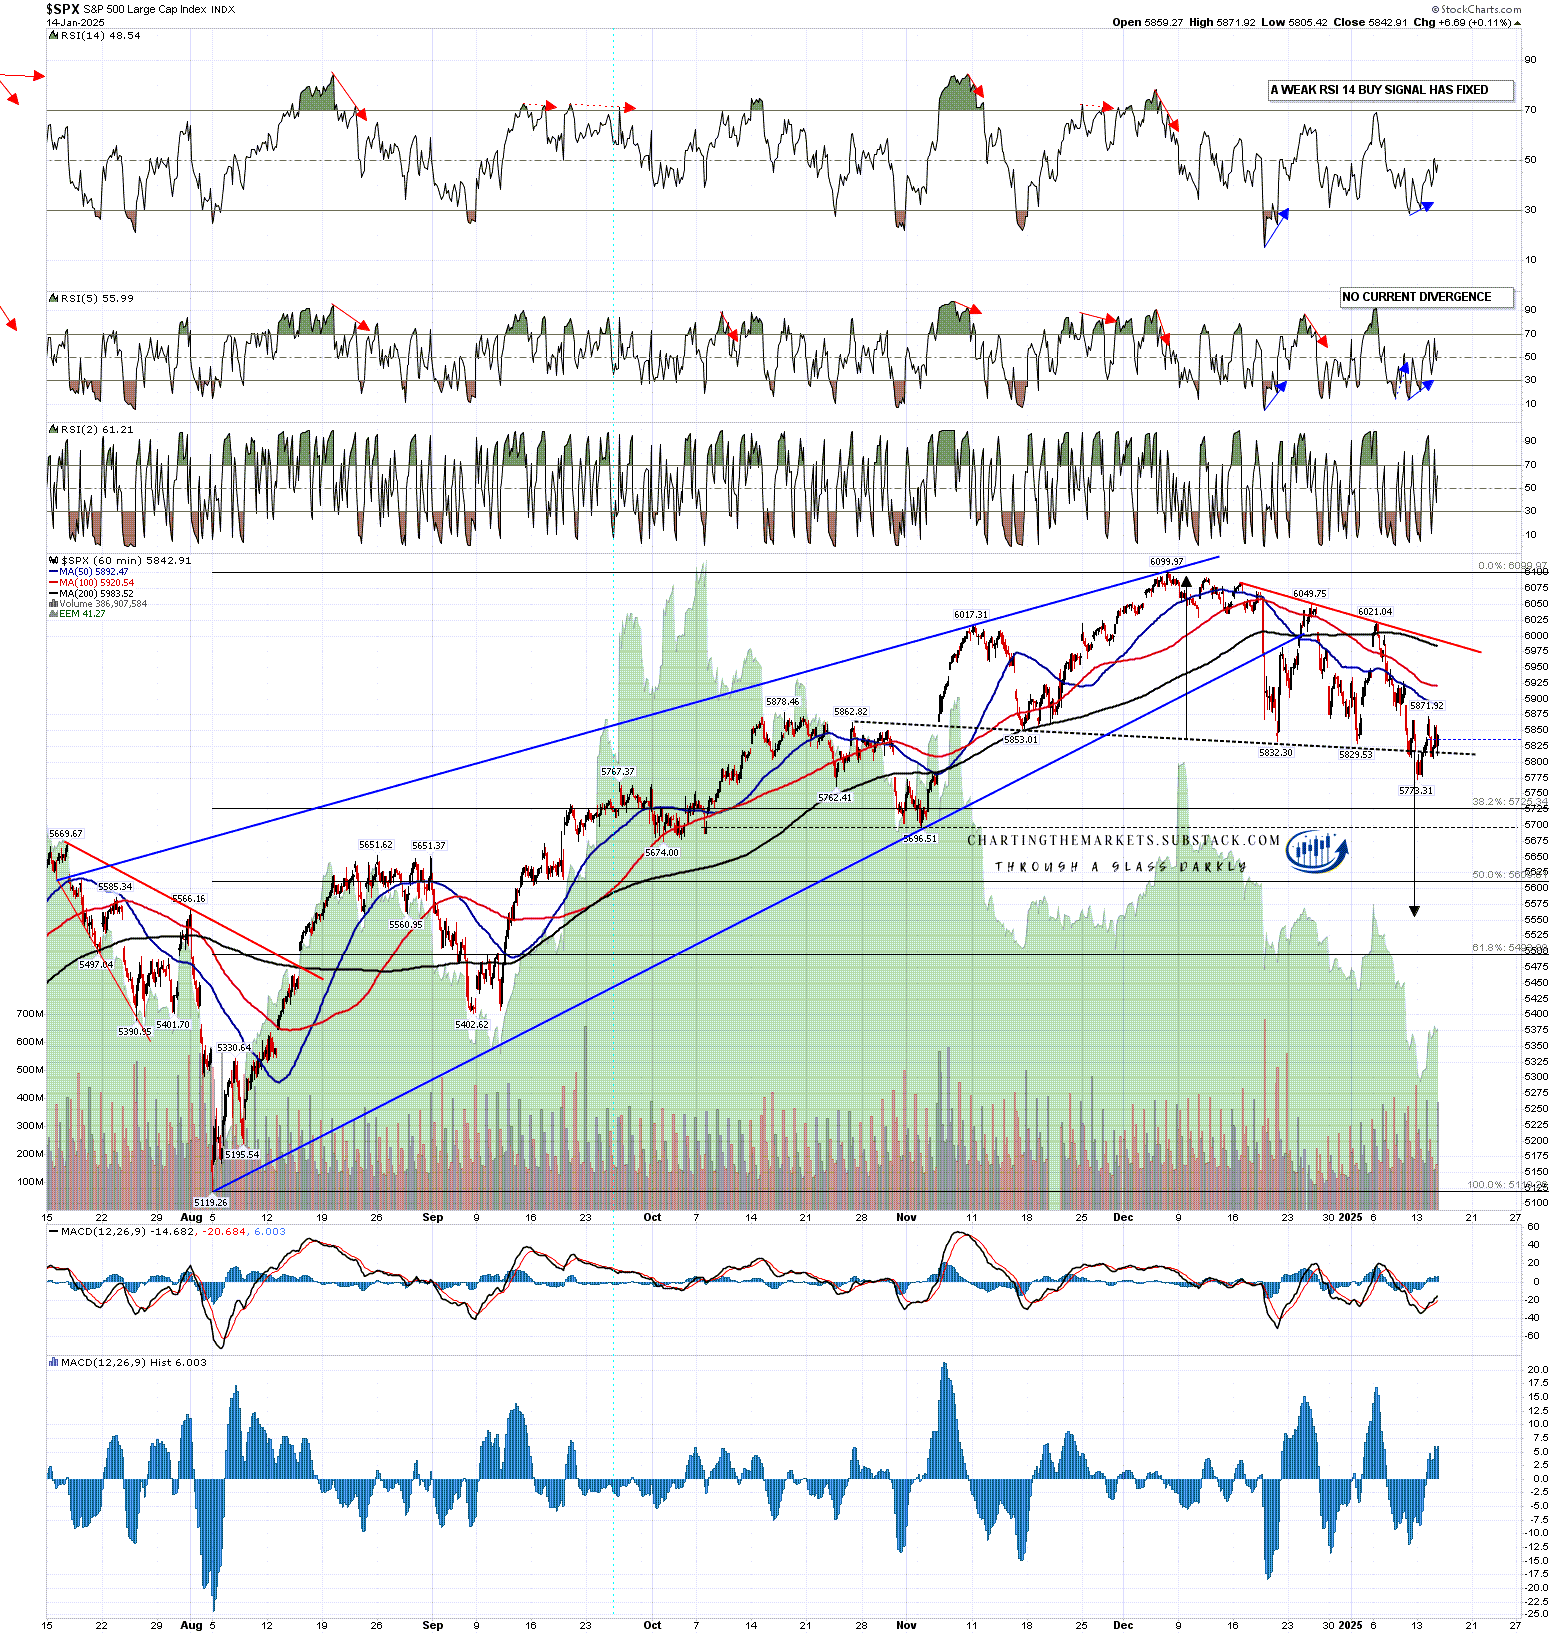
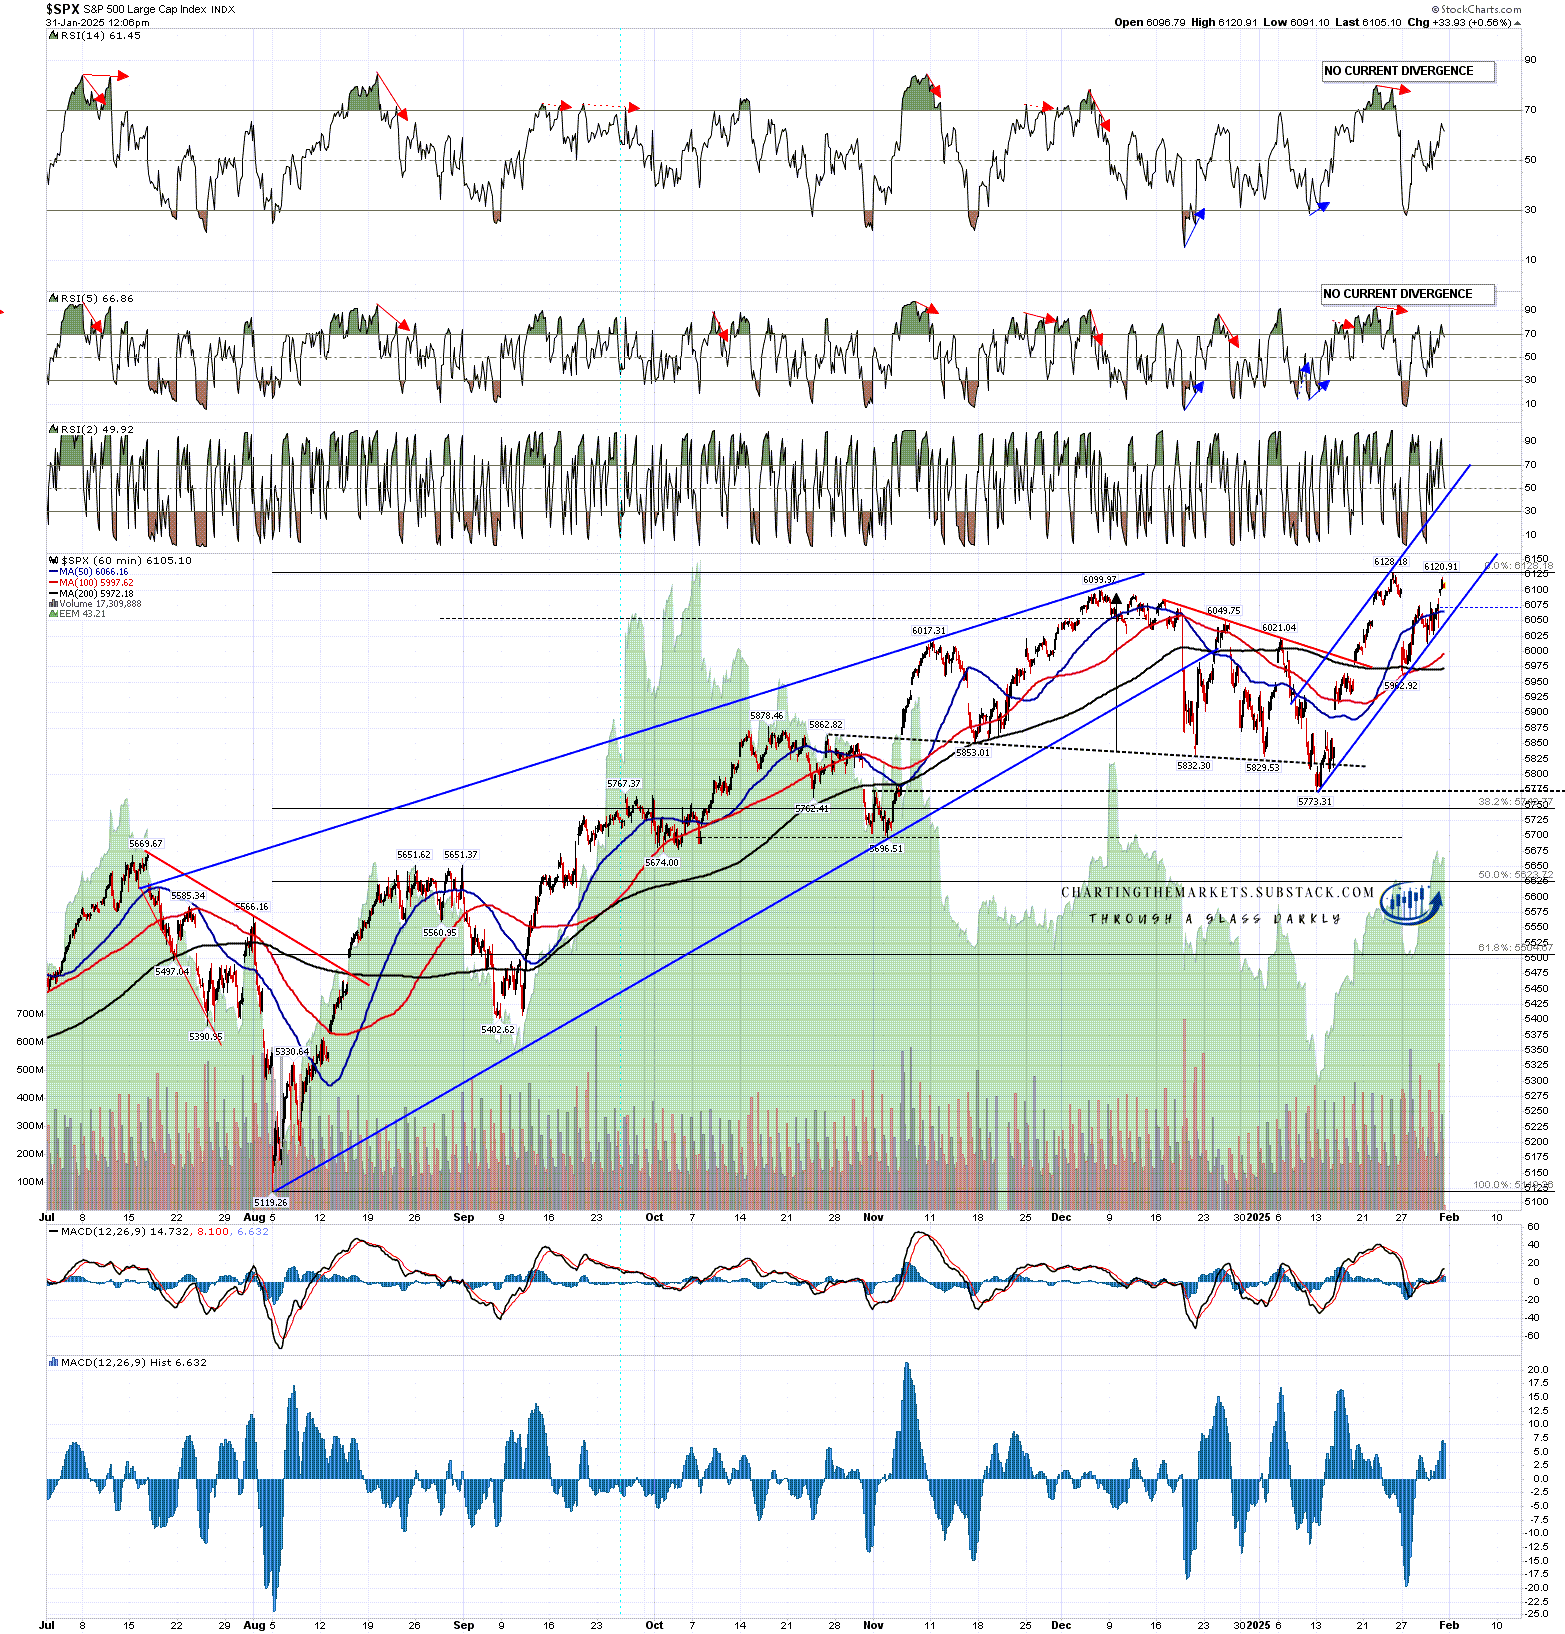
SPX made a new all time high the fastest and, as yet, hasn’t progressed much beyond it. This could be a double top setup , but I’m really expecting QQQ to made a new all time high before there is a serious risk of topping out.

Worth noting on the chart is the decent quality rising channel from the January low with channel resistance currently in the 6250 area, which is also where I currently have trendline resistance from the 2023 low.

SPX 60min chart:

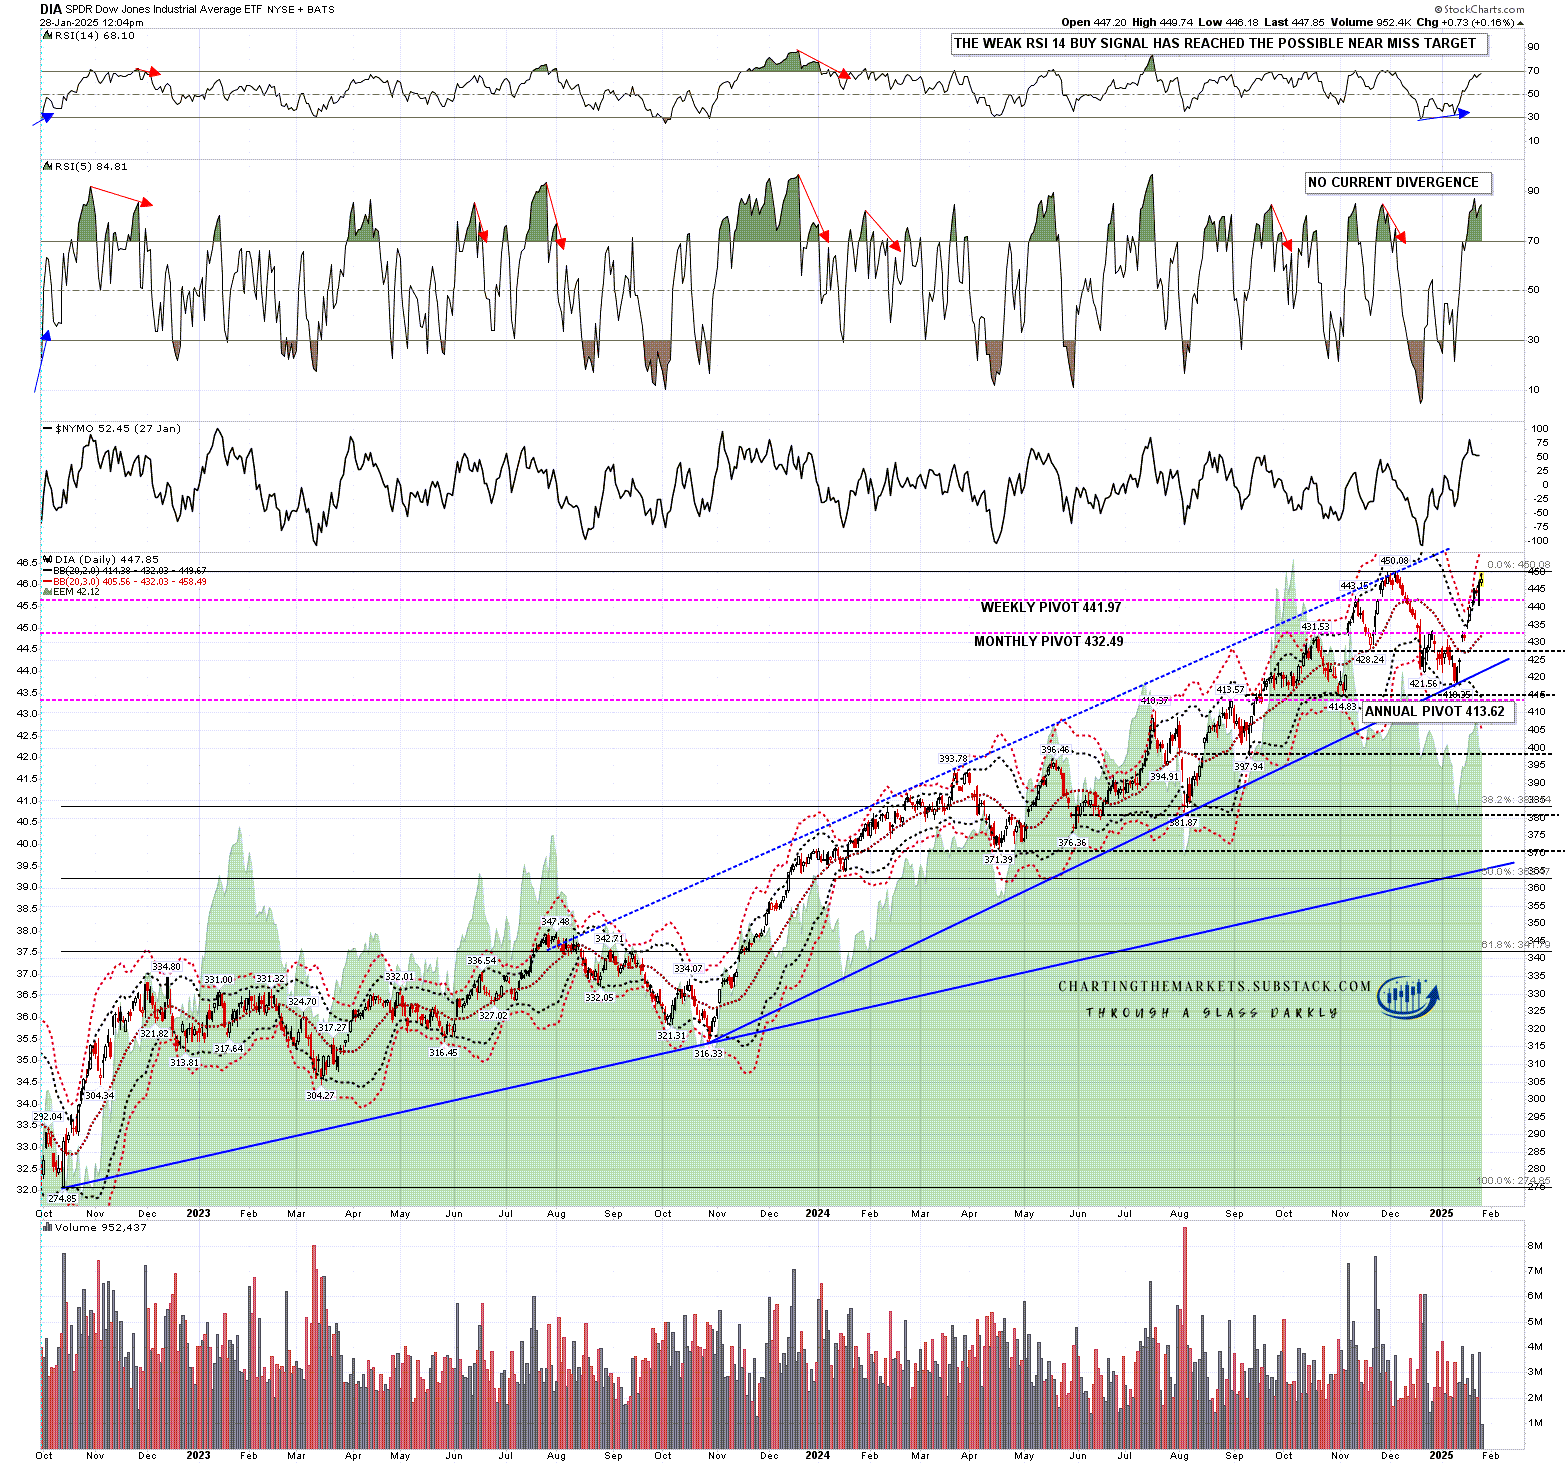
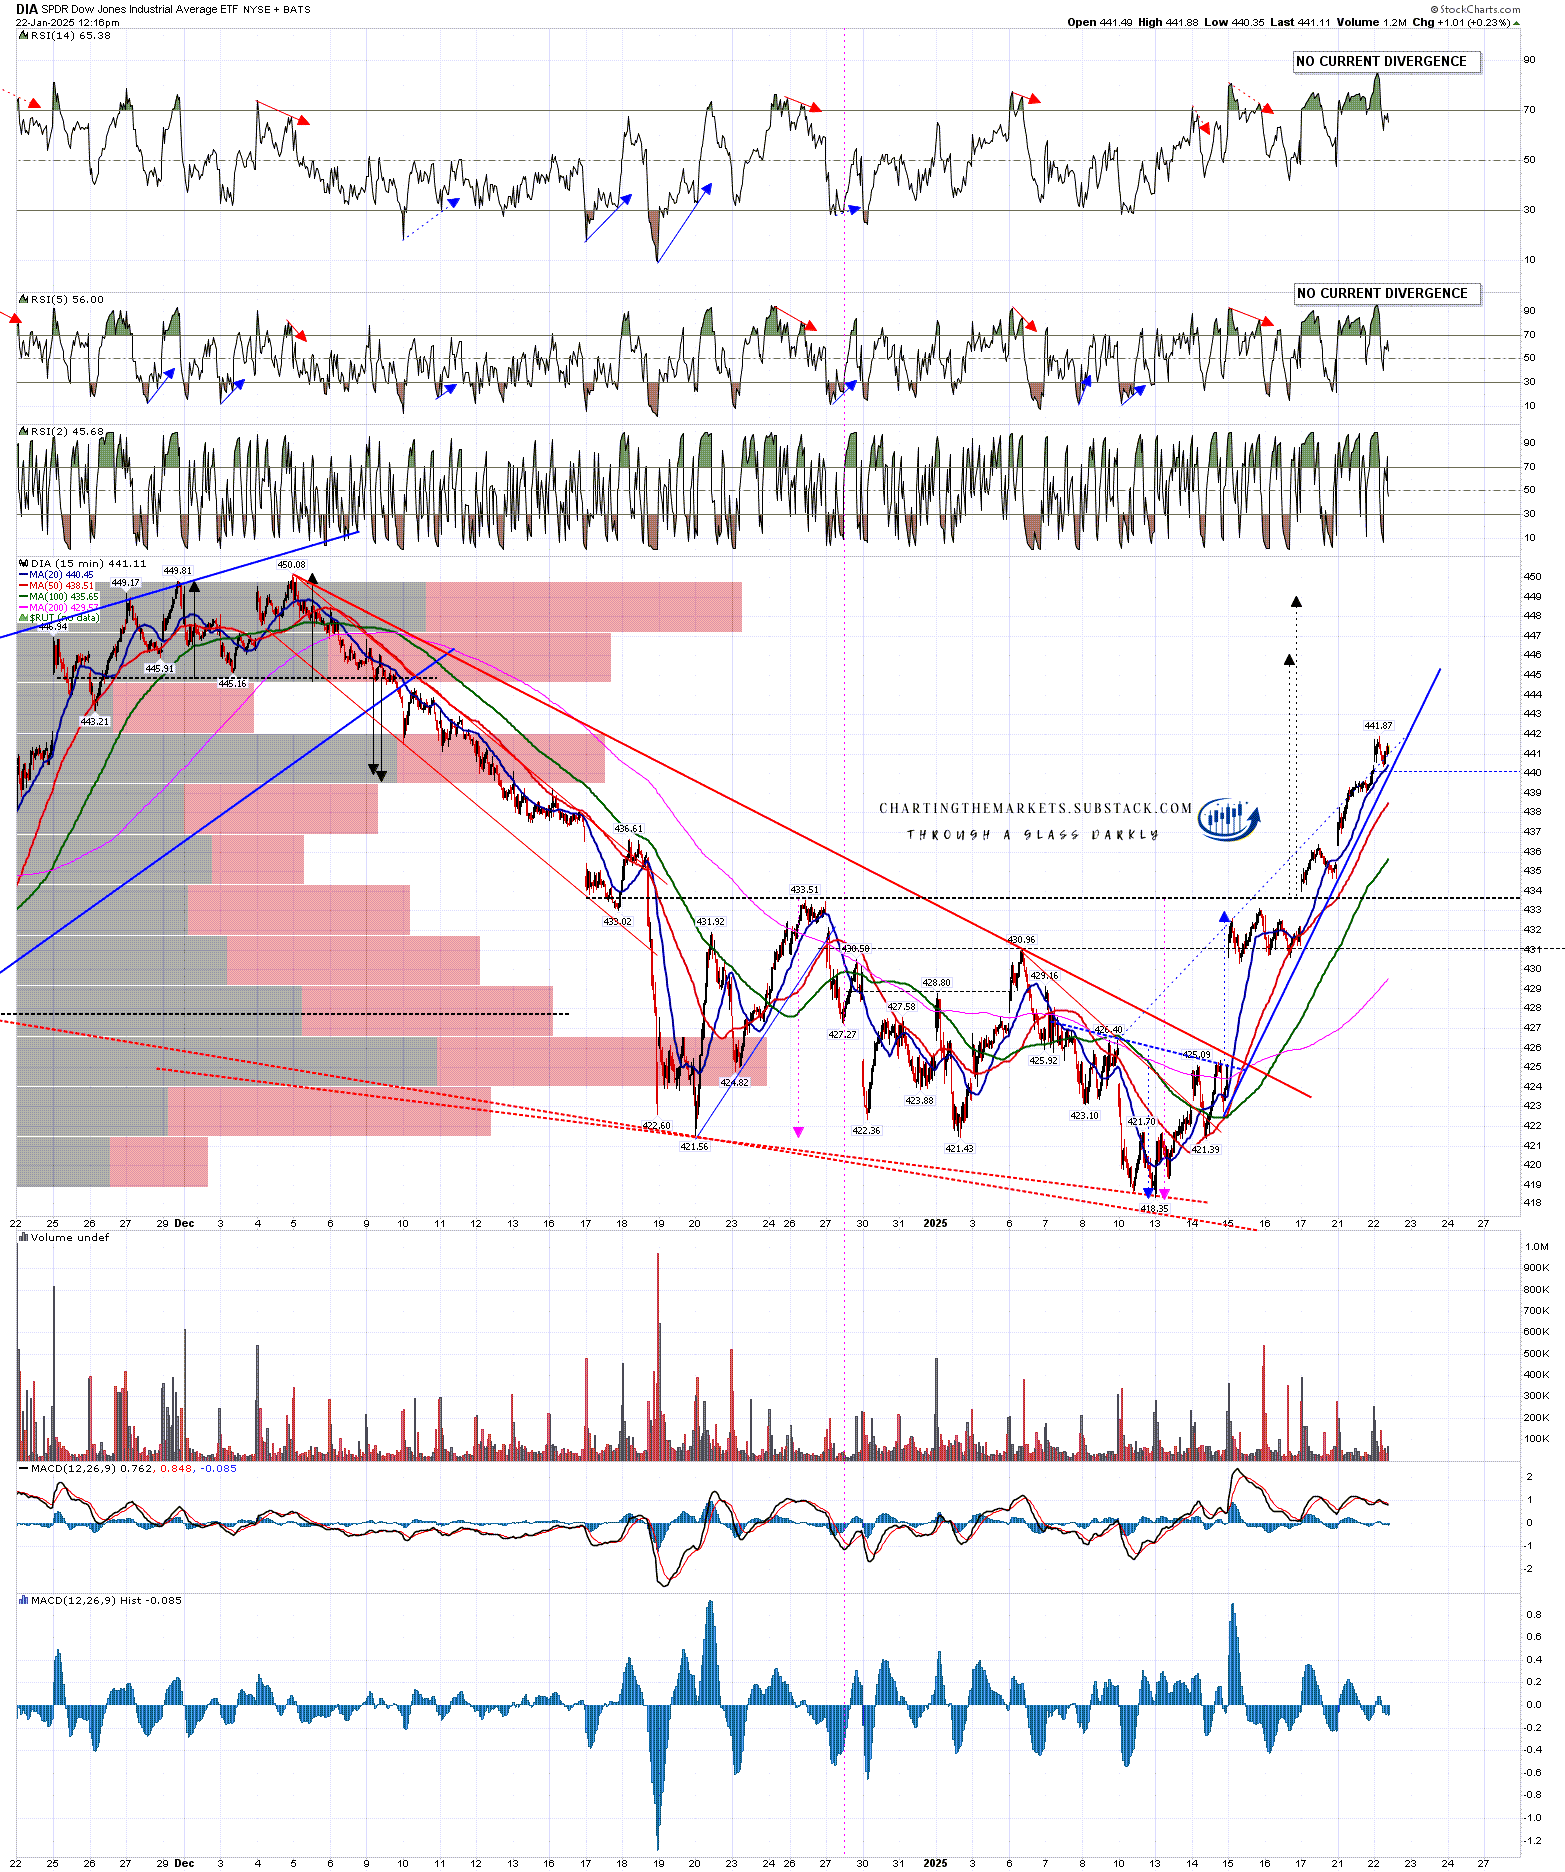
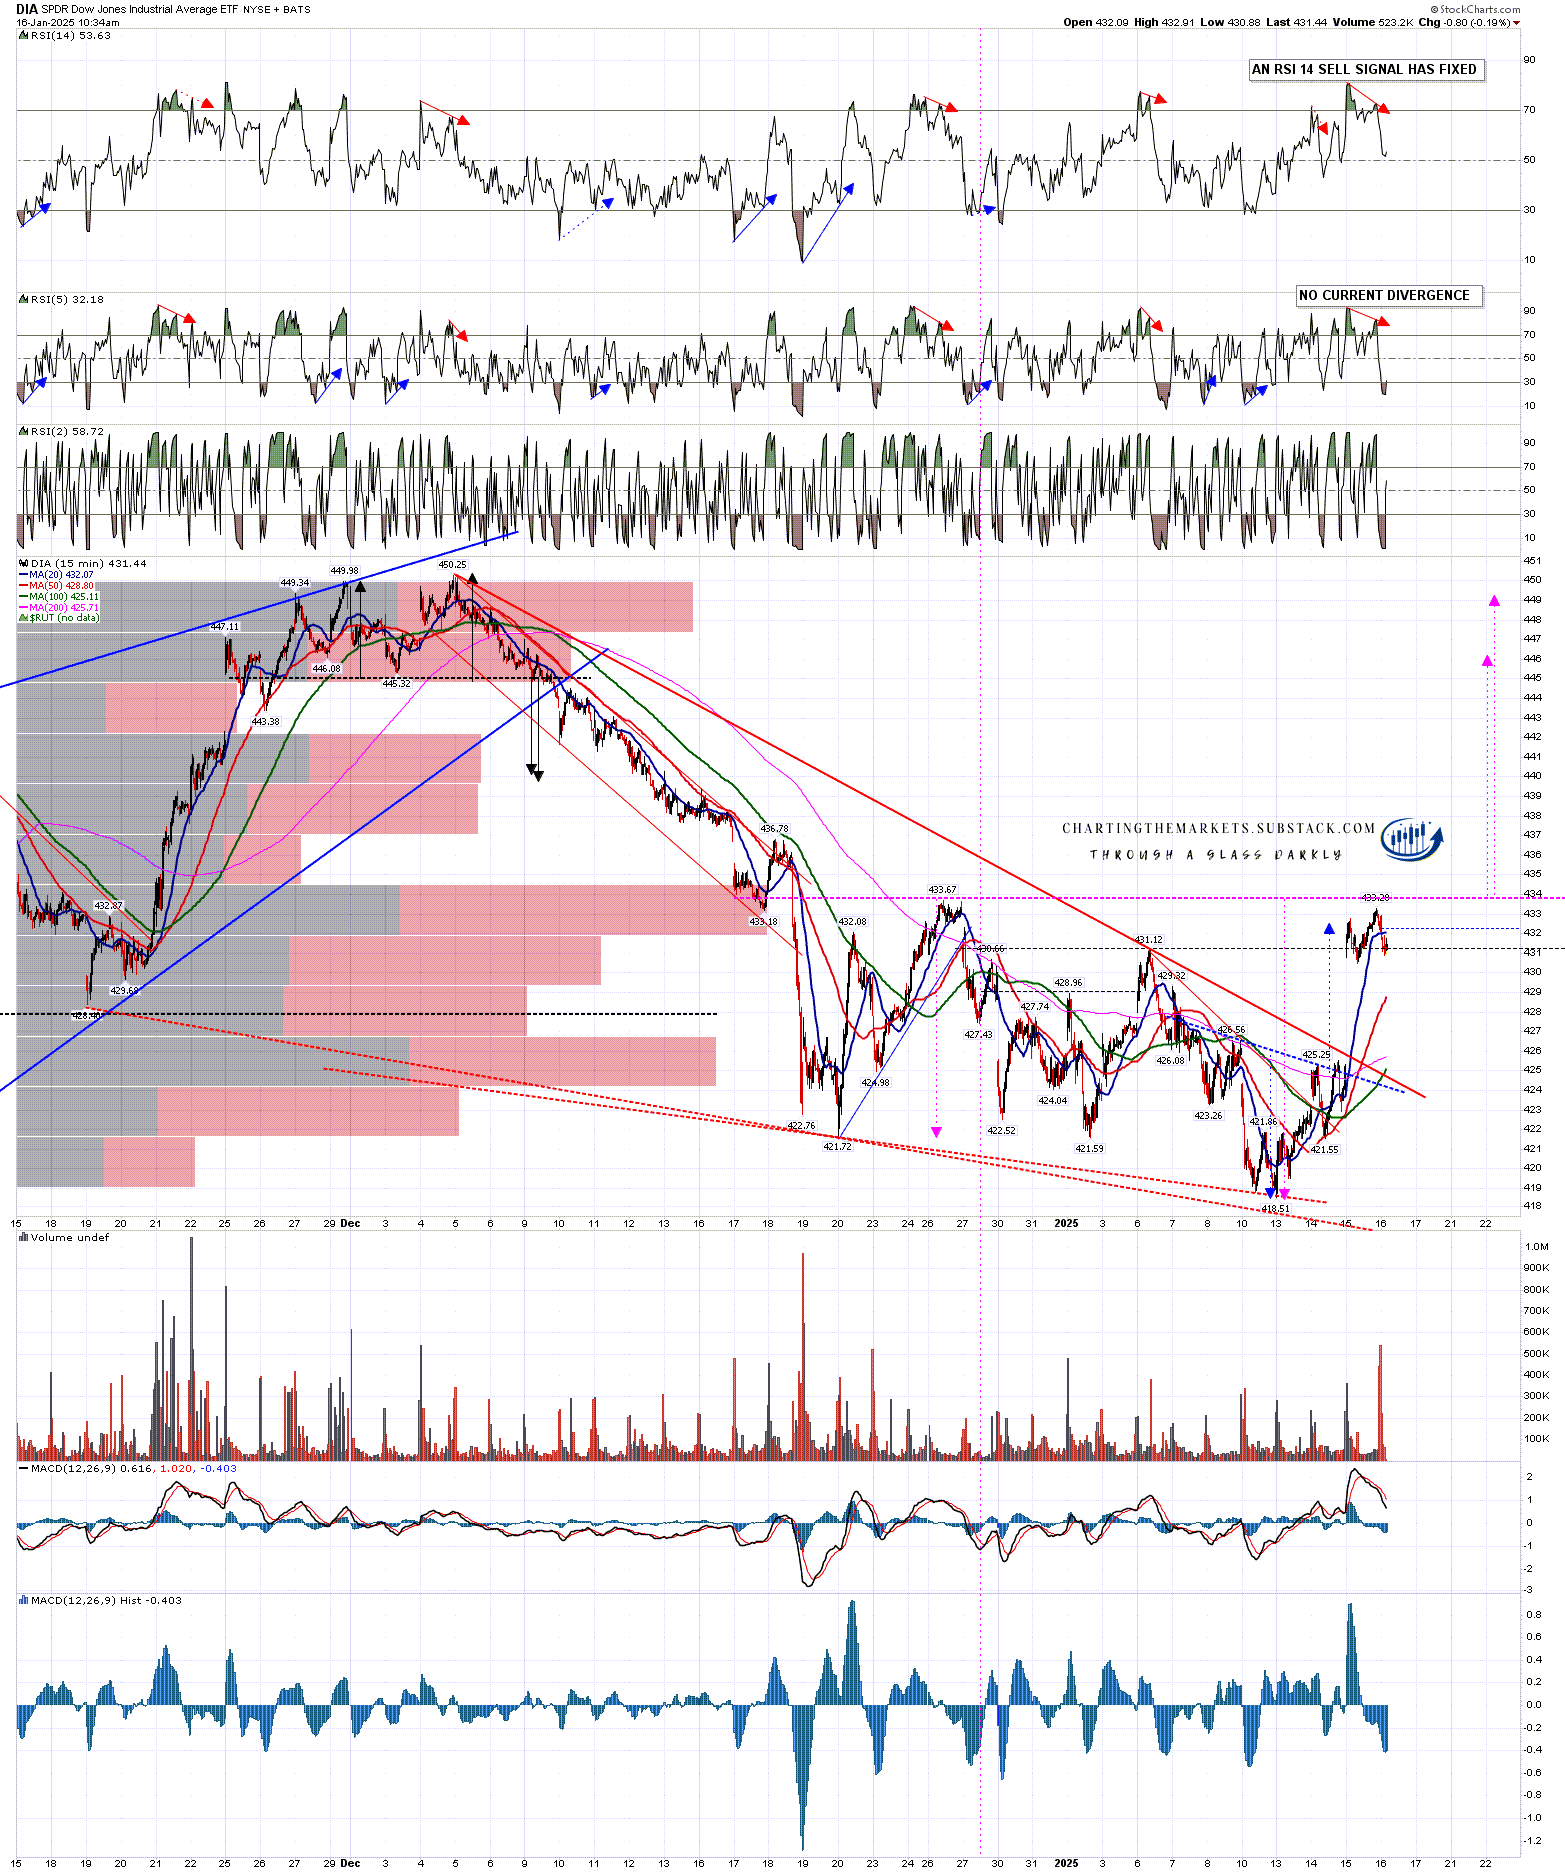
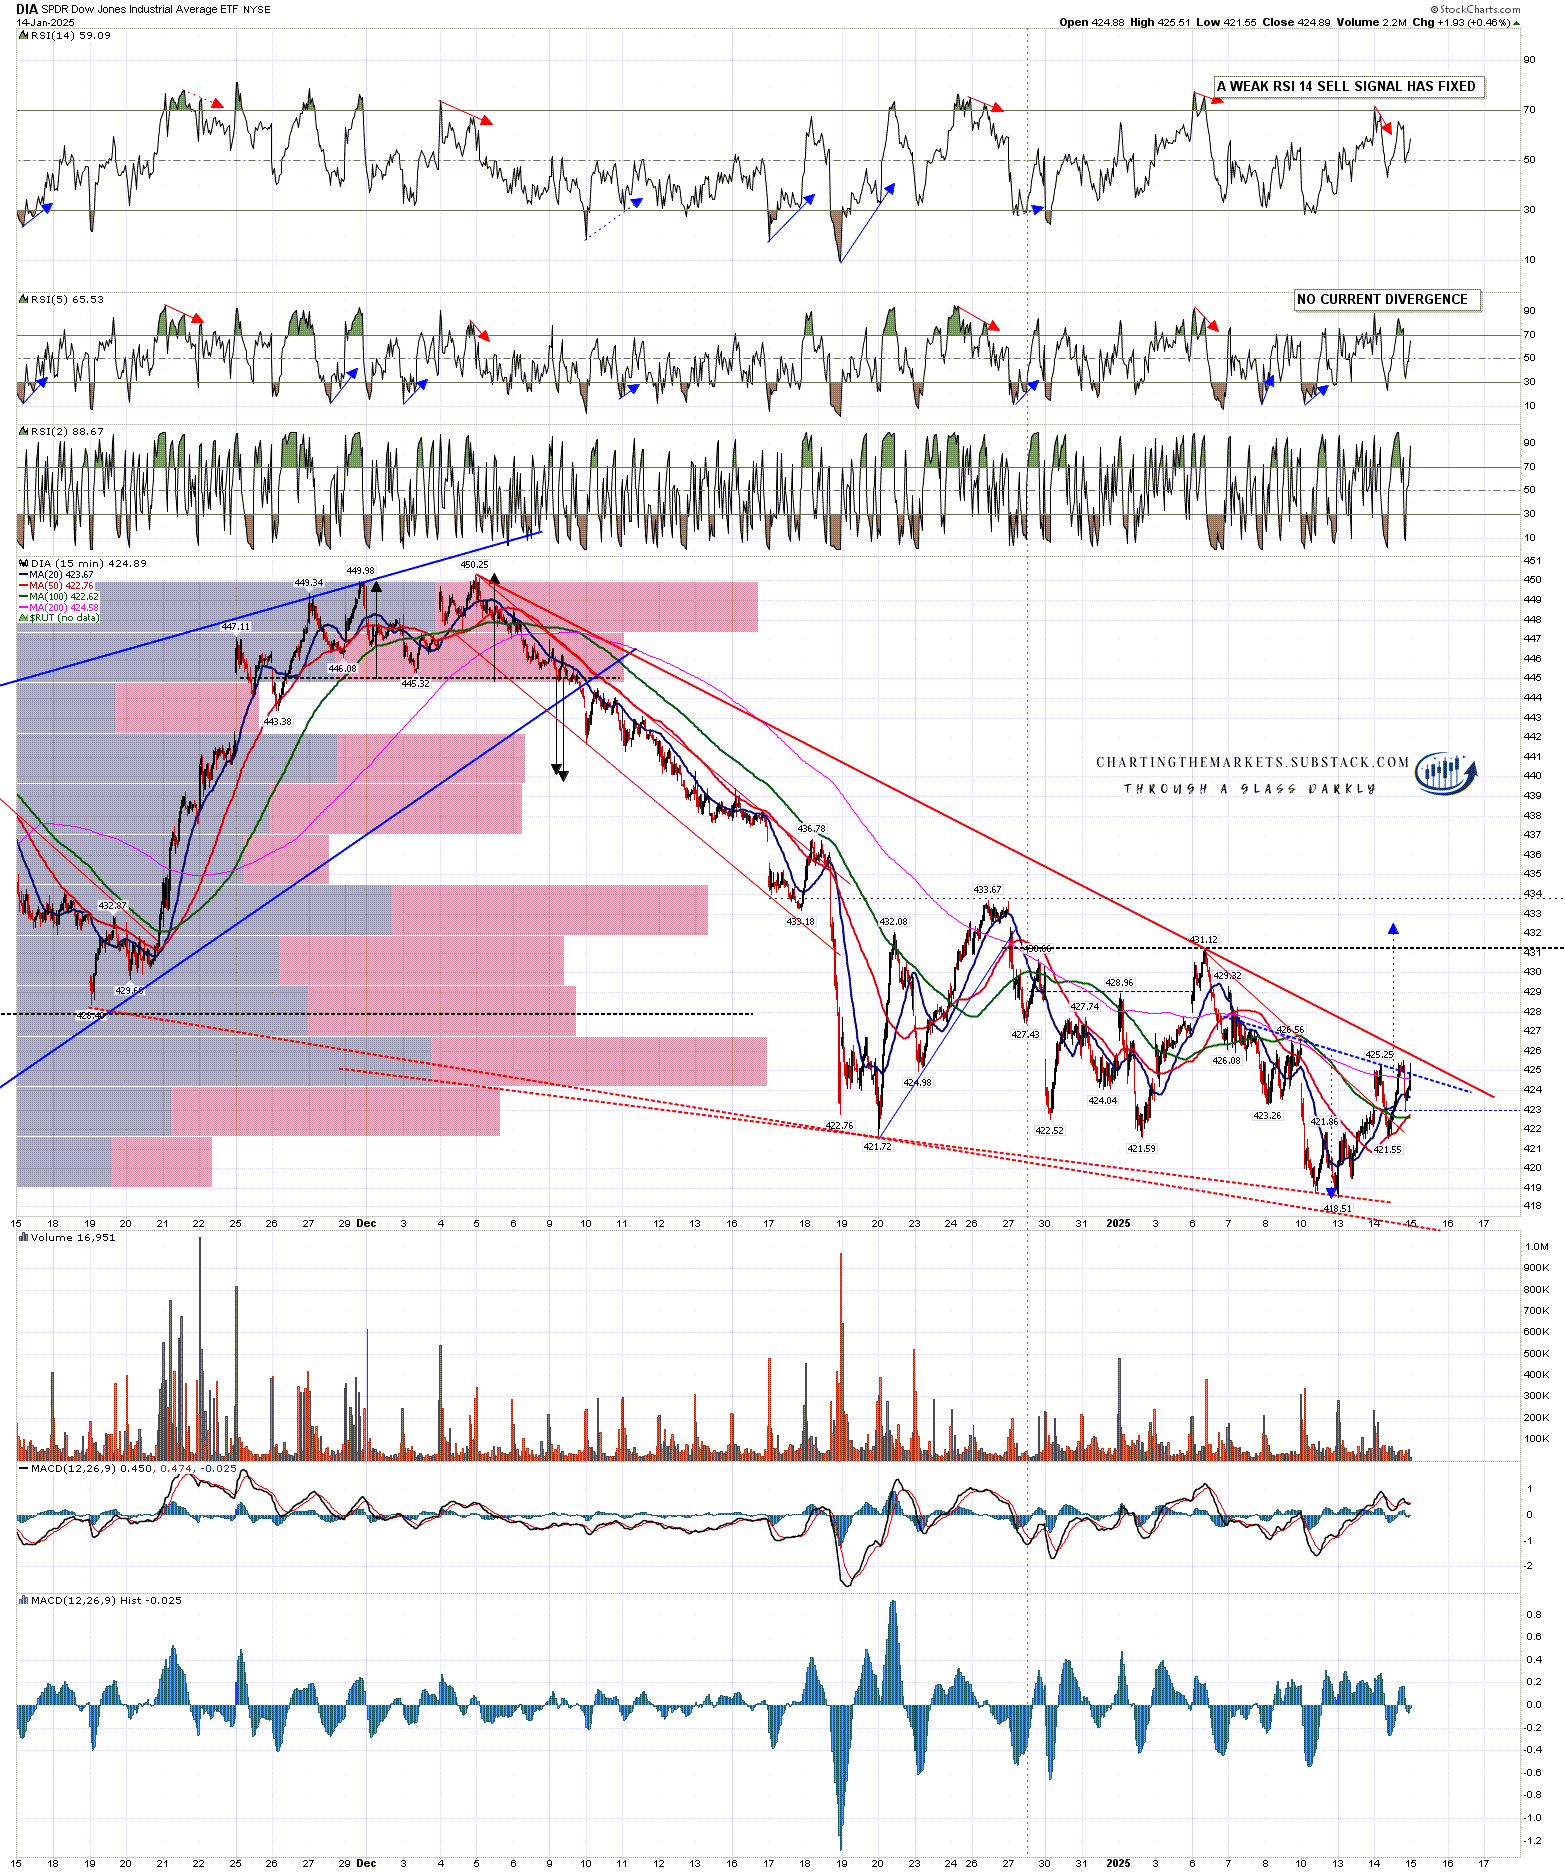
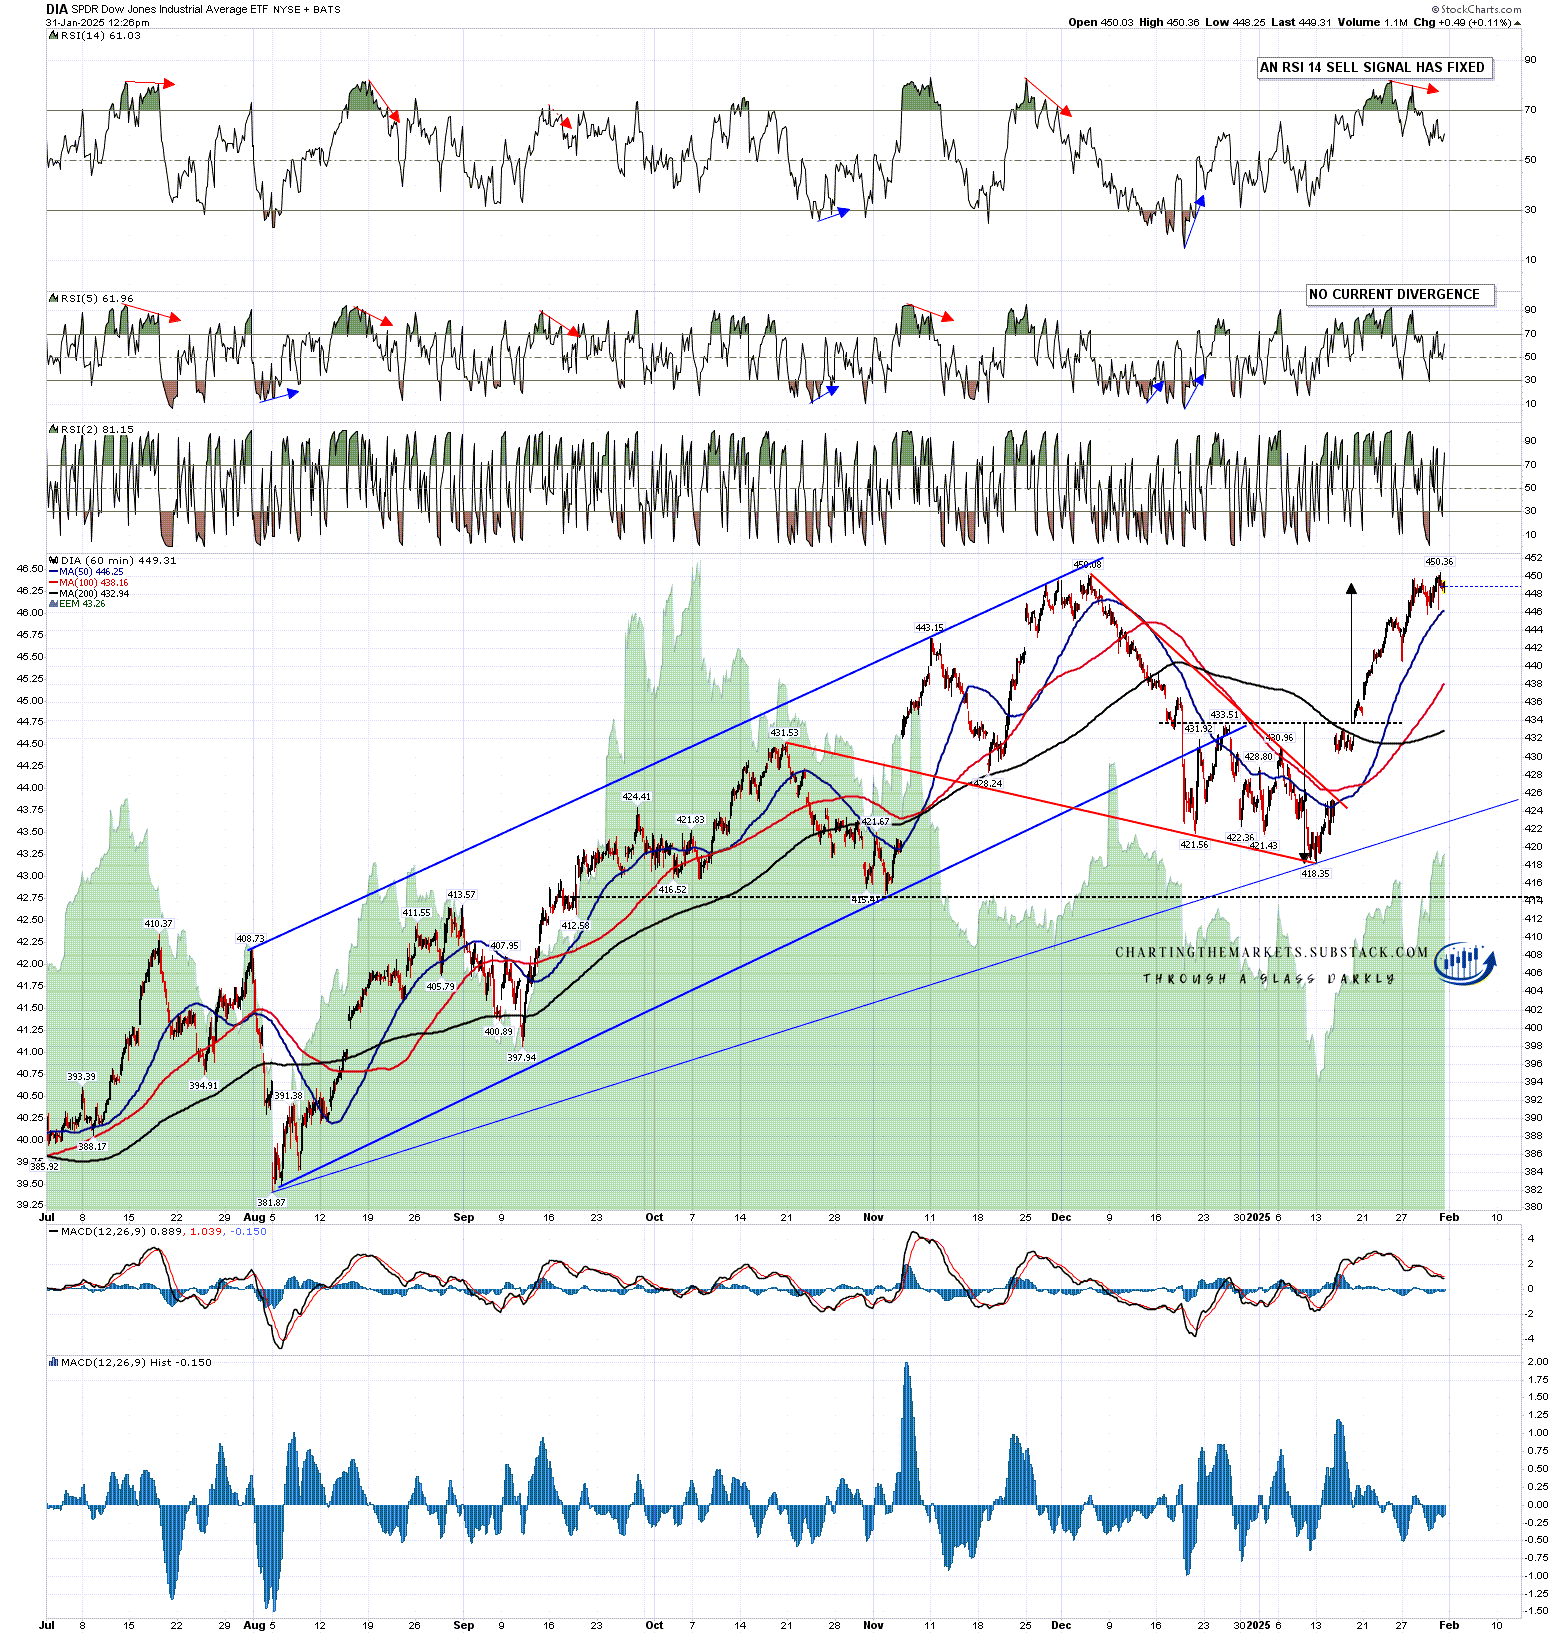
DIA has now made a new all time high this week and there is another possible double top setup formed here. No obvious support trendline has formed and held since the flag low, though we may get one after the low today.

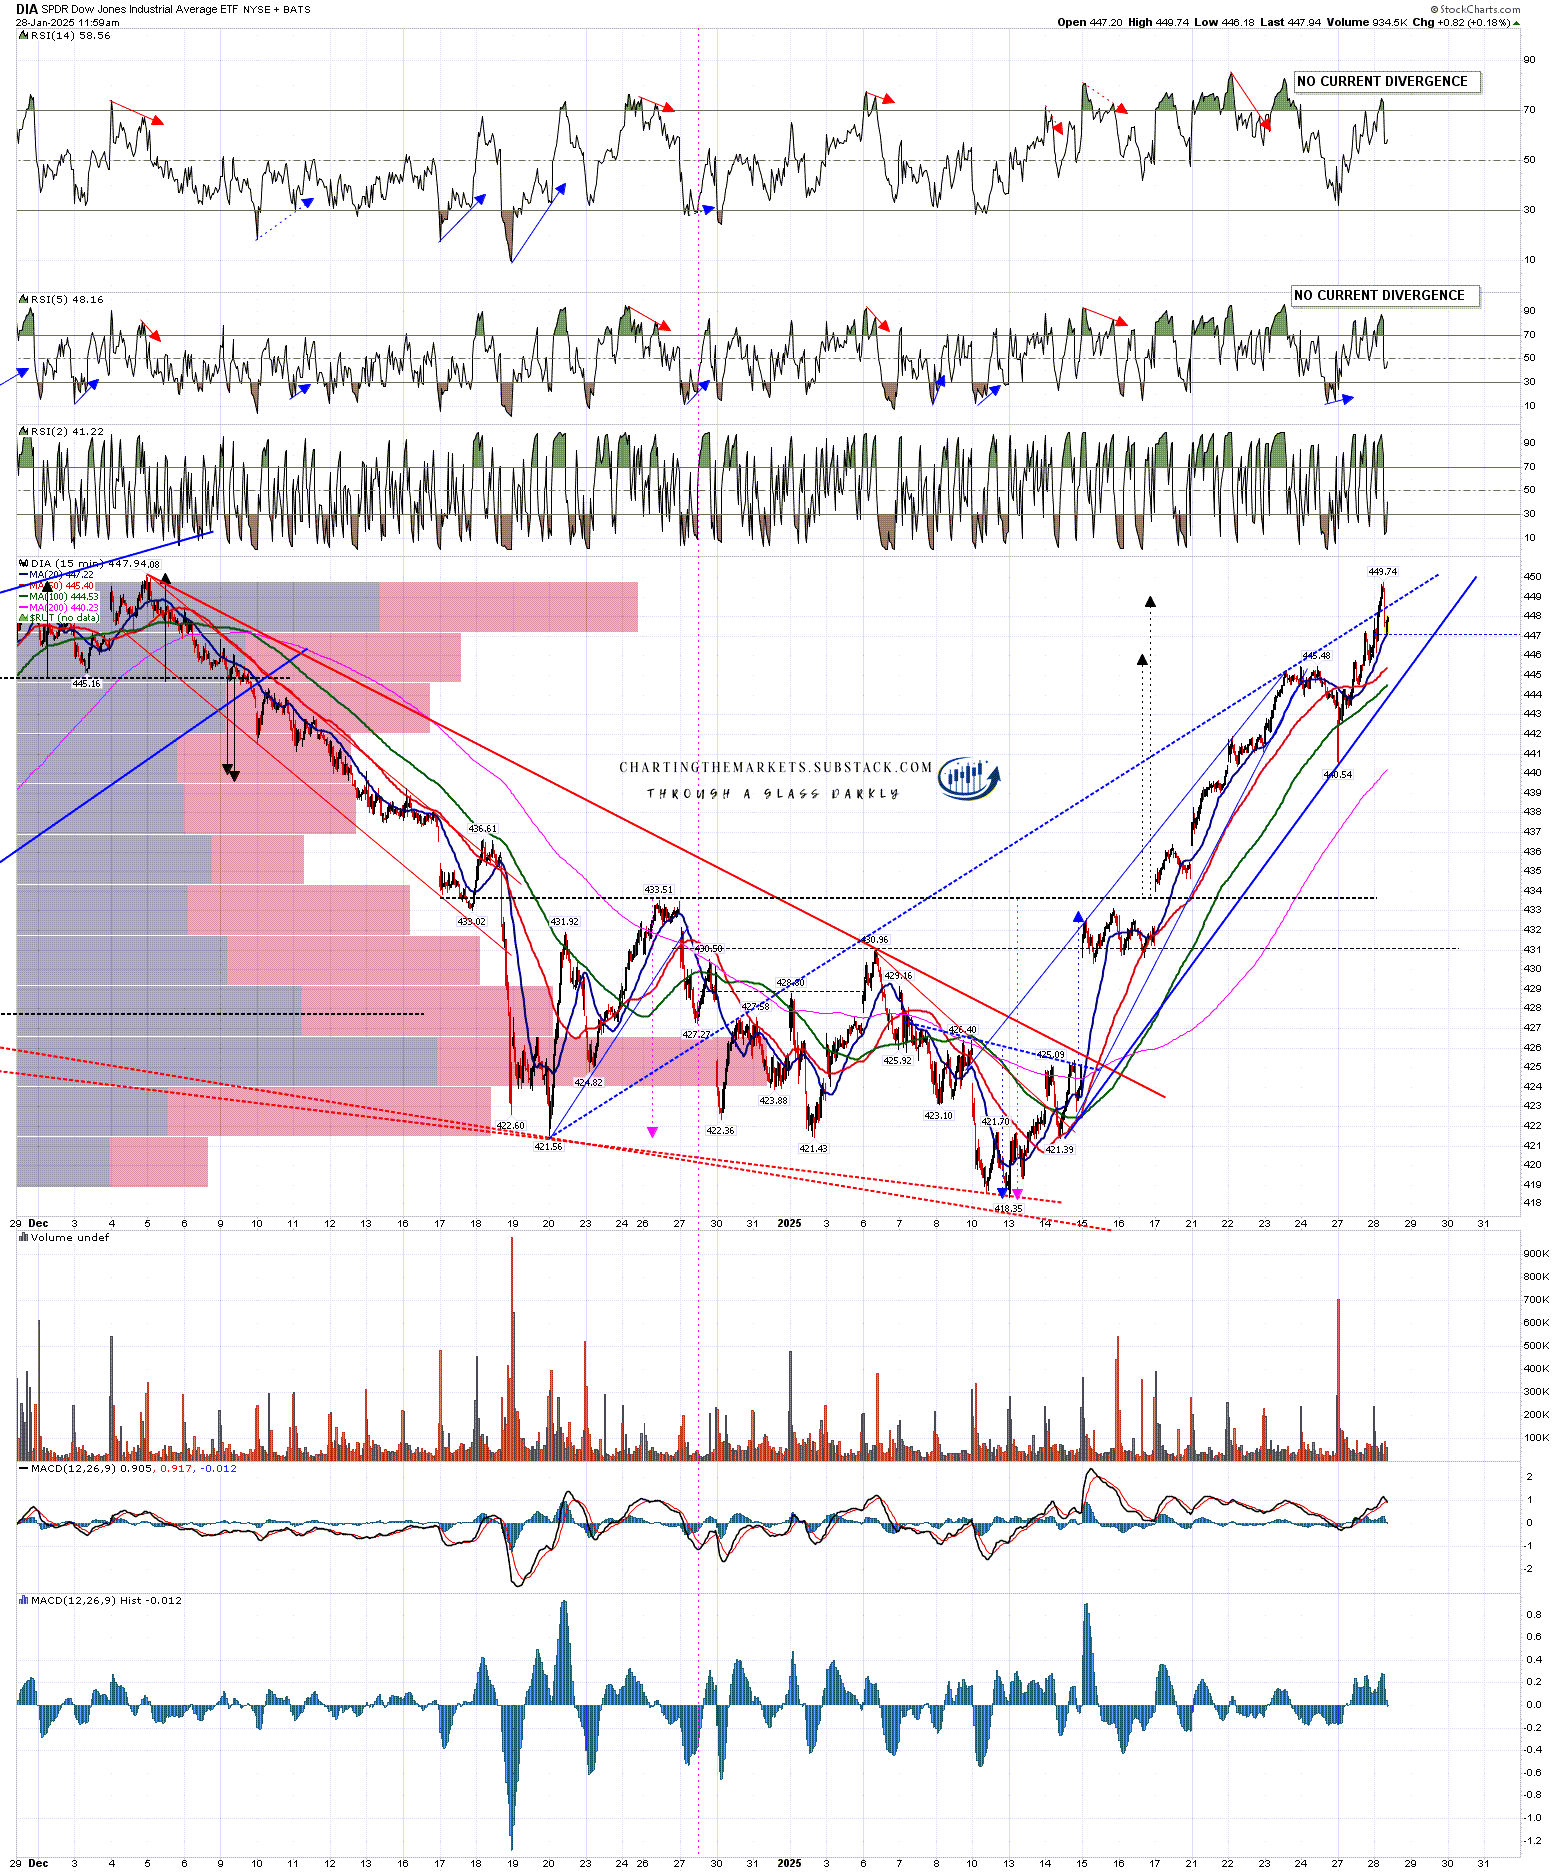
Short term though it is worth noting that there is also a small double top set up on DIA that on a sustained break below 445.77 would look for a target in the 441-2 area.

DIA 60min chart:

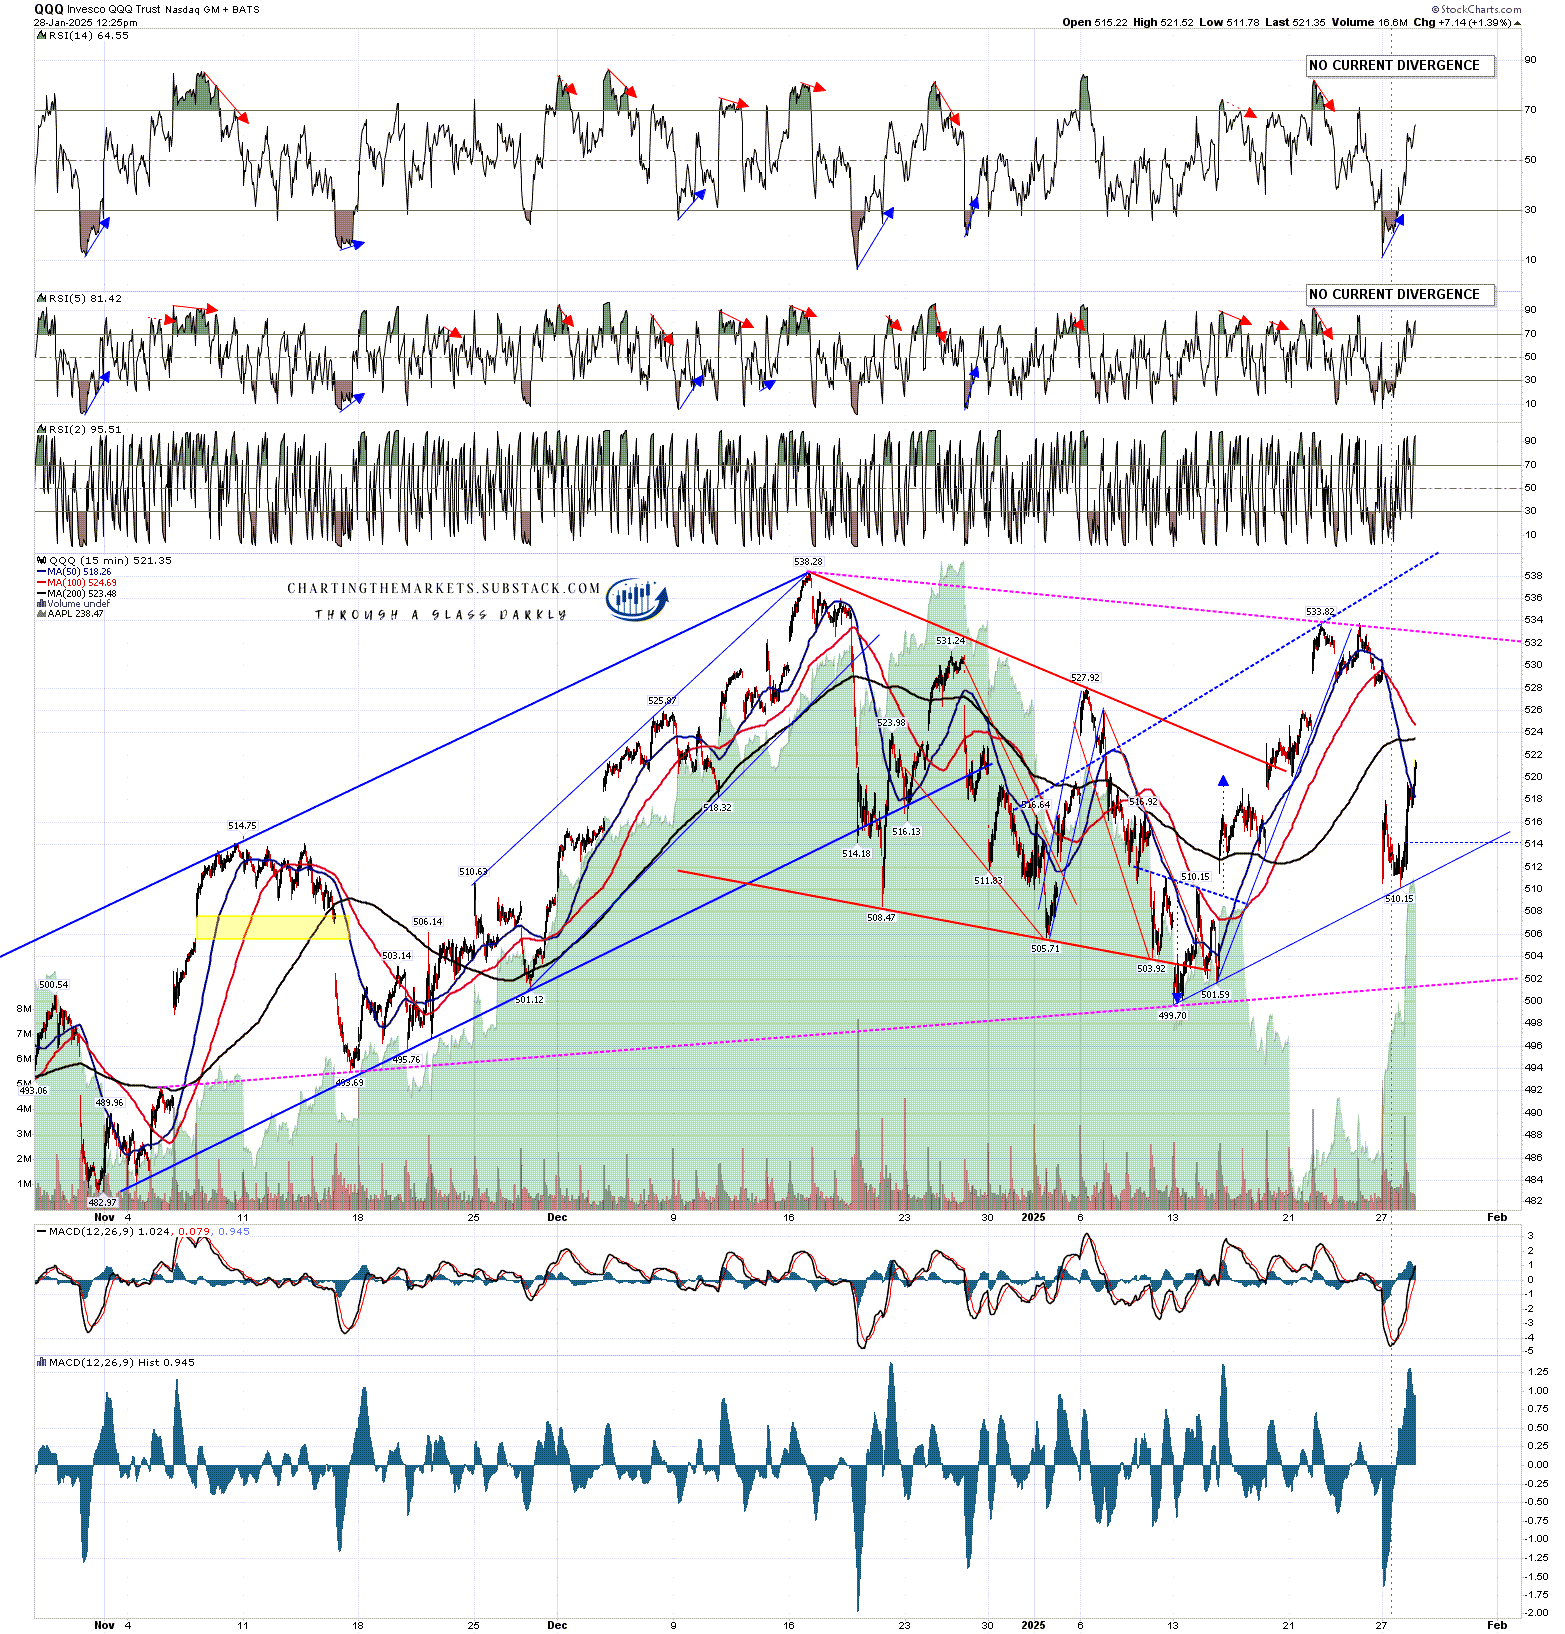
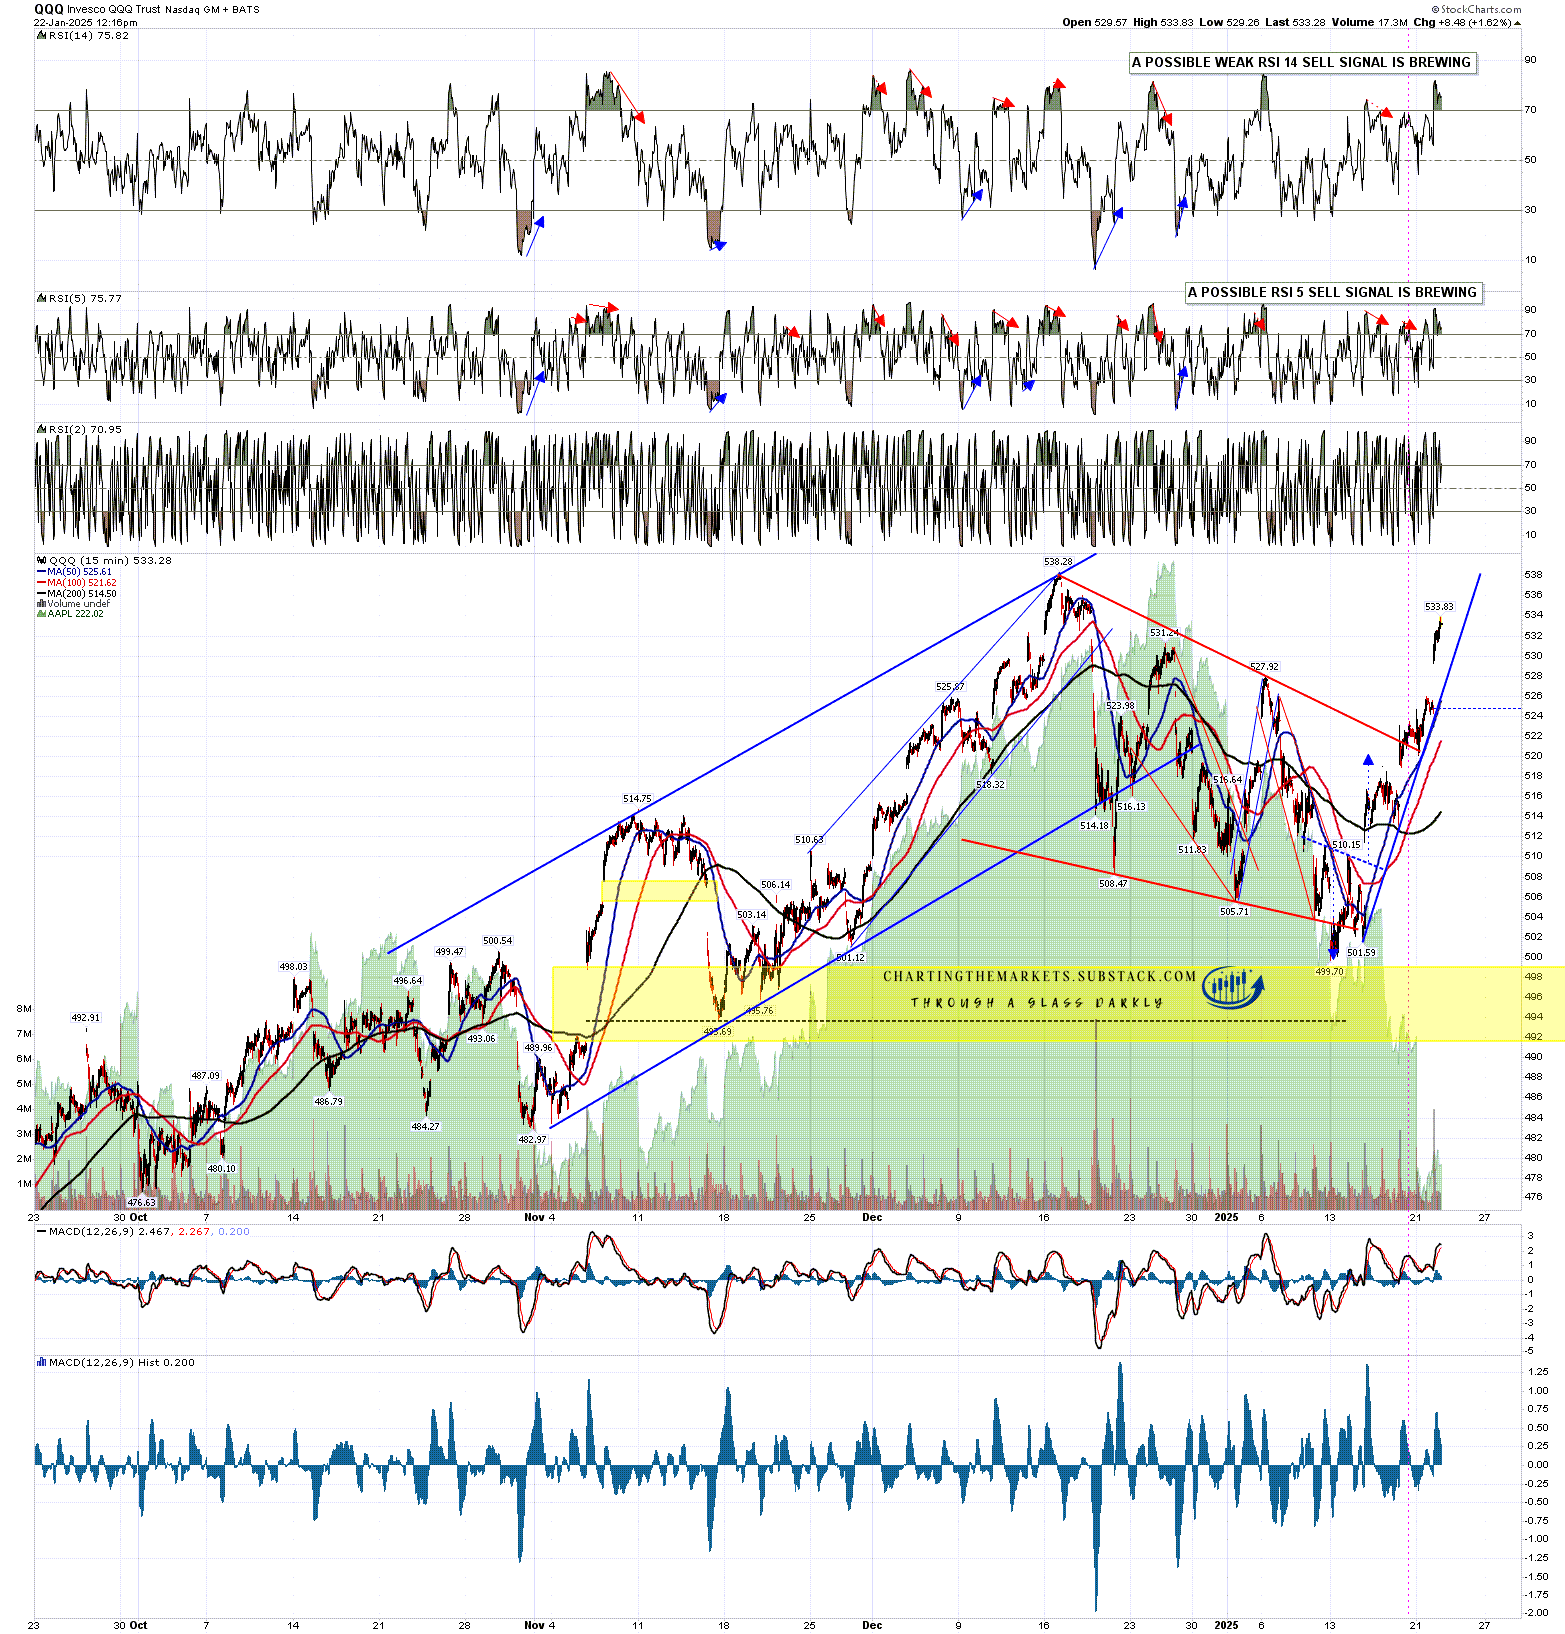
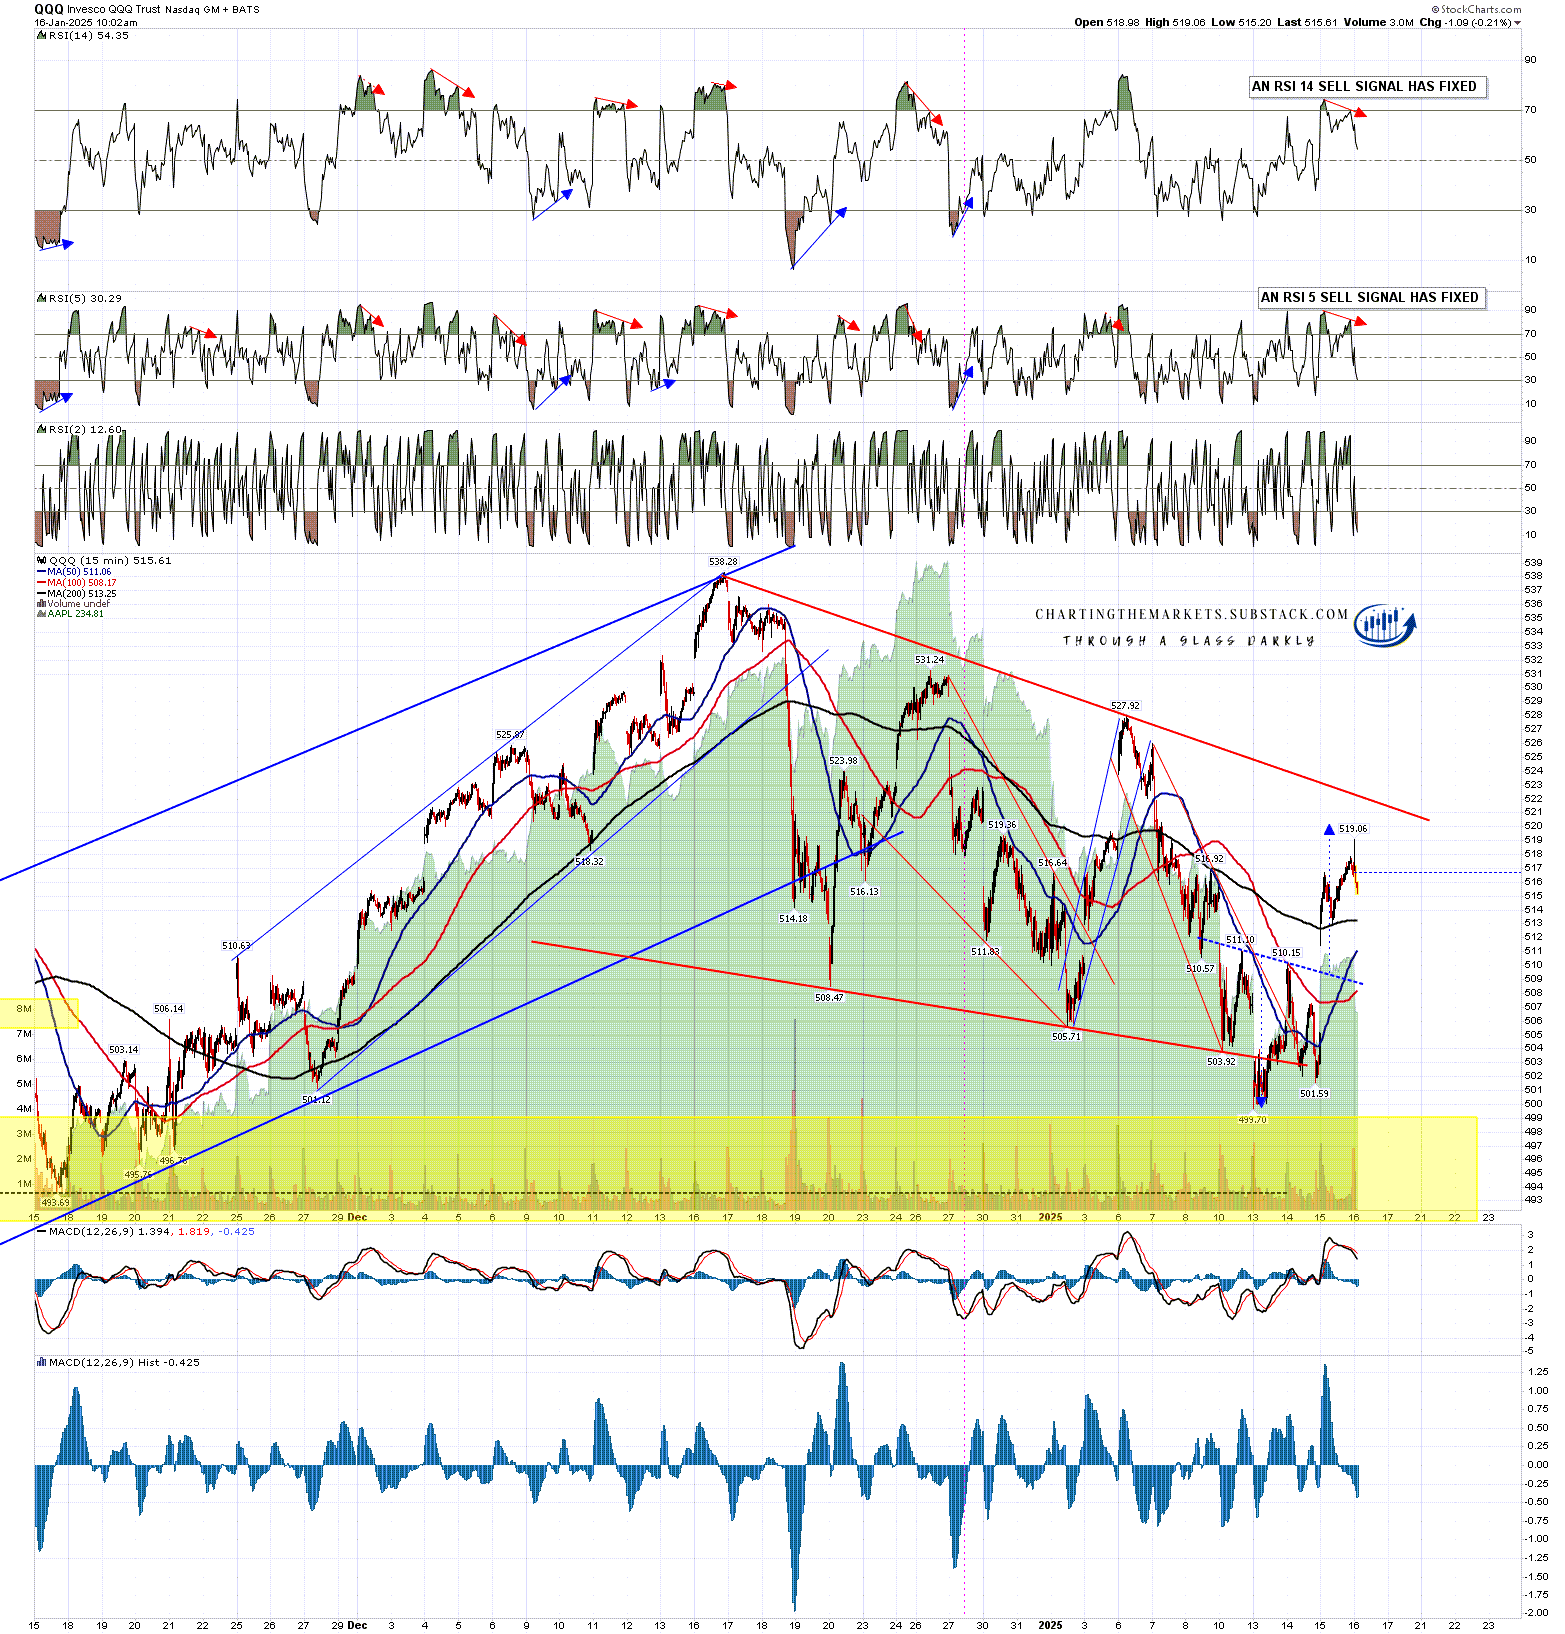
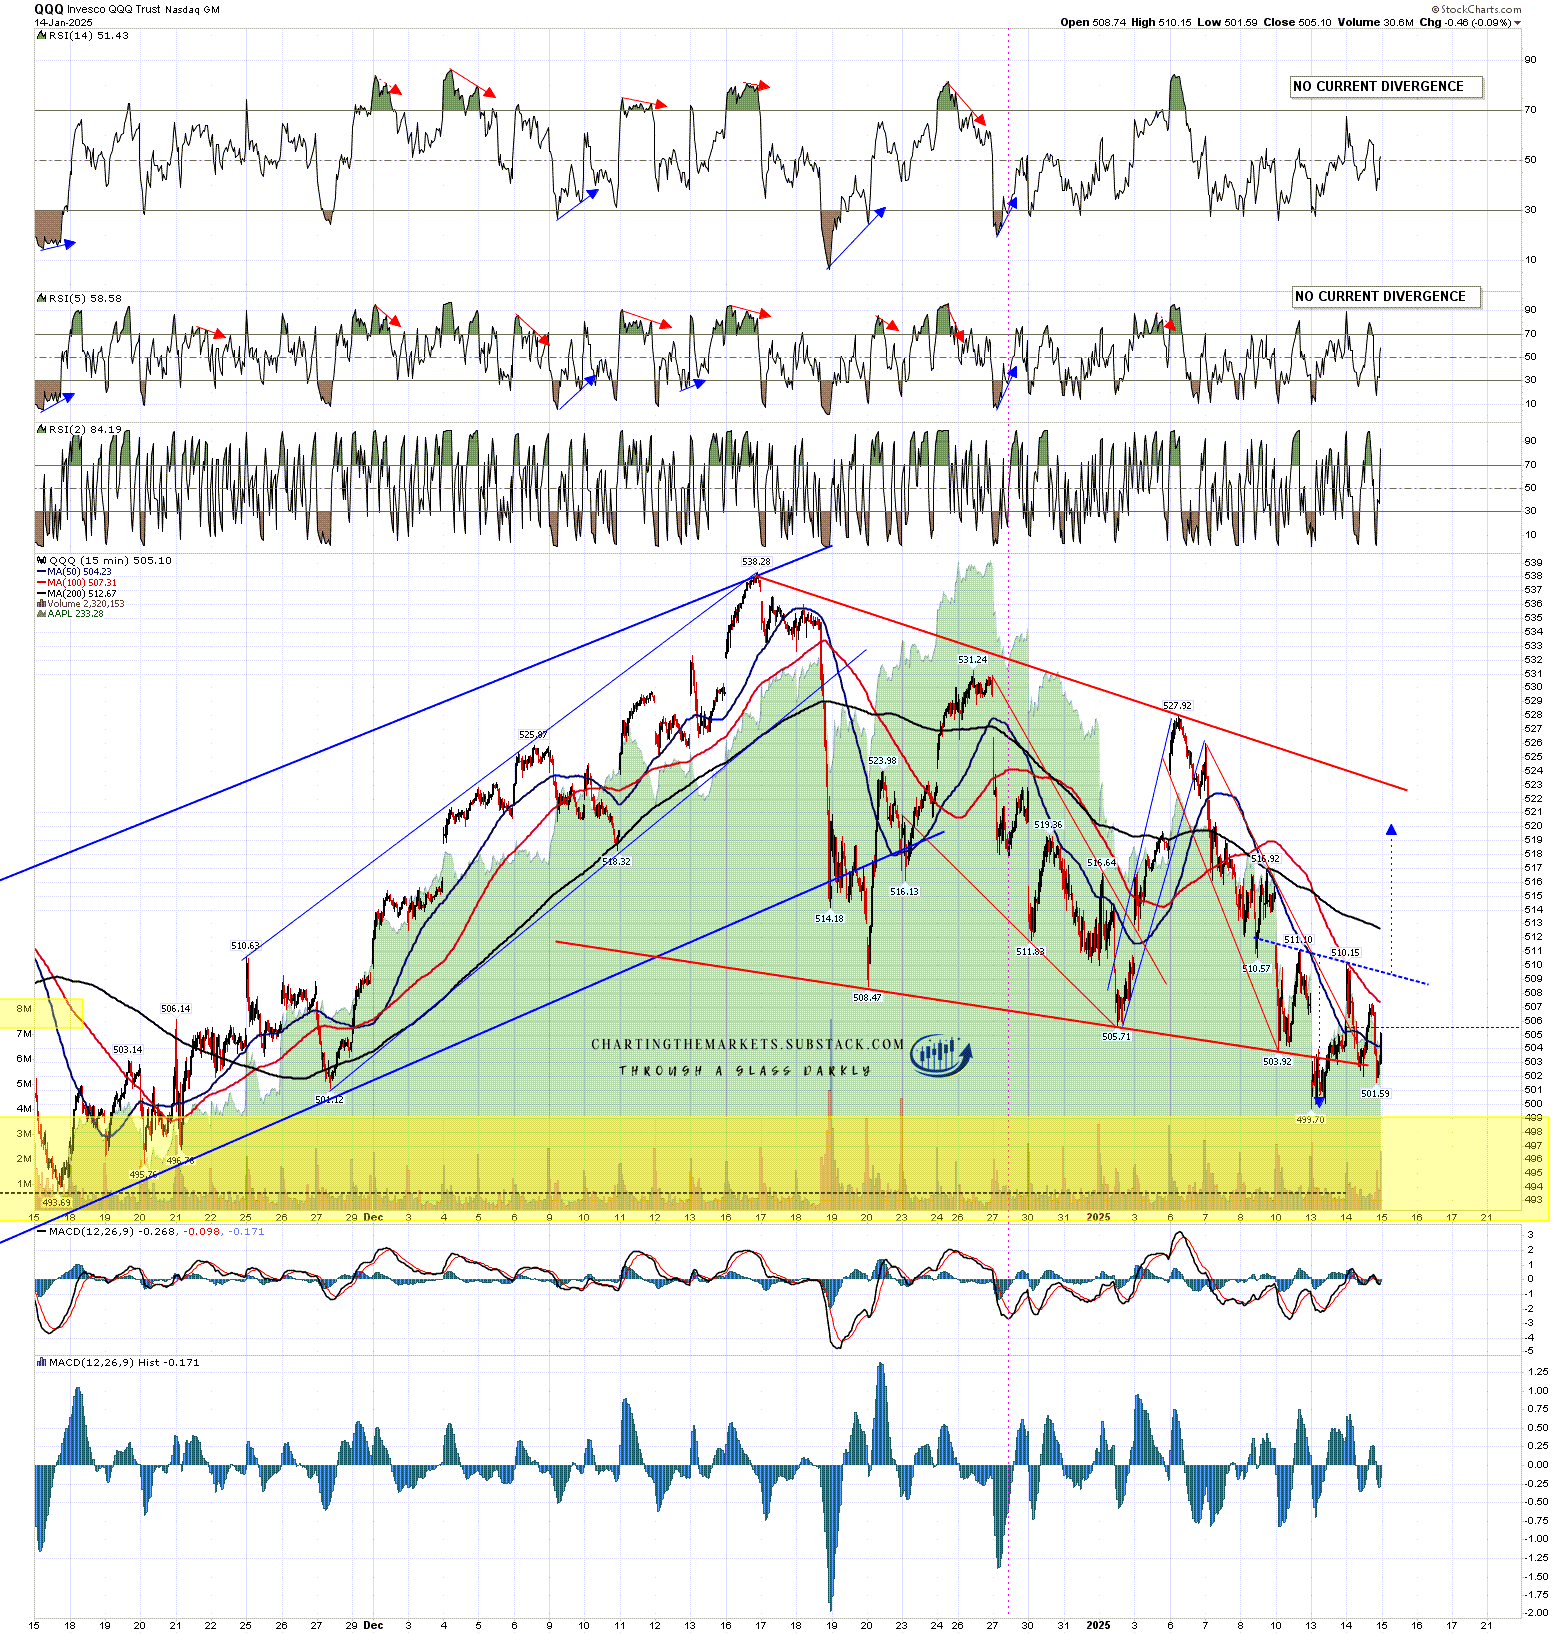
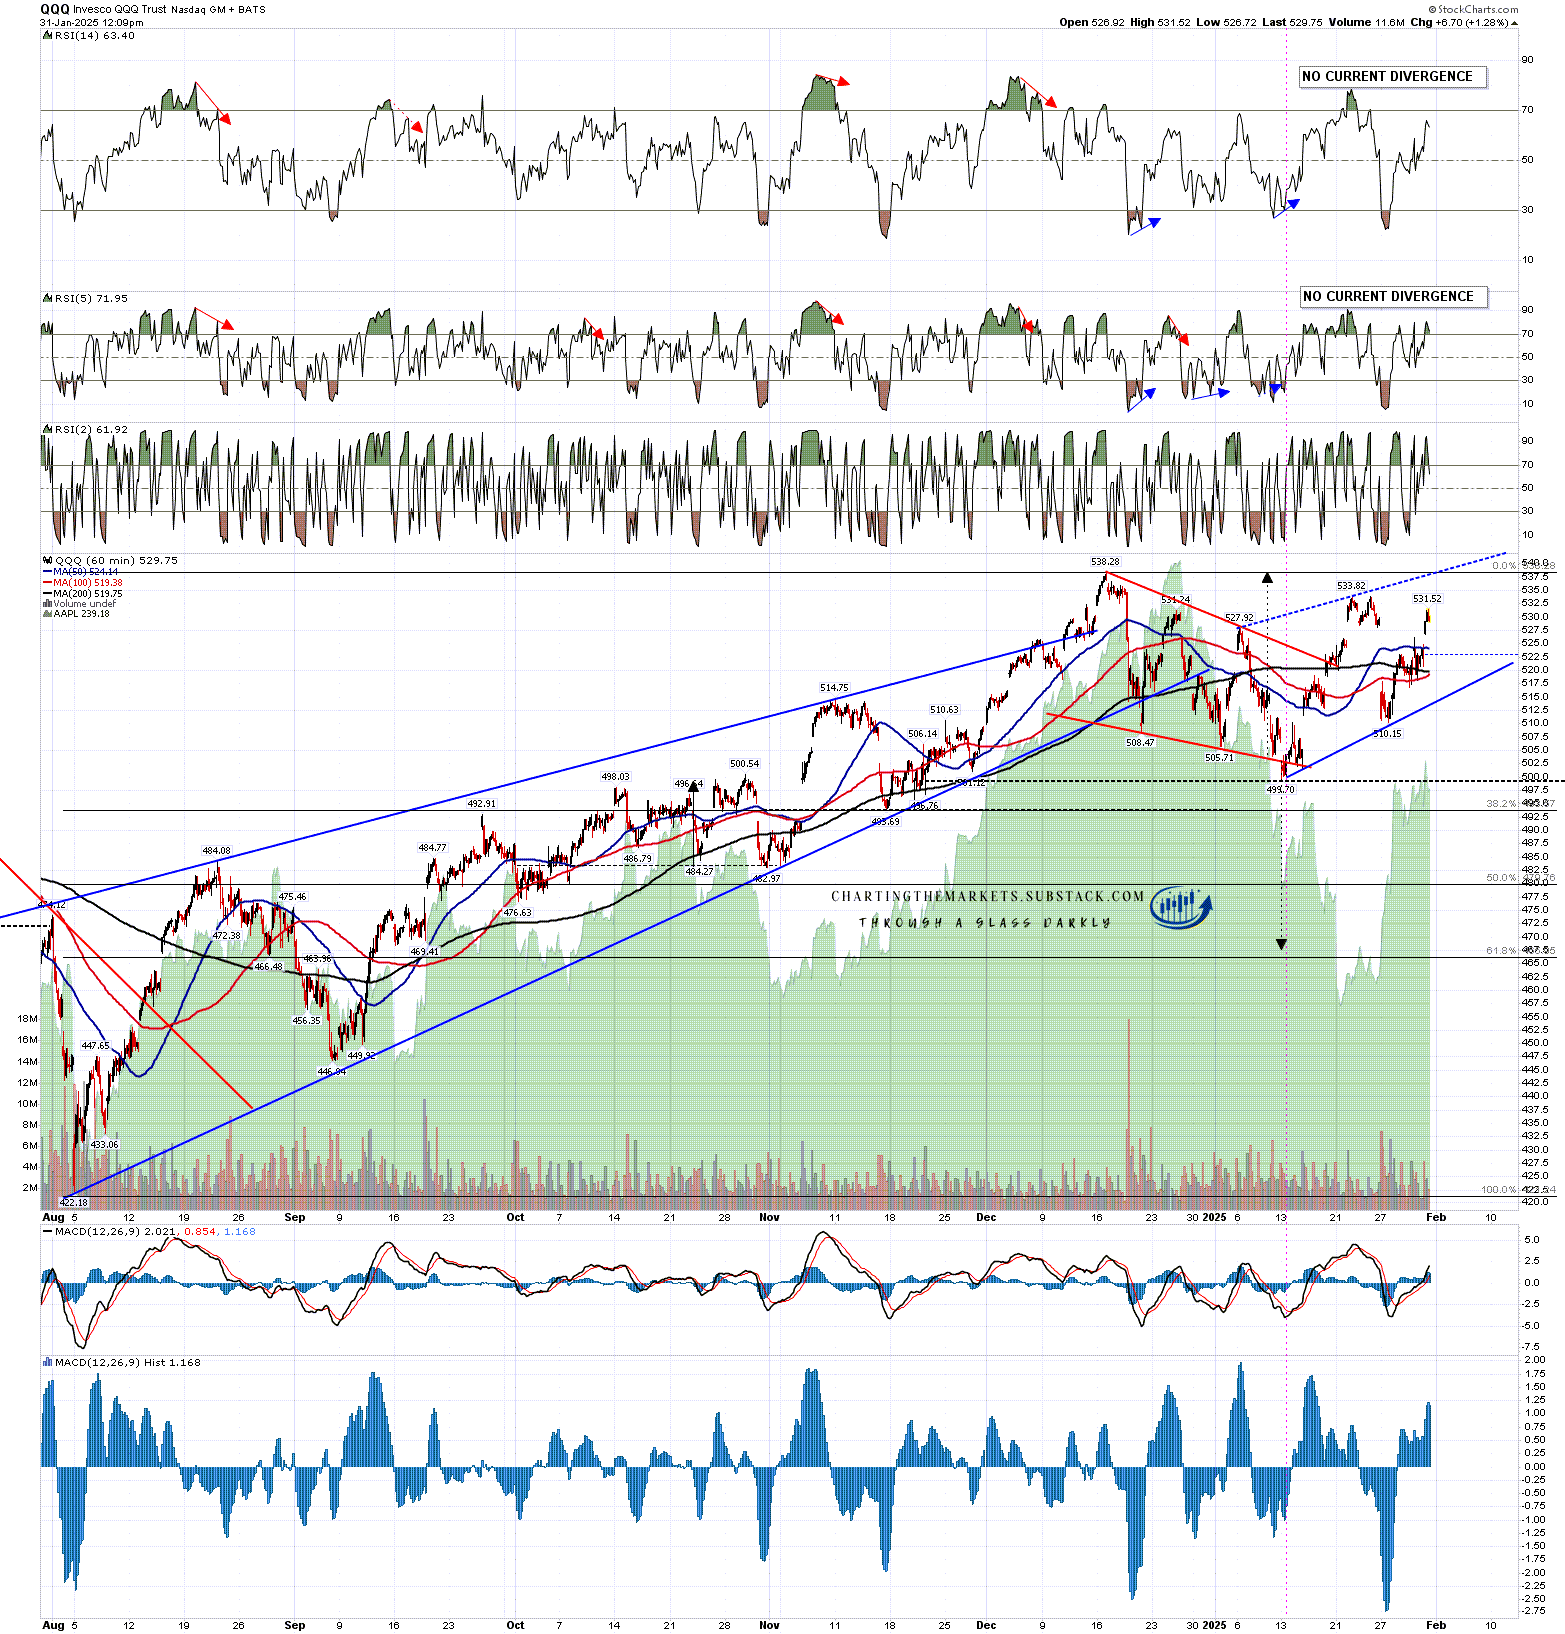
QQQ is getting close to target and I’m expecting it to make a new all time high, ideally in the next week or two.

QQQ 60min chart:

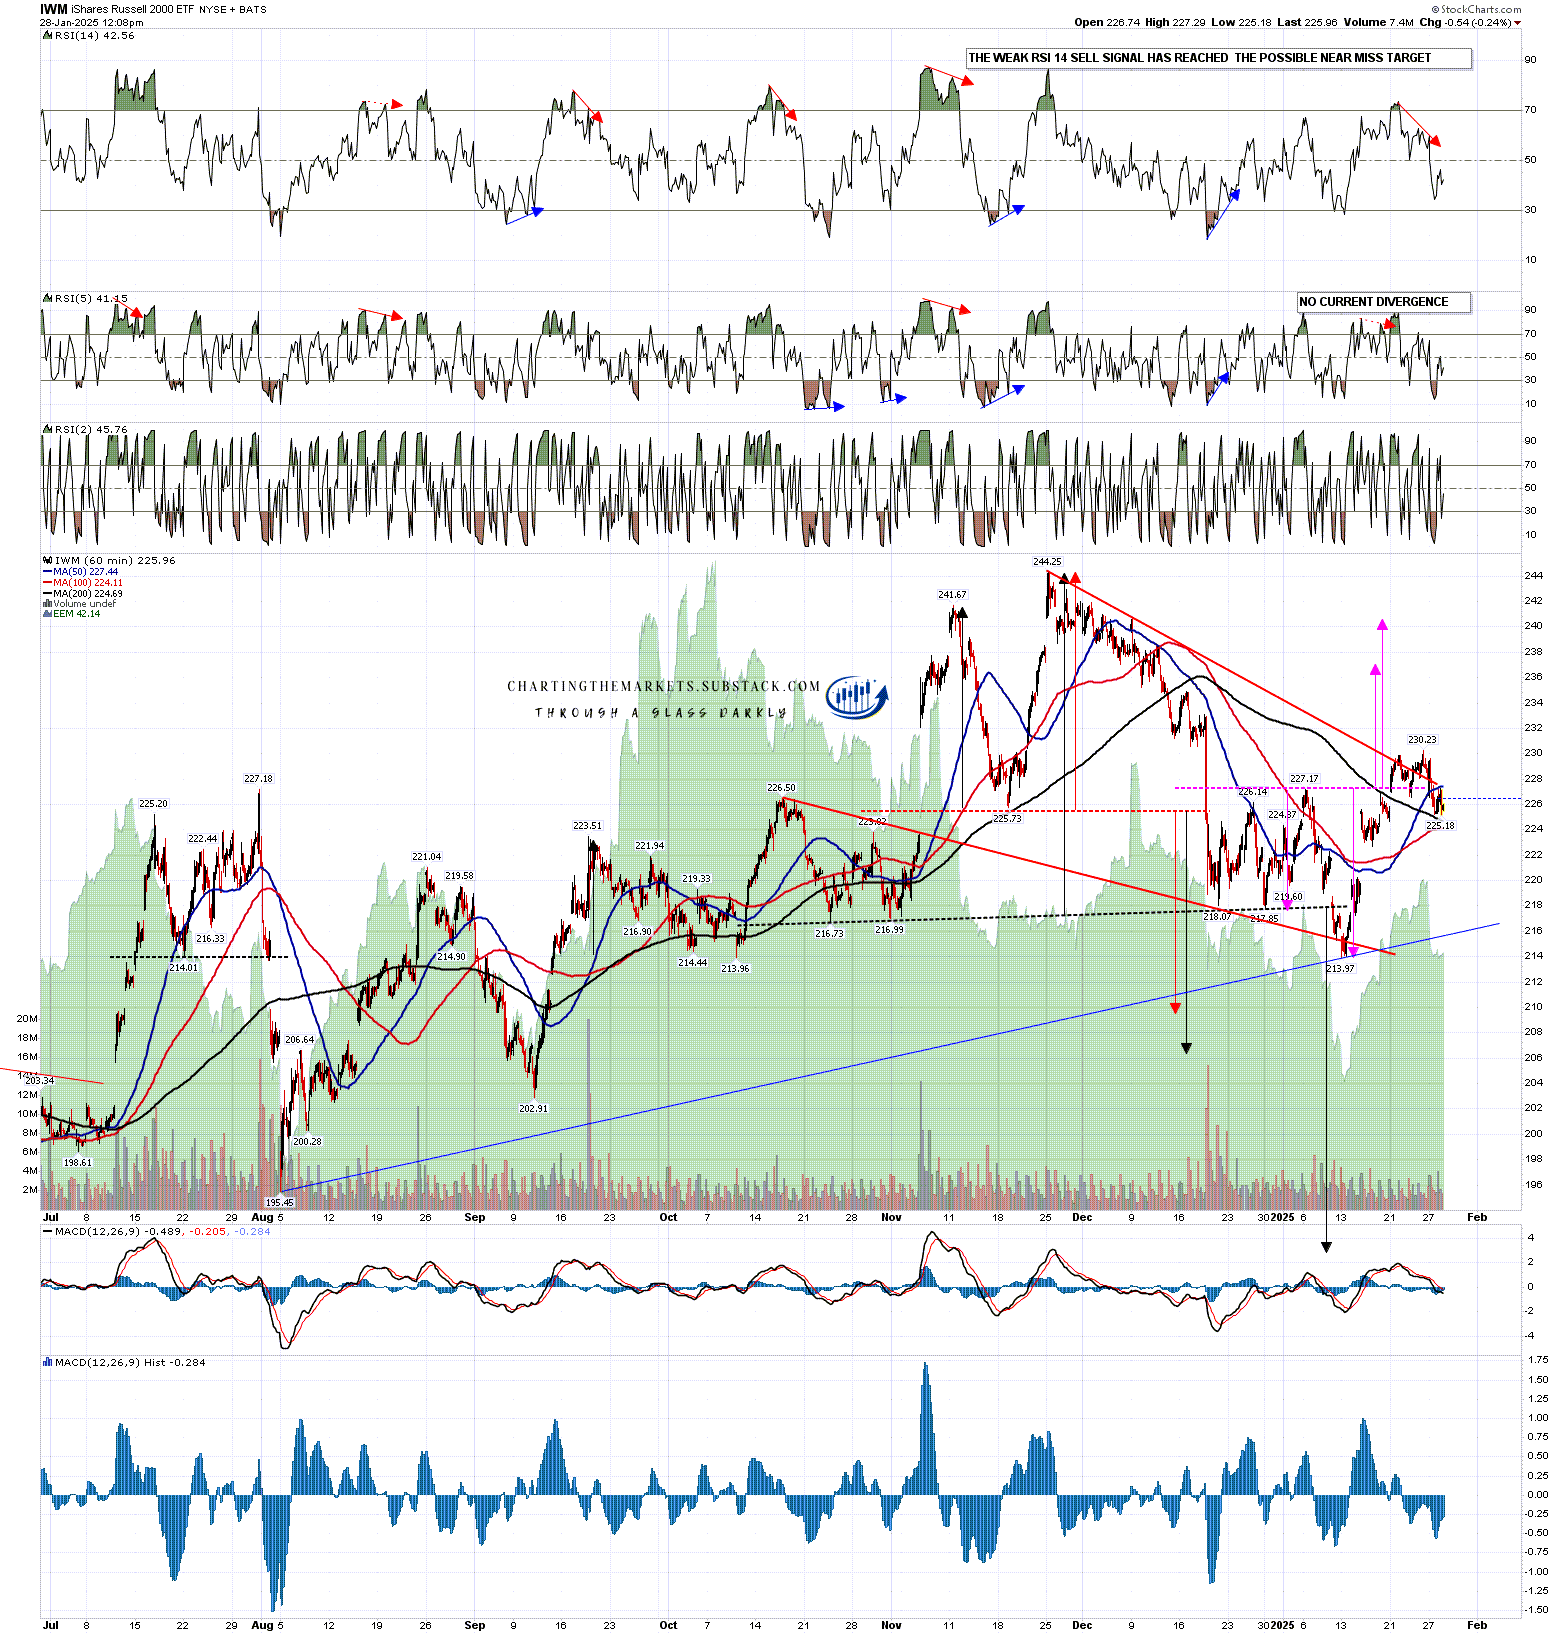
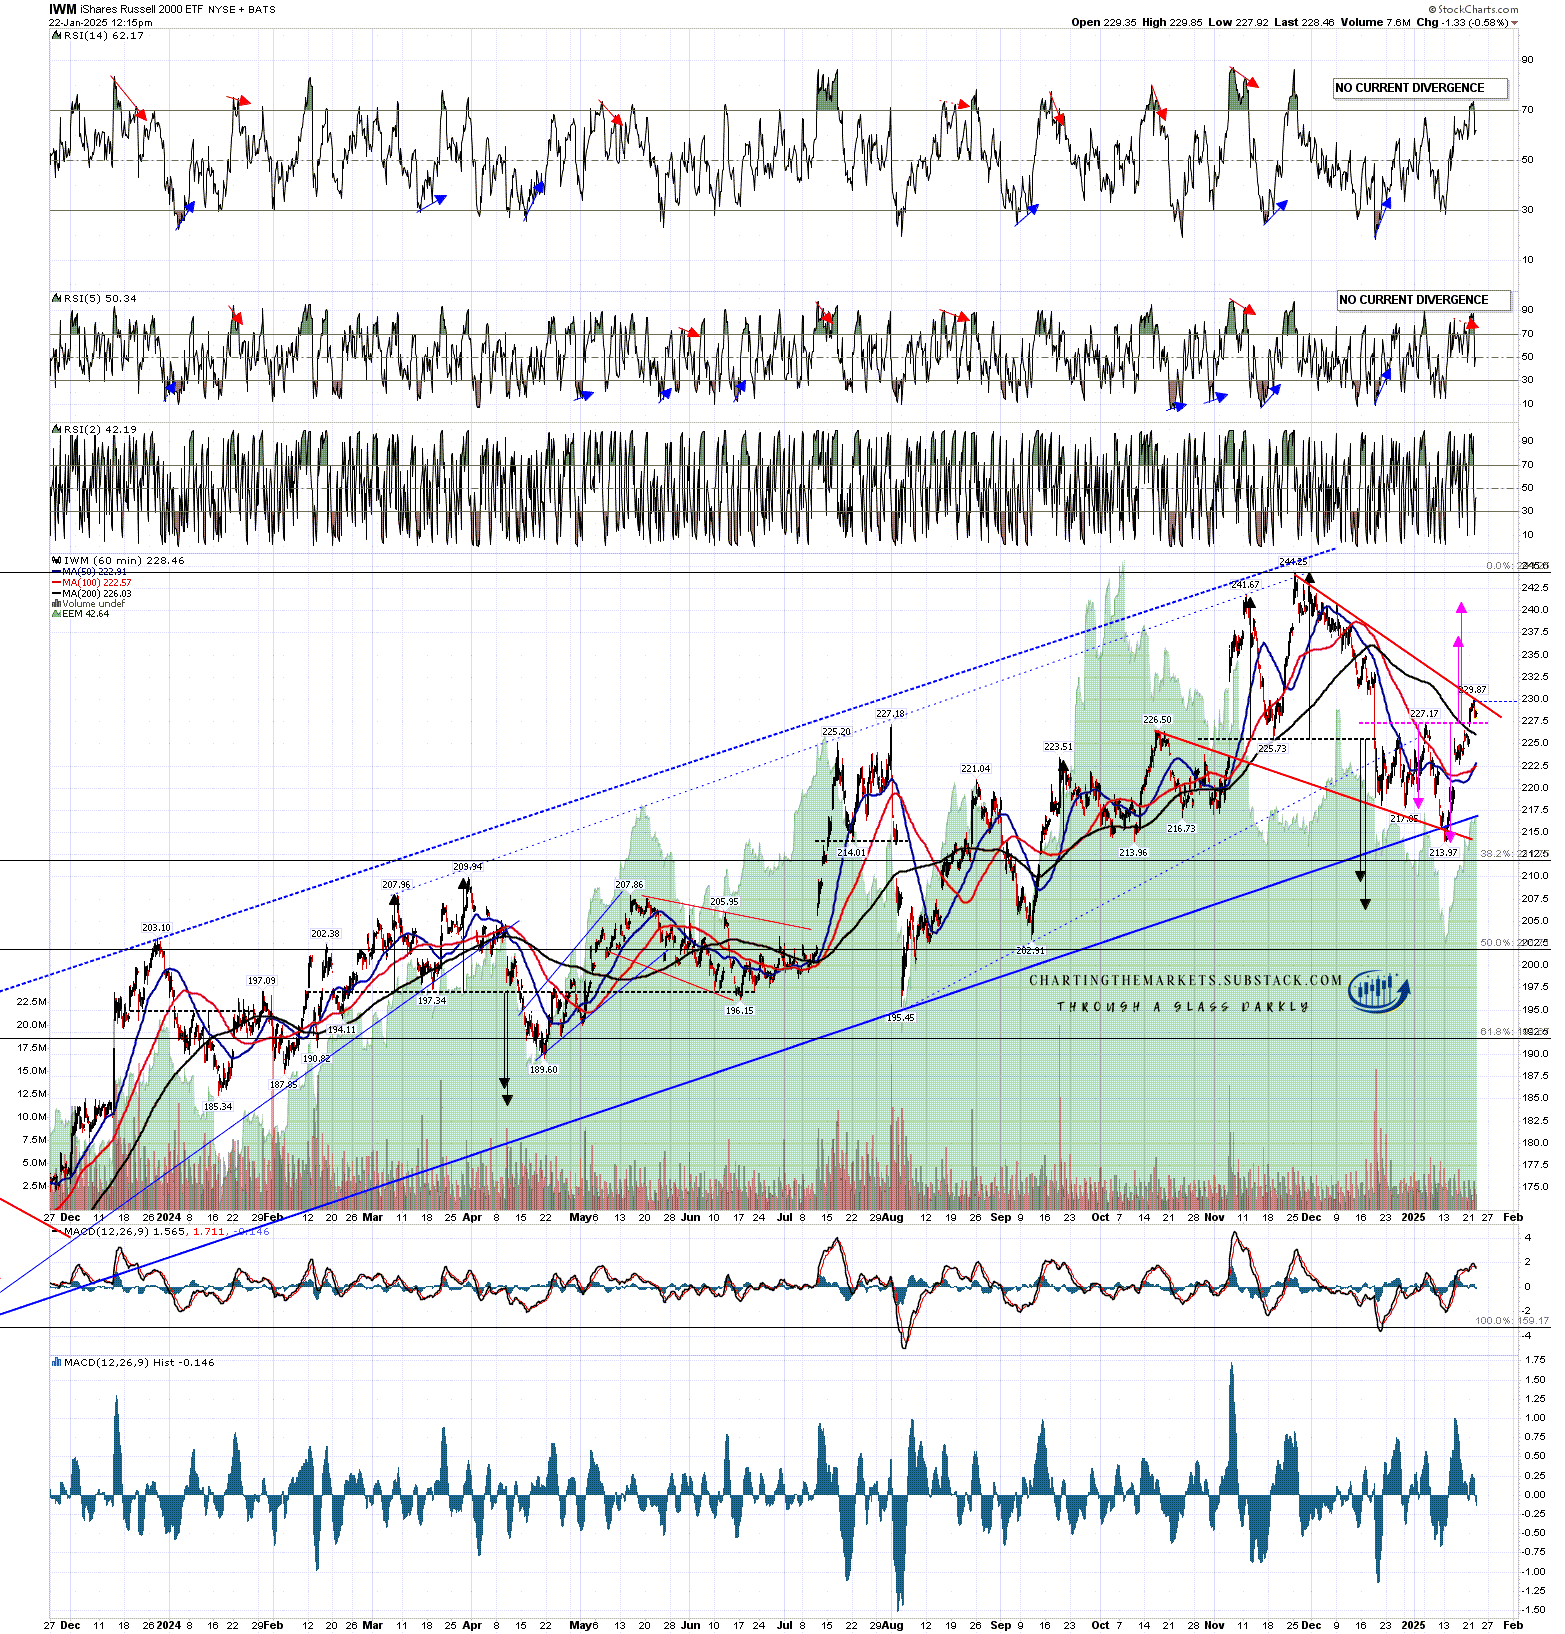
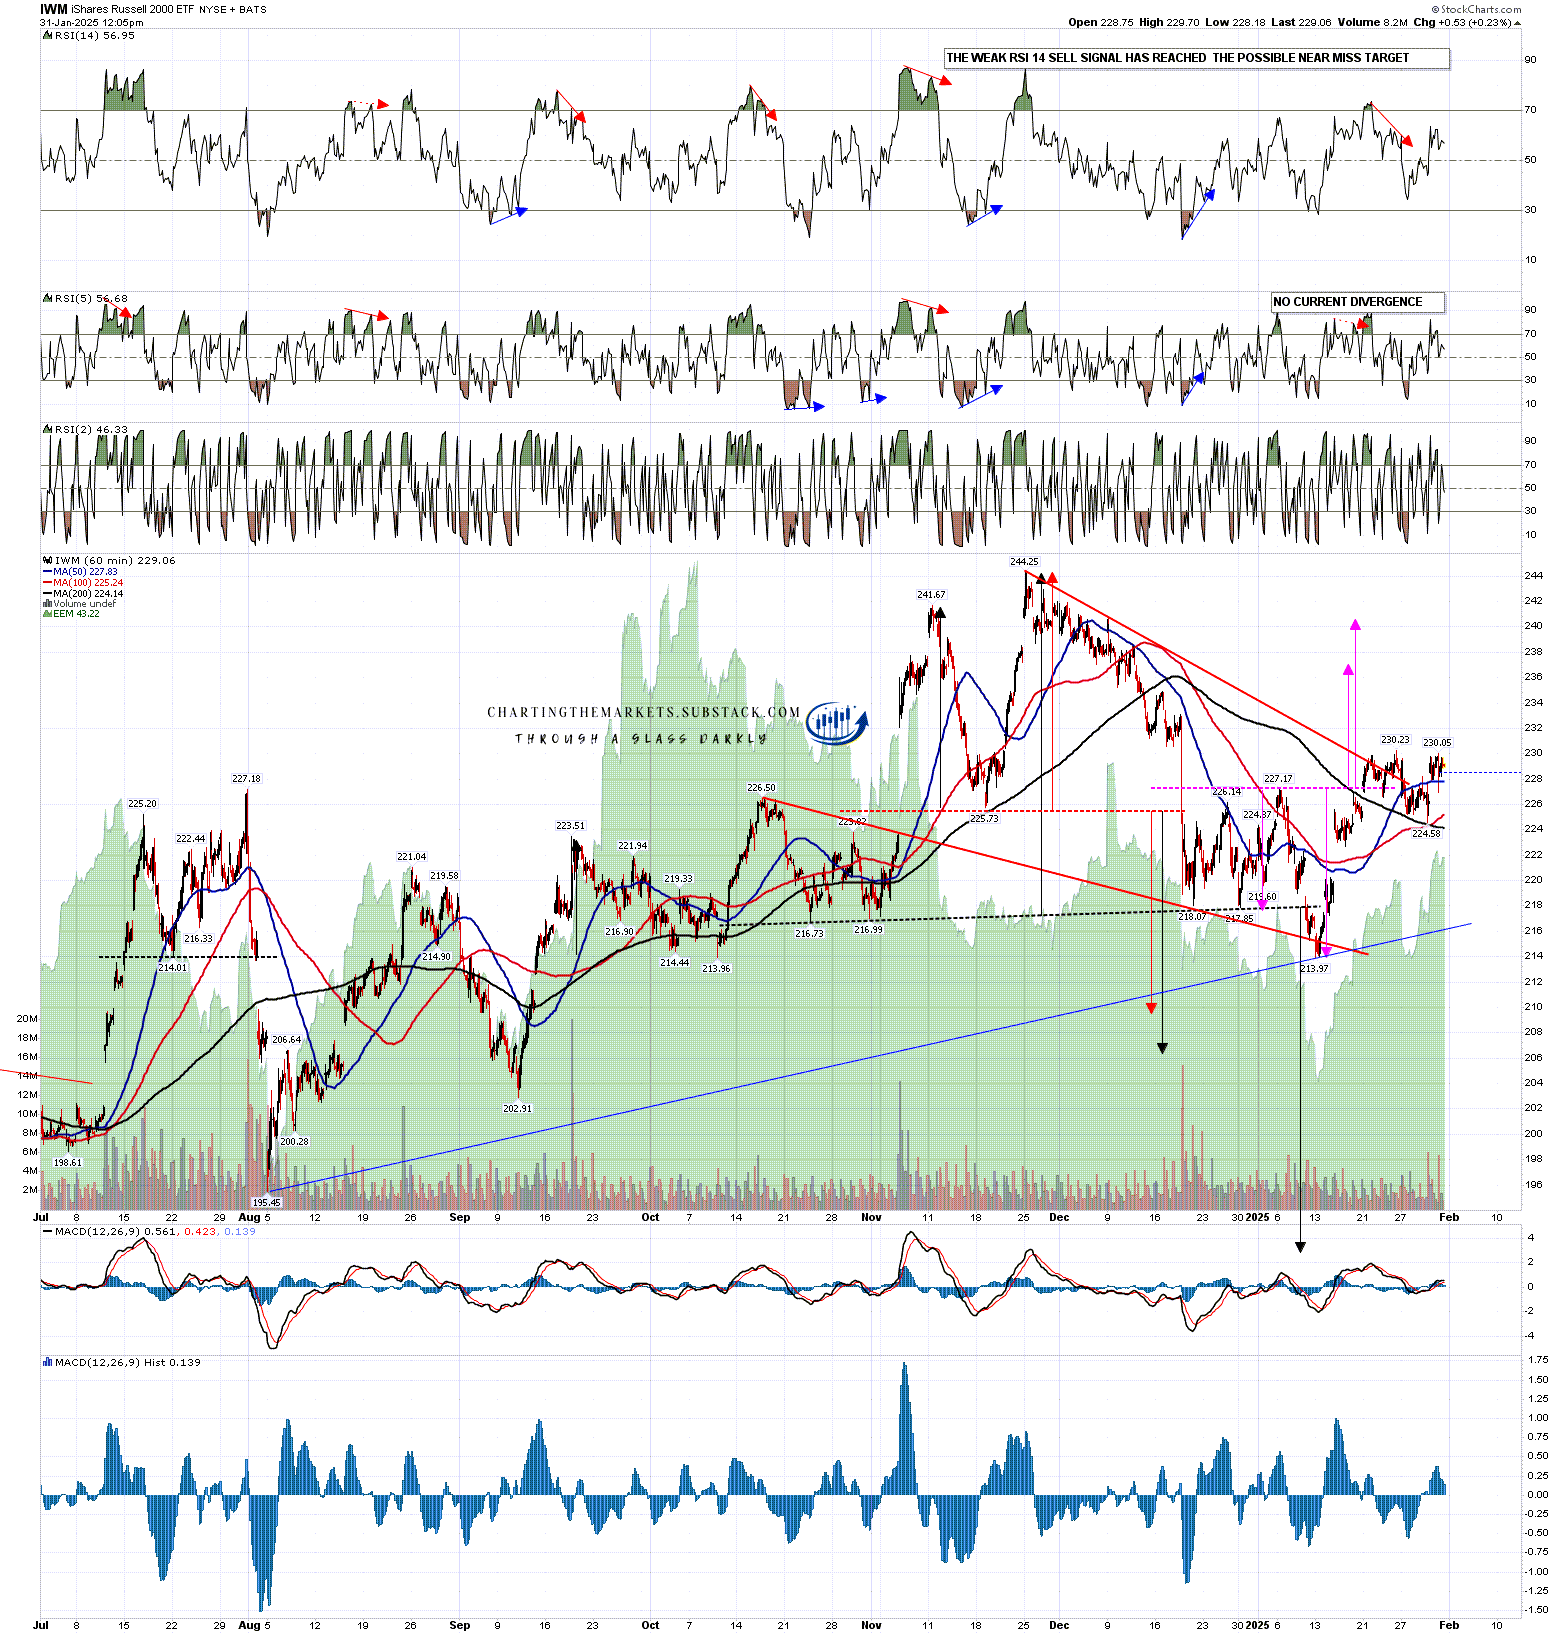
IWM has broken up from the bull flag, but very weakly so far. If we see the other three follow through decently to the upside then this has a shot at making a new all time high too, but it may fail before that.

IWM 60min chart:

On the IWM daily chart I would note that there is still an open double top target in the 207 to 209.5 area unless IWM is rejecting back into the highs.

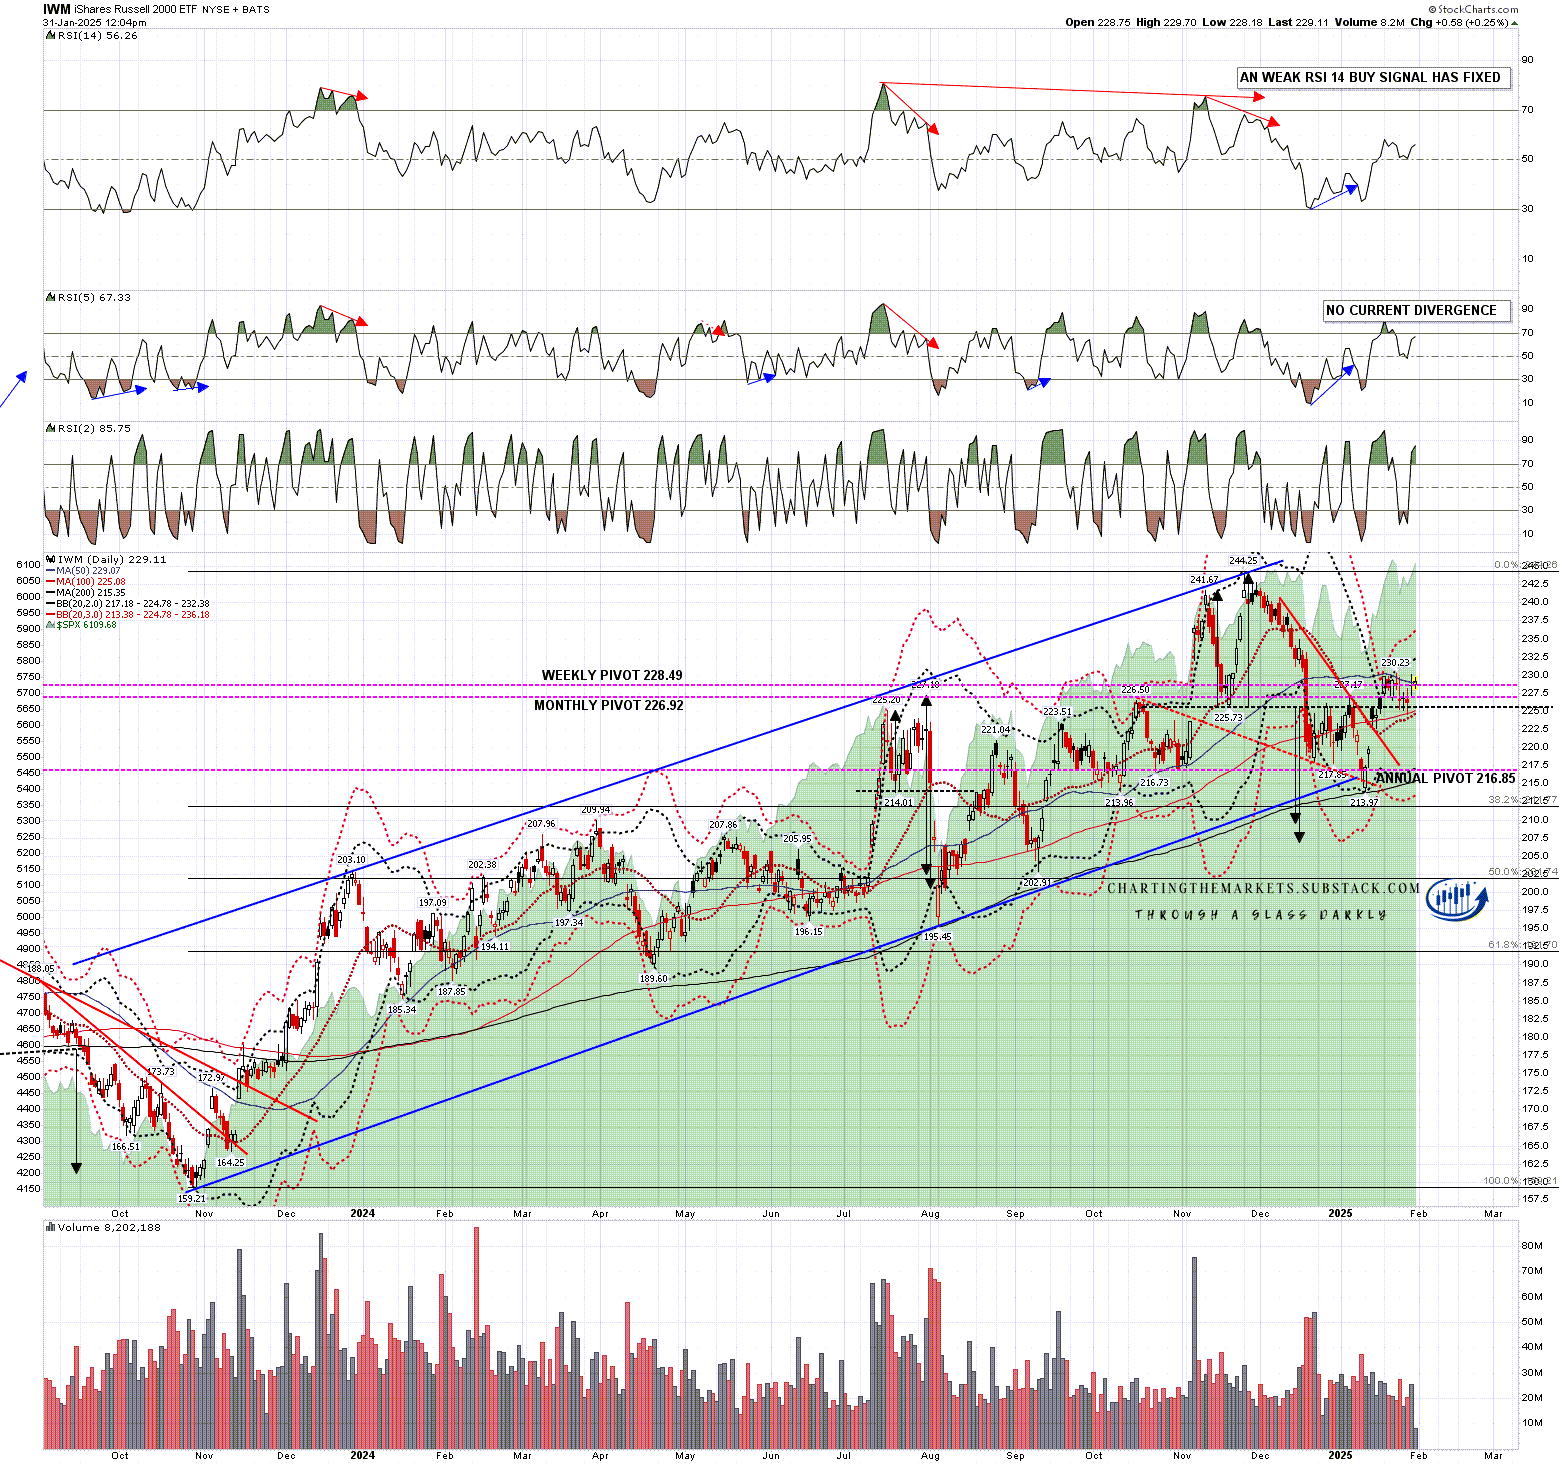
On the daily chart IWM recovered back over the daily middle band quickly but has been trying and failing to get back over the 50dma for nine days now, with the latest failure today. If IWM can break and convert that to support then a possible all time high retest has a shot. If not then IWM may just be marking time until another leg down.

IWM daily chart:

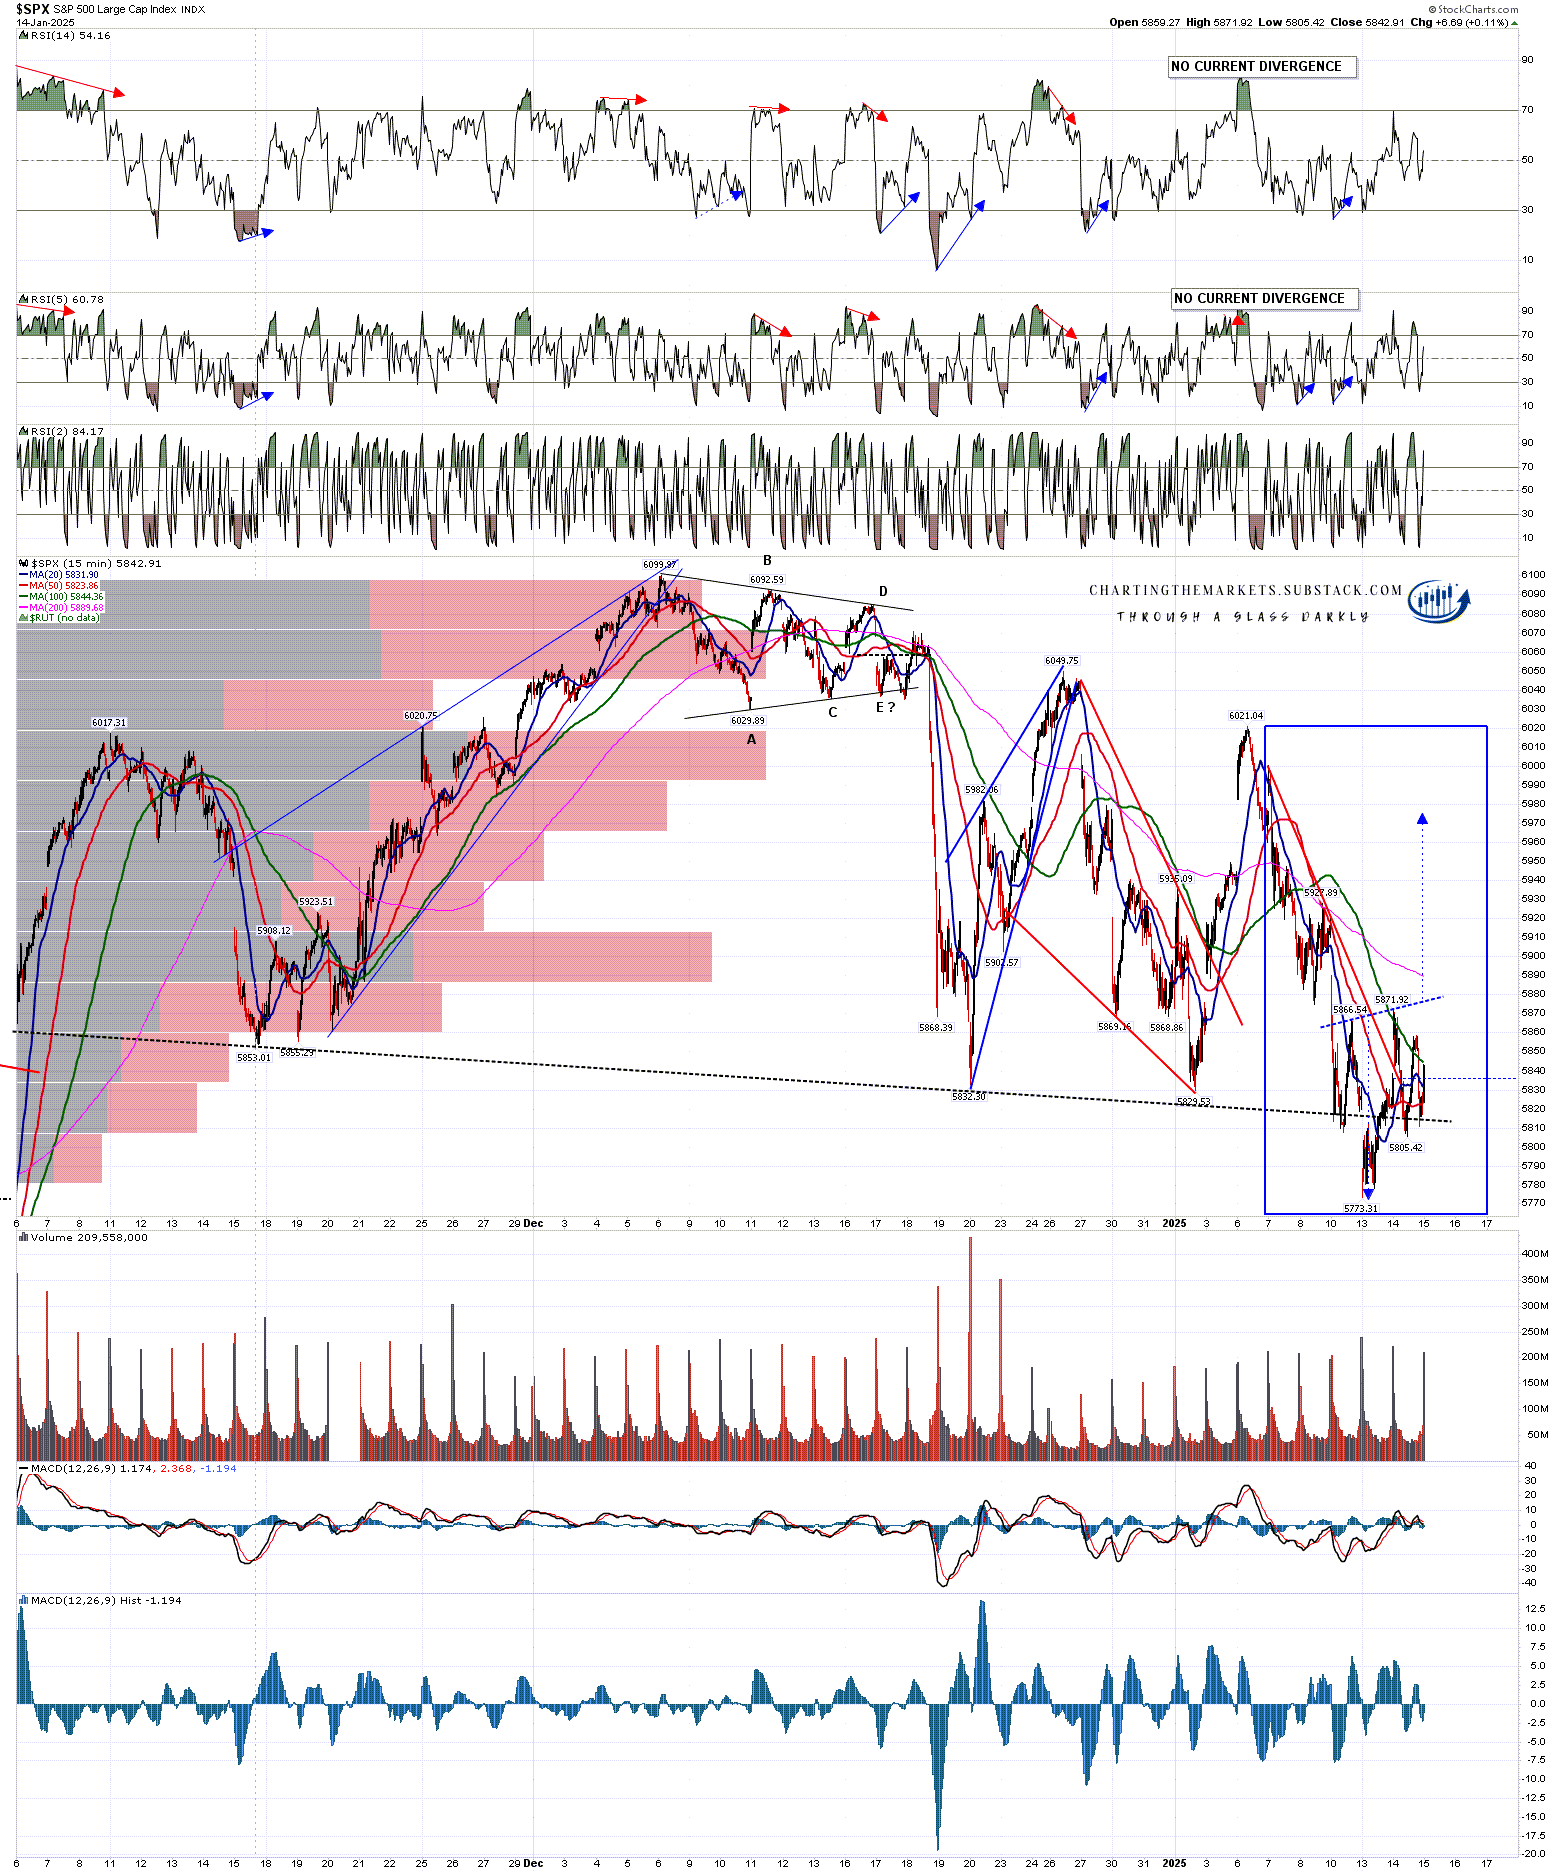
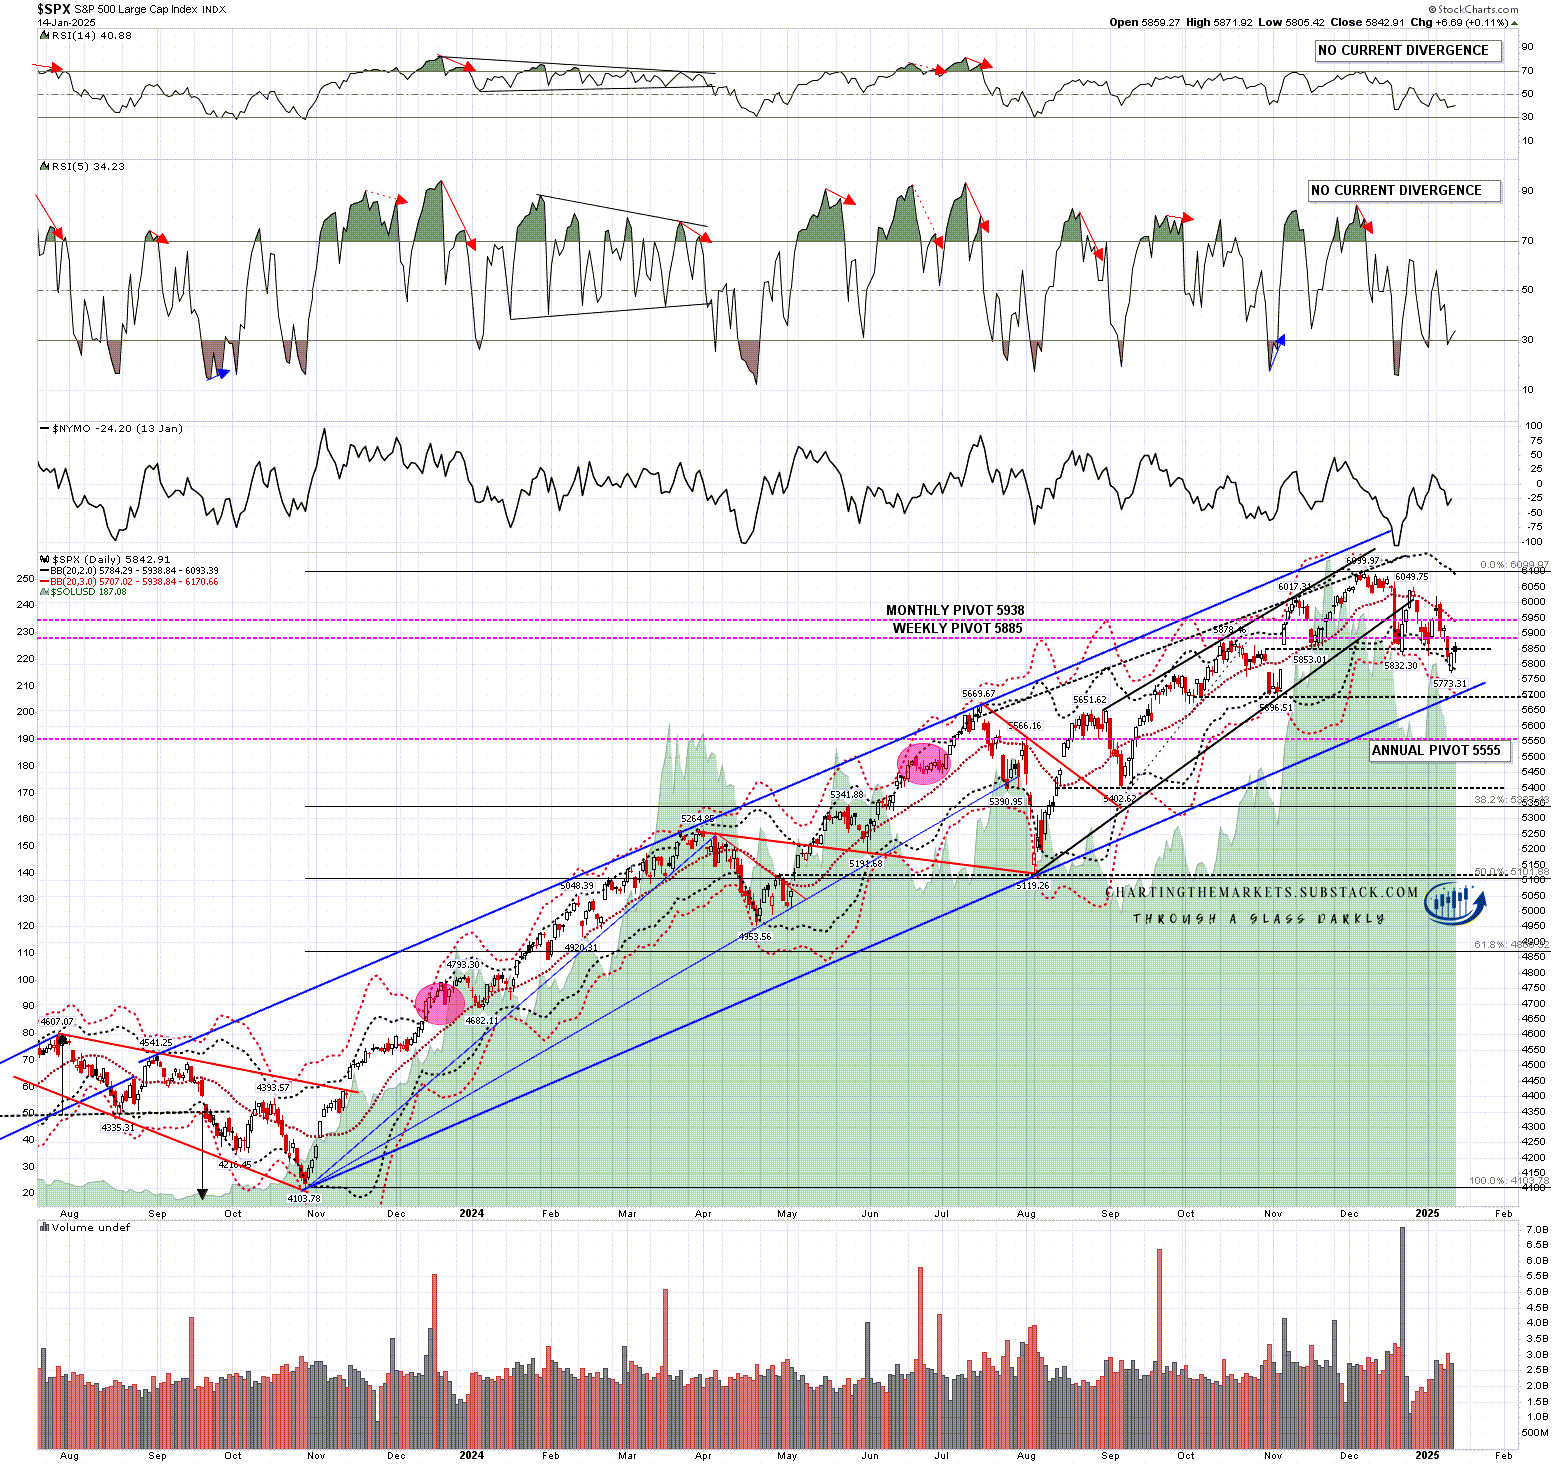
There is a possible topping setup forming here on SPX, DIA and QQQ too if it can get a little higher. This is another inflection point and I’m watching it carefully, though negative divergence is currently thin and there’s not much reason to expect a high now. We’ll see how this develops over the next few days.

In the short term though, Monday will lean very bullish and there will be a significant bullish lean to next week. That may deliver a new all time high on QQQ and a break up on IWM.

I’m still leaning towards a weak first half of 2025 and new all time highs later in the year, very possibly as a topping process for a much more significant high. One way or another I think we’ll be seeing lower soon and I’m not expecting this to be a good year for US equities. The last two years have been banner years for US equities. A third straight year of these kinds of gains looks like a big stretch. I could of course however be mistaken. Everyone have a great weekend. :-)

If you like my analysis and would like to see more, please take a free subscription at my chartingthemarkets substack, where I publish these posts first. I also do a premarket video every day on equity indices, bonds, currencies, energies, precious commodities and other commodities at 8.45am EST. If you’d like to see those I post the links every morning on my twitter, and the videos are posted shortly afterwards on my Youtube channel.

Thursday, 30 January 2025

Bitcoin & Solana Bull Flags Breaking Up

In my last post on Thursday last week I was, among other things, looking at a sharply upsloping H&S on Bitcoin (BTCUSD) that had broken down with a target in the 92,000 area, though I was expecting that H&S to reject back up into the highs, and over last weekend Bitcoin broke down into a low at 97.7k.

On the face of it that was looking promising for the H&S to reach target but in my premarket video on Monday I put the case against that, on the basis that so far at least, this was looking like a backtest of the daily middle band as part of a bullish consolidation. In my premarket video on Tuesday I had drawn in the obvious bull flag setups on both Bitcoin and Solana (SOLUSD). 

Fast forward to today and those bull flag setups are now breaking up, so let’s review.

On Monday I was noting that the daily middle band on Bitcoin has been backtested and that as long as the daily middle band held as support, there was nothing inherently bearish about that backtest. The daily middle band has continued to hold as support since then.

BTCUSD daily chart:

On the Bitcoin 15min chart I drew the obvious bull flag setup on Tuesday morning and that has broken up overnight with a target at a retest of the all time high at 109.3k. In the event that Bitcoin should now break up over the H&S right shoulder high at 107.3k, as I mentioned a week ago, the H&S would be invalidated and that would fix a second target back at a retest of the all time high at 109.3k.

Bigger picture I was also talking about a possible larger retracement after that retest of the all time high, but as Bitcoin goes higher, that all time high retest is looking very and increasingly compelling.

BTCUSD 15min chart:

On Solana I was also noting at the start of this week that the daily middle band had been backtested and that, as with Bitcoin, there was nothing inherently bearish about that.

SOLUSD daily chart:

On the 15min chart I had drawn in the very nice looking bull flag setup on Tuesday morning and that is now also breaking up with at target at a retest of the all time high at 294.95. That isn’t the only option here of course, but it is the obvious one, and this was avery high quality bull flag falling wedge with three clear touches on both the support and resistance trendlines.

SOLUSD 15min chart:

I was talking about the relative underperformance on Ethereum (ETHUSD) a week aga and that has continued. Ethereum was struggling to get back over the daily middle band then, and the bands have been compressing as they often would before a big move in either direction. Ethereum is testing the daily middle band as resistance again today.

An H&S had broken down on Ethereum with a target in the 2100 area, and that H&S has not been invalidated and could still make that target. We’ll see.

ETHUSD daily chart:

Is there a bullish setup forming on Ethereum? Yes, though it has been a very slow mover. There is a bull flag setup and Ethereum is getting close to flag resistance, currently in the 3330 area. If that breaks up, that would fix a target at a retest of the late 2024 high at 4109.05, though unless someone can light an encouraging fire under Ethereum buyers I am doubtful about that delivering.

That said, a further break over the H&S right shoulder high at 3745.42 would invalidate the H&S and fix a second target at the retest of the 2024 high and, if seen, that would be more impressive, so we’ll see if that happens.

ETHUSD 60min chart:

In the short term I am really liking retests of the all time highs on Bitcoin and Solana. We’ll see how that goes.

On the bigger picture I am still leaning towards a retracement / consolidation on Crypto in the first half of 2025 and then strong new all time highs with a very possible bull market high pencilled in close to the end of the year. That scenario would be a good match with past Crypto bull markets.

If you’d like to see more of these posts and the other Crypto videos and information I post, please subscribe for free to my Crypto substack. I also do a premarket video every day on Crypto at 9.05am EST. If you’d like to see those I post the links every morning on my twitter, and the videos are posted shortly afterwards on my Youtube channel.

I'm also to be found at Arion Partners, though as a student rather than as a teacher. I've been charting Crypto for some years now, but am learning to trade and invest in them directly, and Arion Partners are my guide around a space that might reasonably be compared to the Wild West in one of their rougher years.


Tuesday, 28 January 2025

The DeepSeek Retracement

In my last post on Wednesday 22nd Jan, I was looking at the various targets for the move up from the January lows on the US equity indices, the all time high retest on SPX, which had just be reached, and the all time high retests on QQQ and DIA, which are still outstanding. I was also noting that a retracement to set up less vertiginously steep rising support trendlines on all three of these was overdue.

There was some weakness on Friday that fixed an hourly RSI 14 sell signal on SPX and that followed through into a big gap down on Monday morning. What I was saying in my premarket video yesterday morning was that little serious technical damage had been done and that the obvious next move was a resumption of the uptrend. I said much the same this morning but with expanded comments on the decline being mostly tech, and considering the larger implications of the DeepSeek news that delivered the big gap down on Monday.

So what are those implications? The core of the matter seems not to be that DeepSeek offers anything more capable than current AI, but that the $5.6m cost of the computing power for DeepSeek is a tiny fraction of what the current US tech leaders have spent developing their equivalent AI models.

There are some questions, notably that as DeepSeek is very much a chinese company, it is hard to verify that the stated costs and process are correct, but if they are correct then DeepSeek has delivered a massive improvement in the costs of developing AI, even if that AI adds nothing particularly to the current models. That of course calls into question hundreds of billions of planned spending developing newer and better AI models, and that is why Nvidia lost a record-breaking $588.8 billion in market capitalisation yesterday.

Given that half of US equity market gains last year are attributed to AI, that raises a big question over whether Monday morning’s retracement may follow through into a much larger retracement in the near future, and I think that’s very possible. That also fits with the lean I have been stating over the last few weeks that 2025 is likely to be a tougher year for equities than 2024 or 2023, and that I was expecting to see weakness during the first half of 2025.

In the short term though what I have been saying in my premarket videos this week remains true, as little real technical damage has so far been done, and there are still open upside targets that I am expecting to see hit. Unless we see some real technical damage done then the obvious next move is a resumption of the uptrend from the January lows.

Looking at the SPX daily chart you can see that the retracement yesterday was a solid backtest of the daily middle band. So far there is nothing inherently bearish about a backtest of main uptrend support. If that support should break on a daily close basis and then follow through to the downside, that would change.

SPX daily chart:

On QQQ, as you would expect, the retracement was sharpest, and QQQ broke back below the daily middle band. If SPX breaks that support too I would start taking a serious continuation downwards a lot more seriously.

There remains however a very nice looking bull flag that has broken up with a target at a retest of the all time high. That’s not the only possibility as I do have an option where the flag could expand into a triangle on the chart below, but that triangle support isn’t a lot lower.

QQQ 15min chart:

There is one big thing that has changed since my premarket video today and that is on DIA, where there was a target at a retest of the all time high that was still some distance away, and it is now close. The all time high is at 450.08 and the high so far today is at 449.74. That could be close enough for government work but I’m expecting to see a new all time high soon. At that point I will only have one big upside target outstanding, and that will be on QQQ.

I would also note that there is now a weak daily RSI 5 sell signal brewing on DIA as the existing weak RSI 14 buy signal is reaching target.

DIA daily chart:

On the DIA hourly chart a possible RSI 14 sell signal has also started brewing and on the 15min chart below you can see that there is a decent quality rising wedge option from the January lows that may have been overthrowing the highs today. With the double bottom target from the low having made the full target today, and the bull flag target at the retest of the all time high almost hit today, DIA no longer has any meaningful further upside targets. That doesn’t mean that it is topping out, but it is no longer supporting an overall bull case either.

DIA 15min chart:

IWM has been a tougher call from the January lows, with the rally from there having been so weak that the double top target in the 207-9 area is still looking very credible.

There is a decent bull flag setup on IWM too though, which is trying to break up, but until it breaks up with more force this could be a bearish overthrow before the bull flag breaks down, as they do about 30% of the time.

IWM 60min chart:

The setup here is less bullish than the one I was looking at before the open this morning, but until SPX breaks below the daily middle band I’m still leaning towards retests of the all time highs on SPX and probably QQQ. DeepSeek is casting a potentially very large shadow over Tech however and even if we do see those retests, the odds of a much larger retracement after that have increased considerably.

I’m still leaning towards a weak first half of 2025 and new all time highs later in the year, very possibly as a topping process for a much more significant high. One way or another I think we’ll be seeing lower soon and I’m not expecting this to be a good year for US equities. The last two years have been banner years for US equities. A third straight year of these kinds of gains looks like a big stretch. I could of course however be mistaken. :-)

If you like my analysis and would like to see more, please take a free subscription at my chartingthemarkets substack, where I publish these posts first. I also do a premarket video every day on equity indices, bonds, currencies, energies, precious commodities and other commodities at 8.45am EST. If you’d like to see those I post the links every morning on my twitter, and the videos are posted shortly afterwards on my Youtube channel.

Thursday, 23 January 2025

Crypto - So Now What?

In my last post on Friday I was saying that Bitcoin (BTCUSD) had just broken over the previous week’s high at 102.7k and, as I noted on Monday 13th Jan, that was the right shoulder high on the H&S that had broken down. The break up on Friday invalidated that H&S and that break fixed a target at the retest of the all time high at 108.4k.

That target at the retest of the all time high was reached quickly amid a wild weekend with the launch of Trump and Melania’s astonishingly popular memecoins, and that leaves a possible large double top setup on Bitcoin that I am not taking particularly seriously at this stage.

Bitcoin has been consolidating after the new all time high and that process does not look finished, with a daily RSI 5 sell signal having fixed overnight. These signals have a target at the 30 level on the RSI 5 and the six of the last seven of these on the chart below reached that target, with the other being a near miss. There is also an older open RSI 14 sell signal on this chart, and of the previous five on the chart below, three of those made the full target with two near misses.

All of those signals were during the current bull market and, while there is no certainty about any of these signals ever reaching target, the history of success is strong, and I’m expecting the current ones to make target or at least a near miss in due course.

BTCUSD daily chart:

In this context I was looking at a good quality H&S on Bitcoin this morning, in my premarket video, that broke down overnight with a target in the 92,000 area. I was saying that, as is usual with these patterns, there were two clear targets, either that Bitcoin would head down to the target, or that it would reject back up into a retest of the new all time high at 109.3k. I further noted that the most usual time for an H&S to break down and then fail would be just after the break down.

I also said that I was leaning towards rejection back into the highs despite the fixed daily RSI 5 sell signal and that the target to invalidate the H&S would be a break back up over the H&S right shoulder high at 107.3k. At the time of writing Bitcoin has since rallied to 106.9k, and is close to invalidating the H&S. On a break over the 107.3k high the target would be a retest of the all time high at 109.3k. Given the fixed daily RSI 14 and RSI 5 daily sell signals here though, a retest of the all time high on Bitcoin next may set up a small double top that may then deliver.

BTCUSD 15min chart:

Solana (SOLUSD) also reached the target at the retest of the all time high, then made the extended double bottom target at 279, and finally topped out at a new all time high 10% above the old one at 294.95. Again it has since been consolidating and I am also wondering about a possible ATH retest coming and perhaps then a test of the obvious trendline resistance on the chart below that is currently in the 300 area.

The first thing that was really interesting about the wild move to new highs last weekend though was actually about Trump’s new memecoin, as that is on the Solana blockchain and triggered a very large amount of transaction volume that Solana handled without any issues. I’ve mentioned before that transactions are easier, faster and cheaper on Solana than Ethereum (ETHUSD), and that raises questions about the popularity of Ethereum. More about that further down.

SOLUSD daily chart:

On the hourly chart Solana appears to be forming either a triangle or a bull flag. Either would likely deliver a retest of the high in due course. If so I would note that retest would currently set both possible daily RSI 14 and RSI 5 sell signals brewing.

SOLUSD 60min chart:

The second thing that was really interesting about the wild move to new highs last weekend though was Ethereum, which did relatively almost nothing, and at the time of writing has failed even to break back over the daily middle band.

A break over the right shoulder high at 3745.42 would invalidate the H&S and fix a target at the retest of the 2024 high at 4109.05, but Ethereum is currently a long way from managing that.

That’s an issue, as there is a decent H&S on Ethereum that formed and broke down with a target in the 2100, and that H&S has not come anywhere near being invalidated.

I’ve had a careful look at the Bitcoin chart versus Ethereum and Solana over the last few years and there have been no real sign to date of a Ethereum losing much ground to either, though it is so far the only one of the three to not make a new all time high in this bull market. That could be starting to change and I’ll be keeping an eye on that.

ETHUSD daily chart:

On the hourly chart Ethereum may be bullishly consolidating here and there is a clear path higher, even if Ethereum has so far seemed uninterested in taking it.

There remains a decent quality possible bull flag setup on Ethereum and a break over flag resistance, currently in the 3450 area, would again fix a target at the retest of the 2024 high at 4109.05. A further break over the H&S right shoulder high at 3745.42 would invalidate the H&S and fix a second target at the retest of the 2024 high.

ETHUSD 60min chart:

On the bigger picture I am still leaning towards a retracement / consolidation on Crypto in the first half of 2025 and then strong new all time highs with a very possible bull market high pencilled in close to the end of the year. That scenario would be a good match with past Crypto bull markets.

If you’d like to see more of these posts and the other Crypto videos and information I post, please subscribe for free to my Crypto substack.

I do a premarket video every day on Crypto at 9.15am EST. If you’d like to see those I post the links every morning on my twitter, and the videos are posted shortly afterwards on my Youtube channel.

I'm also to be found at Arion Partners, though as a student rather than as a teacher. I've been charting Crypto for some years now, but am learning to trade and invest in them directly, and Arion Partners are my guide around a space that might reasonably be compared to the Wild West in one of their rougher years.


Wednesday, 22 January 2025

Buffing My Fingernails Modestly

SPX retested the all time high today, and so the first, though not the only, upside target of the upside scenario that I laid out at the start of next week has been reached.

In my post on Monday 13th Jan I was stating that SPX was at the bottom of the big inflection point that has been forming, and that we were likely to see either a serious break down or a rejection back into the highs, showing the possible bull flag setups on SPX, QQQ, DIA and IWM.

In my post on Wednesday 15th Jan I was looking at the rally from Monday’s low, with the bullish reversal patterns forming on SPX, QQQ and DIA that would likely take them higher, and on SPX should open the test of the main resistance level at the daily middle band That would then need to be broken and converted to support to open the retest of the all time high.

In my last post on Thursday 16th Jan I was looking at the test of the daily middle band on SPX and noting again that this needed to break and be established as support and, if done, that would open the retest of the all time high that we saw today.

That all went well and it has really been a very nice rally from the lows into this new all time high today. So what now?

I was suggesting at the lows that these high retests might be part of an overall topping pattern, but there’s little sign of that so far. We should see a retracement soon, as the rising support trendline on SPX is unsustainably steep, but it is only at that retracement that we should establish a support trendline that might be of a larger pattern that might then suggest reversal.

At this stage this move does not look in any way cooked, and the setup is suggesting strongly that SPX has higher to go. Any significant retracement here is likely to be a buy.

SPX 15min chart:

That’s just as well on QQQ, where the good quality bull flag setup I was looking at last week broke up with a similar target at a retest of the all time high. The rising support trendline is also very steep, and we might see a retracement on the way, but that all time high retest is now close and we’ll likely see that soon.

QQQ 15min chart:

DIA had another good quality bull flag setup and a possible decent looking double bottom setup that has broken up with targets in the 446-9 range. That would put DIA within easy range of the all time high and that is of course the target of the bull flag that broke up. I’m am also thinking DIA should make a new all time high.

DIA 15min chart:

IWM is a tougher call. There is a decent bull flag setup on IWM too, which has a promising bearish underthrow but is only now testing bull flag wedge resistance. A strong break up would again look for a retest of the all time high but obviously IWM has been a bit slower off the low and is the only one of the four that has not yet broken this key resistance level.

I’m leaning towards this breaking up too, but I would note that this wouldn’t be a bad time to see some retracement before IWM does that.

IWM 60min chart:

On the SPX daily chart there is now obviously a possible double top setup which at this stage I am noting but consider a low probability pattern. SPX is on a daily upper band ride and the bands are now expanding which will give more range to the upside.

No current negative RSI divergence and I’m seeing this as a setup where bears should just step aside until this move runs out of steam, and there is currently little sign of that happening.

SPX daily chart:

Overall this move up has gone well and likely will go significantly higher from here. There is a decent chance that we will see new all time highs on all of SPX, QQQ, DIA and IWM. I’ll be watching for signs that we might see a strong reversal but, so far at least, I’m not seeing anything to suggest that here.

I’m leaning towards a weak first half of 2025 and new all time highs later in the year, very possibly as a topping process for a much more significant high. One way or another I think we’ll be seeing lower soon and I’m not expecting this to be a good year for US equities. The last two years have been banner years for US equities. A third straight year of these kinds of gains looks like a big stretch. I could of course however be mistaken. :-)

If you like my analysis and would like to see more, please take a free subscription at my chartingthemarkets substack, where I publish these posts first.

I also do a premarket video every day on equity indices, bonds, currencies, energies, precious commodities and other commodities at 8.45am EST. If you’d like to see those I post the links every morning on my twitter, and the videos are posted shortly afterwards on my Youtube channel.

Friday, 17 January 2025

Bitcoin Breaking Key Resistance

In my last post on Monday I was looking at the bull and bear scenarios on the big three coins that I cover, with particular focus on the strongest setup on Bitcoin (BTCUSD). I was also noting the similar setup on equity indices at the same inflection point, which is important as both Crypto and equity indices have tended to be significantly correlated in the past, and there is no current sign that is different here.

Since then both Crypto and equity indices have rallied strongly and are both reached yesterday the verge of a final break up that would look for retests of many of their all time highs.

In the last hour Bitcoin has now broken over last week’s high at 102.7k and, as I was explaining on Monday, that is the right shoulder high on the H&S that had broken down. The break up has invalidated that H&S and fixed a target at the retest of the all time high at 108.4k.

That ATH retest isn’t the only possible option here of course. This could potentially be wave B of an ABC bullish consolidation and we could therefore see a lower low before (most likely) that high retest, but my lean is that Bitcoin is likely to head to the ATH retest directly.

BTCUSD daily chart:

On the hourly chart Monday’s possible double bottom has now played out to the extended target and the fixed hourly RSI 14 sell signal is warning of a possible retracement in the short term.

BTCUSD 60min chart:

On Solana (SOLUSD) a good quality double top had broken down with a target in the 145 area. The bull scenario was a break over possible bull flag wedge resistance and that has broken up over the last day. Double tops don’t have fail levels like H&S patterns but, in the overall context, I am assuming that the double top has failed as this bull flag has broken up with a target at a retest of the all time high at 264.52, and would note that there is a larger possible double bottom here with resistance at 223.16. A sustained break over 223.16 would fix another target at a retest of the all time high.

SOLUSD daily chart:

On the hourly chart I would note that there is also a possible hourly RSI 14 sell signal is brewing, and that we may see a retracement or consolidation in the near future.

SOLUSD 60min chart:

Ethereum (ETHUSD) has been slower off the lows, which isn’t unusual. An IHS on Ethereum had broken down with a target in the 2100 area and a break over the right shoulder high at 3745.42 would invalidate the H&S and fix a target at the retest of the 2024 high at 4109.05.

Ethereum is still breaking back over the daily middle band, but looking at Bitcoin and Solana, Ethereum will likely break up as well.

ETHUSD daily chart:

On the hourly chart I have drawn in a decent quality possible bull flag setup on Ethereum and a break over flag resistance, currently in the 3555 area, would again fix a target at the retest of the 2024 high at 4109.05.

ETHUSD 60min chart:

Altogether I am very much liking the odds of new all time highs on Bitcoin and Solana, and a new high over the 2024 high high on Ethereum. The bull setup on equity indices also looks very promising so we’ll see how that goes.

On the bigger picture I am leaning towards a retracement / consolidation on Crypto in the first half of 2025 and then strong new all time highs with a very possible bull market high pencilled in close to the end of the year. That scenario would be a good match with past Crypto bull markets. Everyone have a great weekend. :-)

If you’d like to see more of these posts and the other Crypto videos and information I post, please subscribe for free to my Crypto substack.

I do a premarket video every day on Crypto at 9.15am EST. If you’d like to see those I post the links every morning on my twitter, and the videos are posted shortly afterwards on my Youtube channel.

I'm also to be found at Arion Partners, though as a student rather than as a teacher. I've been charting Crypto for some years now, but am learning to trade and invest in them directly, and Arion Partners are my guide around a space that might reasonably be compared to the Wild West in one of their rougher years.


Thursday, 16 January 2025

The Obvious Point of Failure

In my last post yesterday I was looking at the big inflection points in the current rally on US equity indices that could take SPX and QQQ, and perhaps also DIA and IWM, to retests of their late 2024 all time highs.

The first inflection point in this process was at the Monday’s lows and key support, and they rallied there.

The second inflection point was after the initial rallies, and they pushed through to the upside there.

The third inflection point we reached this morning, and if we are to see this move fail hard, then this is the most likely remaining place to see that. Equally, if bulls push through this, on SPX there is a clear path to the all time high retest and that would likely be made.

In my premarket video this morning I was looking at the setup here but I wanted to do a post as well because these posts are a nice little example series examining in detail how a reversal like this works.

The good quality IHS that I was looking at yesterday on SPX broke up and has come very close to target. Hourly RSI 14 and RSI 5 sell signals were brewing at the close yesterday and fixed this morning, with the RSI 5 sell signal having now also made target this morning. A retracement or consolidation was likely and is now in progress.

On the bull scenario this is a bullish consolidation acting as a springboard to higher highs. On the bear scenario this is the start of a hard fail before lower lows.

SPX 15min chart:

The good quality IHS that I was looking at yesterday on QQQ broke up and has come very close to target. Hourly RSI 14 and RSI 5 sell signals were brewing at the close yesterday and fixed this morning, with the RSI 5 sell signal having now also made target this morning. A retracement or consolidation was likely and is now in progress. So far this is almost identical to SPX.

On the bigger picture QQQ is testing the daily middle band, but the key resistance as I noted yesterday is the bull flag resistance now in the 522.25 area. A sustained break over that level fixes a target at a retest of the all time high.

QQQ 15min chart:

The moderate quality IHS that I was looking at yesterday on DIA broke up and has reached target. Hourly RSI 14 and RSI 5 sell signals were brewing at the close yesterday and fixed this morning, with the RSI 5 sell signal having now also made target this morning. A retracement or consolidation was likely and is now in progress. So far this is similar to SPX. I’m noting that these three indices are moving strongly in sync here as that strengthens the setup here.

On the bigger picture DIA broke back hard over the daily middle band and has come close to the key resistance level I was looking at at 433.67. This is possible asymmetric double bottom resistance and a sustained break above would look for a target range 446-9, putting DIA within striking distance of the all time high retest at 450.25.

DIA 15min chart:

On the SPX hourly chart the weak RSI 14 buy signal I was looking at yesterday has made the possible near miss target and that could be it. An RSI 5 sell signal fixed this morning.

Beyond key resistance at the daily middle band the other, less important but still significant, levels on the SPX to be broken to clear the way to a retest of the all time high are possible bull flag resistance, currently in the 5990 area, and the H&S right shoulder high at 6049.75. Breaks above those each would individually fix a target at a retest of the all time high. They are less significant as if SPX can convert the daily middle band to support, then both of the others will likely break in turn after that.

SPX 60min chart:

The resistance level I have been watching with most interest in the SPX daily middle band. SPX failed there on the last two rallies and it is this level that really needs to be broken and converted to support to open the all time high retest.

If you look at the last two rallies that failed at the daily middle band you can see that the first of those, in late December to 6049.75, broke back above the middle band, retraced to backtest and close on it the next day, then failed hard. That’s normal as a break over (or under) the middle band that fails will generally do so the next day or (a bit less often) the day after that. The second rally in early January to 6021.04 only broke over the daily middle band intraday and failed to close above either day. The current instance is more like the first rally. A fail at the daily middle band like this will usually open a move back to the daily lower band, currently at 5796 and not a good place to return to for bulls here.

The challenge for the bulls at this obvious potential point of failure is to keep this retracement relatively modest and in the form of a bullish consolidation. The 15min RSI 14 sell signals would ideally reached their target by early afternoon and SPX would ideally close again today above the daily middle band, currently at 5927.27 and still declining, and then hold it again tomorrow. If we see that then the odds of a retest of the all time high are good in my view.

SPX daily chart:

I’m leaning towards a weak first half of 2025 and new all time highs later in the year, very possibly as a topping process for a much more significant high. Whichever way this breaks would be fine for that scenario. One way or another I think we’ll be seeing lower soon and I’m not expecting this to be a good year for US equities. The last two years have been banner years for US equities. A third straight year of these kinds of gains looks like a big stretch.

If you like my analysis and would like to see more, please take a free subscription at my chartingthemarkets substack, where I publish these posts first.

I also do a premarket video every day on equity indices, bonds, currencies, energies, precious commodities and other commodities at 8.45am EST. If you’d like to see those I post the links every morning on my twitter, and the videos are posted shortly afterwards on my Youtube channel.

Teaching Moment - Walls of Worry

(First published a day ago on Substack and www.slopeofhope.com)

In my last post on Monday I was looking at the big inflection point that has formed over recent week on US equity indices, which were then testing key support. I was liking the positive divergence forming on the index futures and those turned into hourly buy signals and played out during the day delivering significant rallies.

This was encouraging for bulls as, first and foremost, the US indices didn’t break down hard into the bear scenario looking considerably lower and, secondly, that a path has been forming that could take US indices back into the high retests that I was talking about as the obvious targets for the bull scenario.

One of my favorite lines from the Matrix, a film with many well-crafted and memorable lines, is where Morpheus says that there is a difference between knowing the path, and walking the path. That is an important distinction for TA where a path often becomes obvious to the analyst but then it is prices that then need to actually follow that path to get to the destination, and reaching that destination is always a matter of relative probabilities rather than certainties, to the surprise of many a novice trader or aspiring amateur analyst.

I have said many times in past years that, as I see it, the key job of the analyst is to identify the higher probability paths that prices might take, and the higher probability inflection points where price may take another path. There is never any certainty and any setup, however well formed and compelling, can fail. The current setup is a good example of that, so this post is using that setup as a teaching moment to show how price works in uptrends and downtrends.

Now in this instance there are two obvious significant inflection points on the way to retests of the all time highs on all of SPX, QQQ and DIA. The first is the follow-through from the initial rally, taking the US indices to main resistance, which the case of SPX is the daily middle band. The second is the break and conversion of those main resistance levels to support, opening the path to the retests of the all time highs. At either of these we could see a hard fail back to the lows tested yesterday and once again be knocking on the door to the downside. That door is not necessarily going to then open, but as a friend remarked to me many years ago, the more often such doors are knocked upon, the more likely they are to open.

In my premarket video yesterday morning I was noting that the hourly buy signals that fixed yesterday had now all played out, and was looking at the options for another leg up. I was examining IHS patterns forming on the futures charts, and have since then been watching those on the RTH index charts today. If we are going to see the all time highs on SPX, QQQ and maybe DIA retested, then these are a promising start.

The obvious IHS patterns forming on the chart are, in order of descending quality, on SPX, QQQ and DIA.

SPX has been forming a good quality IHS at this candidate low which I am particularly happy to see as when an H&S pattern fails, as the much larger H&S will need to if the all time high is to be retested, then you will often see an H&S formed facing in the opposite direction. This possible IHS is all within the blue box on the right of the chart.

On a break up from the IHS neckline in the 5877 area, and follow through after that of course, the IHS target would be in the 5975-80 area, and with the daily middle band currently at 5938 and declining, making that target would deliver a break up through that key resistance level. A conversion of that level to support and follow through would then open the all time high retest at 6099.97.

SPX 15min chart:

On the QQQ chart there was no large H&S that broke down, just an encouraging bull flag falling wedge that is 70% bullish. The low yesterday was a break below that flag wedge support which is a bullish underthrow signalling that a break higher is close, as long as price doesn’t invalidate that by following through to the downside and triggering the 30% downside scenario target I looked at yesterday.

On a break through this IHS neckline in the 509-10 area the IHS target would be in the 520 area, slightly short of flag wedge resistance, currently in the 523.5 area, but over the daily middle band, currently at 519. On this chart I see the flag resistance as the key level and location of the next inflection point, and a sustained break through that opens a retest of the all time high at 538.28 as the obvious next target.

QQQ 15min chart:

On DIA there is another bull flag falling wedge, not quite as nice as QQQ and with no bullish underthrow, but with flag resistance far closer. This is my lowest quality IHS mainly because the IHS neckline is so steep, but it is still decent and, unlike the others, it has already broken up. A follow though to the upside would take DIA through flag wedge resistance in the 425.8 area, just under the daily middle band currently in the 427.85 area, towards the IHS target at 433.5.

DIA came down longer and further than SPX and QQQ, and while there are still two obvious inflection points on this chart, the second is at a second bullish reversal pattern, the possible double bottom resistance or part formed IHS neckline at 431.12. A sustained break up through that would look for a target in the 441-5 range.

441-5 would put DIA within reach of the all time high at 450.25, with an ok quality bull flag target at that retest, but the larger overall distance to be travelled makes it more of a reach than on SPX or QQQ.

DIA 15min chart:

How are divergences looking? Well I was noting on Monday that there were possible hourly buy signals brewing on both RSI 14 and RSI 5. Both fixed, the RSI 5 buy signal made target yesterday and the weak RSI 14 buy signal is still part way there. Not a strong indication but encouraging. On QQQ there is a possible weak hourly RSI 14 buy signal brewing but not yet fixed. On DIA there is a possible weak daily RSI 14 buy signal brewing and on IWM there are both daily RSI 5 and (weak) RSI 14 buy signals fixed.

I would see this background as encouraging but thin, on a pattern setup that favors the bulls overall but not hugely so. This reversal is very vulnerable to a hard fail and is worth treating with caution.

SPX 60min chart:

The resistance level I am watching with most interest in the SPX daily middle band. SPX has failed there on the last two rallies and it is this level that needs to be broken and converted to support to open the all time high retest.

SPX daily chart:

If we are going to see this setup fail back into a retest of Monday’s lows, I’d expect to see that tomorrow at the latest, but more likely today.

I’m leaning towards a weak first half of 2025 and new all time highs later in the year, very possibly as a topping process for a much more significant high. Whichever way this breaks would be fine for that scenario. One way or another I think we’ll be seeing lower soon and I’m not expecting this to be a good year for US equities. The last two years have been banner years for US equities. A third straight year of these kinds of gains looks like a big stretch.

If you like my analysis and would like to see more, please take a free subscription at my chartingthemarkets substack, where I publish these posts first.

I also do a premarket video every day on equity indices, bonds, currencies, energies, precious commodities and other commodities at 8.45am EST. If you’d like to see those I post the links every morning on my twitter, and the videos are posted shortly afterwards on my Youtube channel.