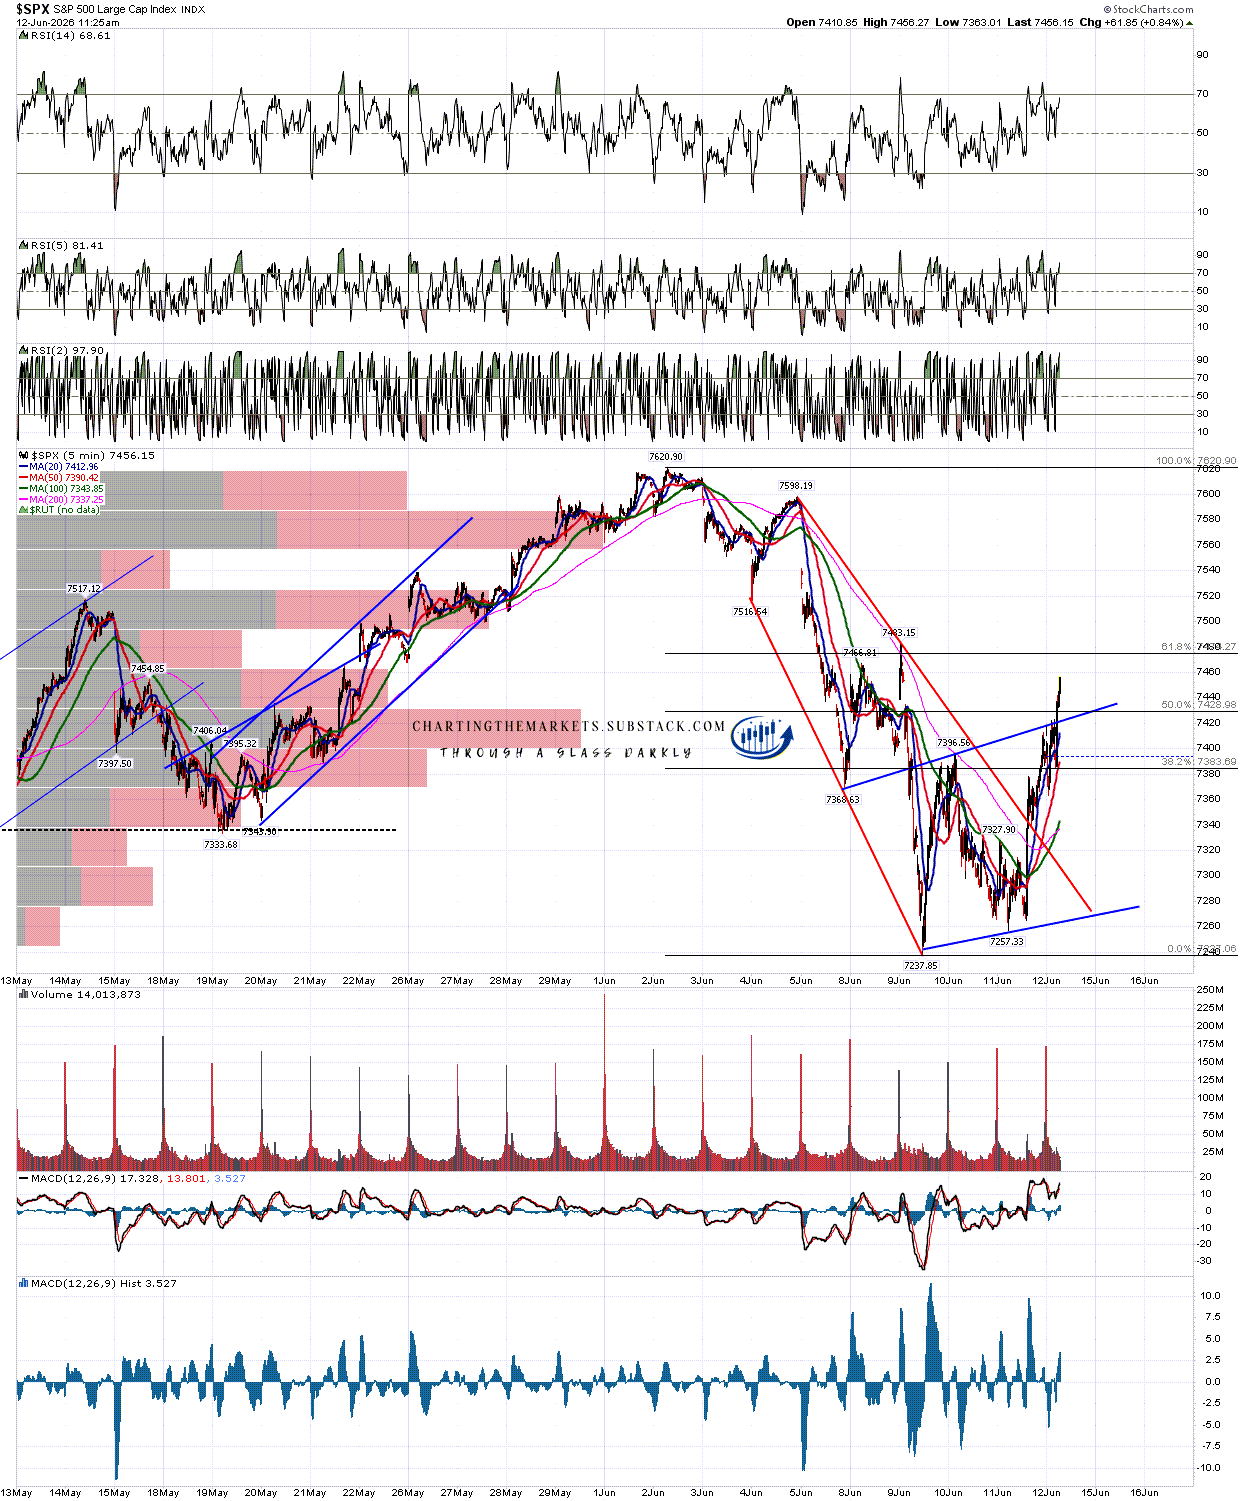
In my post on 20th May I was looking at the four high quality topping patterns forming on SPX, QQQ, DIA and IWM. As is often the case these didn’t deliver and the indices rejected back into higher highs. We are now looking at a new candidate high forming here but for a number of reasons these highs tend to take a while to form. This one does not look ready yet for much more downside unless there is some really bad news today.
I watch the historical stats for each day carefully as they often deliver, and last week and this week have been unusual for two reasons. Firstly every day has had a significant bullish or bearish lean, which is rare, as the majority of trading days in any year lean neutral. Secondly, the historical lean towards a red or green close has delivered every day since the start of last week, and I’m thinking the odds are decent that will continue to be the case into the end of this week.
On Friday I was talking about this in my premarket video, and was talking about the possibility that we would see a trend down day, which delivered and gave us a strong signal that another possible topping process might have started. So far this week the lean was bullish on Monday and bearish yesterday, which both delivered and the H&S patterns that had formed on SPX, QQQ and DIA all broke down towards lower targets.
I don’t think that any of those H&S patterns are likely to reach their targets, and I’ll explain why that is, but first let’s have a look at those patterns. I would note first that whenever an H&S breaks down there are in effect two targets. One of these two targets is highly likely (over 85%) to be reached. The first target is the H&S downside target, and the second is the fail target in the event that the trading instrument breaks back over the right shoulder high, in which case the target is the retest of the prior high at the top of the head, which in this case would be a retest of the all time highs on SPX, QQQ and DIA.
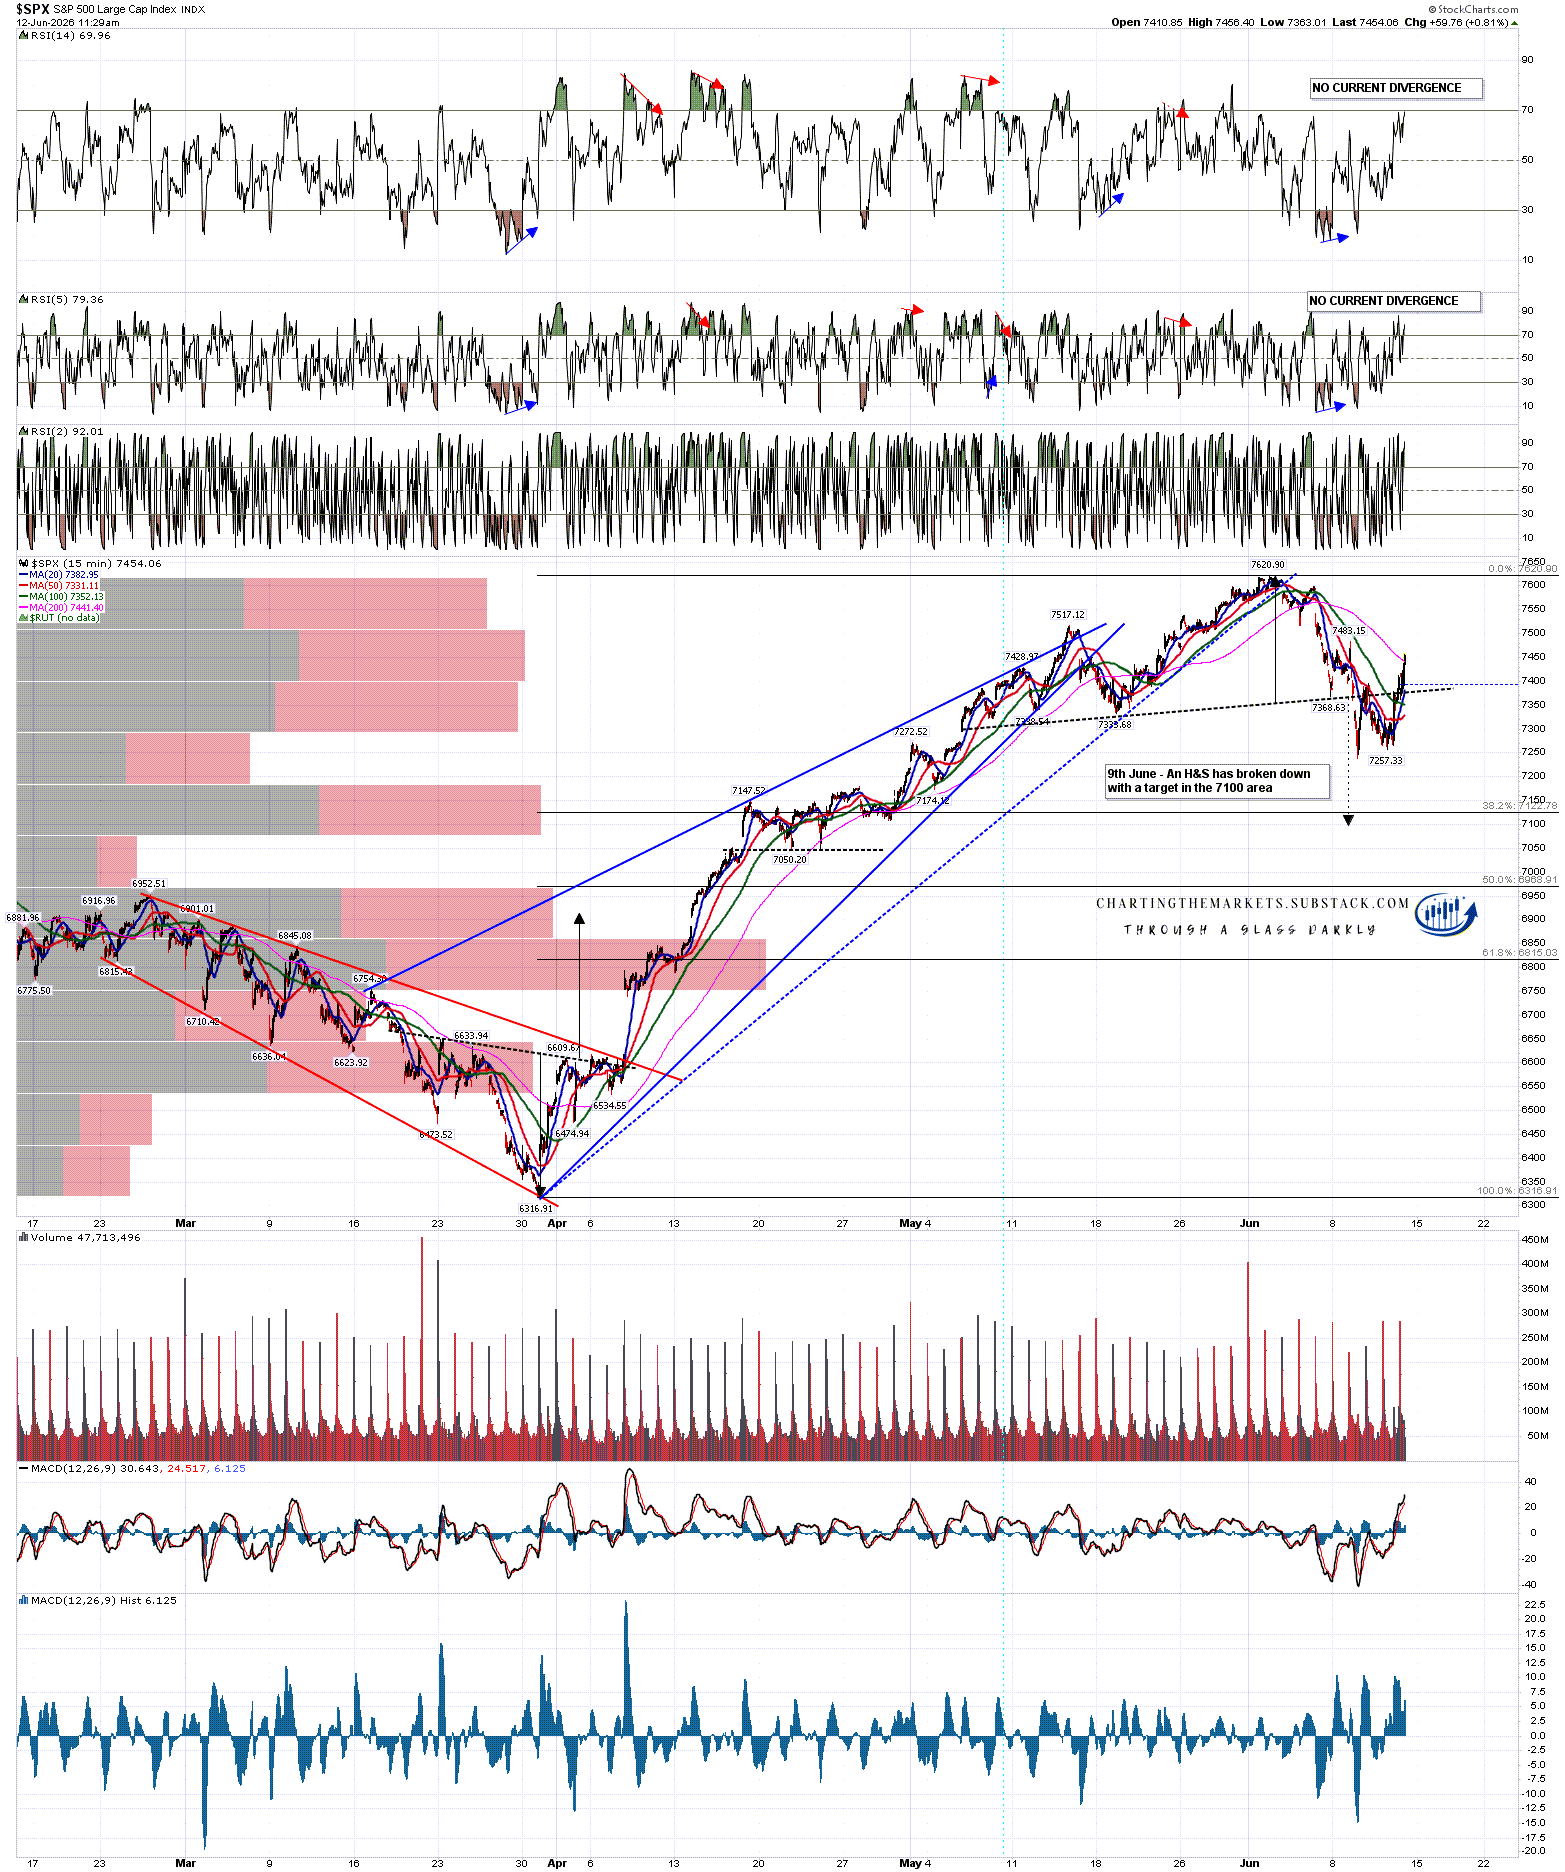
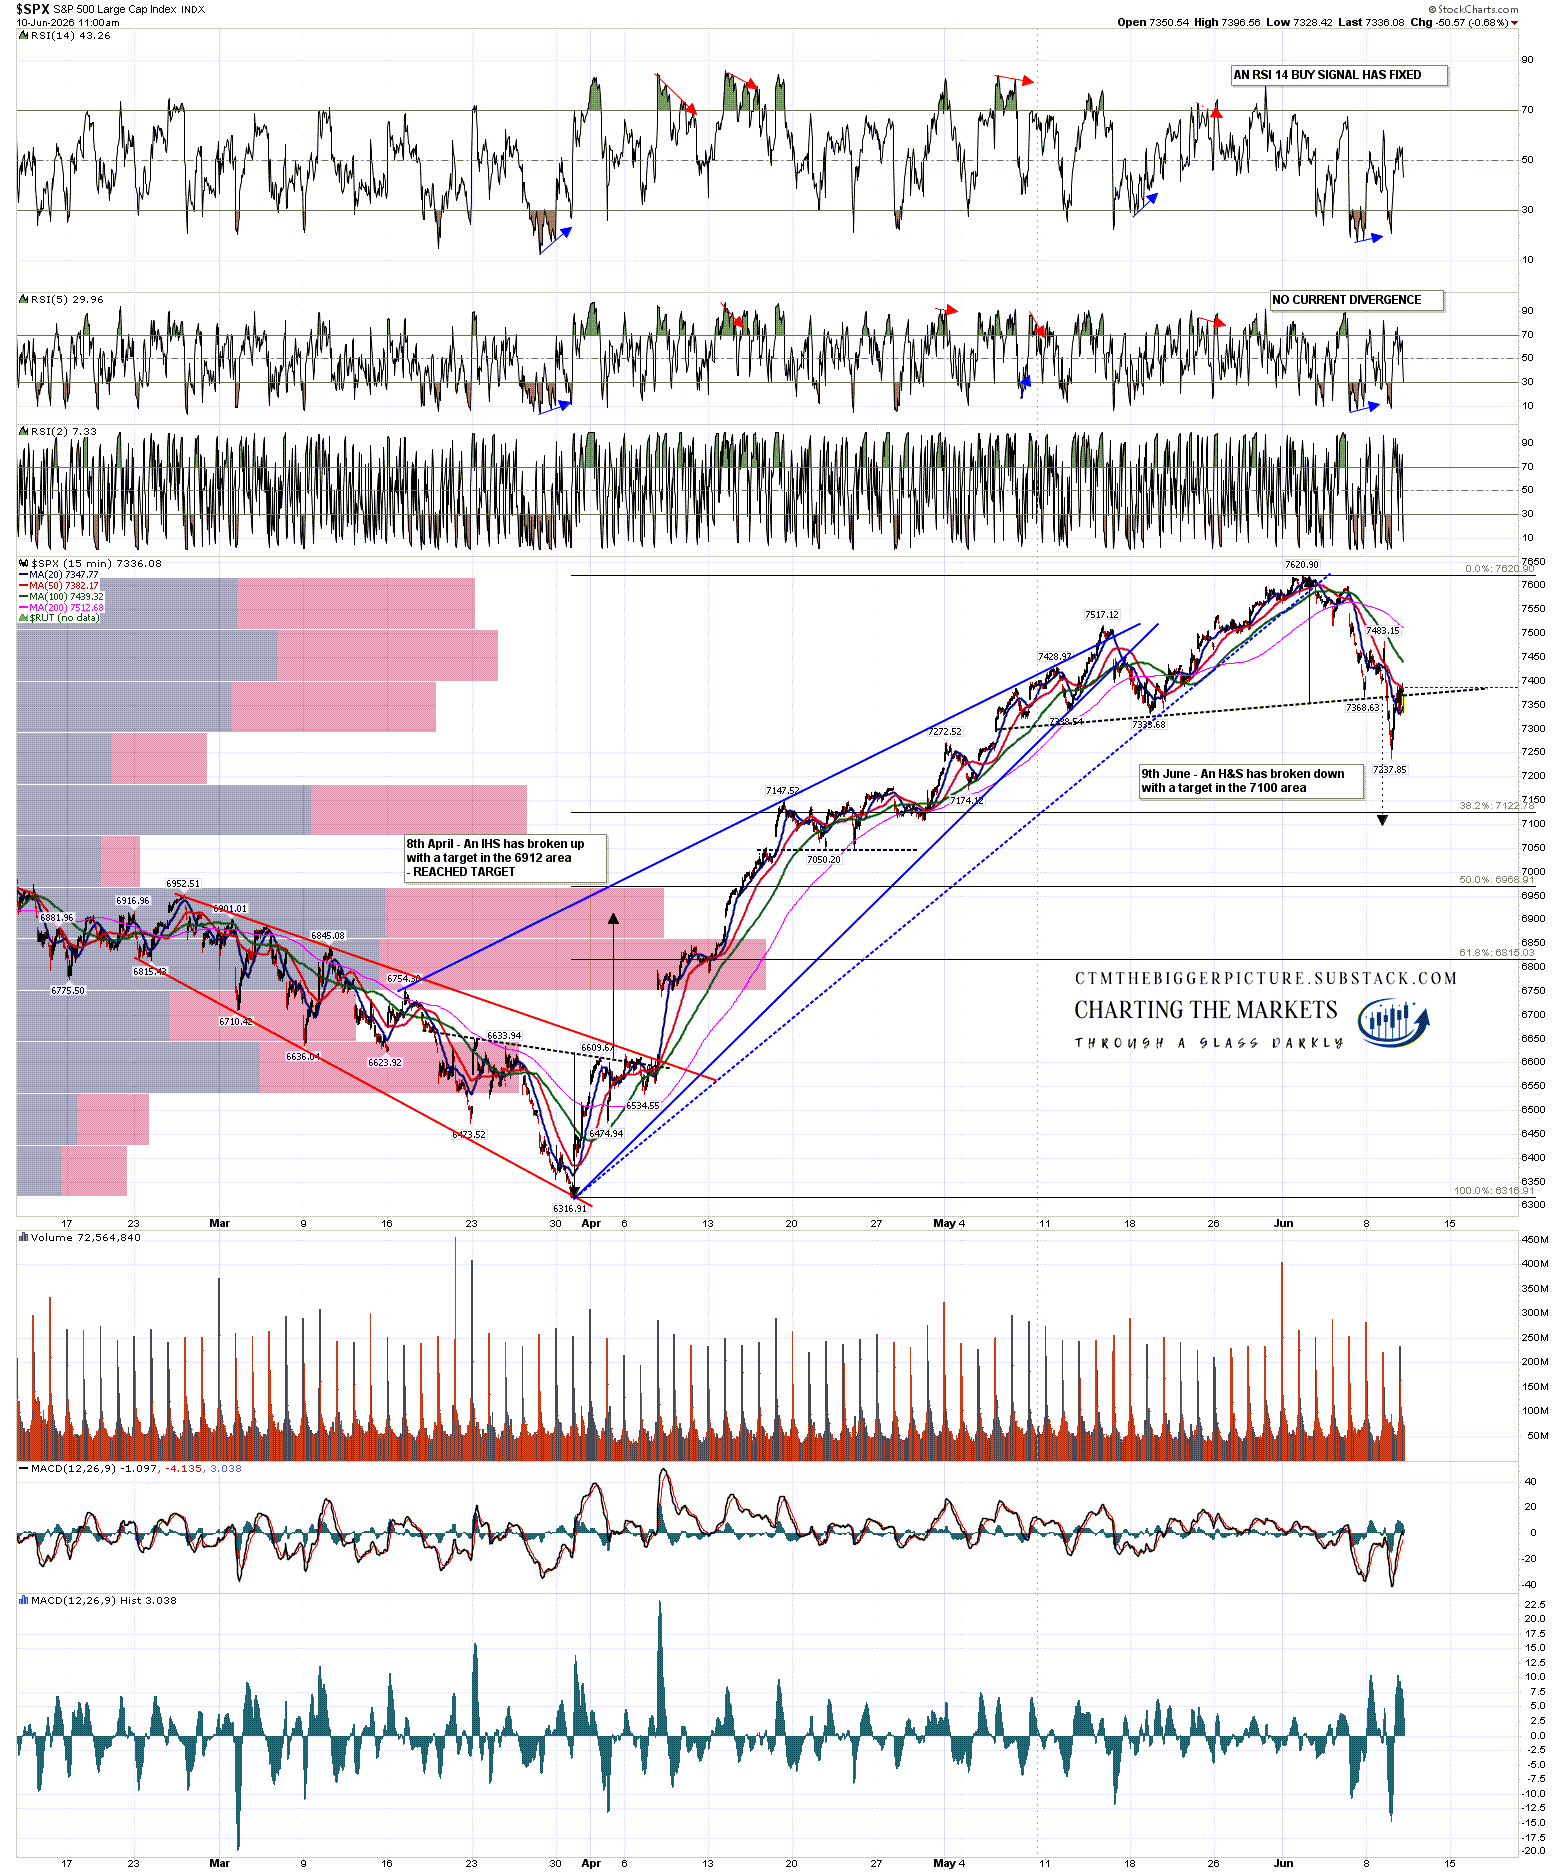
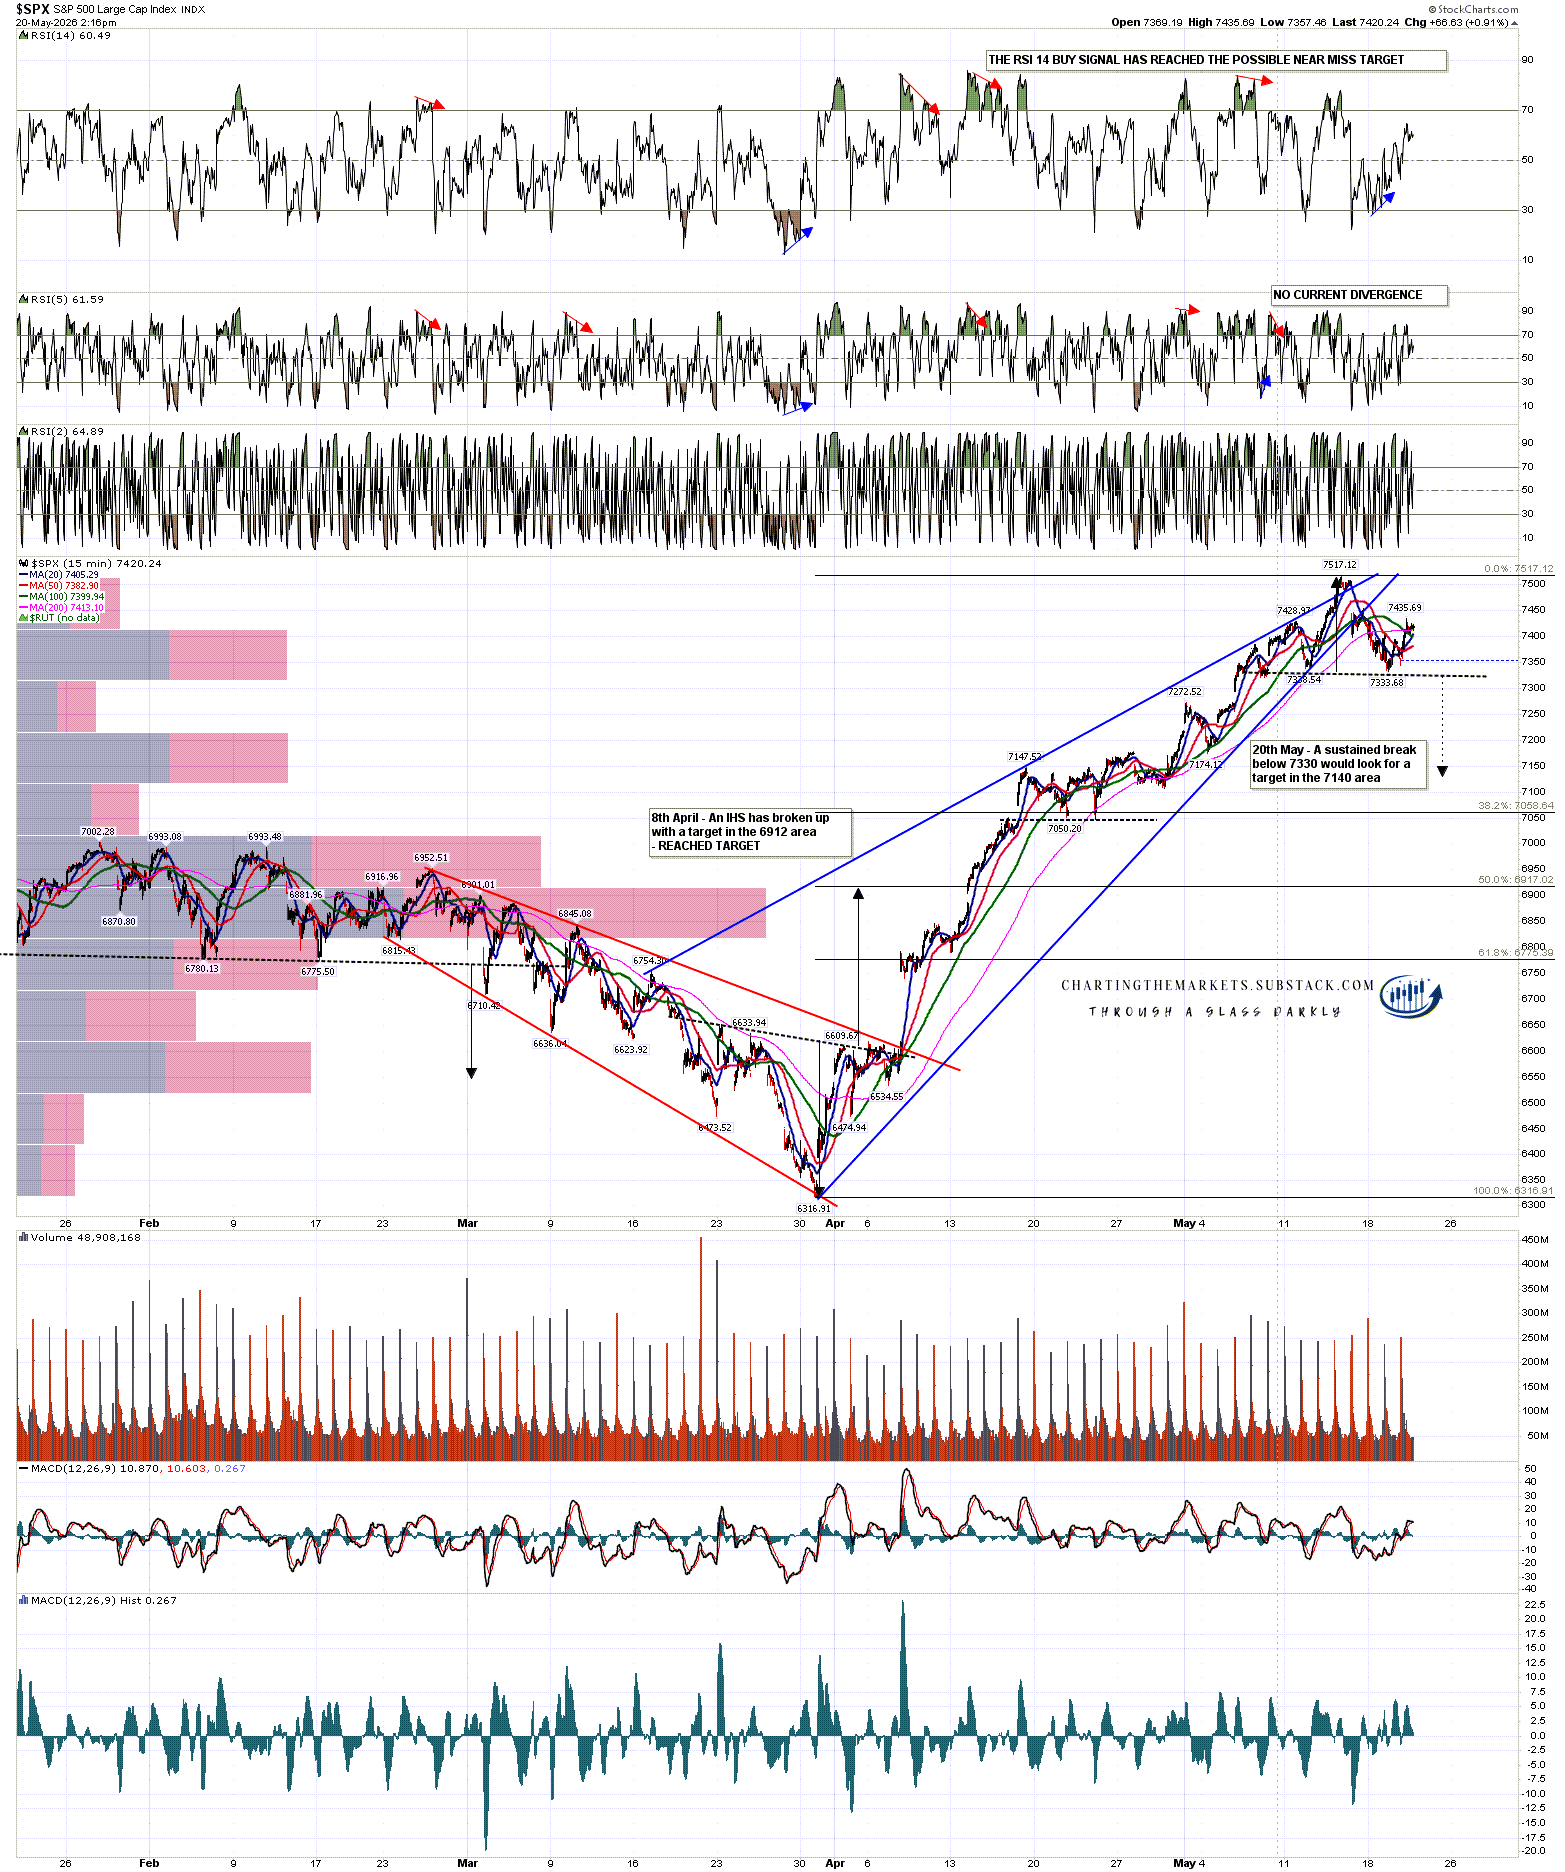
On SPX a decent quality H&S broke down with a target in the 7100 area. The H&S would fail on a move back over the right shoulder high at 7483.15.
SPX 15min chart:
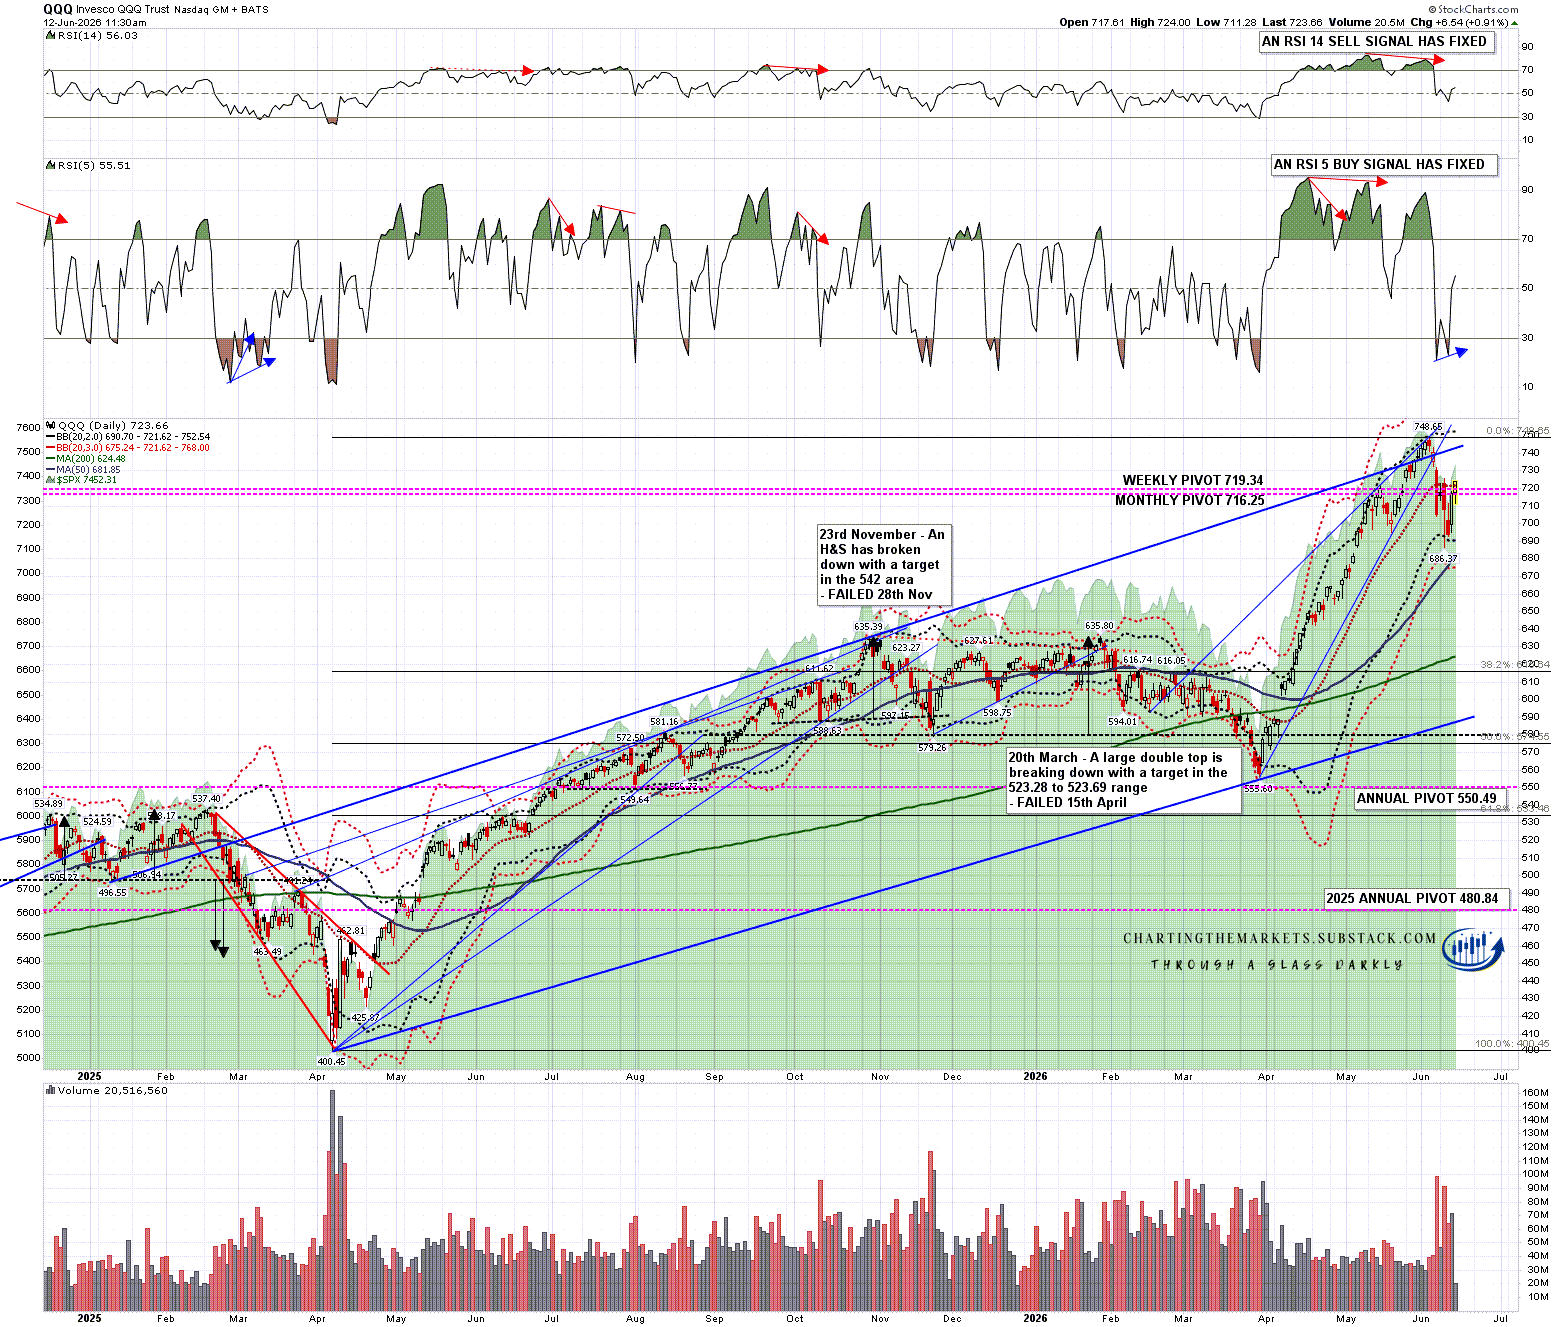
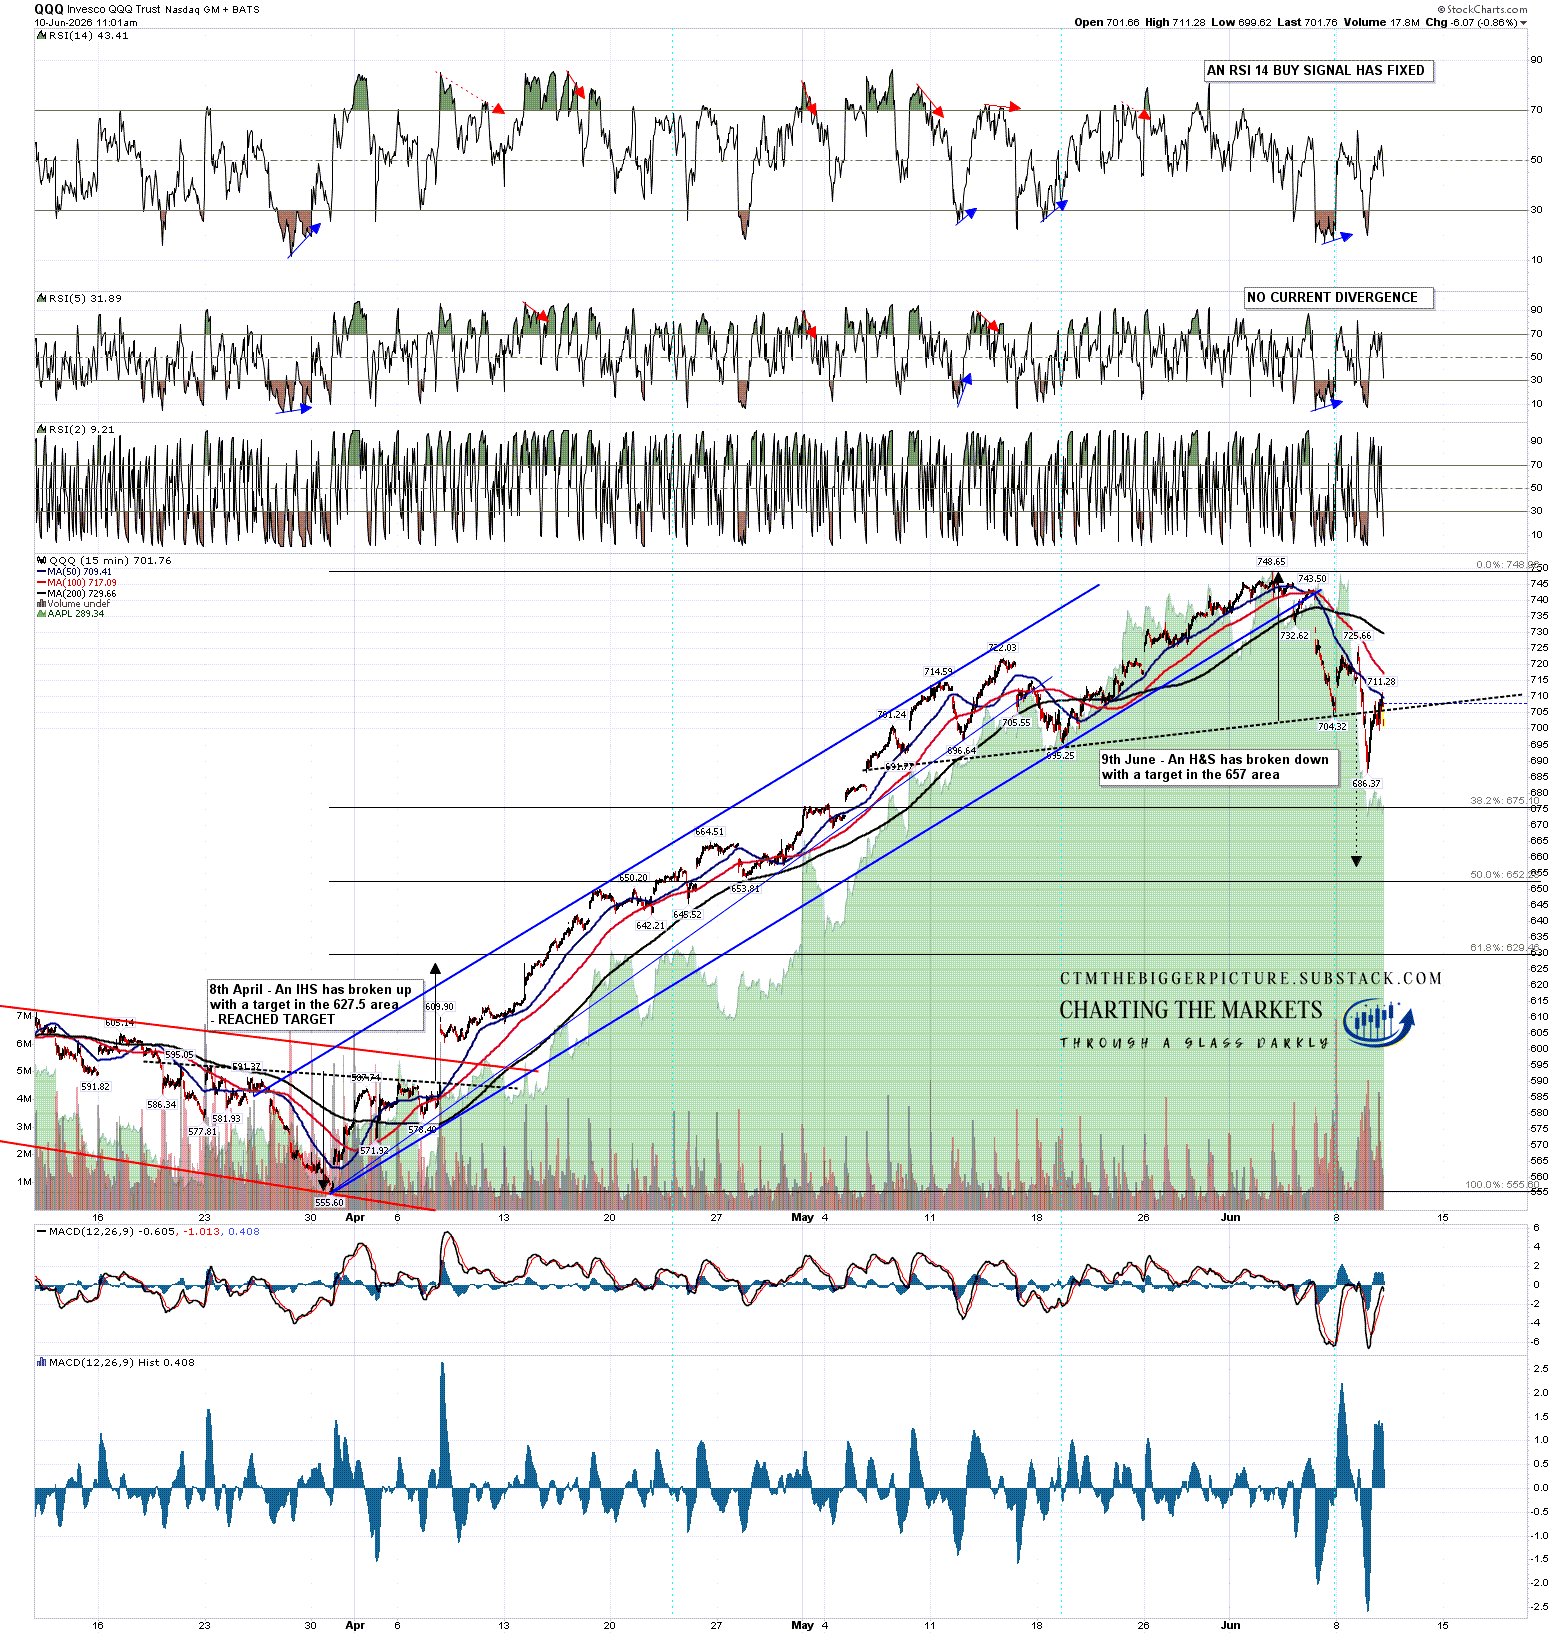
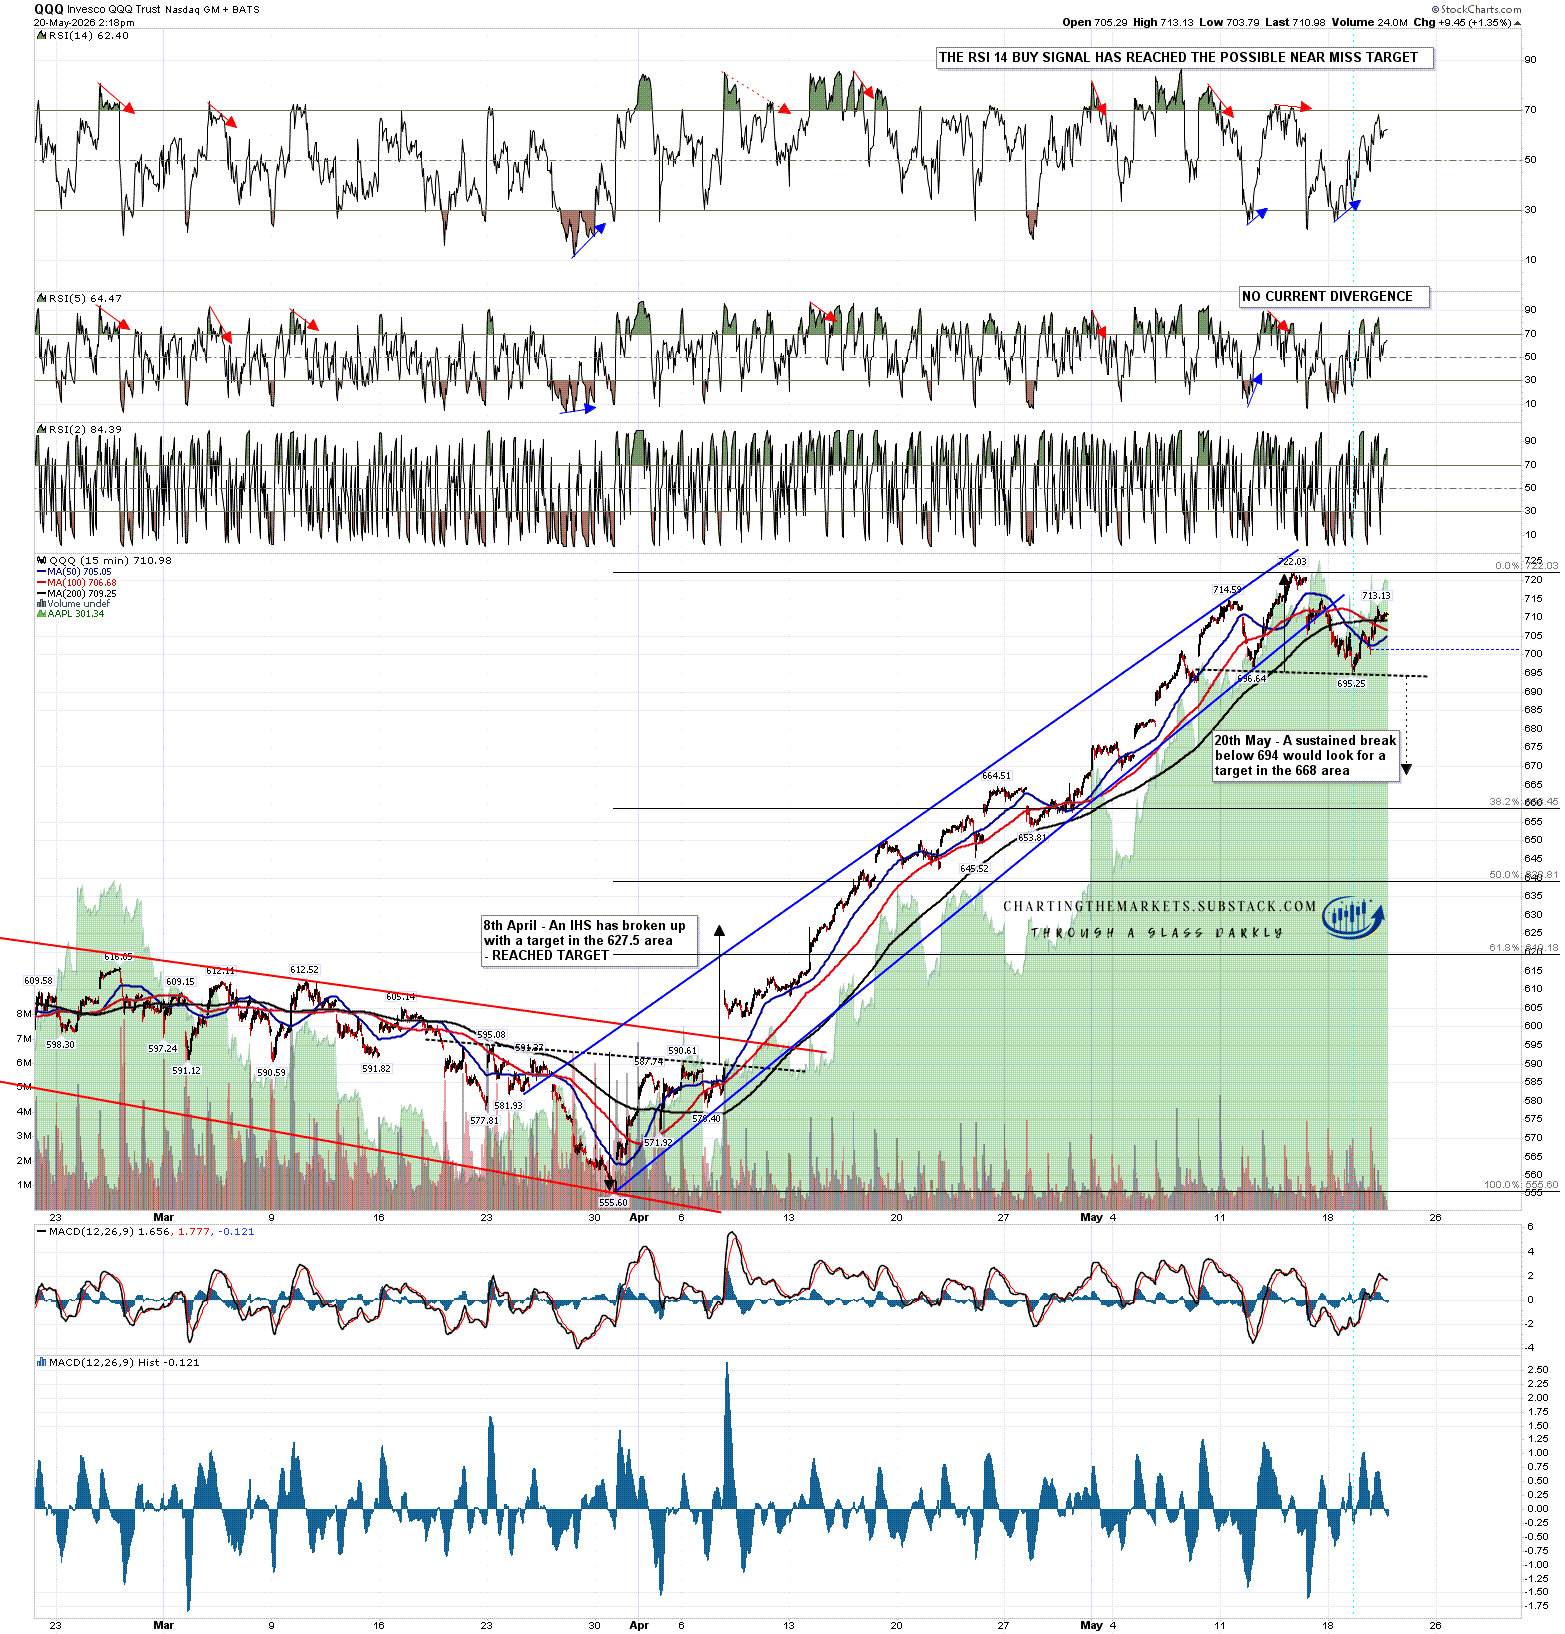
On QQQ a decent quality H&S broke down with a target in the 657 area. The H&S would fail on a move back over the right shoulder high at 725.66.
QQQ 15min chart:
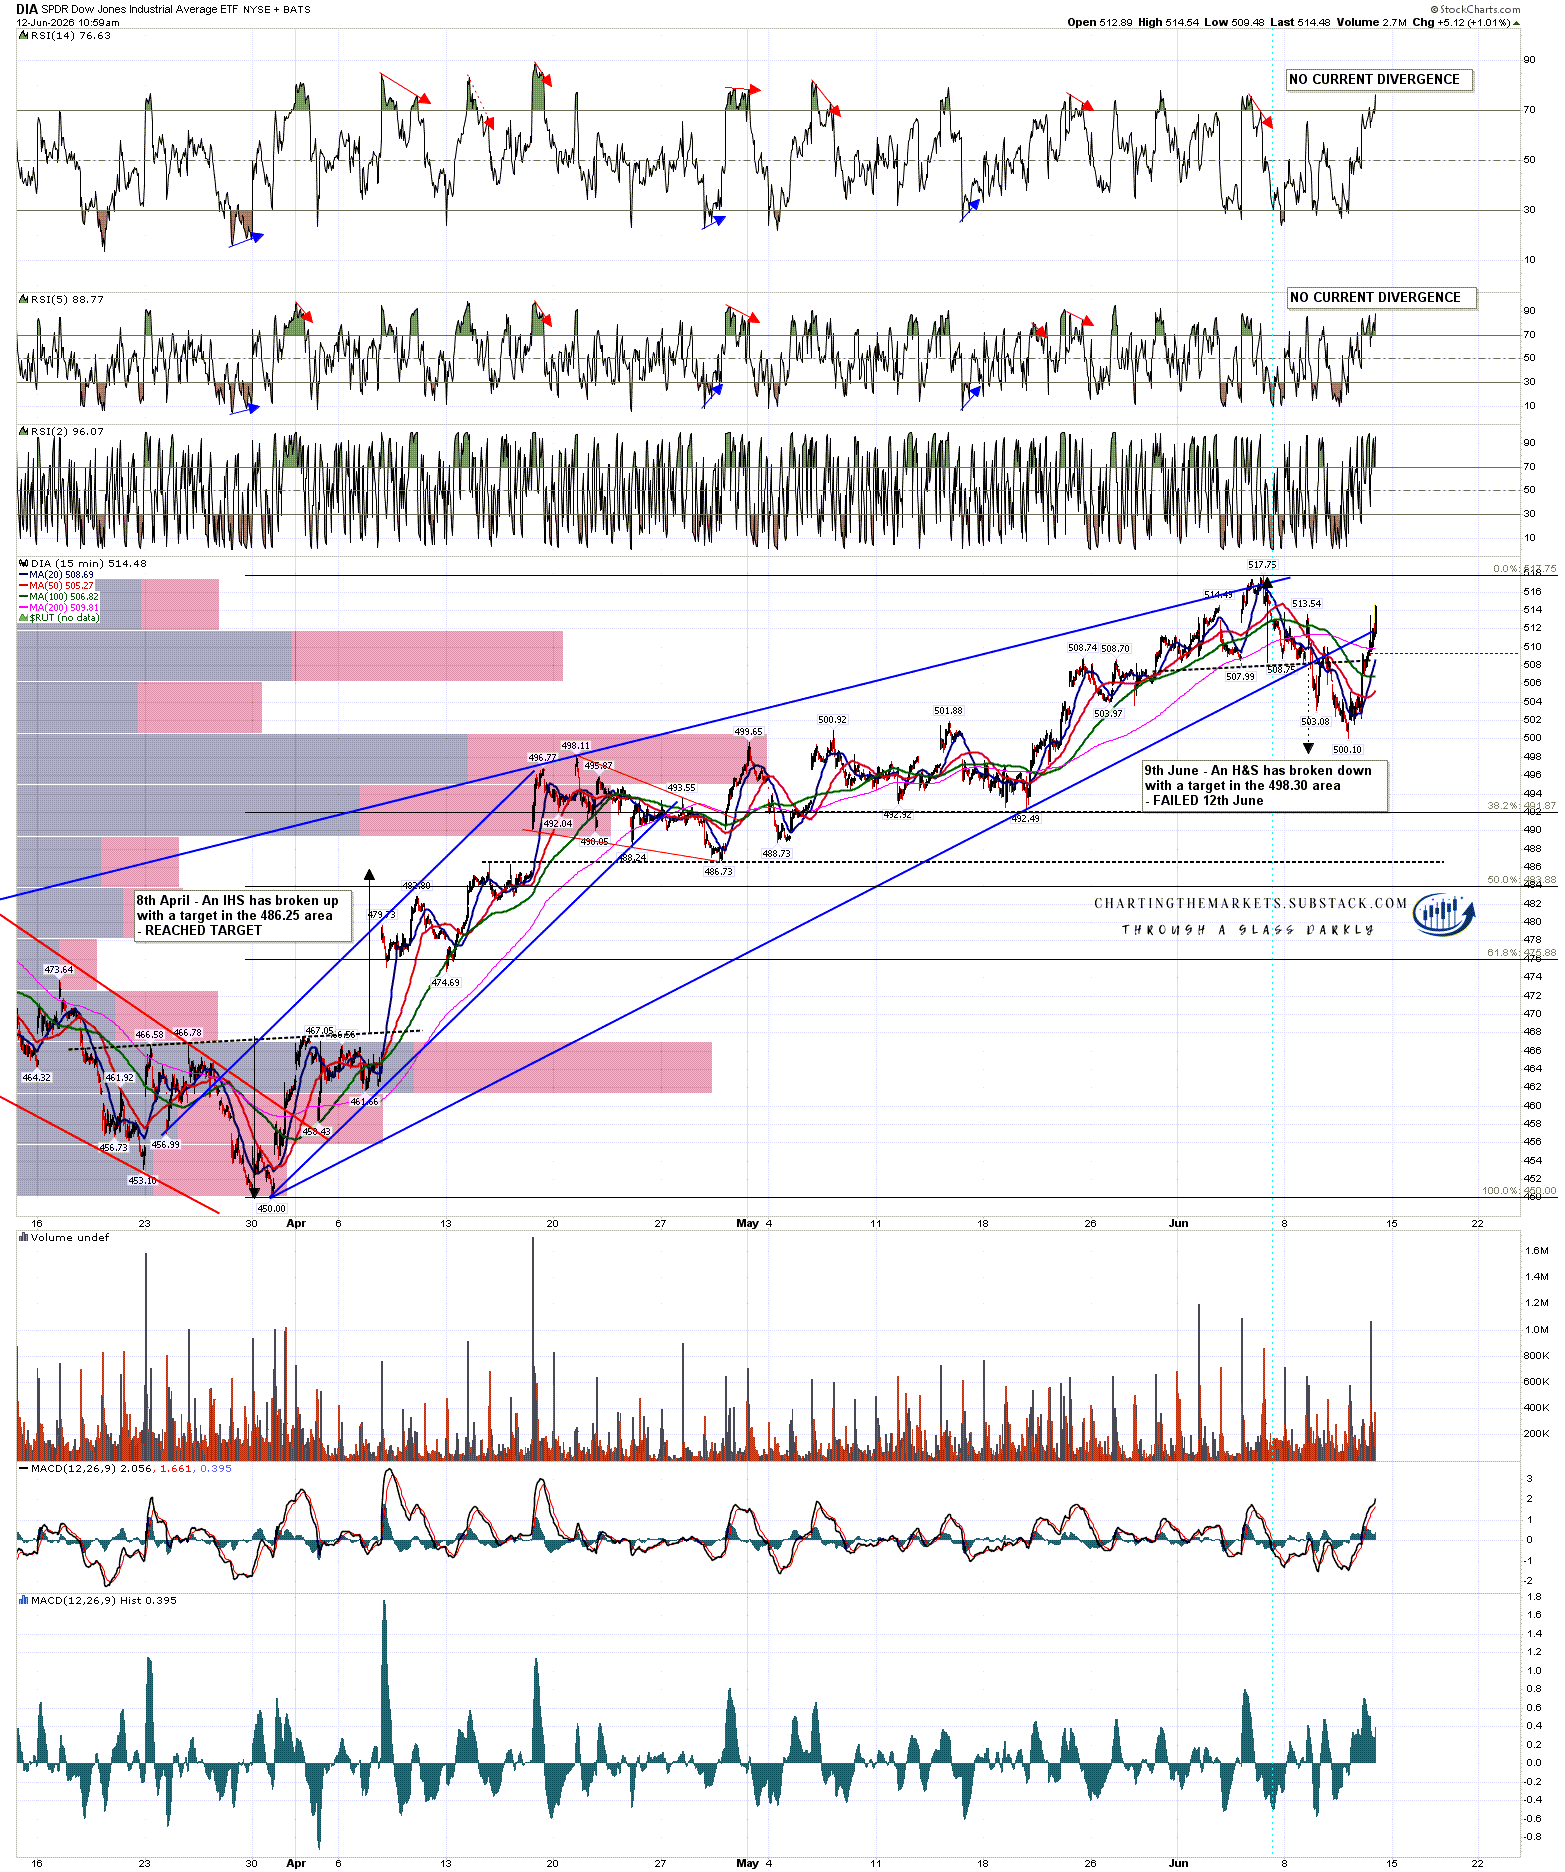
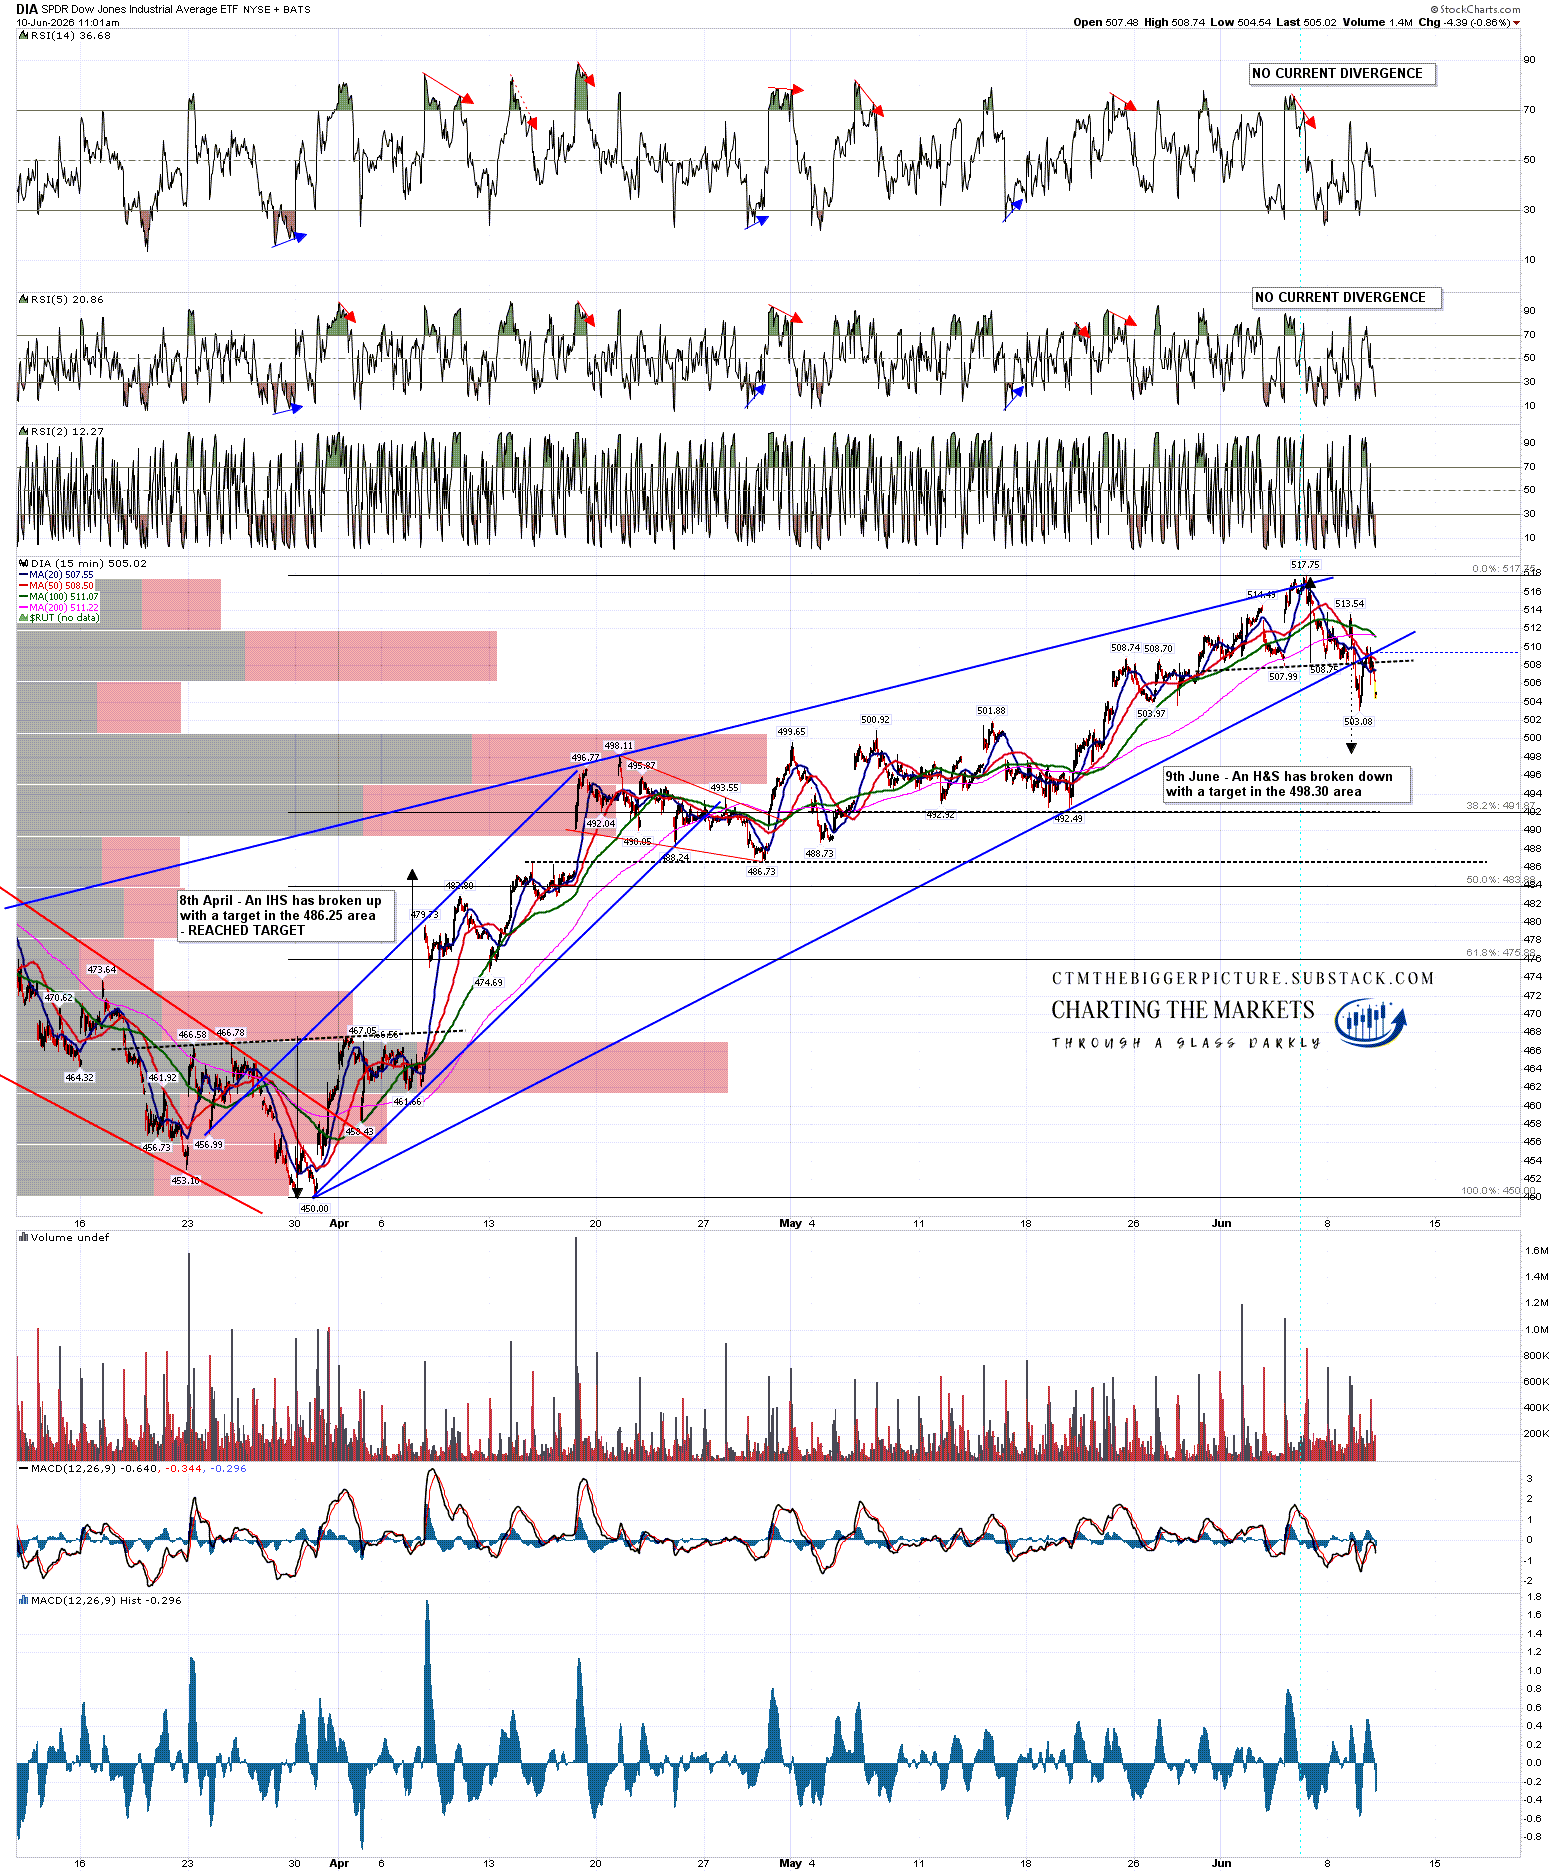
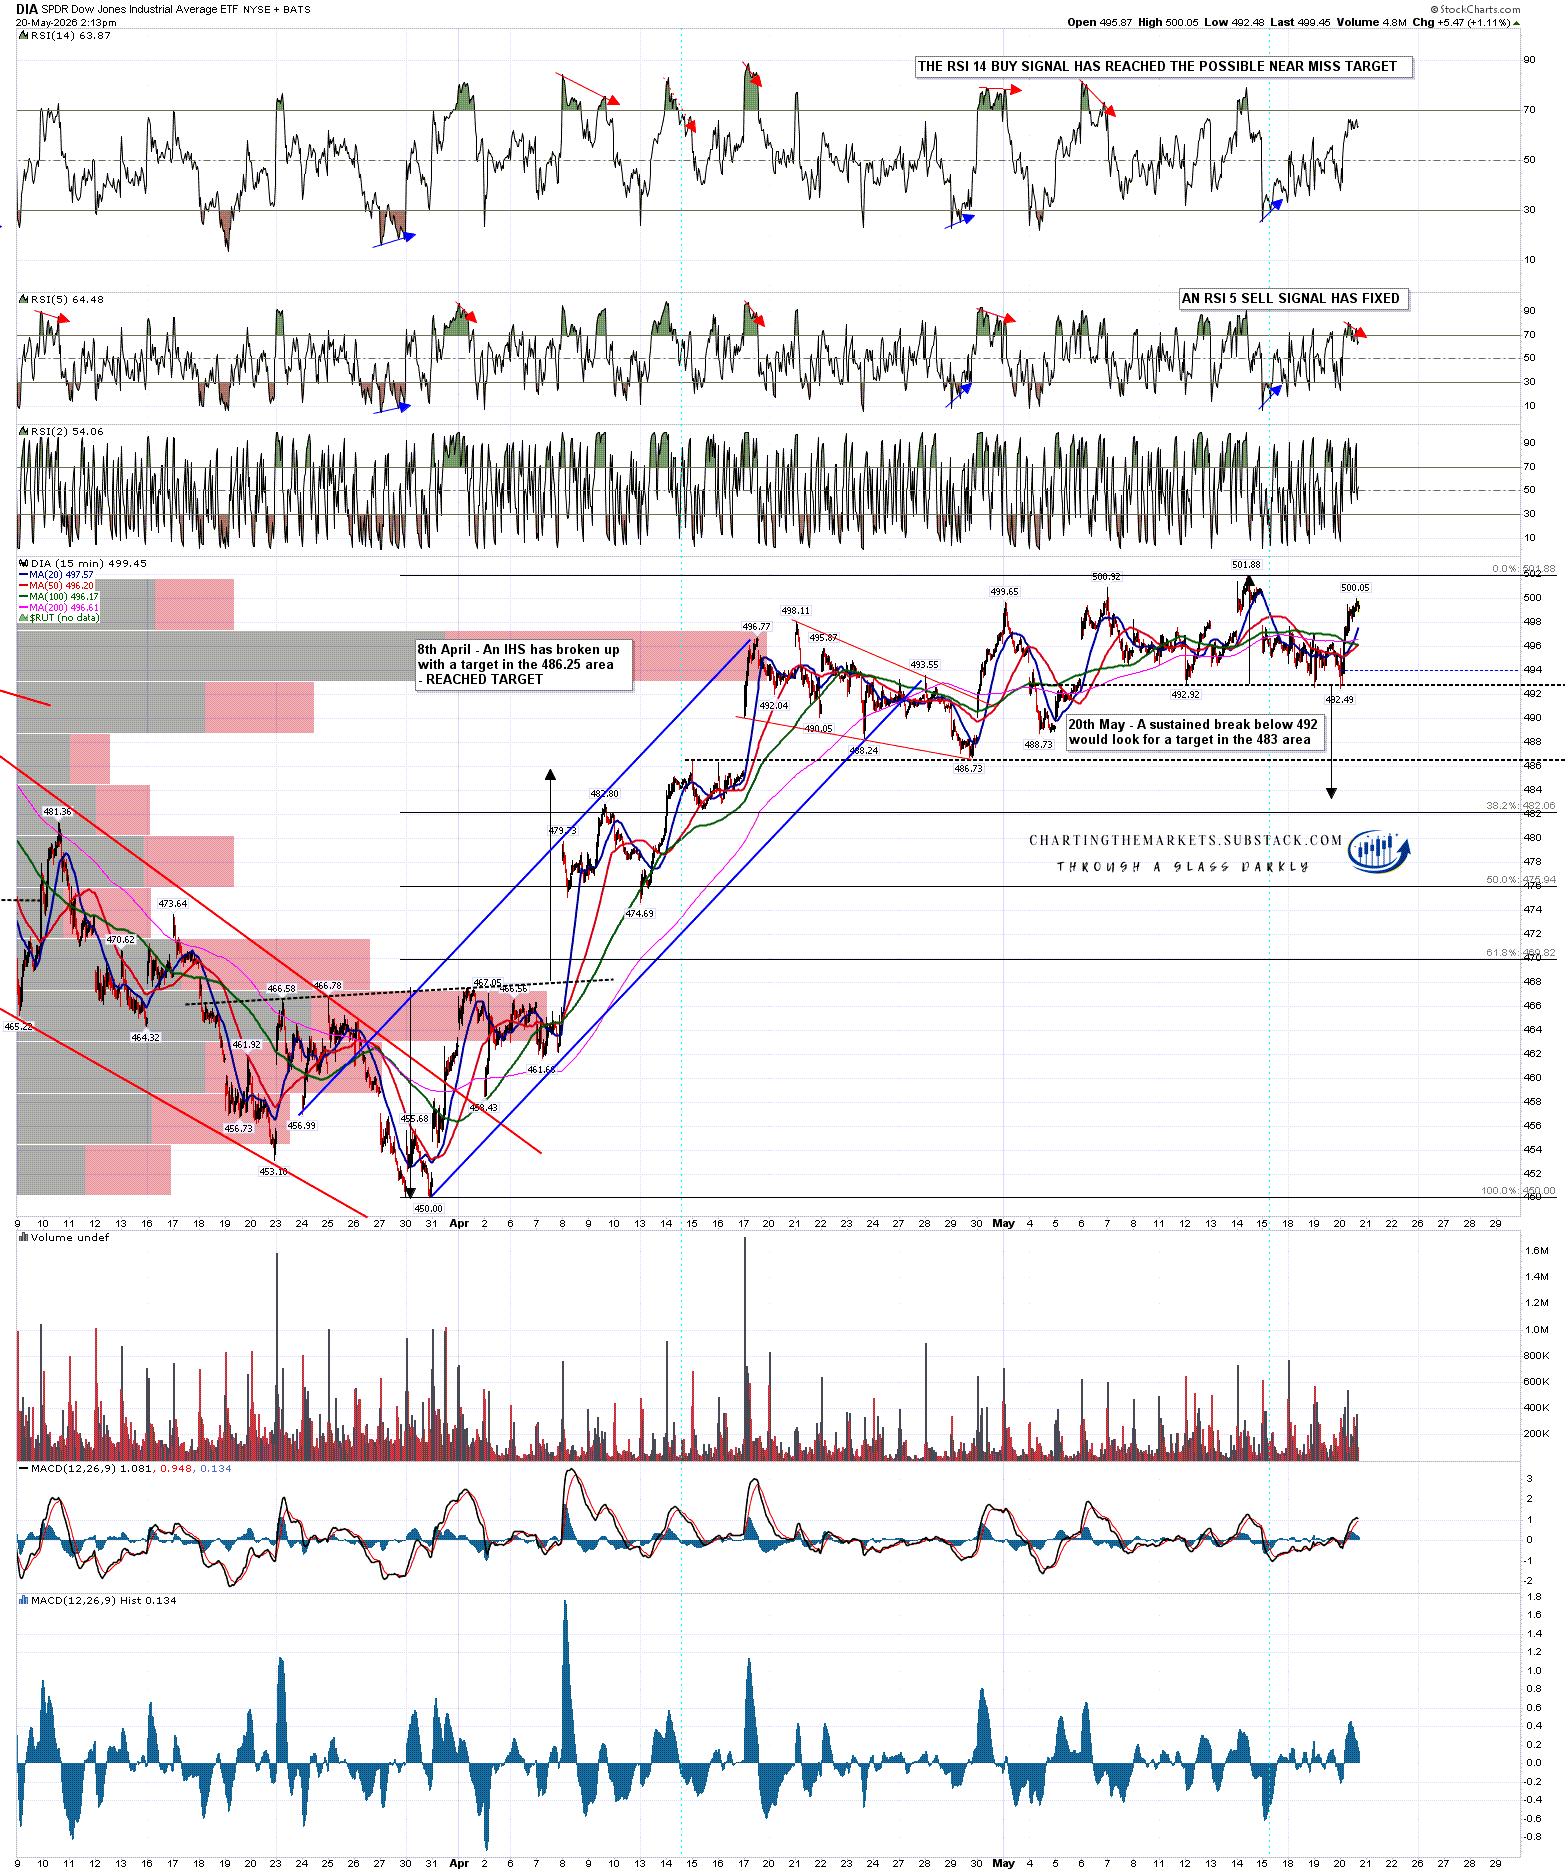
On DIA a fair quality H&S broke down with a target in the 498.30 area. The H&S would fail on a move back over the right shoulder high at 513.54.
DIA 15min chart:
Why do I think that all these H&S patterns are likely to fail back into high retests? Well one reason is that the second and last historically bearish leaning day this week is today, and reaching those targets either today or tomorrow morning looks very ambitious unless there is some really bad and market moving news. The impressive decline on SPX last Friday from high to low was about 230 points. At the time of writing this SPX is at 7360 and to hit the H&S target would therefore require a decline of 260 points. That looks ambitious.
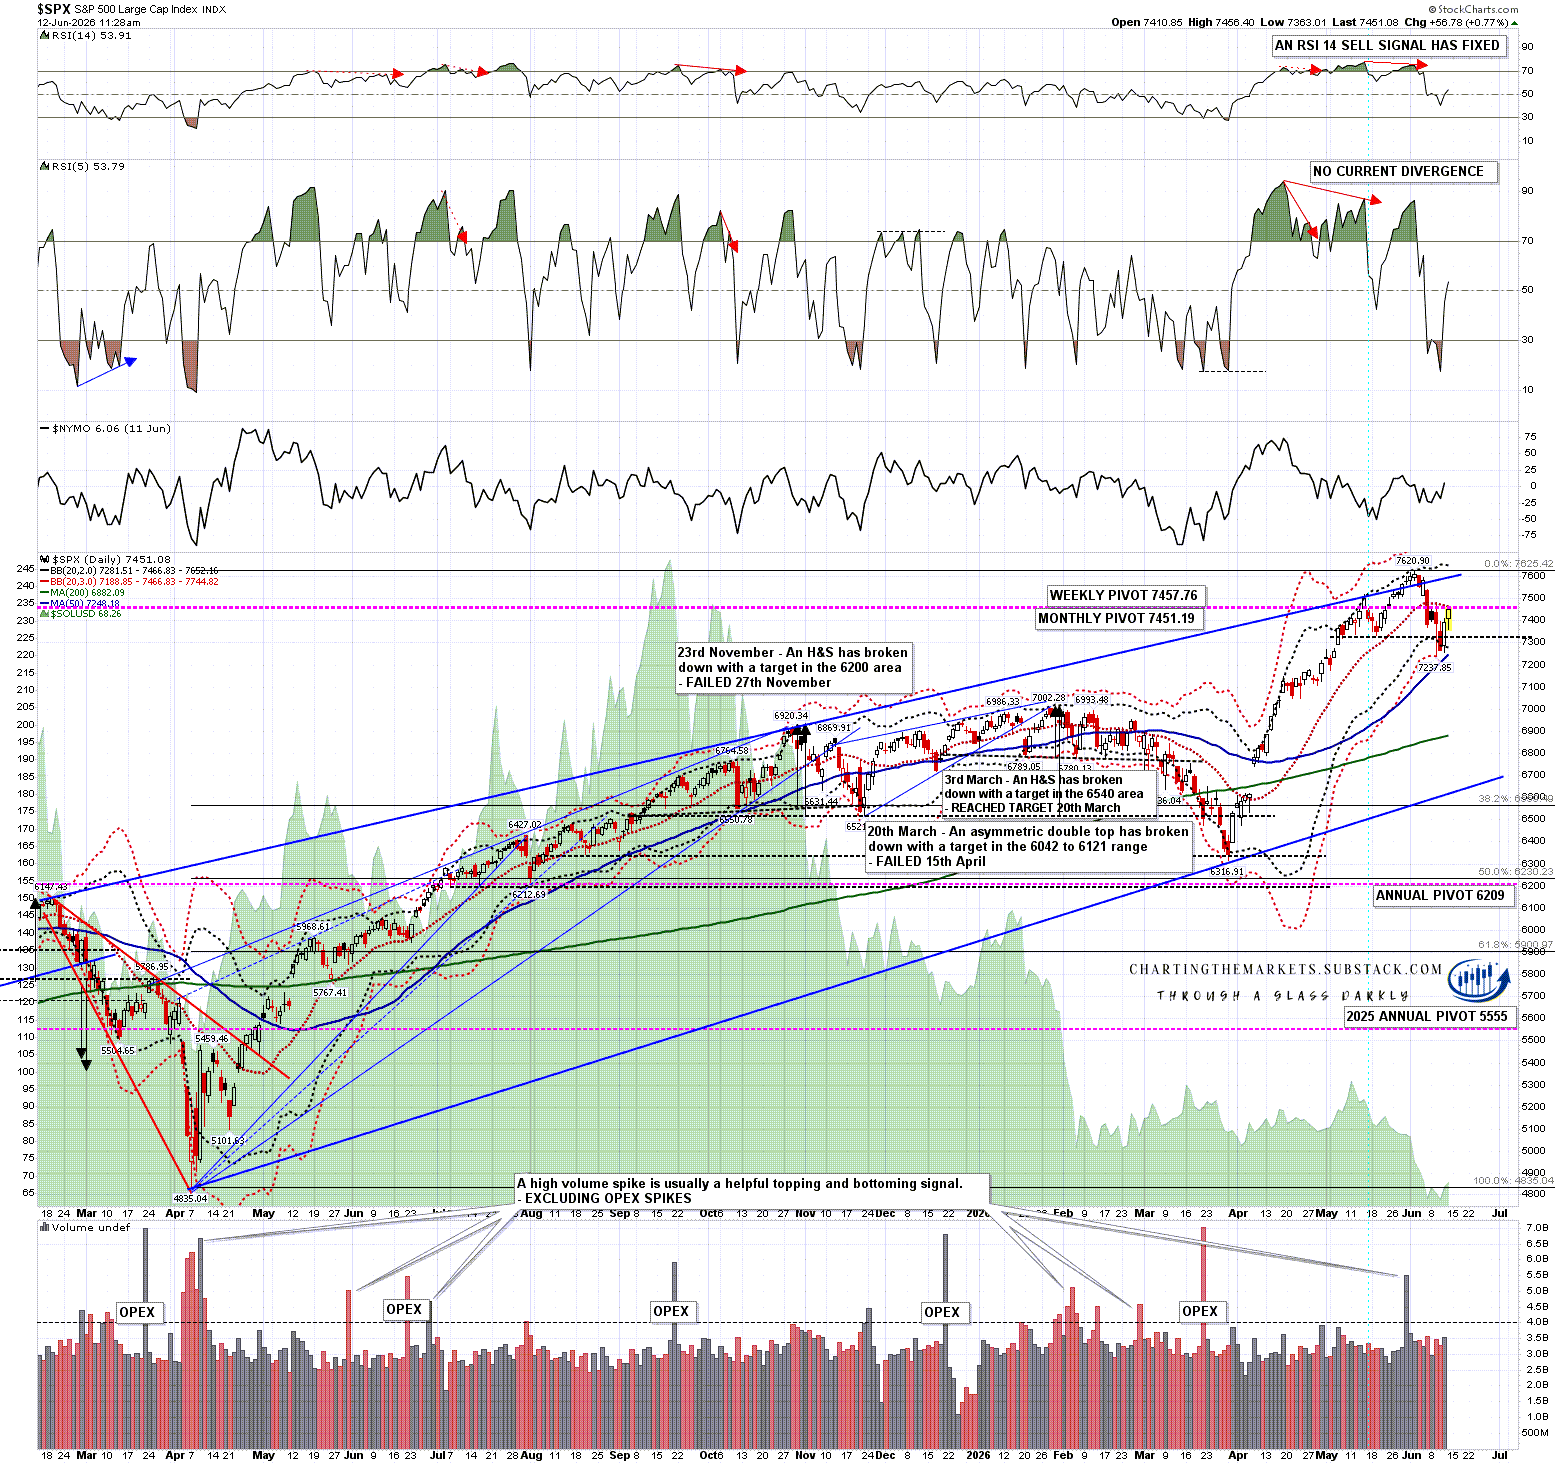
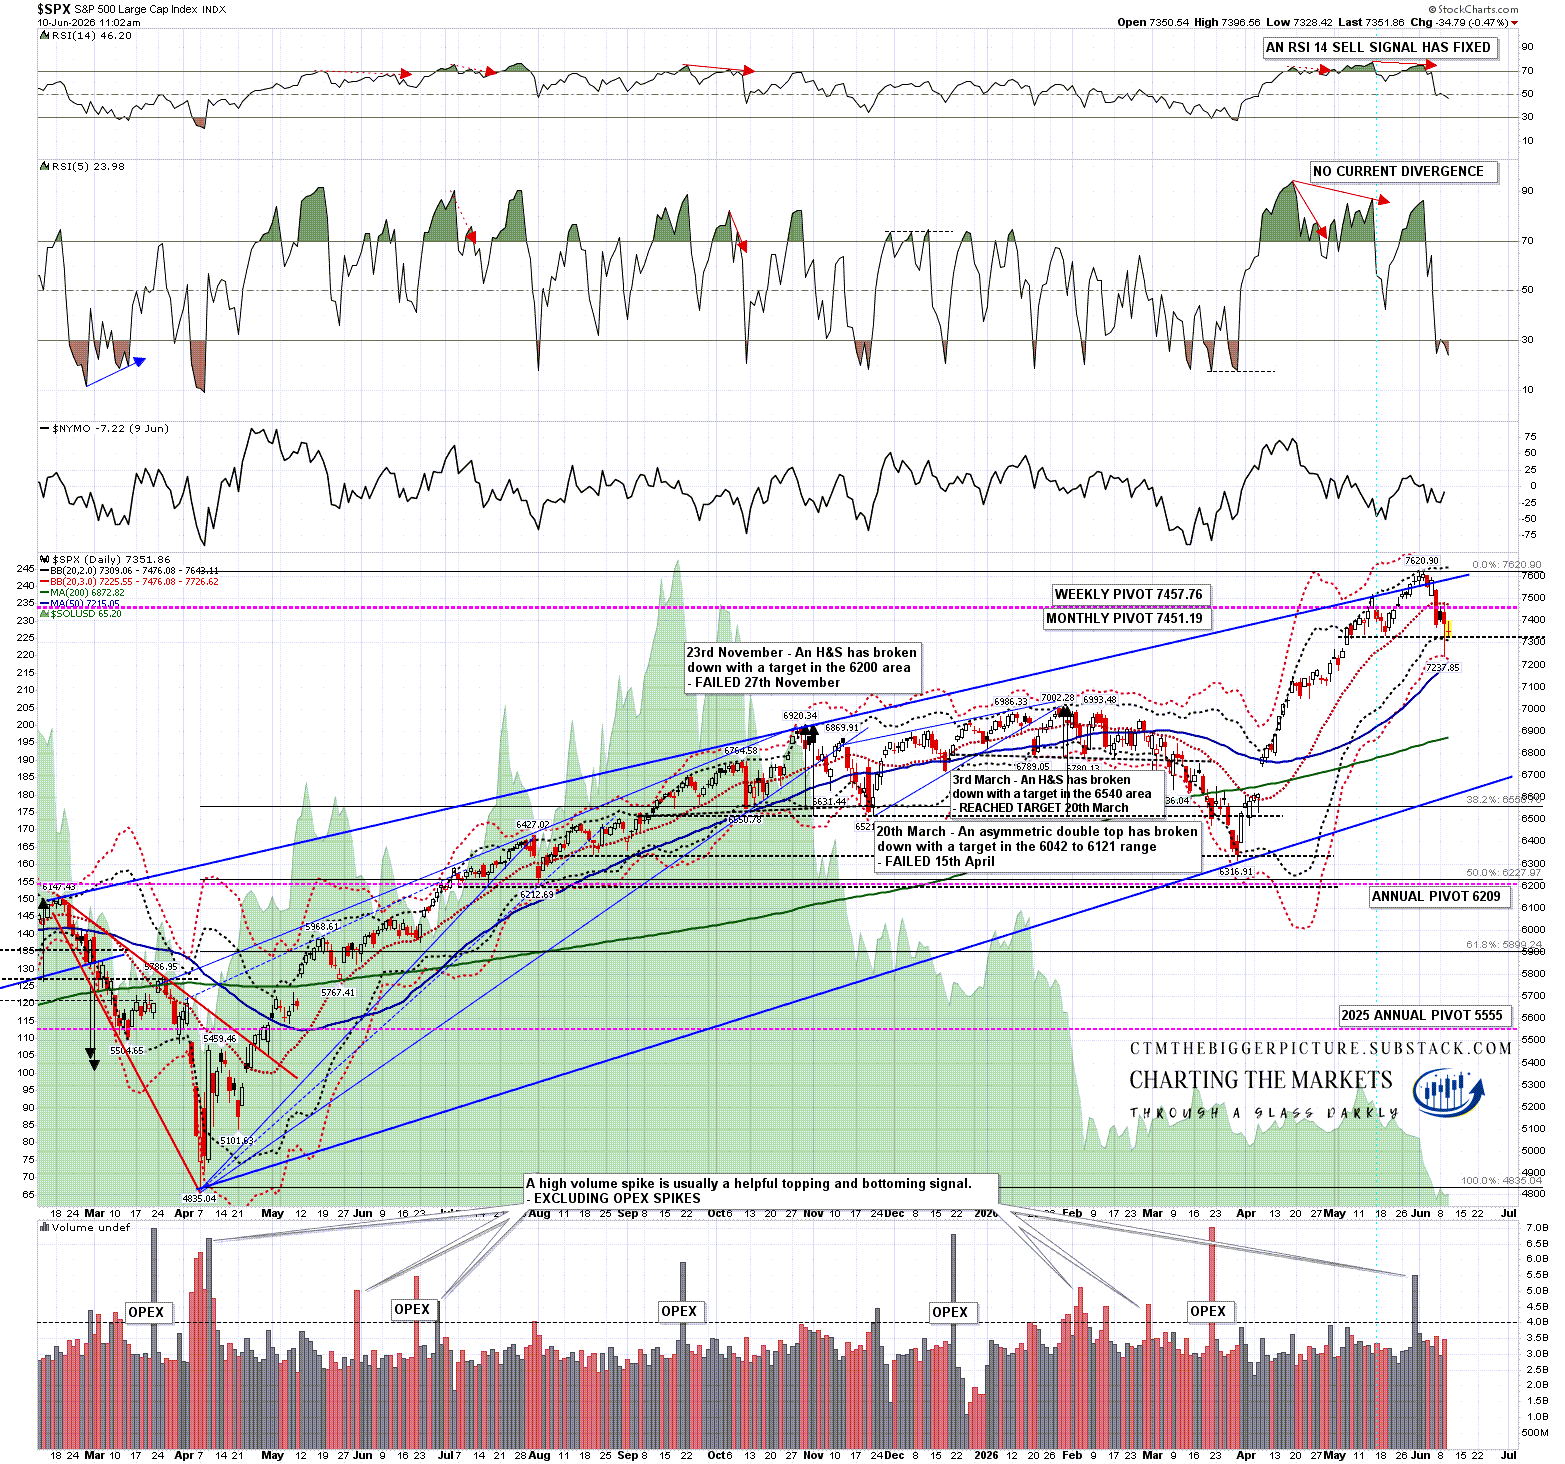
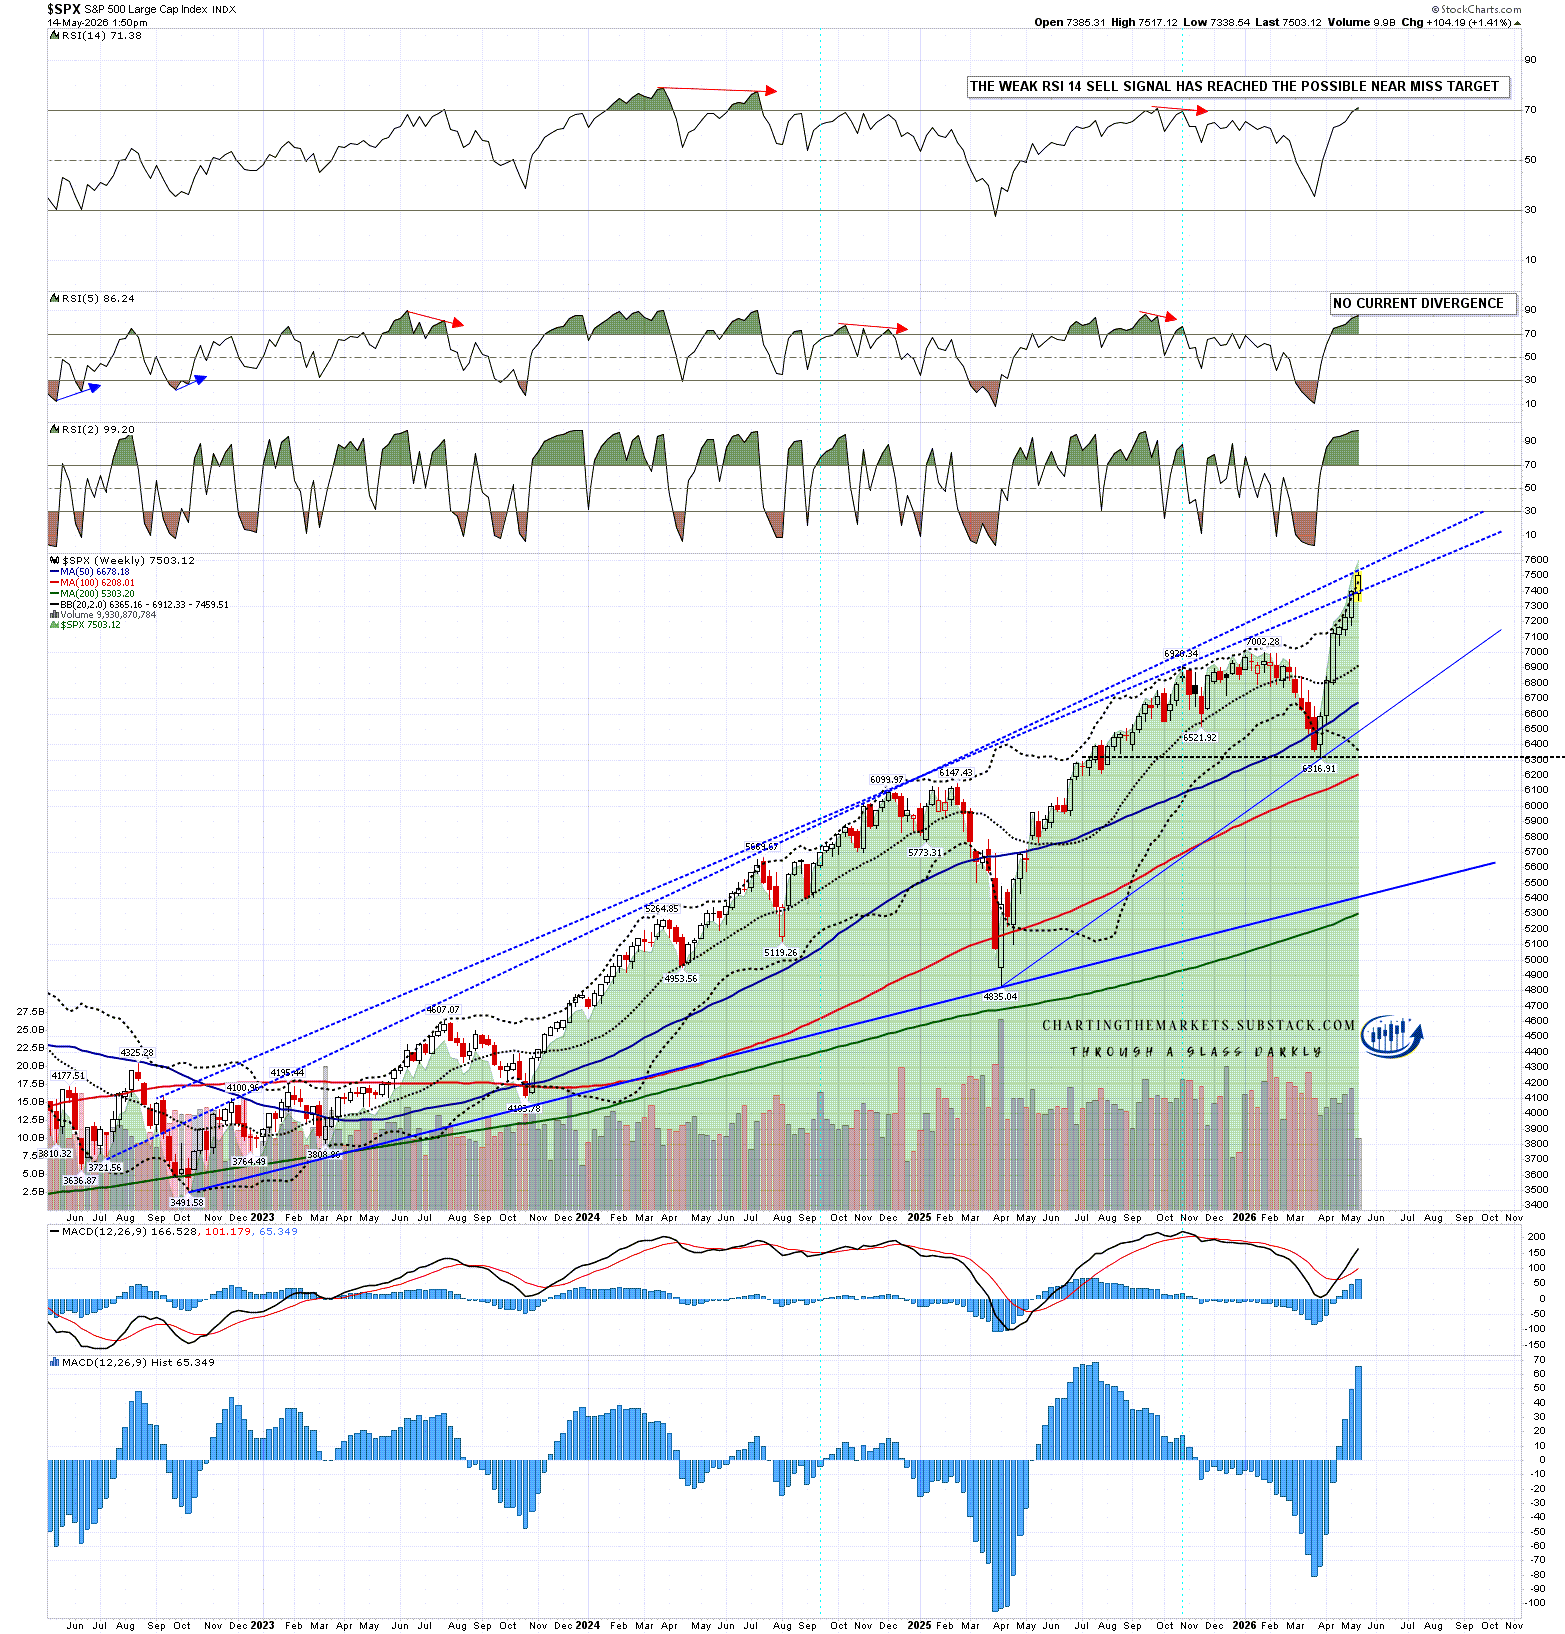
There’s more though, the low on SPX yesterday was a visual hit of the 3sd lower band. Unless there is really bad news that tends to be a strong buy level on SPX, as it was yesterday. It takes time for daily middle bands to turn down and for the outer bands to expand and SPX just isn’t there yet. This is a key reason that topping tends to take a while. The daily 3sd lower band on SPX is in the same area today and a more than 100 point punch below it today historically looks like a long shot. In the unlikely event that was to be reached today or tomorrow morning, it would likely be a strong buy.
SPX daily chart:
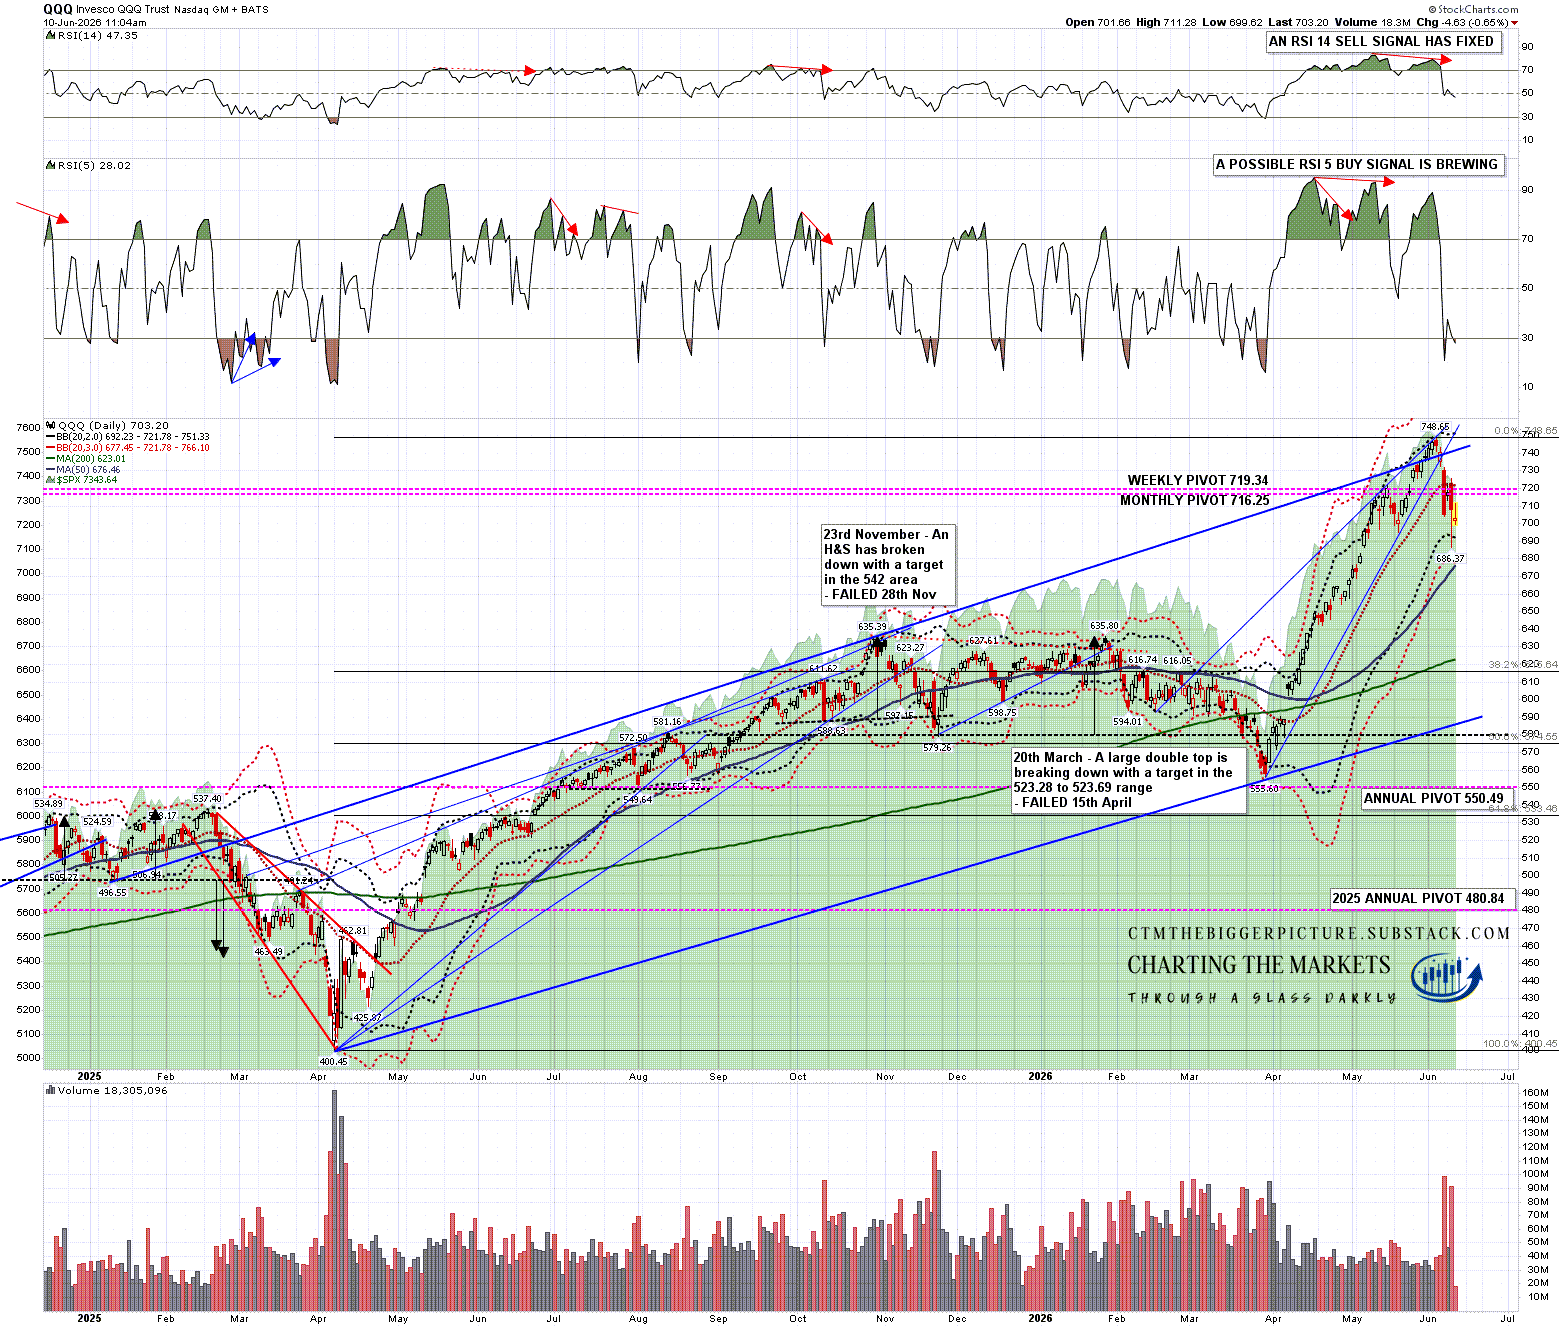
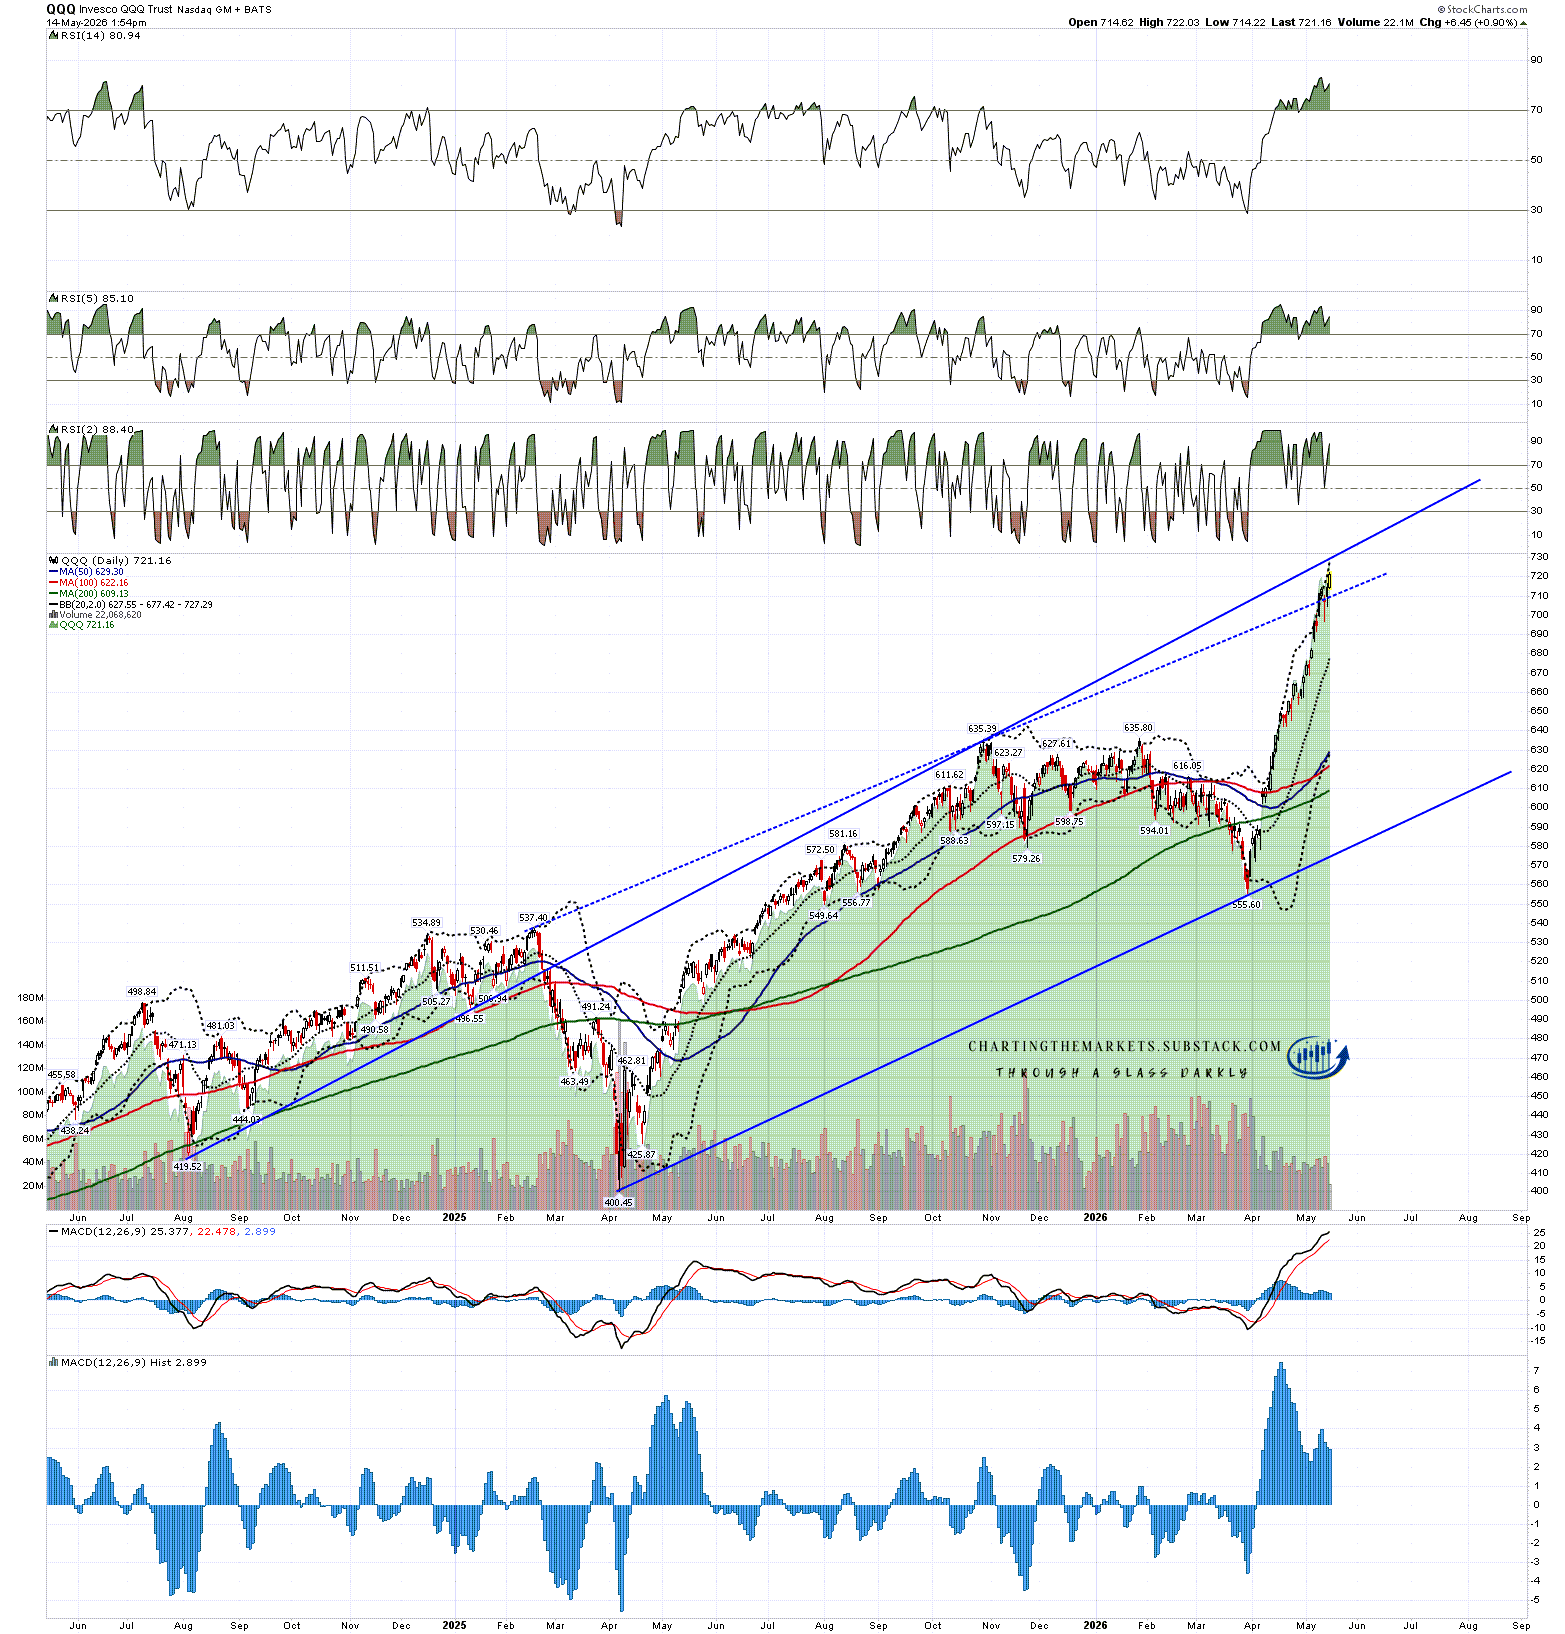
QQQ didn’t quite reach the daily 3sd lower band yesterday though it came close. For today that is strong support in the 676.50 area, supported by the 50dma now at 676.39. I’d be surprised to see that broken significantly today.
One other thing I would note is that a possible daily RSI 5 buy signal is brewing on QQQ. There are also possible hourly RSI 14 buy signals brewing on both QQQ and SPX and all of these are suggesting a reversal back up to rested the all time highs from here. QQQ and SPX have been driving the downside bus over the last few days, and it’s likely they would be driving the upside bus too.
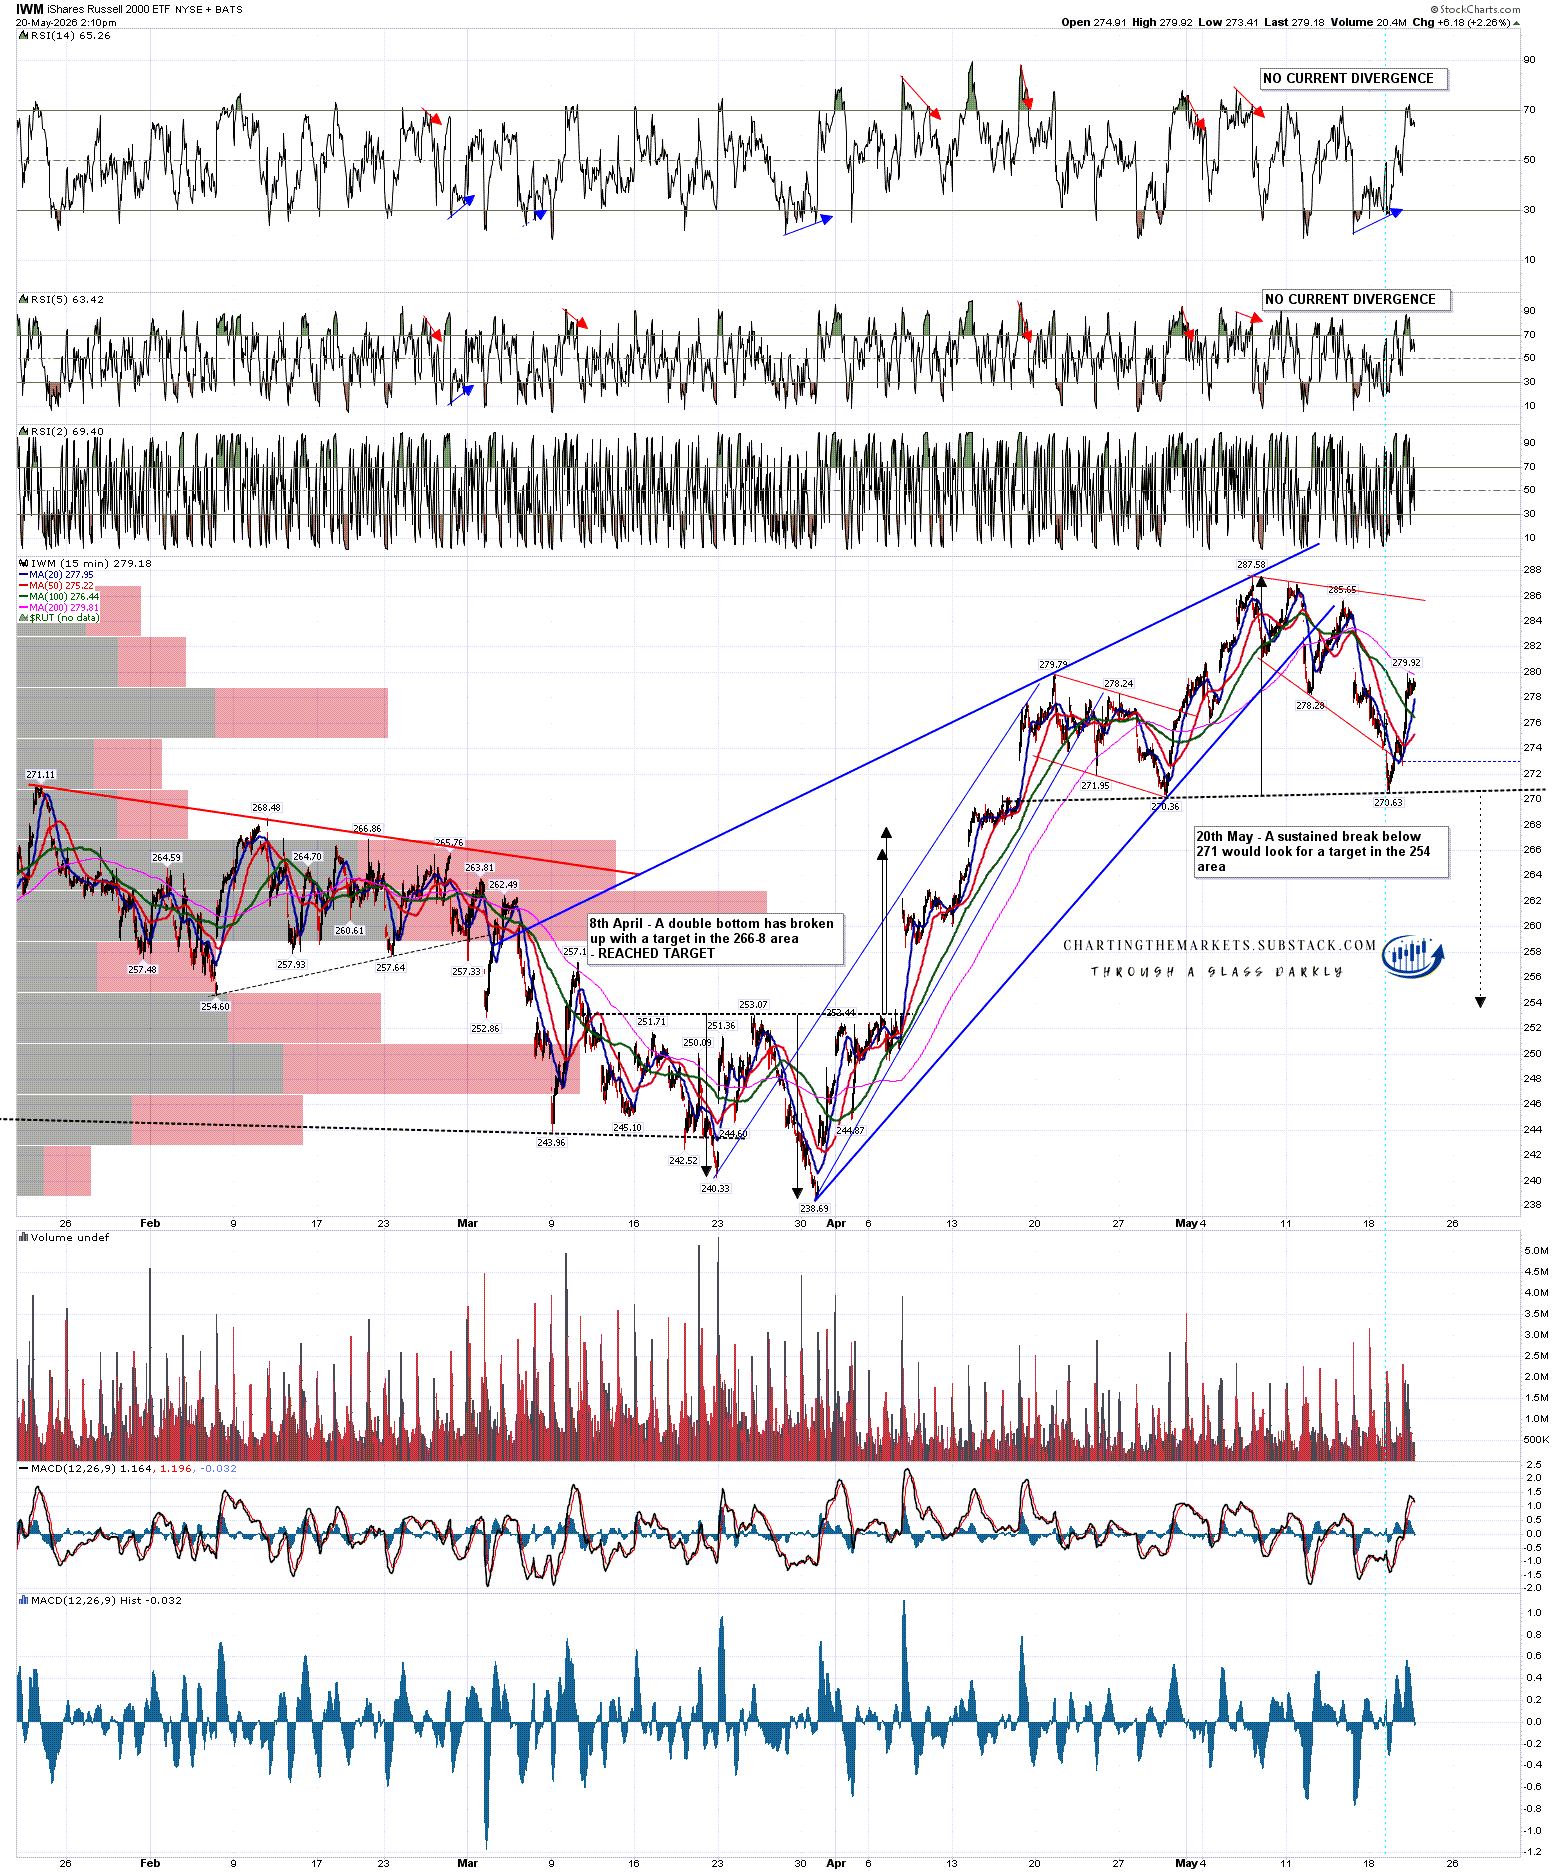
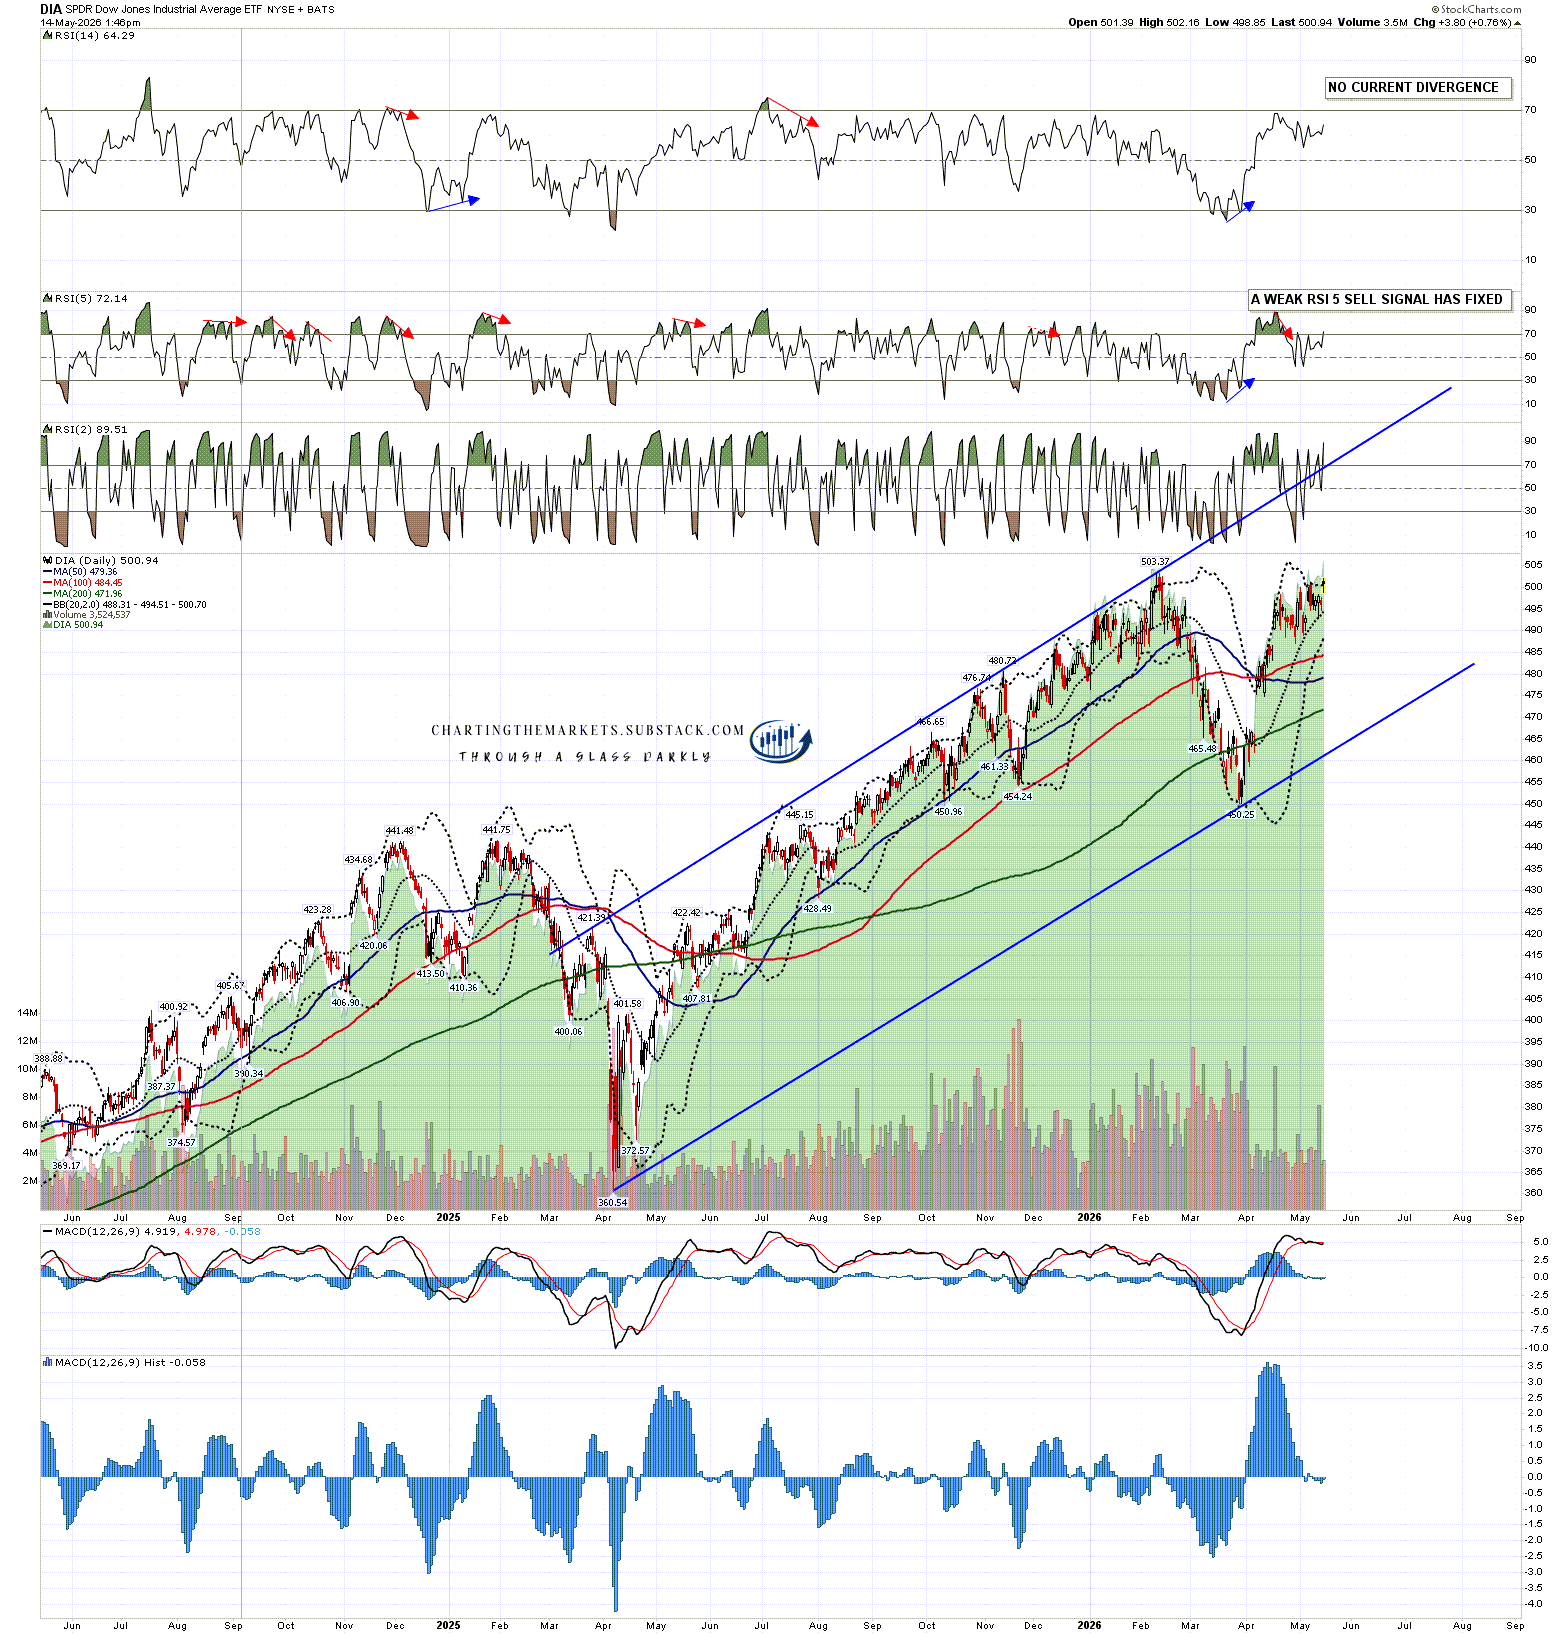
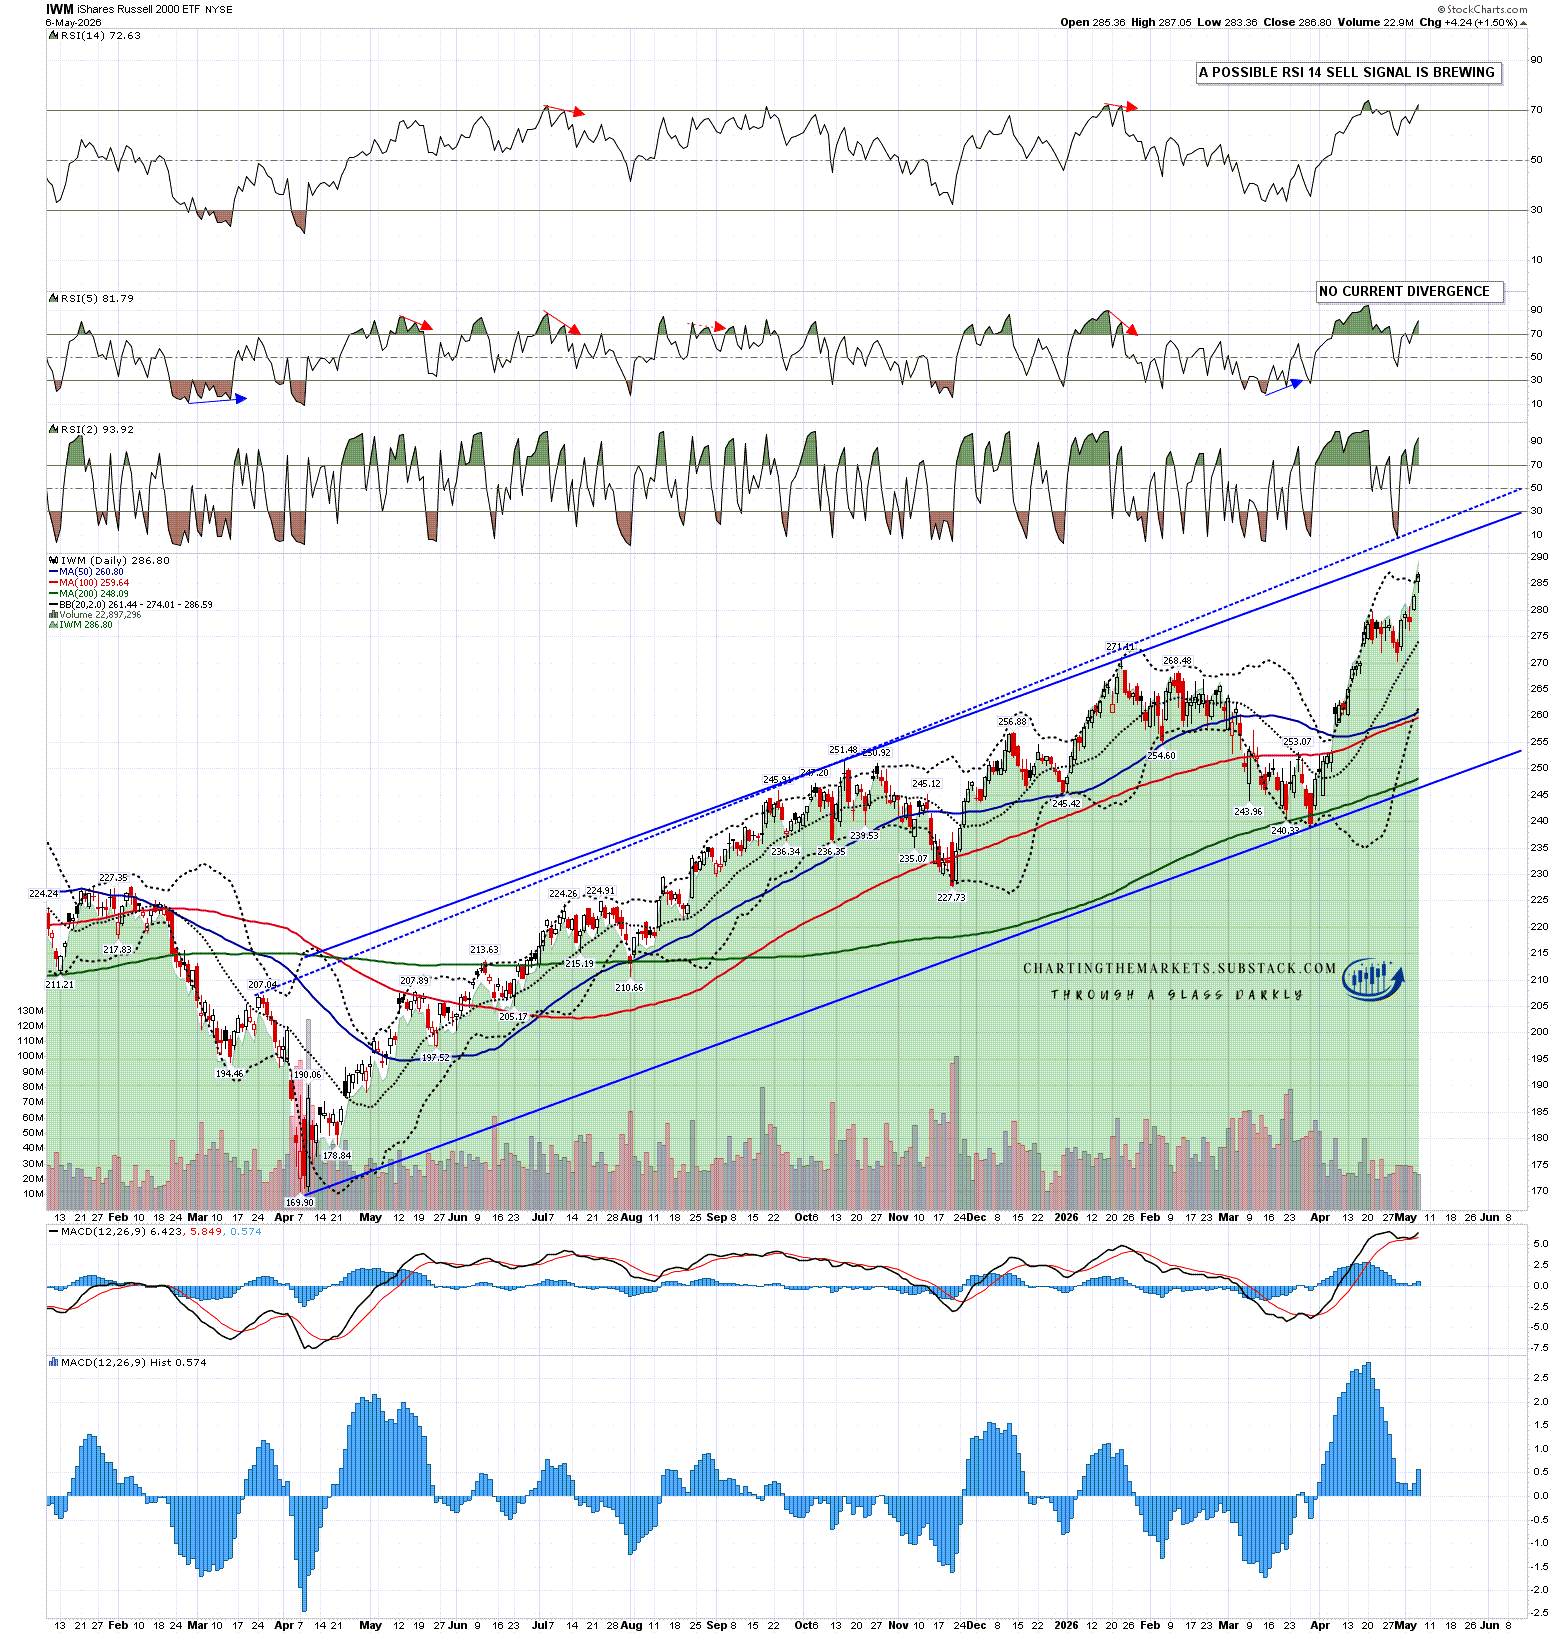
Lastly I should add that the low on DIA yesterday was a test of the daily middle band, which tends to be decent support, and the close on IWM yesterday was slightly over the daily middle band. Both of those have been stronger than QQQ and SPX over the last few days.
QQQ daily chart:
So what are the historical stats from here? Well today leans bearish as I mentioned. After today the next three trading days through Monday lean bullish, Tuesday through Thursday next week lean neutral into the Juneteenth holiday on Friday. Obviously this would be an attractive window to see some all time high retests.
Does this change my longer term outlook? No. I still think a significant high is forming on equity indices here and we are watching the process of finding that high. Each time a candidate high area is reached however the topping process has to start again from scratch and can take a while.
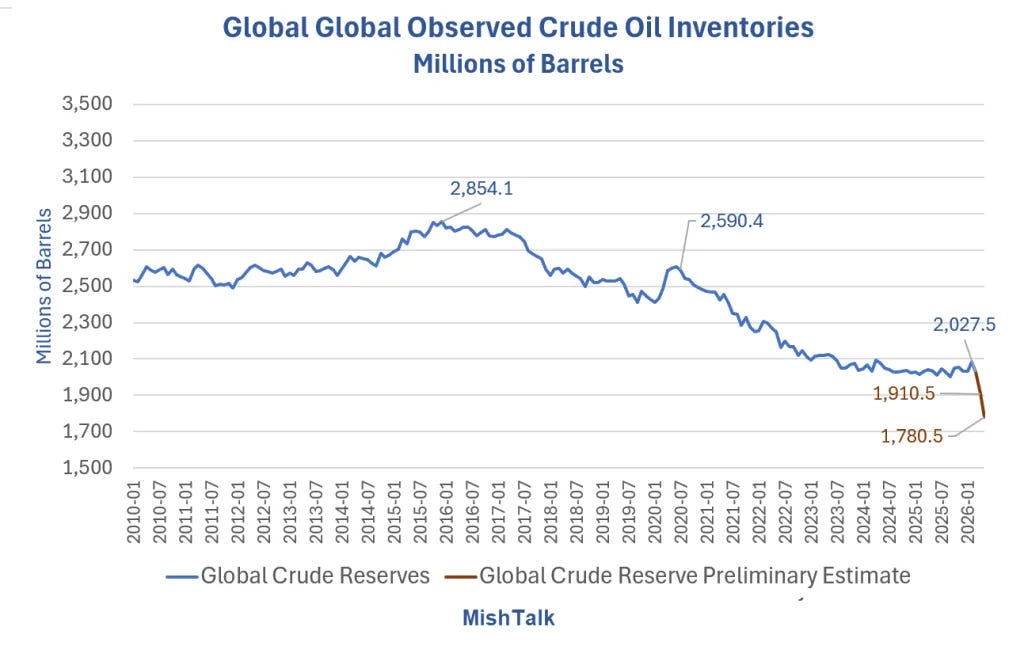
Fifteen weeks into this two to four week war against Iran I am still expecting to see an oil squeeze soon when world oil stocks fall to critical levels, and I think that last week’s decline on QQQ was a warning that the AI bubble might also be heading into trouble. I am watching the upcoming IPOs on SpaceX, OpenAI and Anthropic with great interest and also the cash calls to shareholders from Google and Facebook for their AI investment plans. These are putting strain on an already stretched market.
After this equities high is made I think the months after that high lean strongly bullish for oil, food and inflation, and bearish for equities and US treasuries.
I’ve been looking at the short term prospects for US equity indices today and I’ll be following this up with as look at the longer term structure in a post tomorrow.
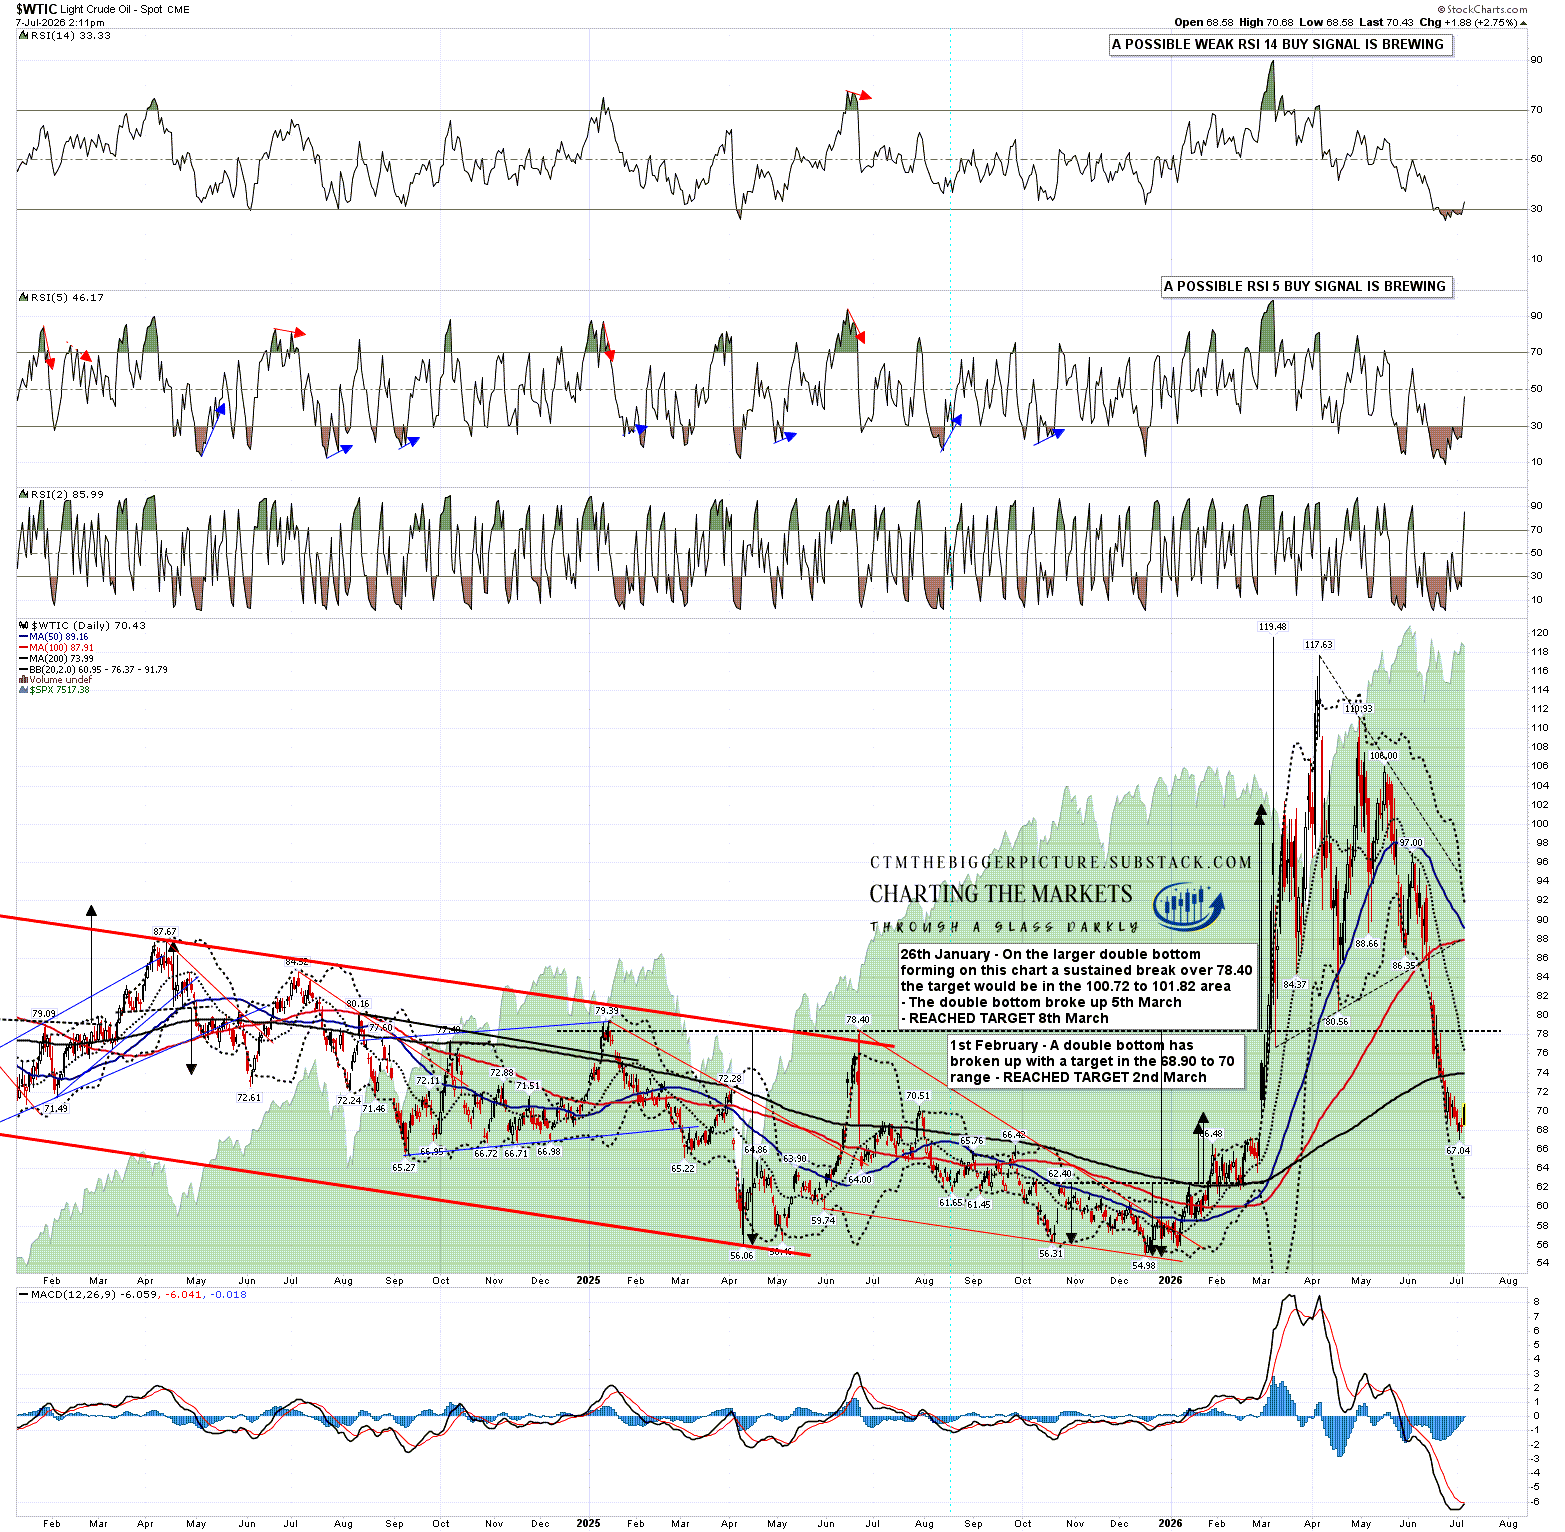
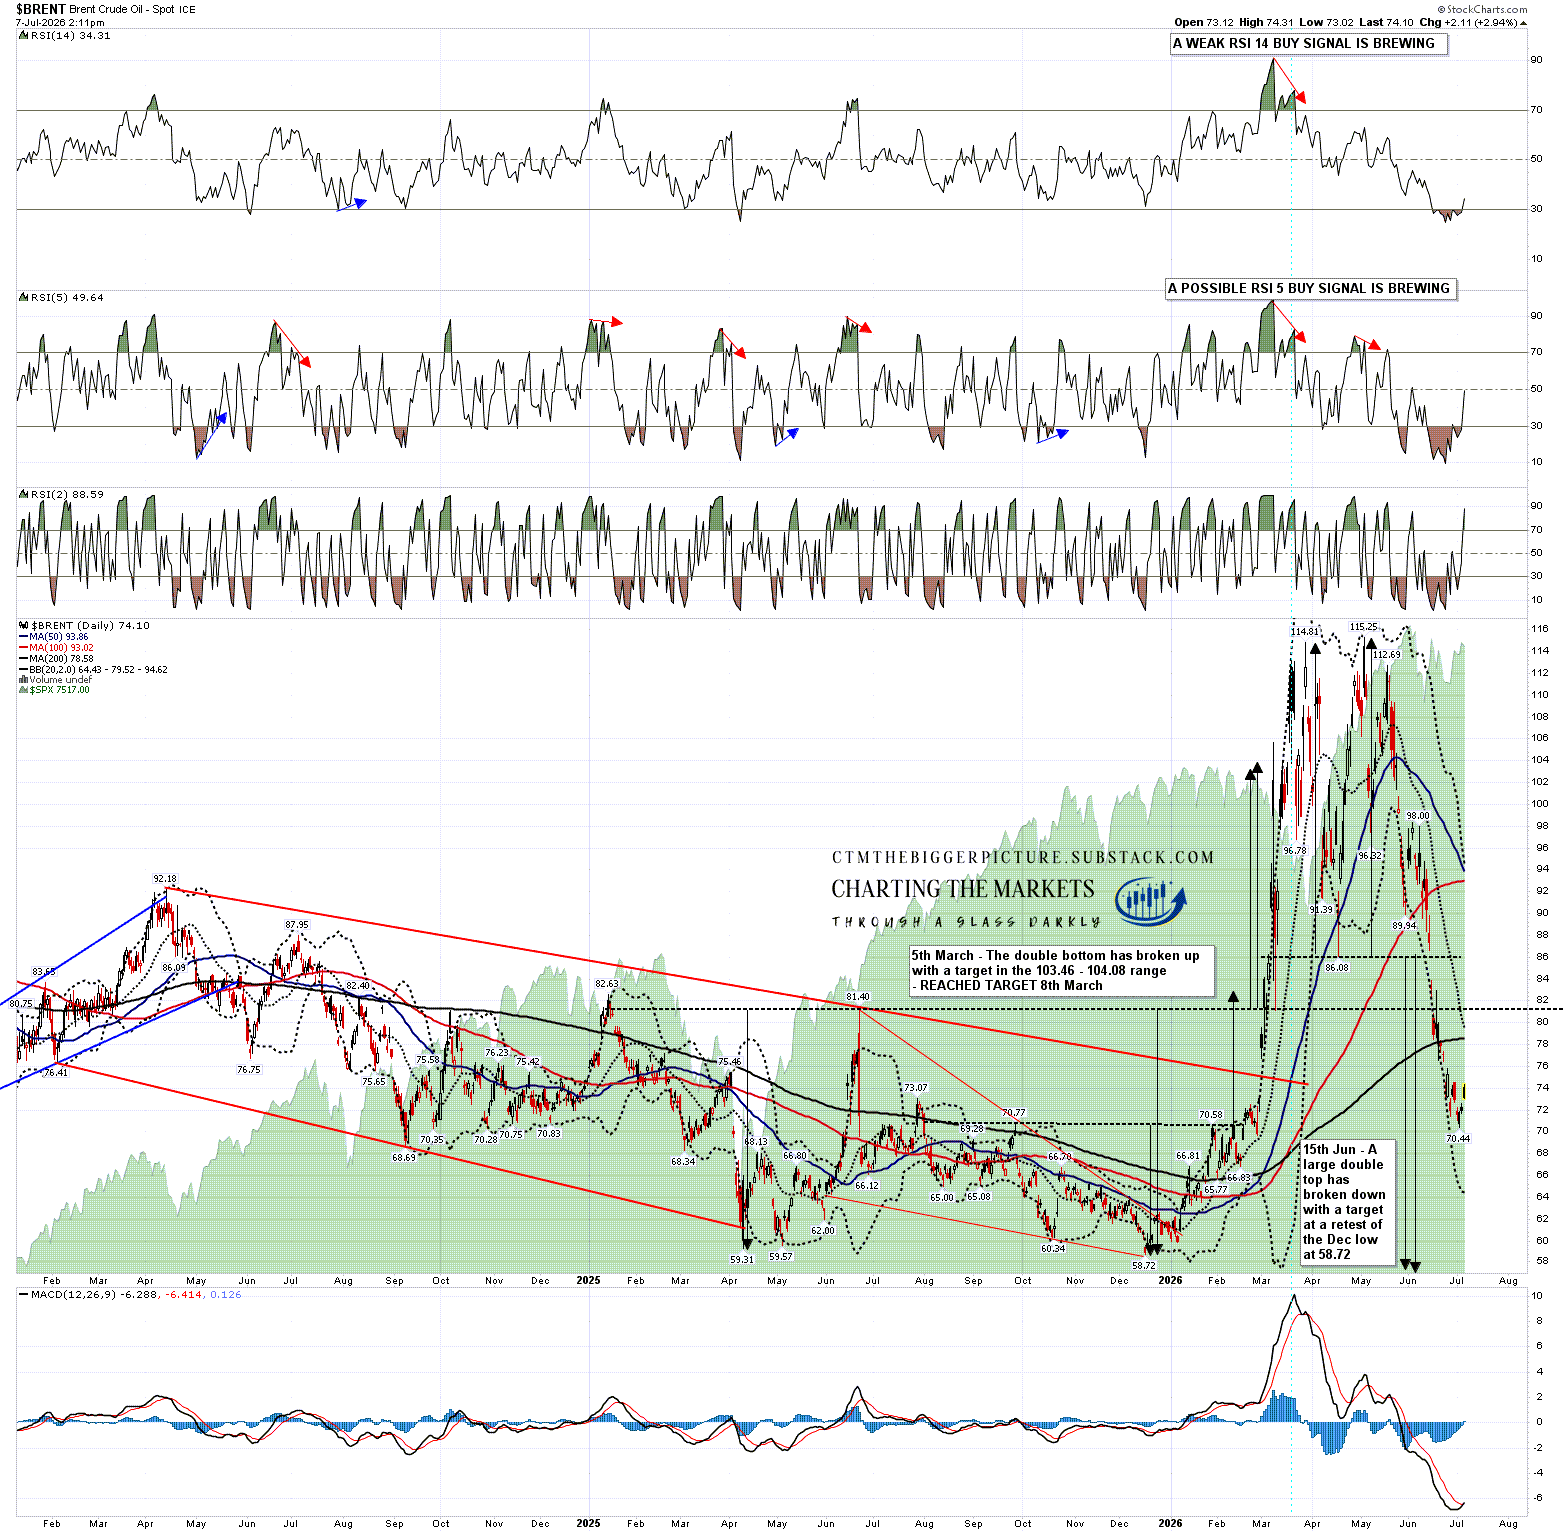
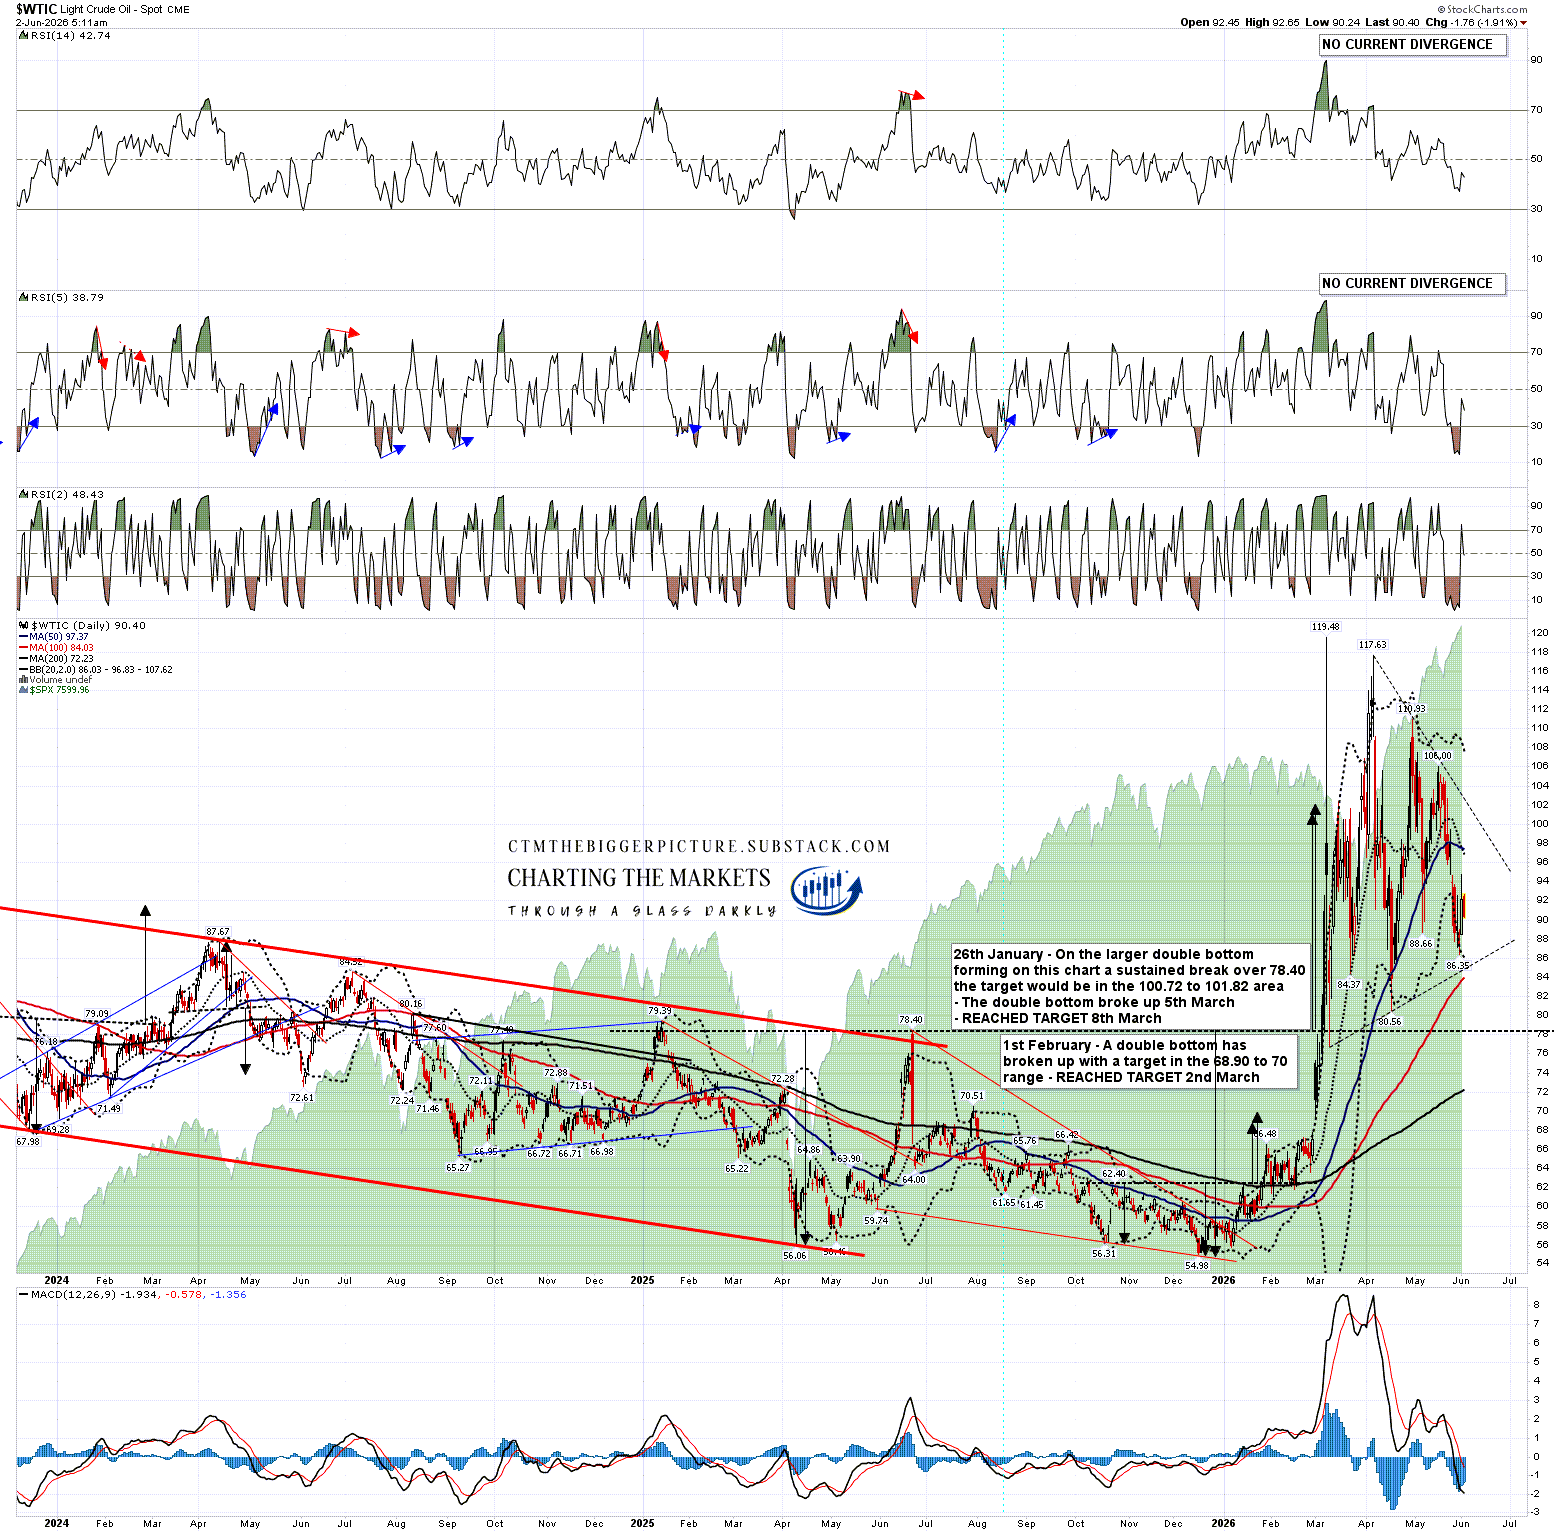
In my post on 30th April I made some predictions for oil, equity and bond markets over the rest of this year. Nothing has happened since to change this longer term view though it might take an extra month for US inflation to reach 5%.
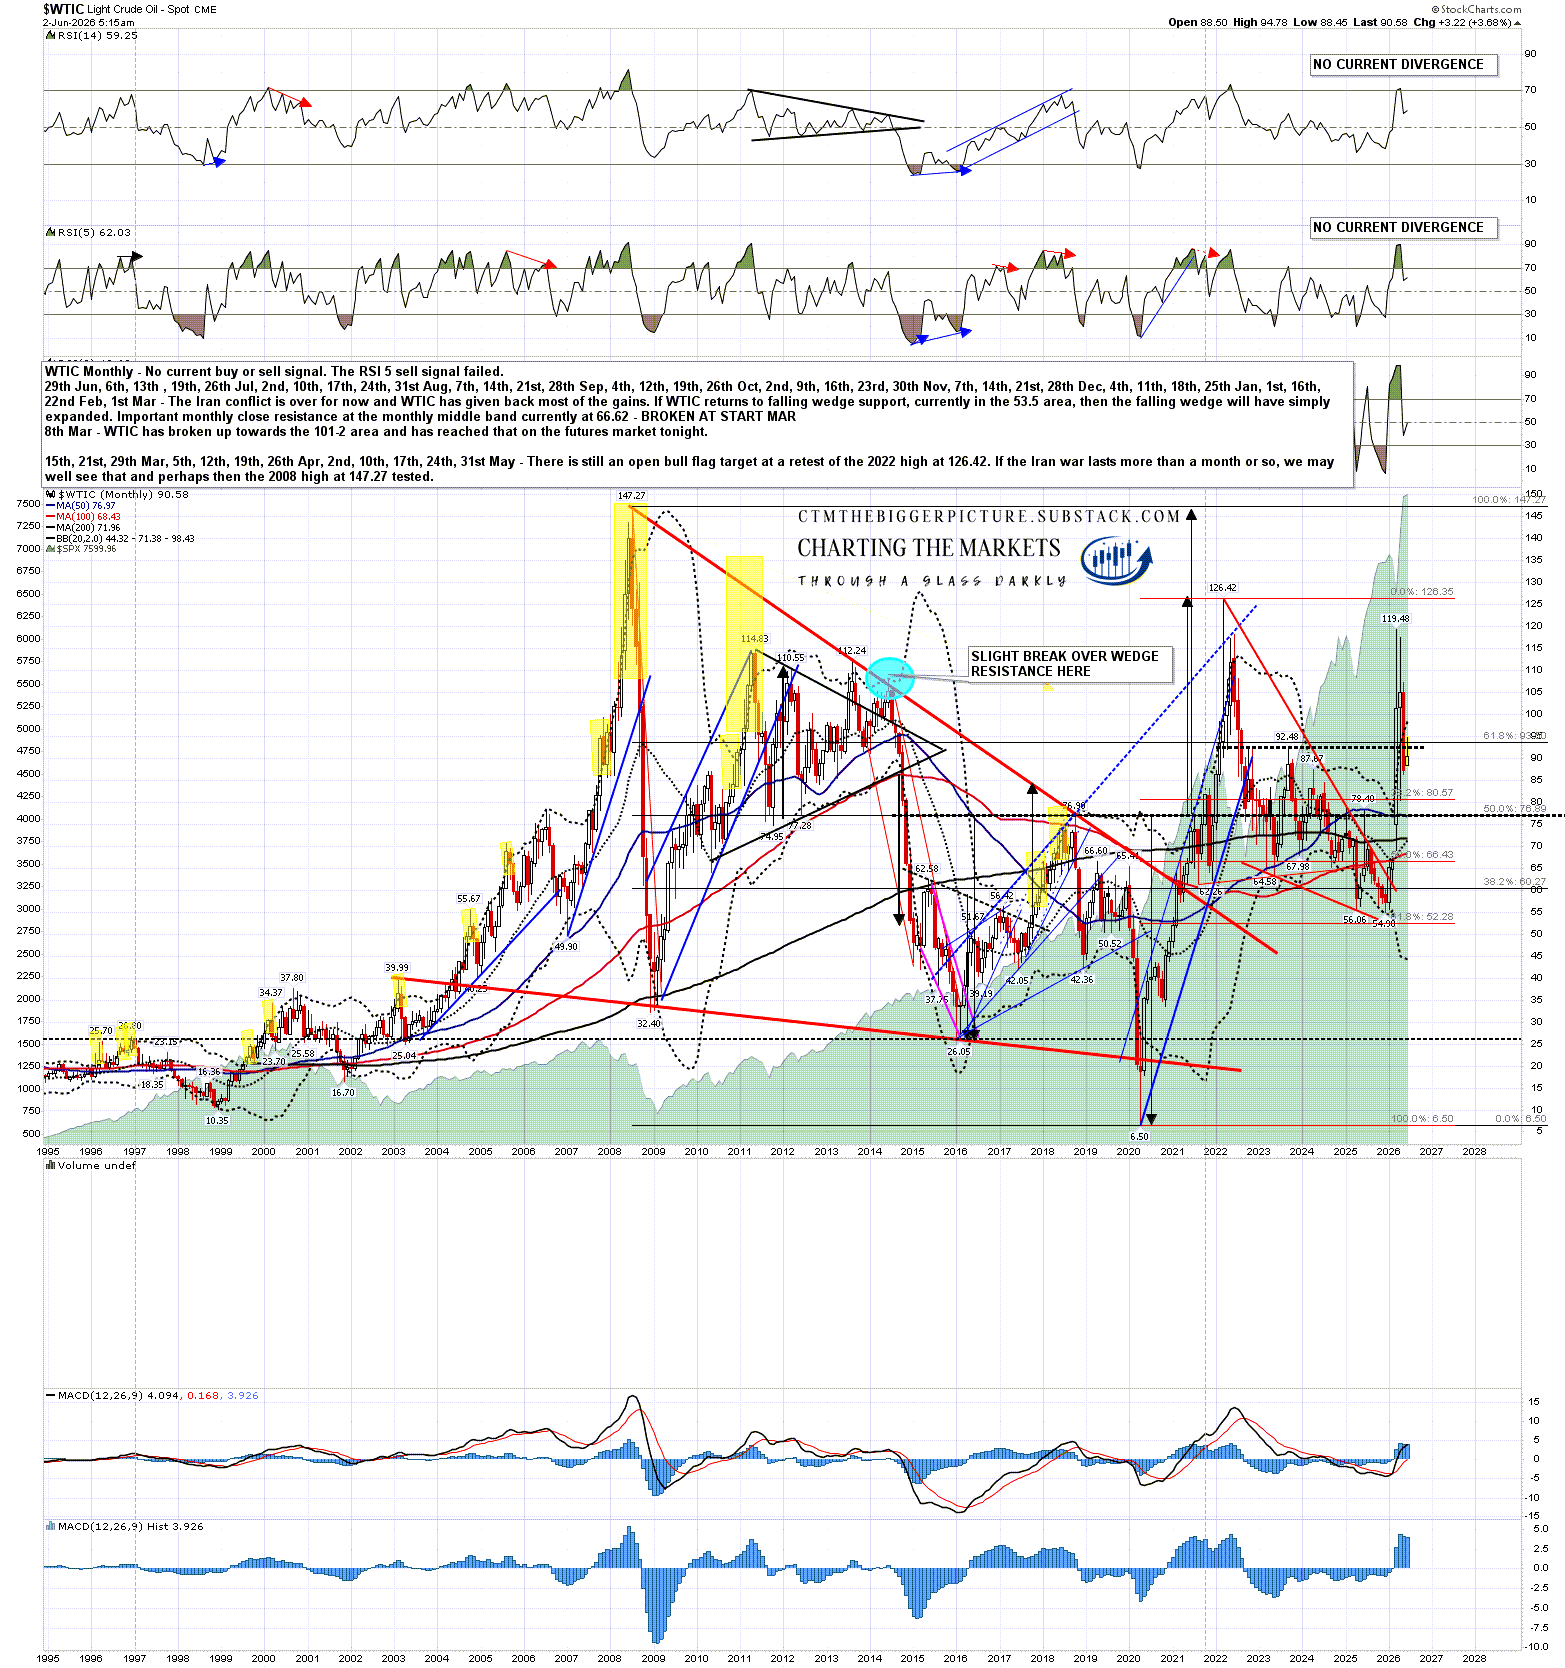
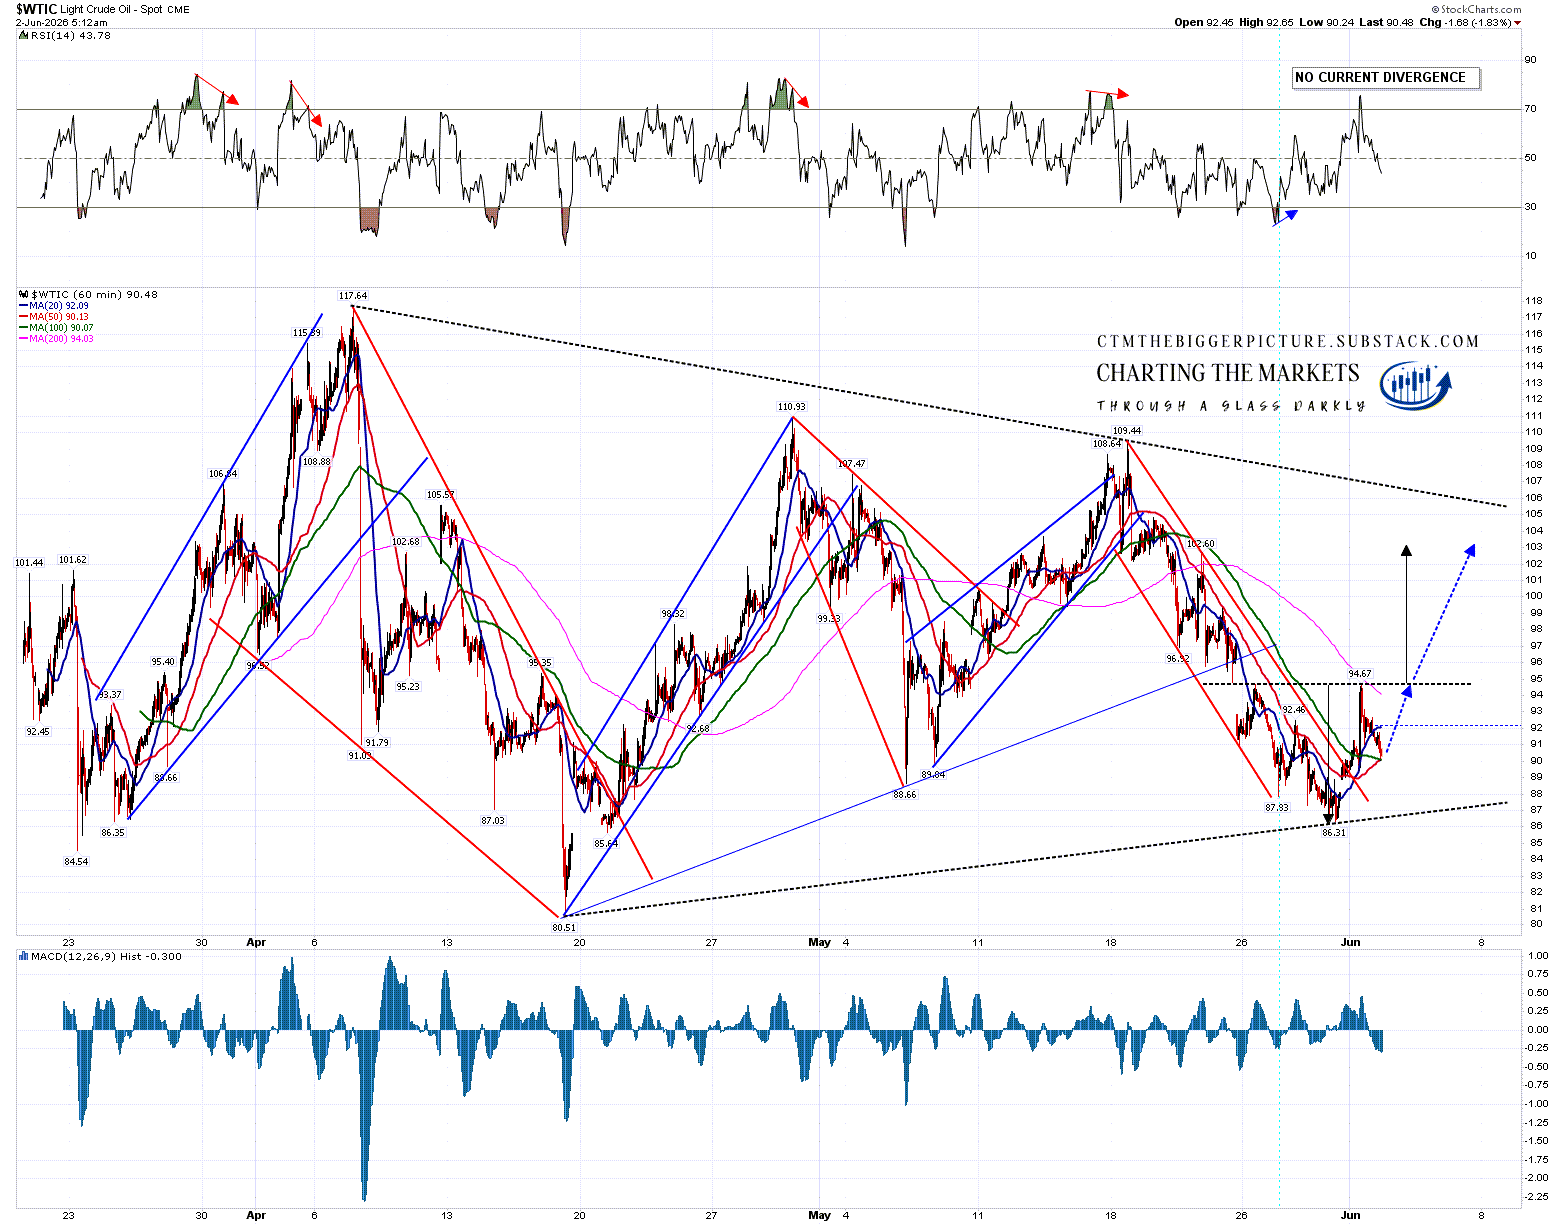
Oil - I think it is now very likely that Brent Crude and West Texas Intermediate Crude will hit new all time highs over $150 within weeks, and that we may well see prices in the $200 to $250 range within months. Gas at the US pump will likely rise into the $6 to $9 range and oil will likely be over $100 on a monthly average basis for the rest of this year.
Bonds - US Inflation will likely go back over 5% within two months and may go over 7% by the end of the year. Ten year and thirty year Treasury yields will likely go over a key psychological level at 6% over the summer and may reach 9% before the next big high on yields is made.
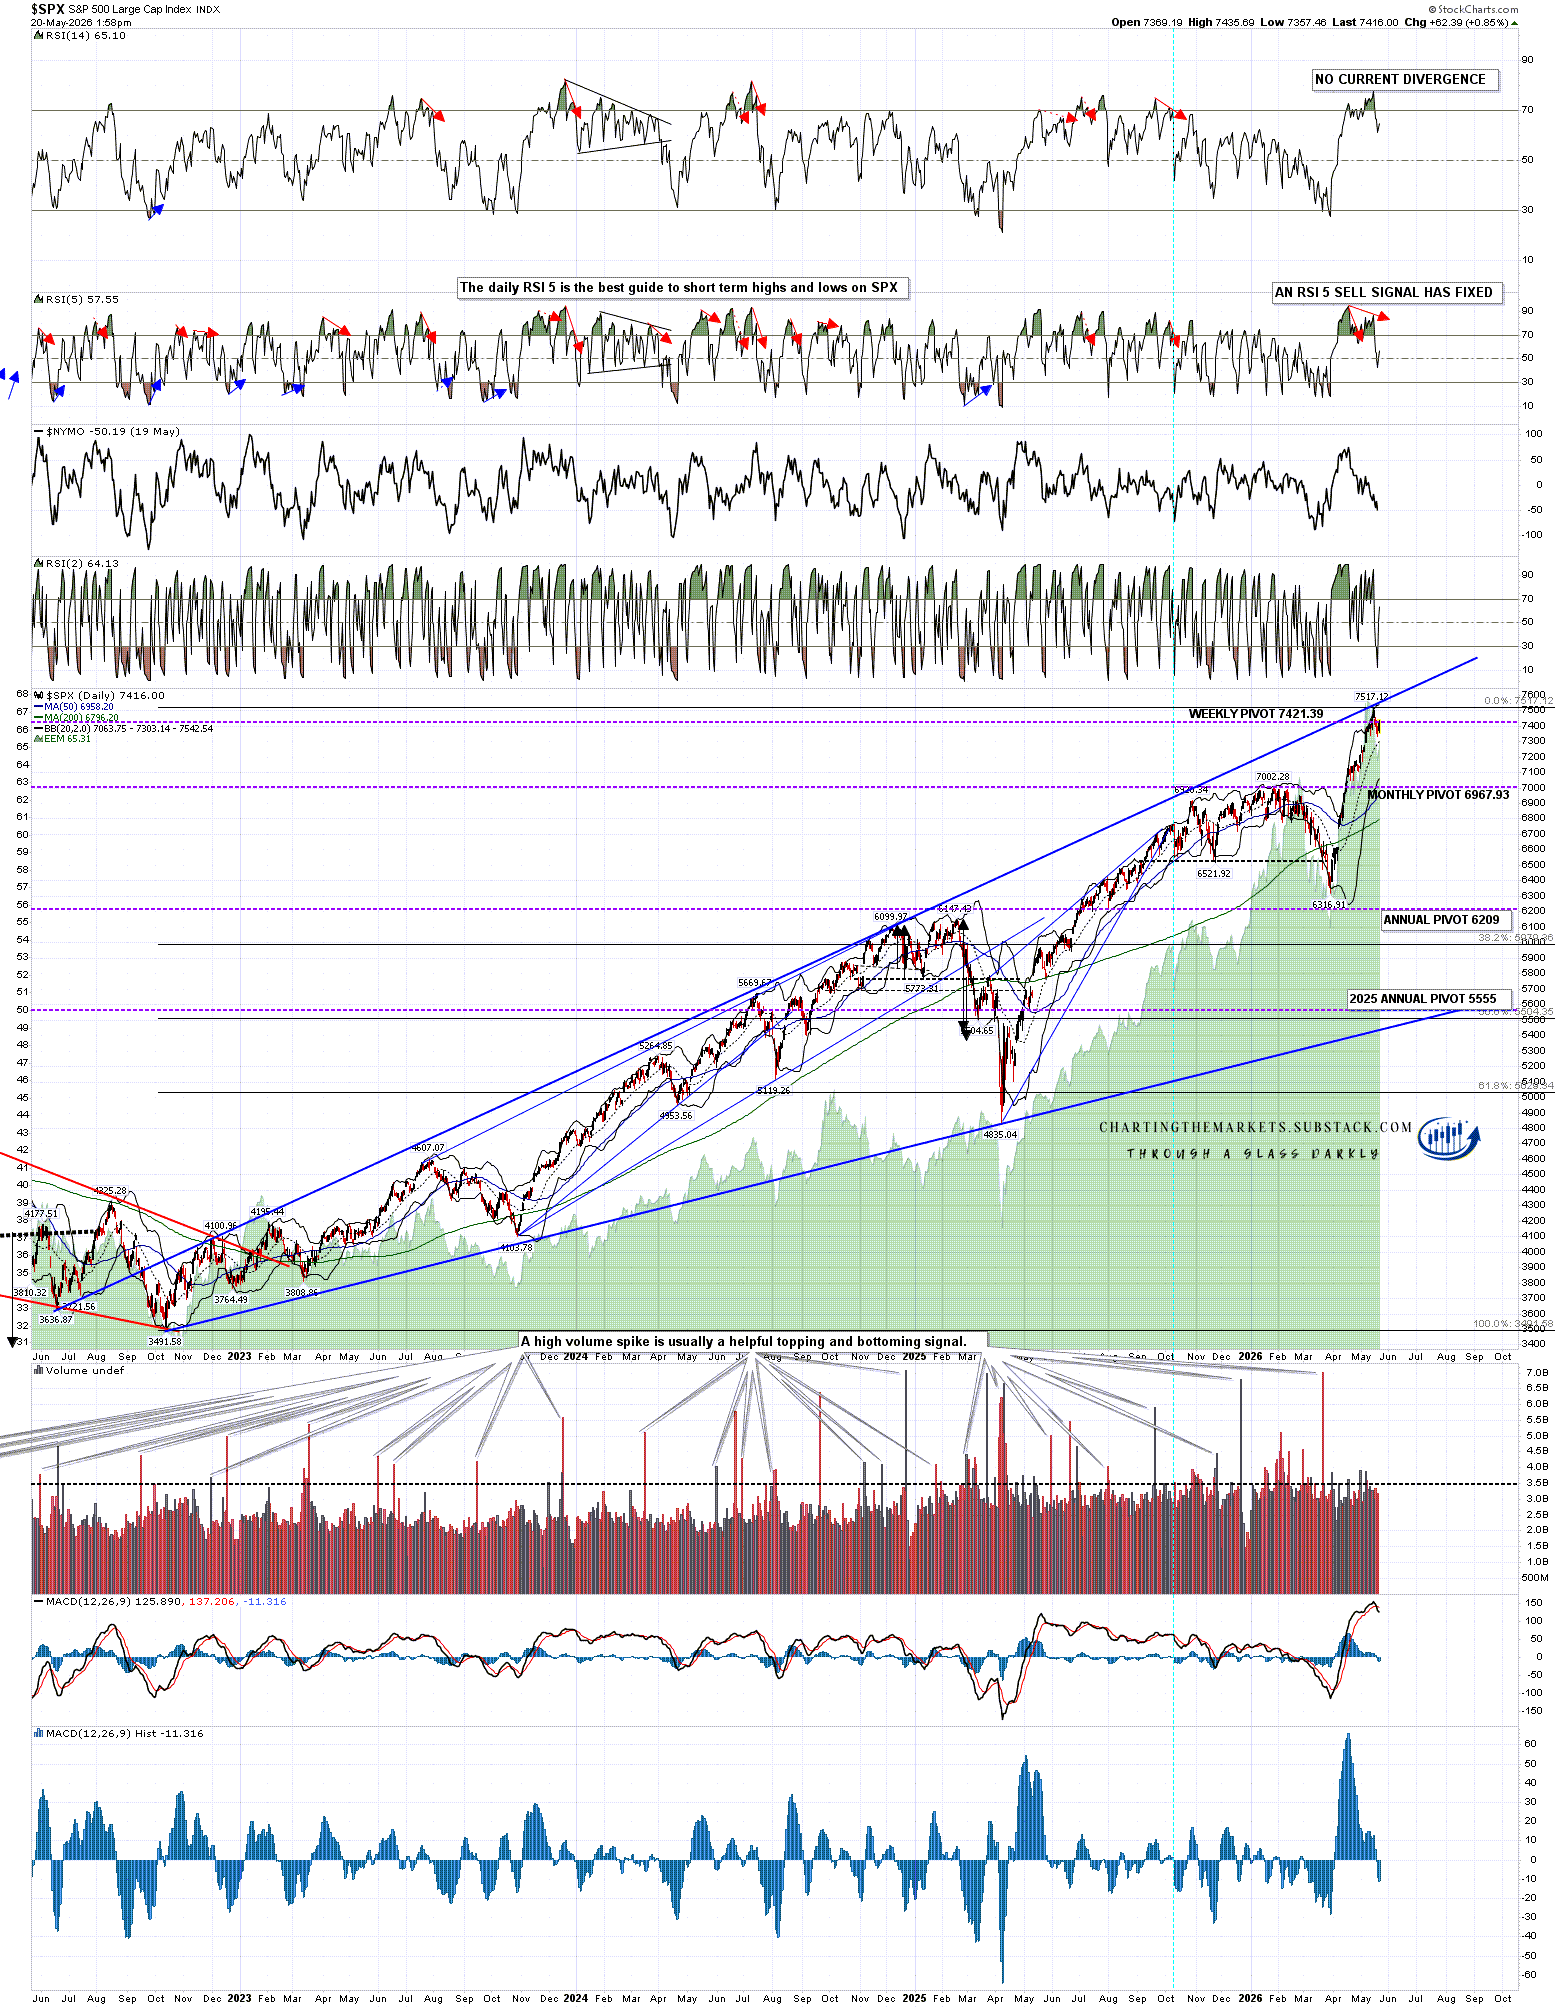
Equities - Looking at SPX I’ll be looking for at least a decline into the rising support trendline from the October 2022 low, currently in the 5400 area. On a break below I would be looking for a retest of the April 2025 low at 4835.04.
Obviously this is a bearish take, but I have not felt this bearish about equities since summer 2008 and February 2020. There is good reason to be bearish here. When will all this happen? We’ll have to find out the usual way, by waiting to see, but I like the odds.
If you like my analysis and would like to see more, please take a free subscription at my chartingthemarkets substack, where I publish these posts first. I also do a premarket video every day on equity indices, bonds, currencies, energies, precious commodities and other commodities at 8.45am EST, but only for paying subscribers. Other places to find me are my page on the platform previously known as twitter, and my YouTube channel.