
In my last post on Thursday last week I was, among other things, looking at a sharply upsloping H&S on Bitcoin (BTCUSD) that had broken down with a target in the 92,000 area, though I was expecting that H&S to reject back up into the highs, and over last weekend Bitcoin broke down into a low at 97.7k.
On the face of it that was looking promising for the H&S to reach target but in my premarket video on Monday I put the case against that, on the basis that so far at least, this was looking like a backtest of the daily middle band as part of a bullish consolidation. In my premarket video on Tuesday I had drawn in the obvious bull flag setups on both Bitcoin and Solana (SOLUSD).
Fast forward to today and those bull flag setups are now breaking up, so let’s review.
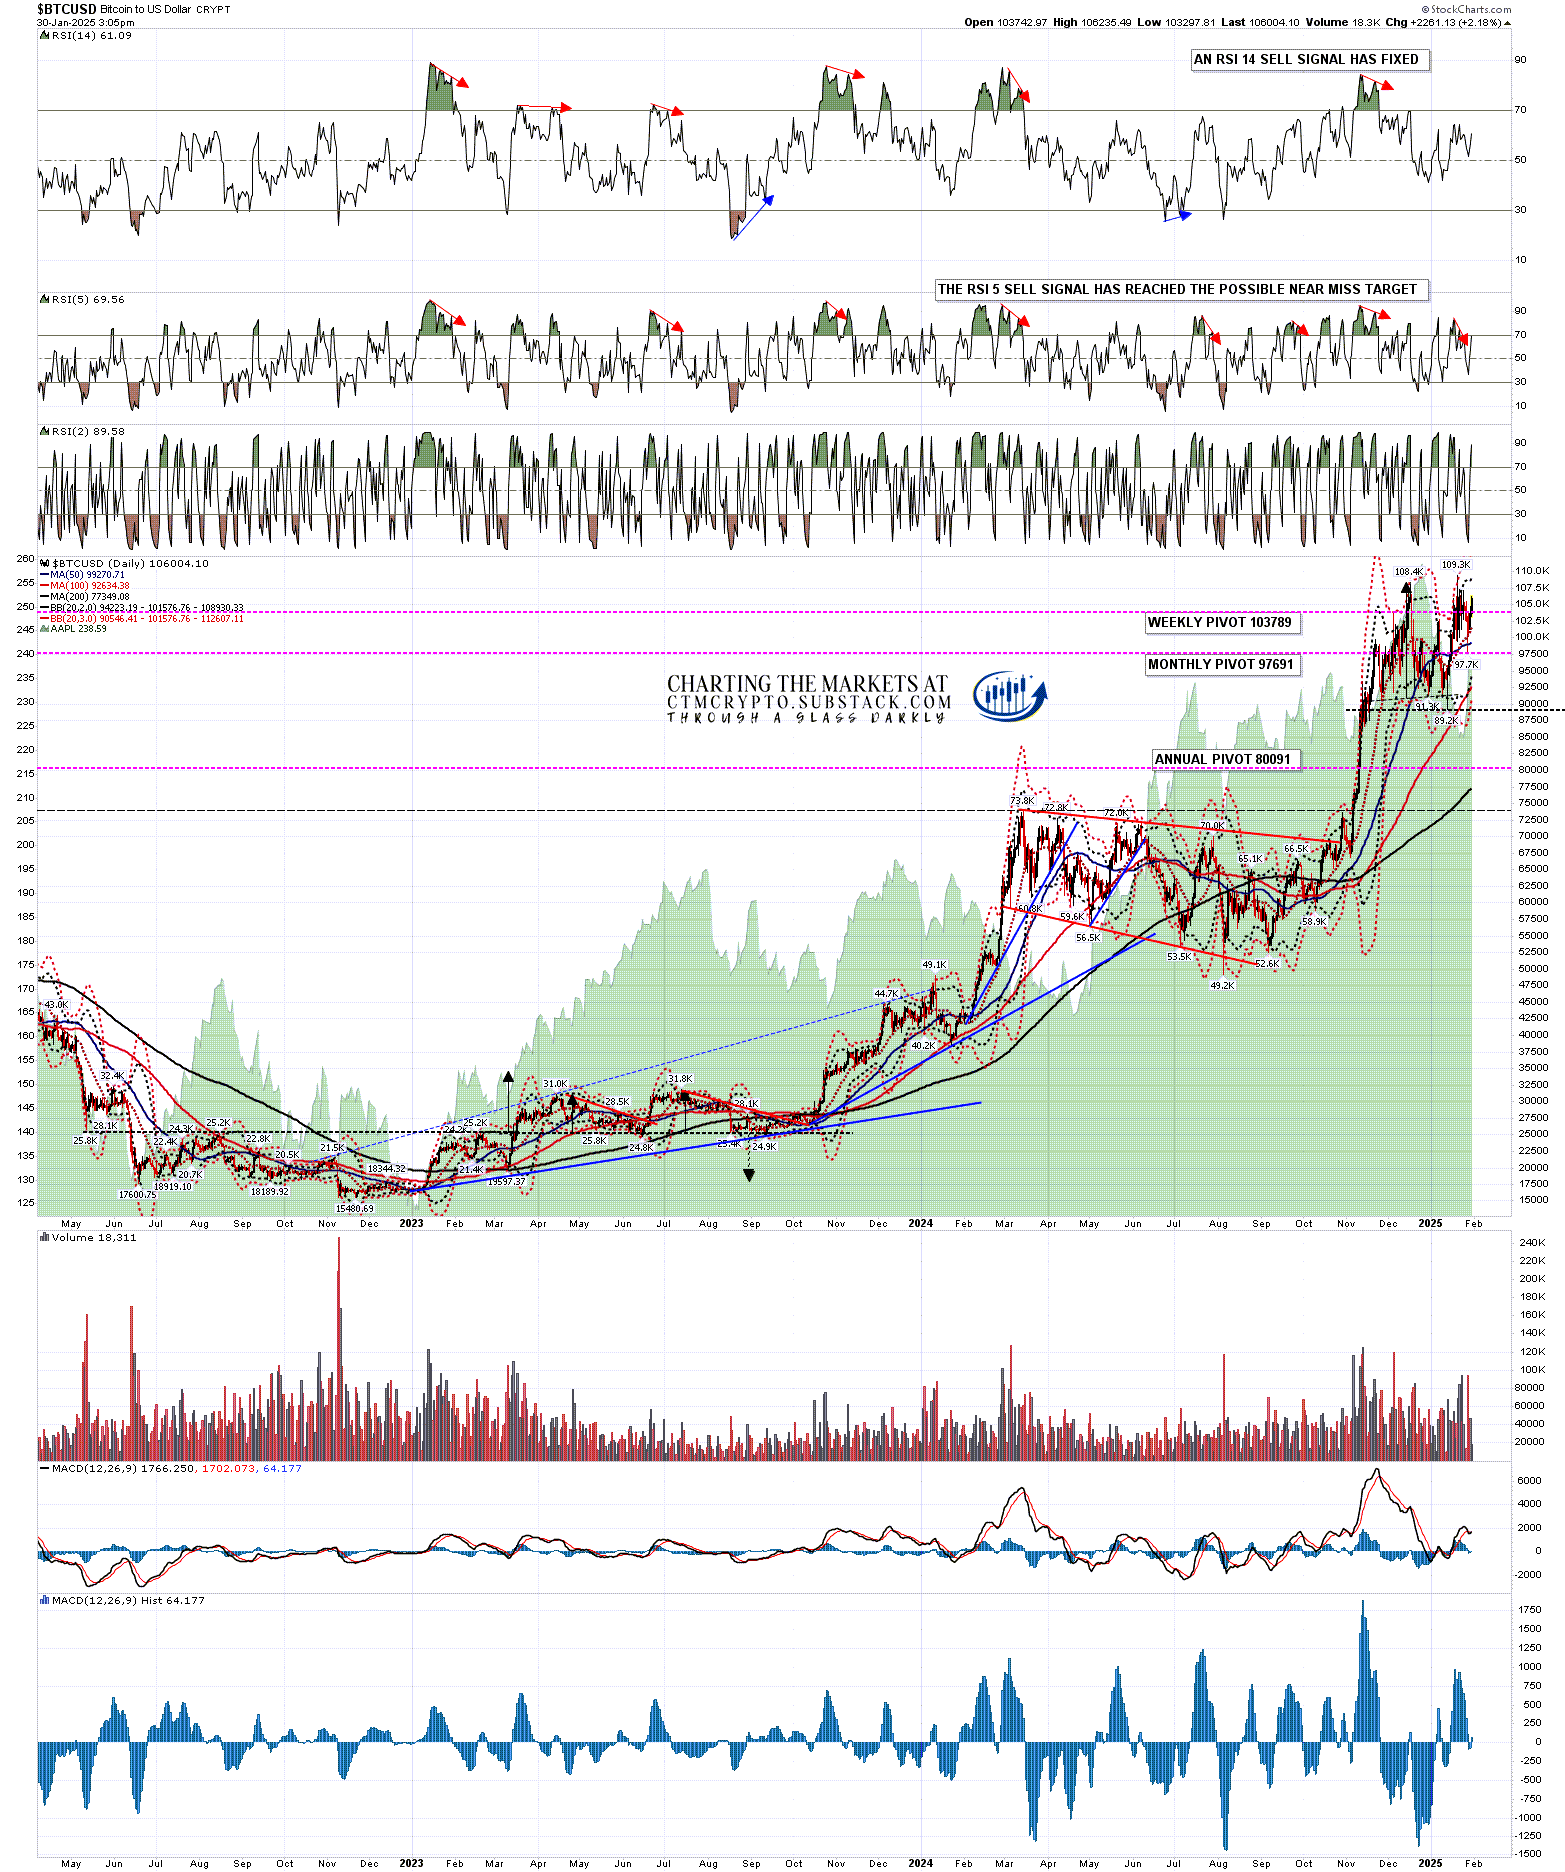
On Monday I was noting that the daily middle band on Bitcoin has been backtested and that as long as the daily middle band held as support, there was nothing inherently bearish about that backtest. The daily middle band has continued to hold as support since then.
BTCUSD daily chart:
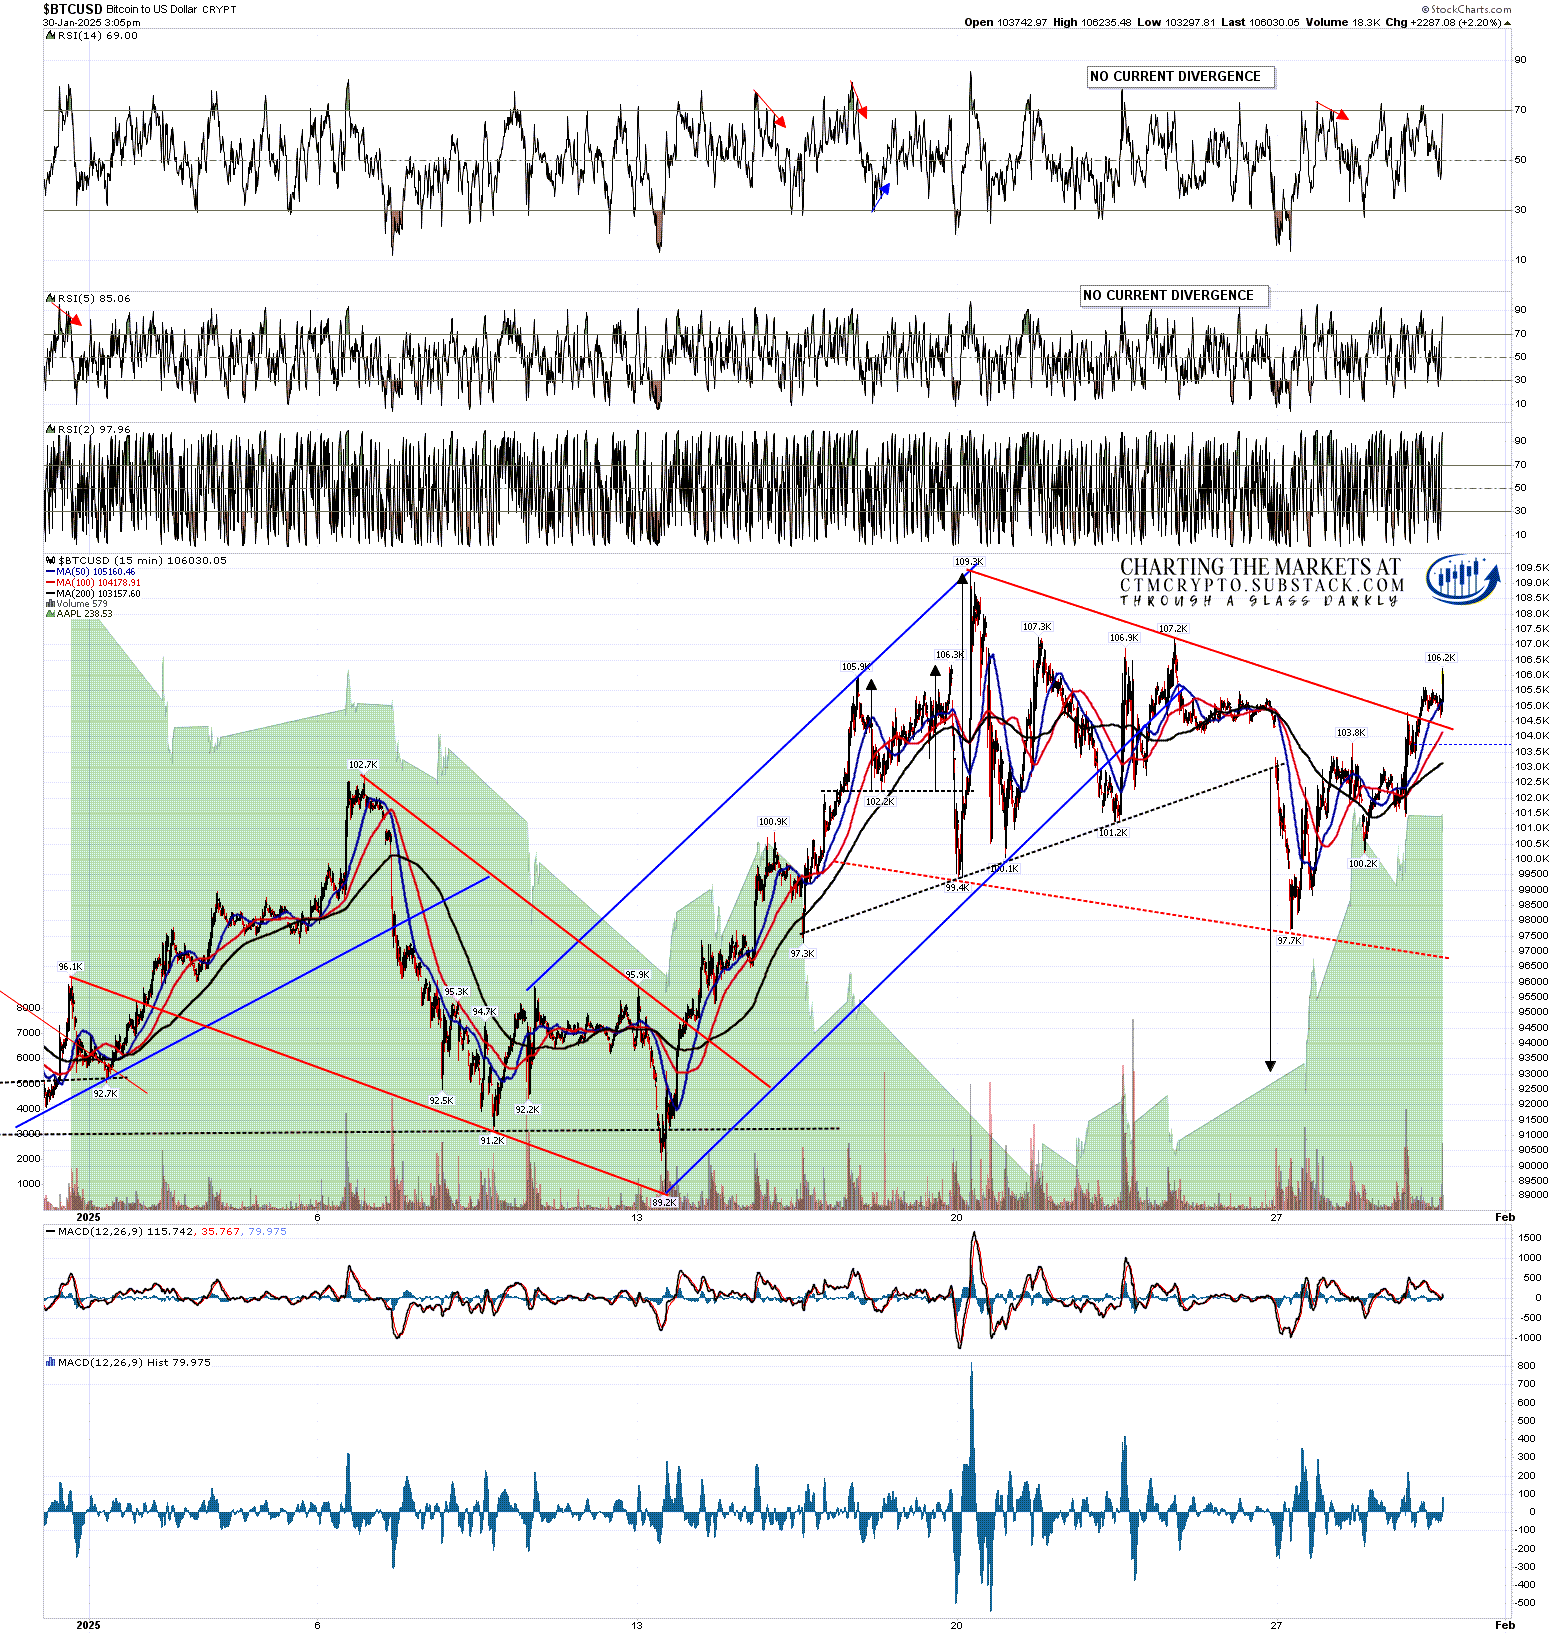
On the Bitcoin 15min chart I drew the obvious bull flag setup on Tuesday morning and that has broken up overnight with a target at a retest of the all time high at 109.3k. In the event that Bitcoin should now break up over the H&S right shoulder high at 107.3k, as I mentioned a week ago, the H&S would be invalidated and that would fix a second target back at a retest of the all time high at 109.3k.
Bigger picture I was also talking about a possible larger retracement after that retest of the all time high, but as Bitcoin goes higher, that all time high retest is looking very and increasingly compelling.
BTCUSD 15min chart:
On Solana I was also noting at the start of this week that the daily middle band had been backtested and that, as with Bitcoin, there was nothing inherently bearish about that.
SOLUSD daily chart:

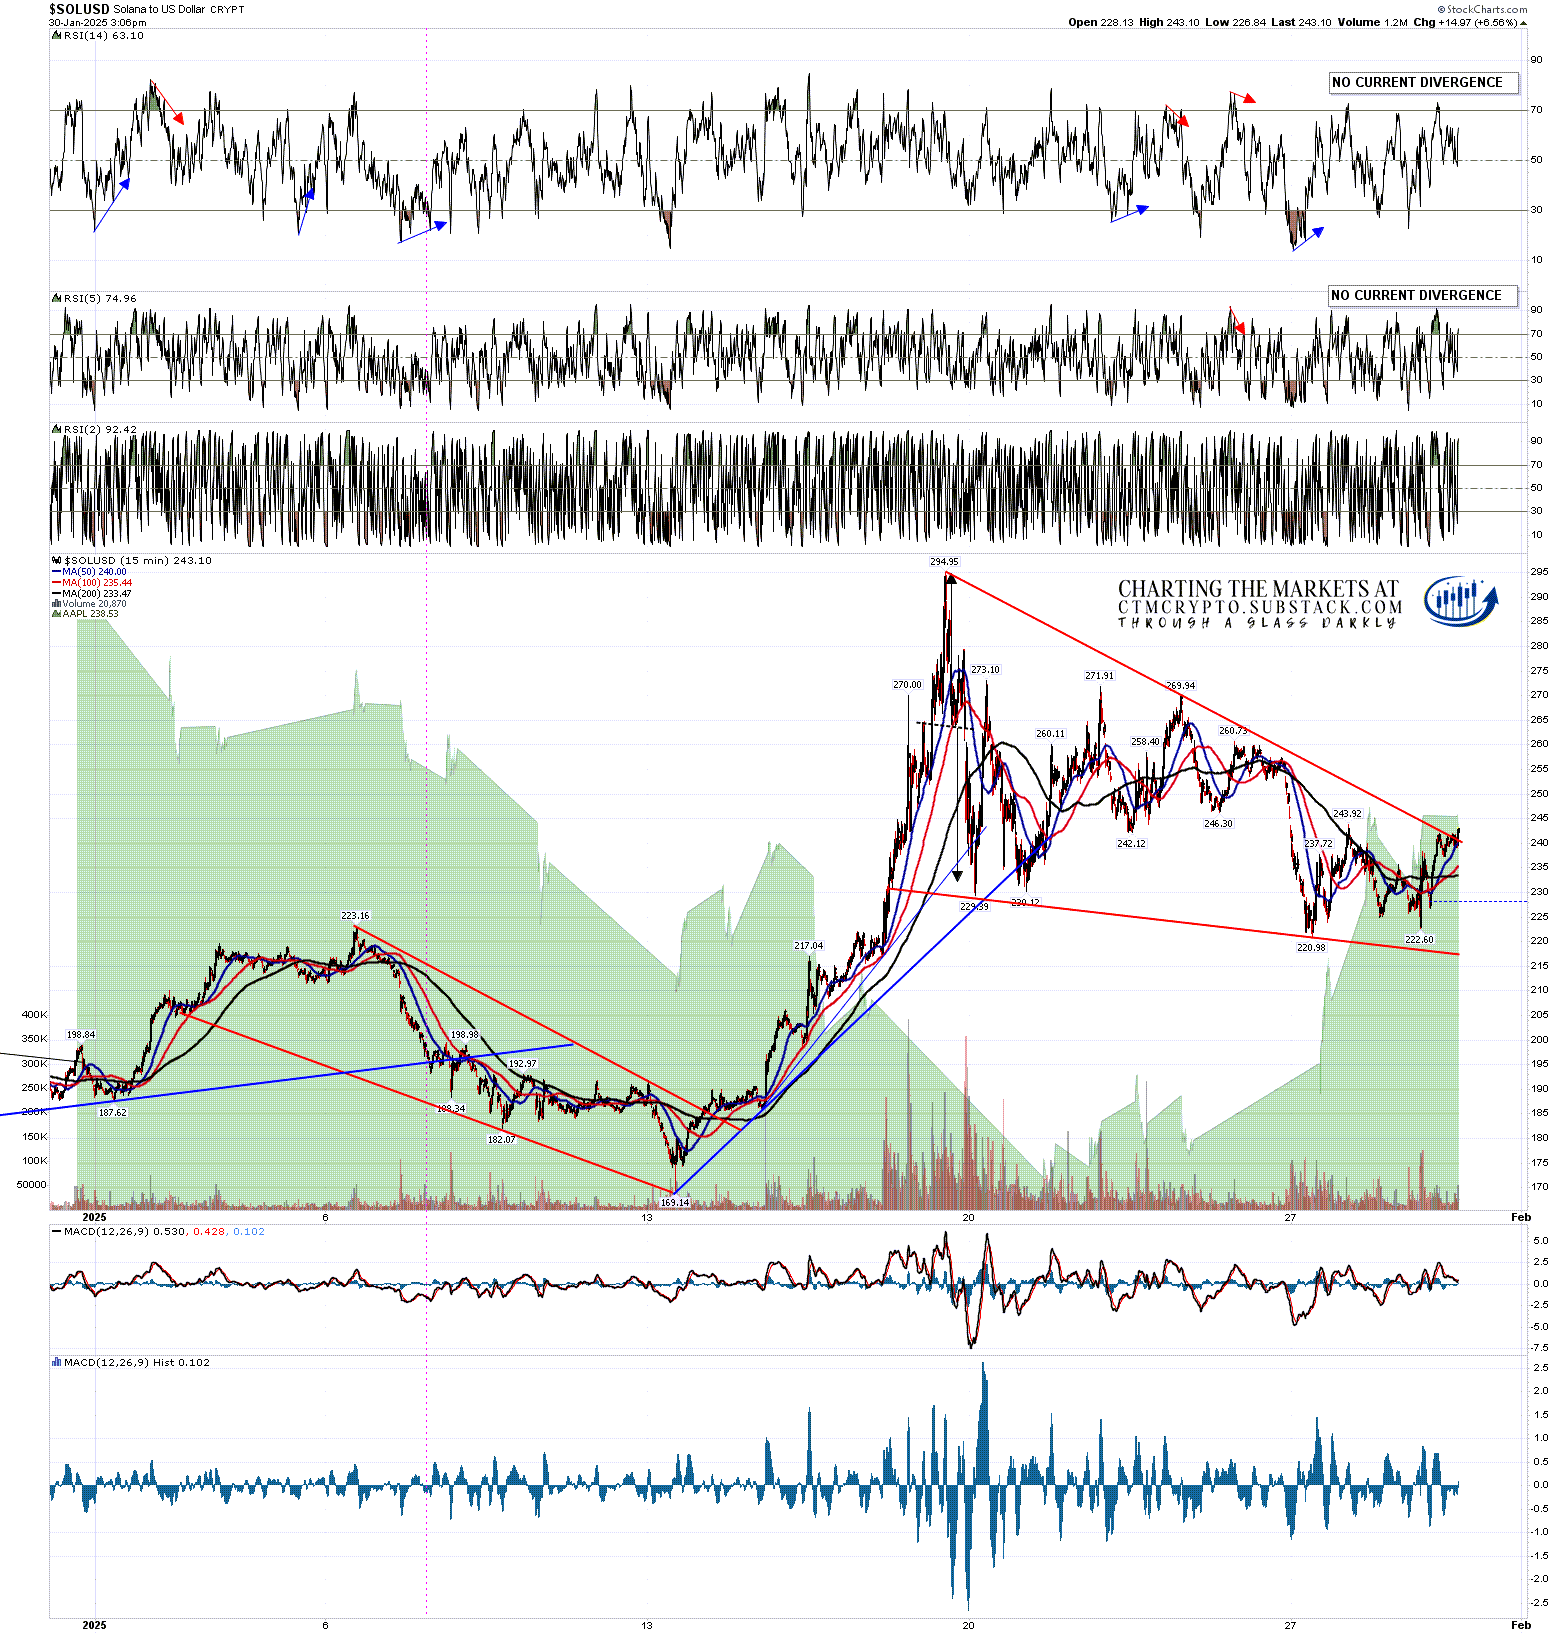
On the 15min chart I had drawn in the very nice looking bull flag setup on Tuesday morning and that is now also breaking up with at target at a retest of the all time high at 294.95. That isn’t the only option here of course, but it is the obvious one, and this was avery high quality bull flag falling wedge with three clear touches on both the support and resistance trendlines.
SOLUSD 15min chart:
I was talking about the relative underperformance on Ethereum (ETHUSD) a week aga and that has continued. Ethereum was struggling to get back over the daily middle band then, and the bands have been compressing as they often would before a big move in either direction. Ethereum is testing the daily middle band as resistance again today.
An H&S had broken down on Ethereum with a target in the 2100 area, and that H&S has not been invalidated and could still make that target. We’ll see.
ETHUSD daily chart:

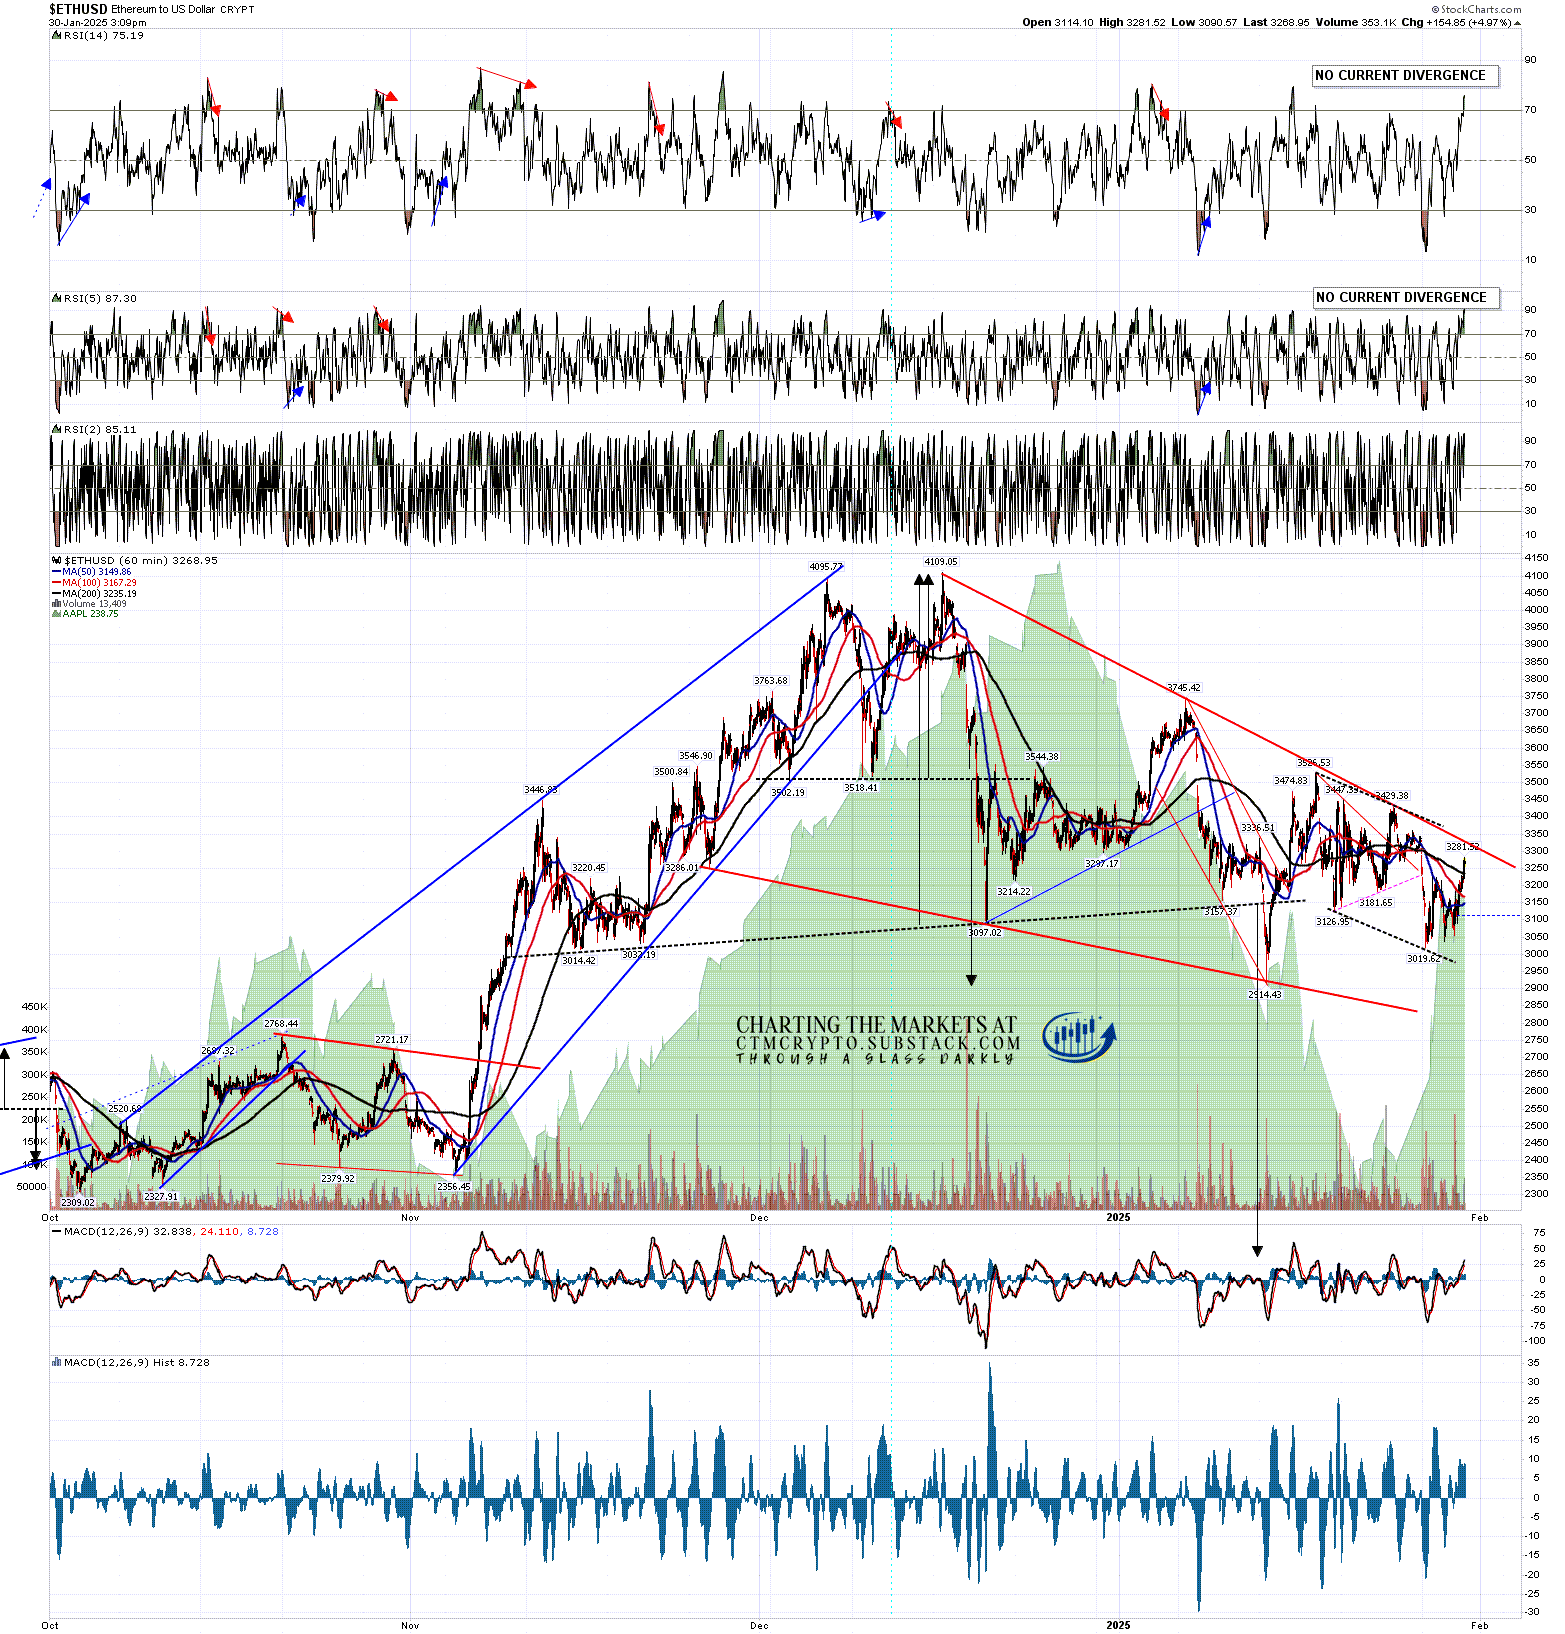
Is there a bullish setup forming on Ethereum? Yes, though it has been a very slow mover. There is a bull flag setup and Ethereum is getting close to flag resistance, currently in the 3330 area. If that breaks up, that would fix a target at a retest of the late 2024 high at 4109.05, though unless someone can light an encouraging fire under Ethereum buyers I am doubtful about that delivering.
That said, a further break over the H&S right shoulder high at 3745.42 would invalidate the H&S and fix a second target at the retest of the 2024 high and, if seen, that would be more impressive, so we’ll see if that happens.
ETHUSD 60min chart:
In the short term I am really liking retests of the all time highs on Bitcoin and Solana. We’ll see how that goes.
On the bigger picture I am still leaning towards a retracement / consolidation on Crypto in the first half of 2025 and then strong new all time highs with a very possible bull market high pencilled in close to the end of the year. That scenario would be a good match with past Crypto bull markets.
If you’d like to see more of these posts and the other Crypto videos and information I post, please subscribe for free to my Crypto substack. I also do a premarket video every day on Crypto at 9.05am EST. If you’d like to see those I post the links every morning on my twitter, and the videos are posted shortly afterwards on my Youtube channel.
I'm also to be found at Arion Partners, though as a student rather than as a teacher. I've been charting Crypto for some years now, but am learning to trade and invest in them directly, and Arion Partners are my guide around a space that might reasonably be compared to the Wild West in one of their rougher years.

No comments:
Post a Comment