The old market saw goes that you should sell in May and go away, and rarely if ever in my view has that been more true than it is this year.
That isn’t to say that equity indices can’t go higher in the short term. I wrote a post on Tuesday looking at possible upside targets on SPX and QQQ that I would like to see hit, and have more modest upside targets on DIA and IWM that I’ll also look at today.
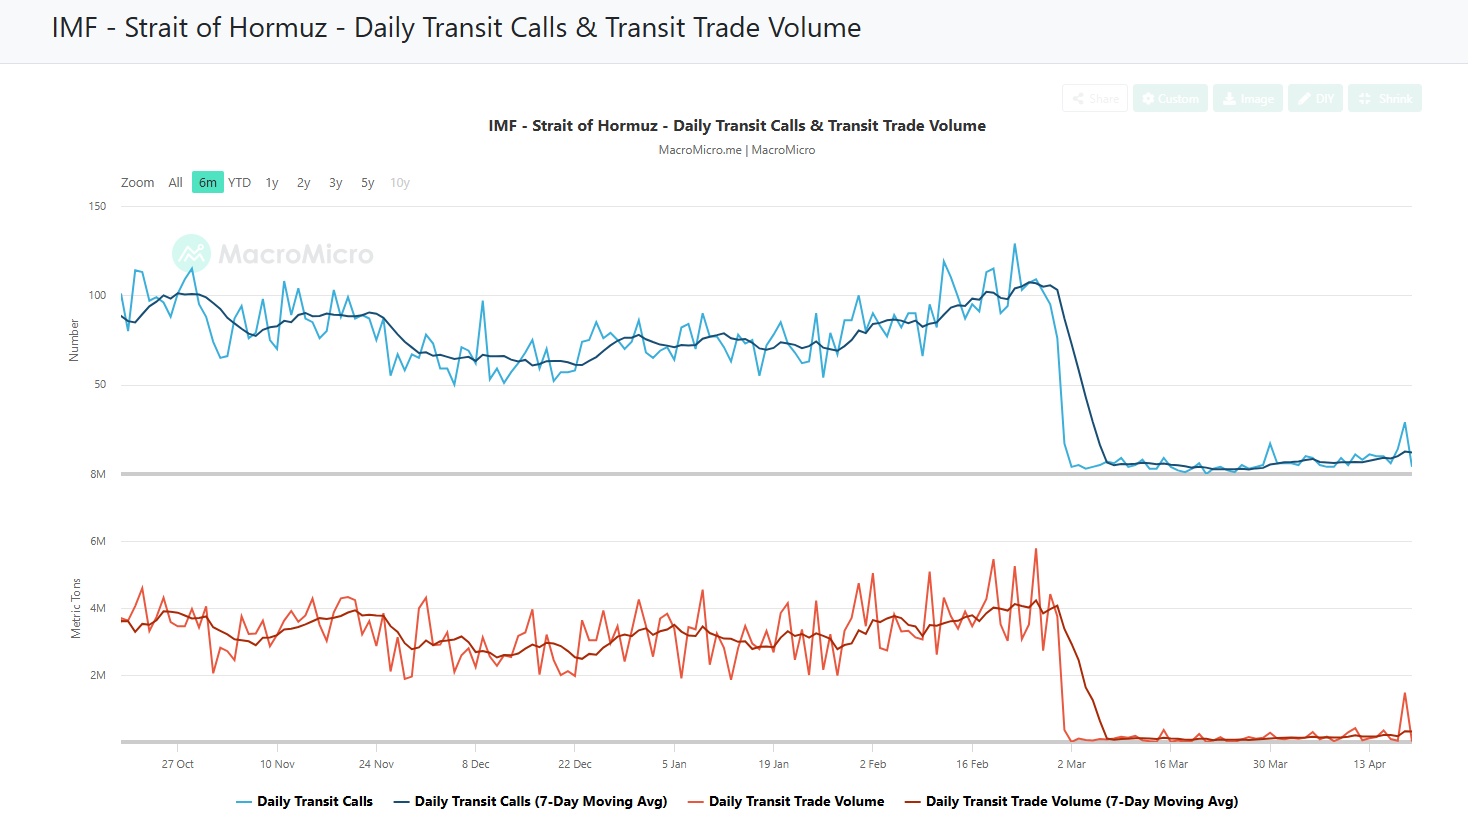
When we see the high for this move made, whether at those targets or lower, I think the prospects for equities over the summer look bleak. I covered some of the reasons for that in a post last Thursday on my The Bigger Picture substack looking at why the Iran War was largely irrelevant in the context of the economic shock being created by the closure of the Strait of Hormuz. If you haven’t already read that I’d suggest that you do that.
Before I get onto the markets today I’m going to make some predictions for oil, equity and bond markets over the rest of this year.
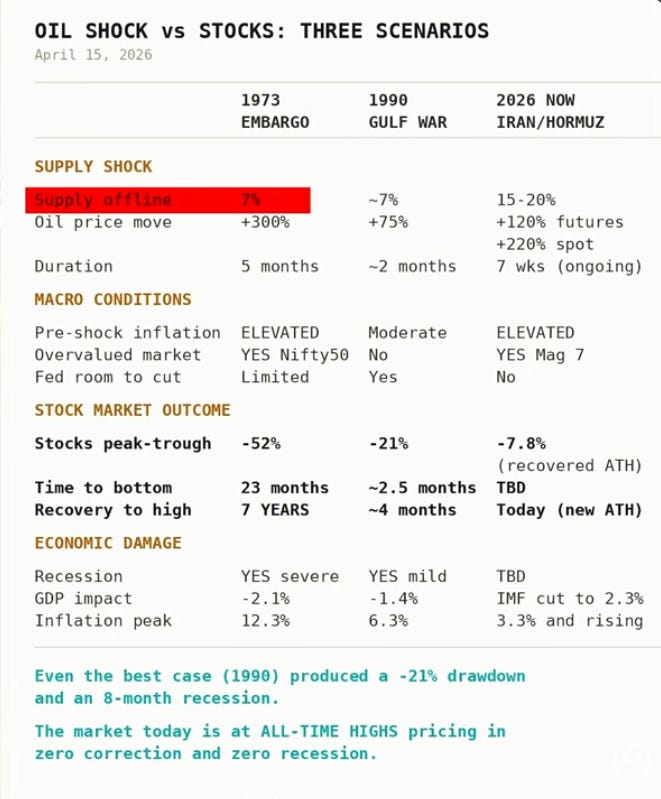
Oil - I think it is now very likely that Brent Crude and West Texas Intermediate Crude will hit new all time highs over $150 within weeks, and that we may well see prices in the $200 to $250 range within months. Gas at the US pump will likely rise into the $6 to $9 range and oil will likely be over $100 on a monthly average basis for the rest of this year.
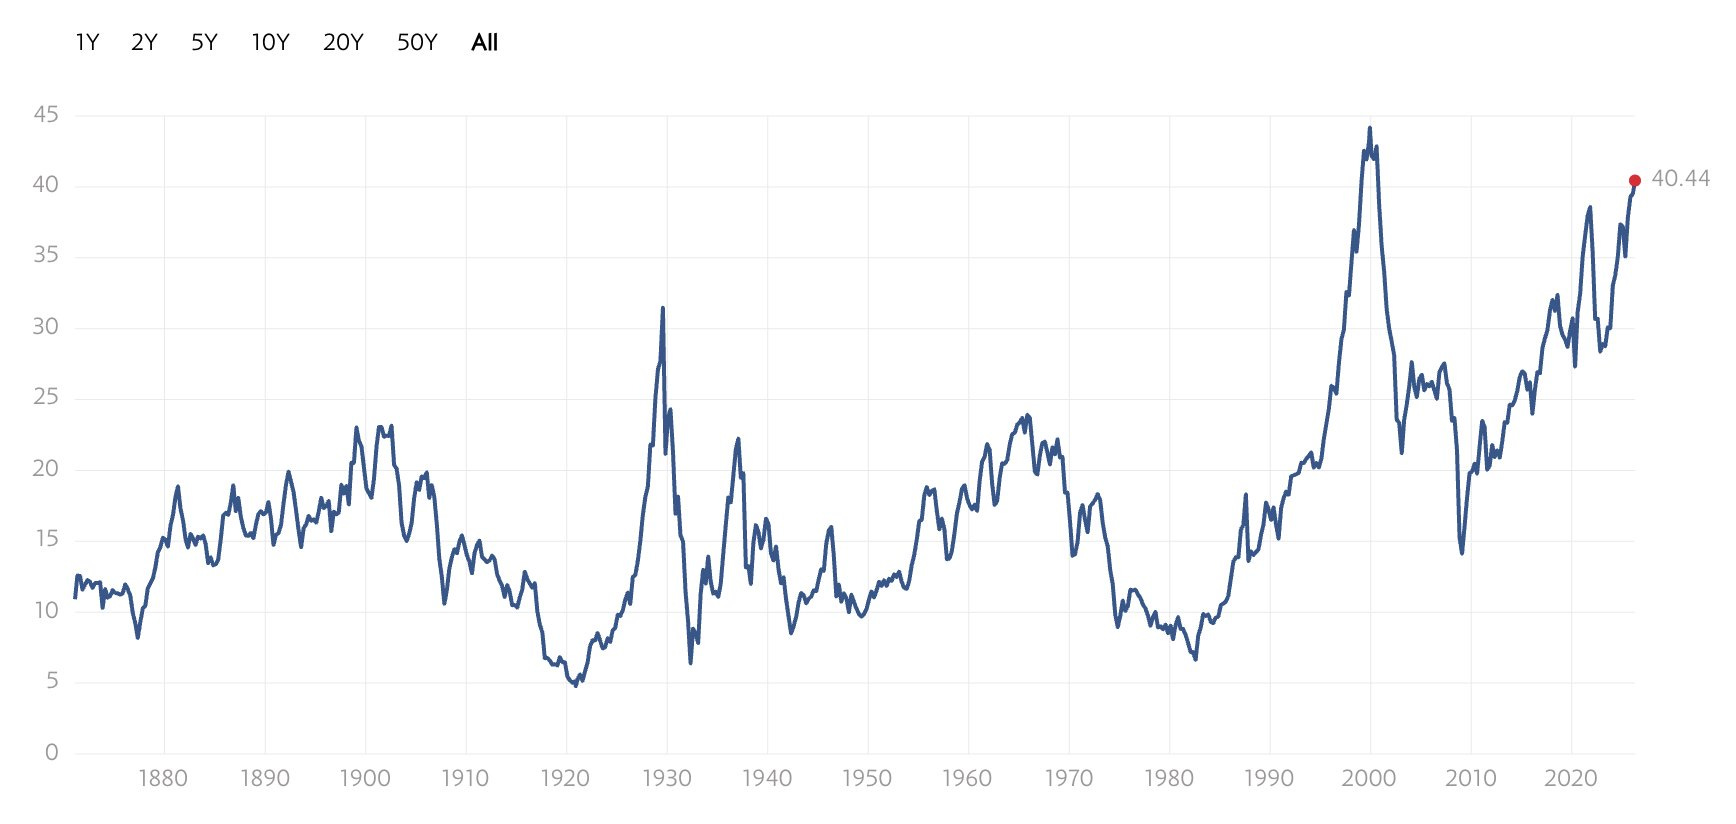
Bonds - US Inflation will likely go back over 5% within two months and may go over 7% by the end of the year. Ten year and thirty year Treasury yields will likely go over a key psychological level at 6% over the summer and may reach 9% before the next big high on yields is made.
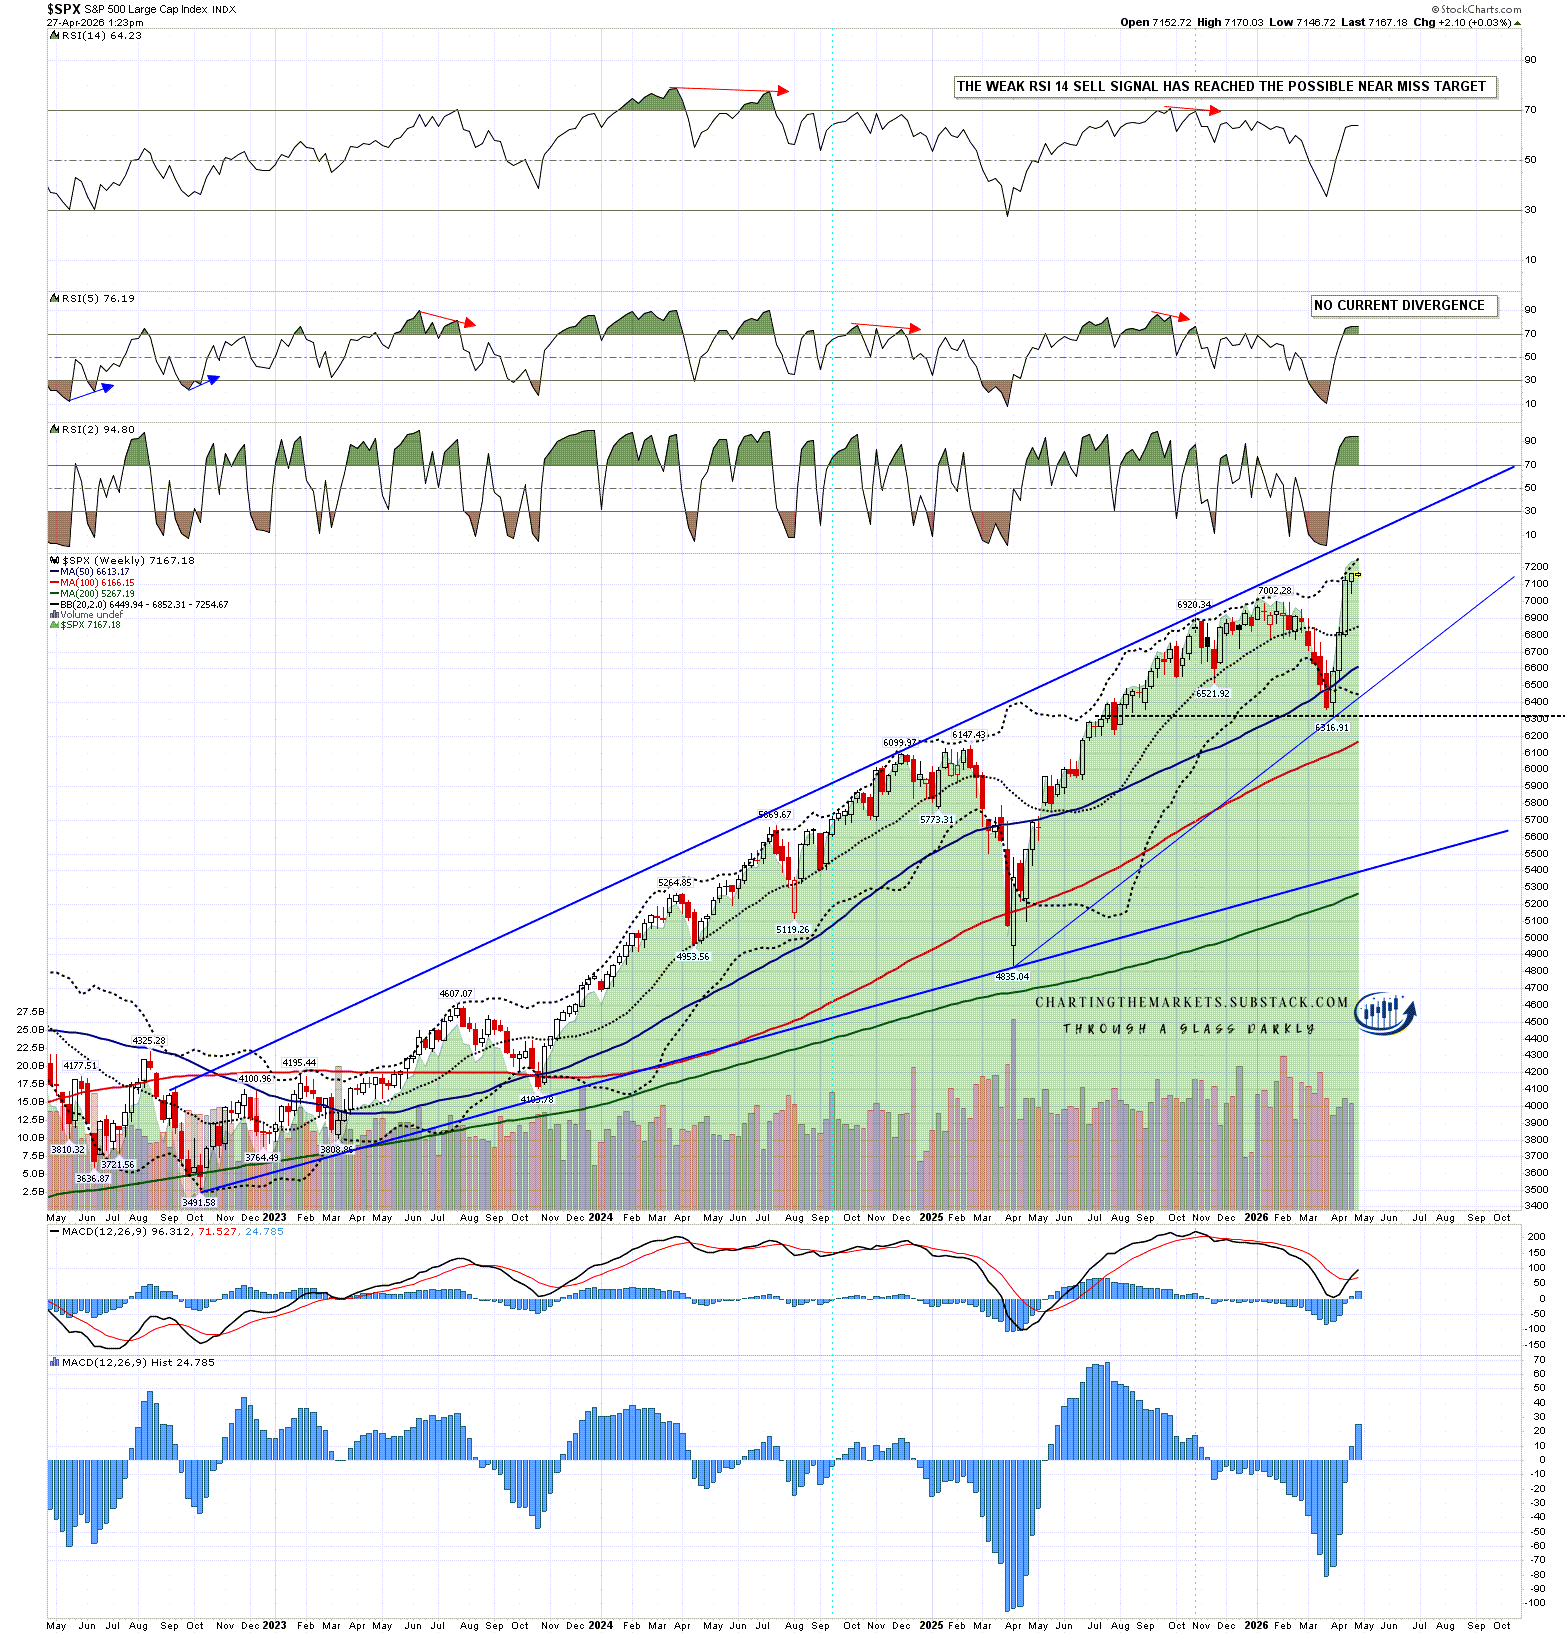
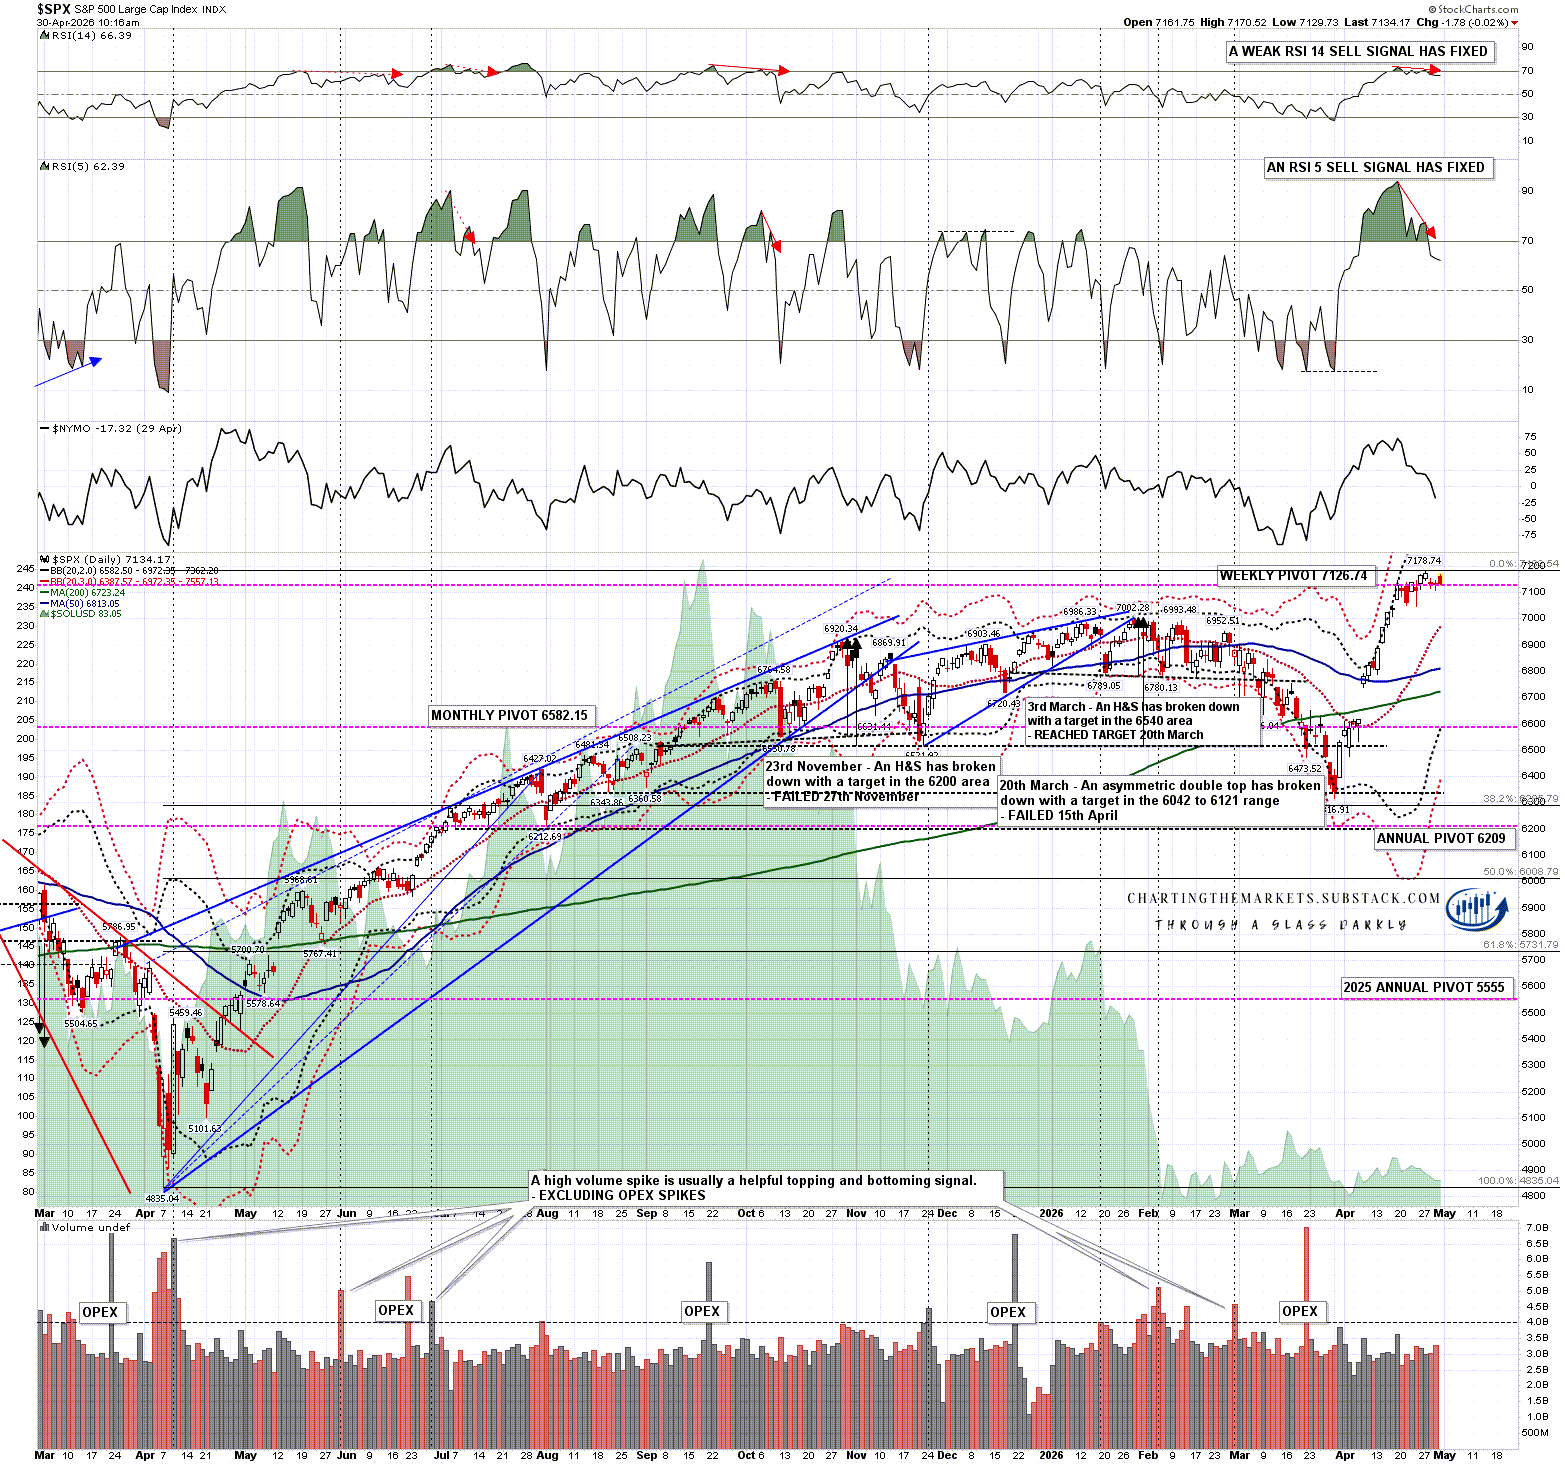
Equities - Looking at SPX I’ll be looking for at least a decline into the rising support trendline from the October 2022 low, currently in the 5400 area. On a break below I would be looking for a retest of the April 2025 low at 4835.04.
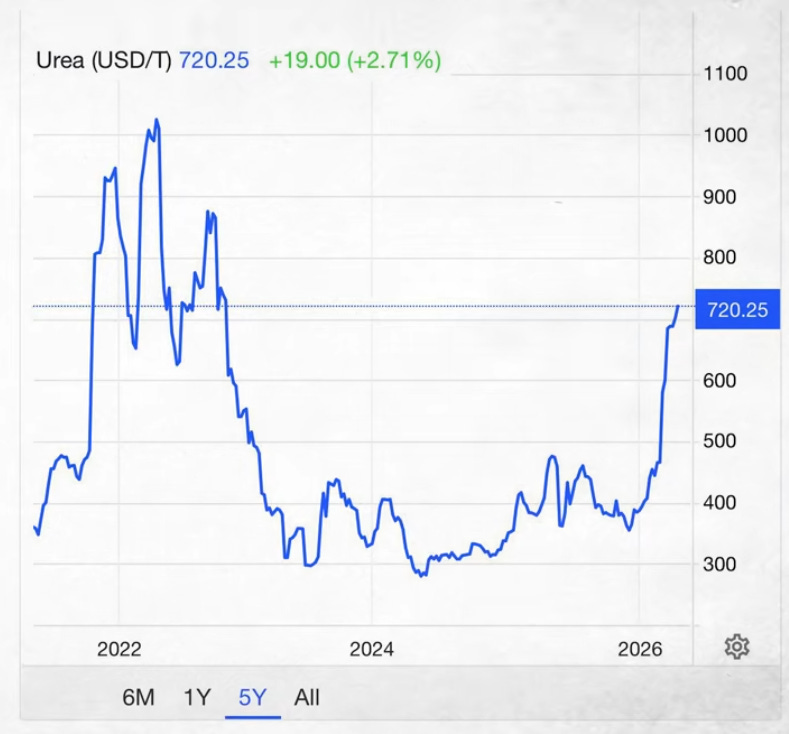
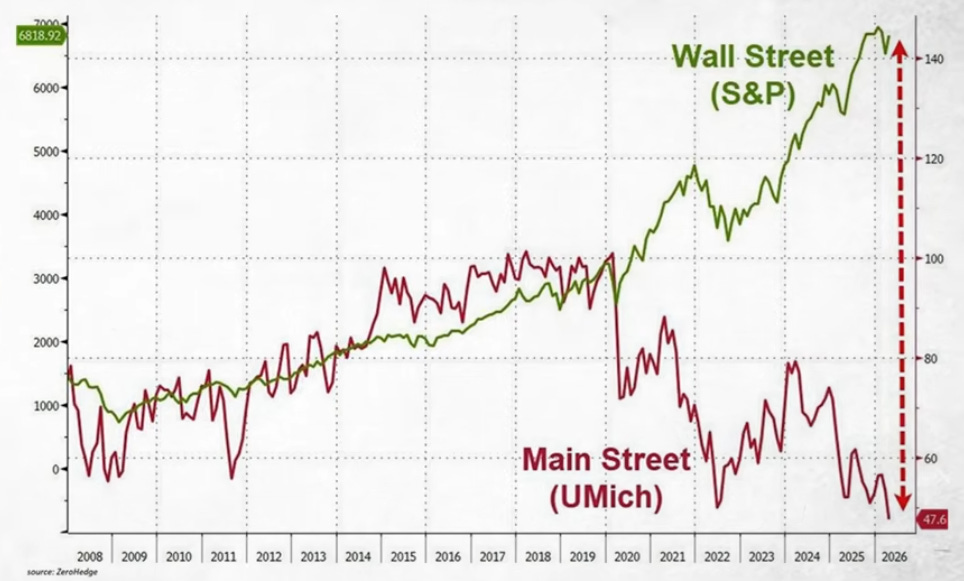
There will be other problems of course, a recession in the US and across much of the rest of the developed world now looks likely, food prices across the world are likely to spike up hard due to fertiliser prices and shortages, and helium shortages may well restrict world semiconductor production. Will the Fed ride in to the rescue? I think they may try, but their options look limited.
On to the shorter term markets which are at or close to all time highs:

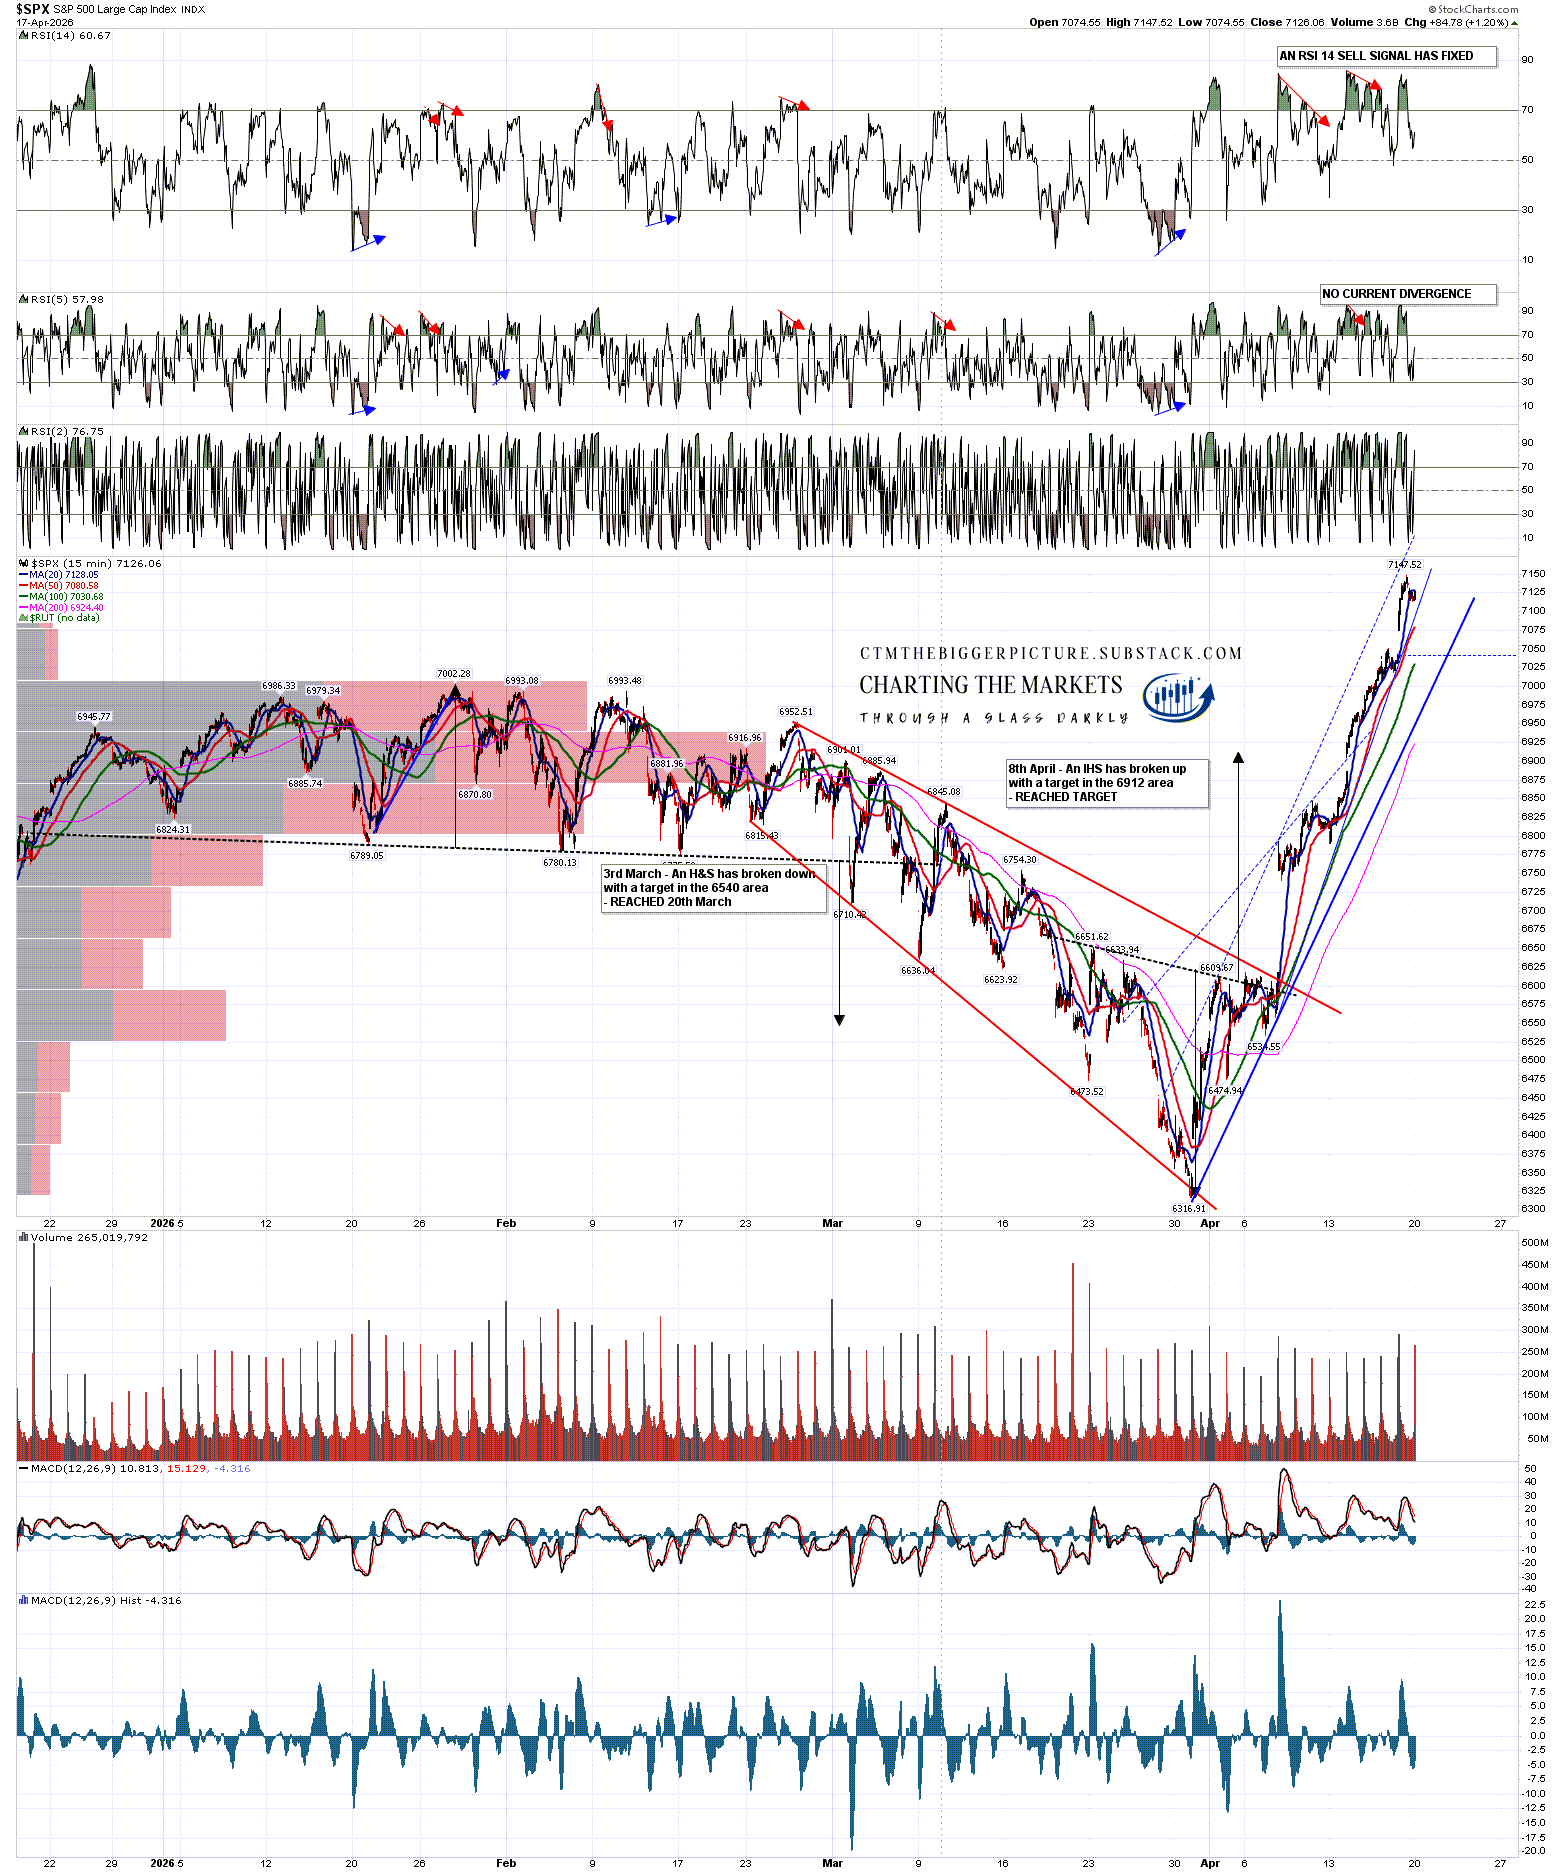
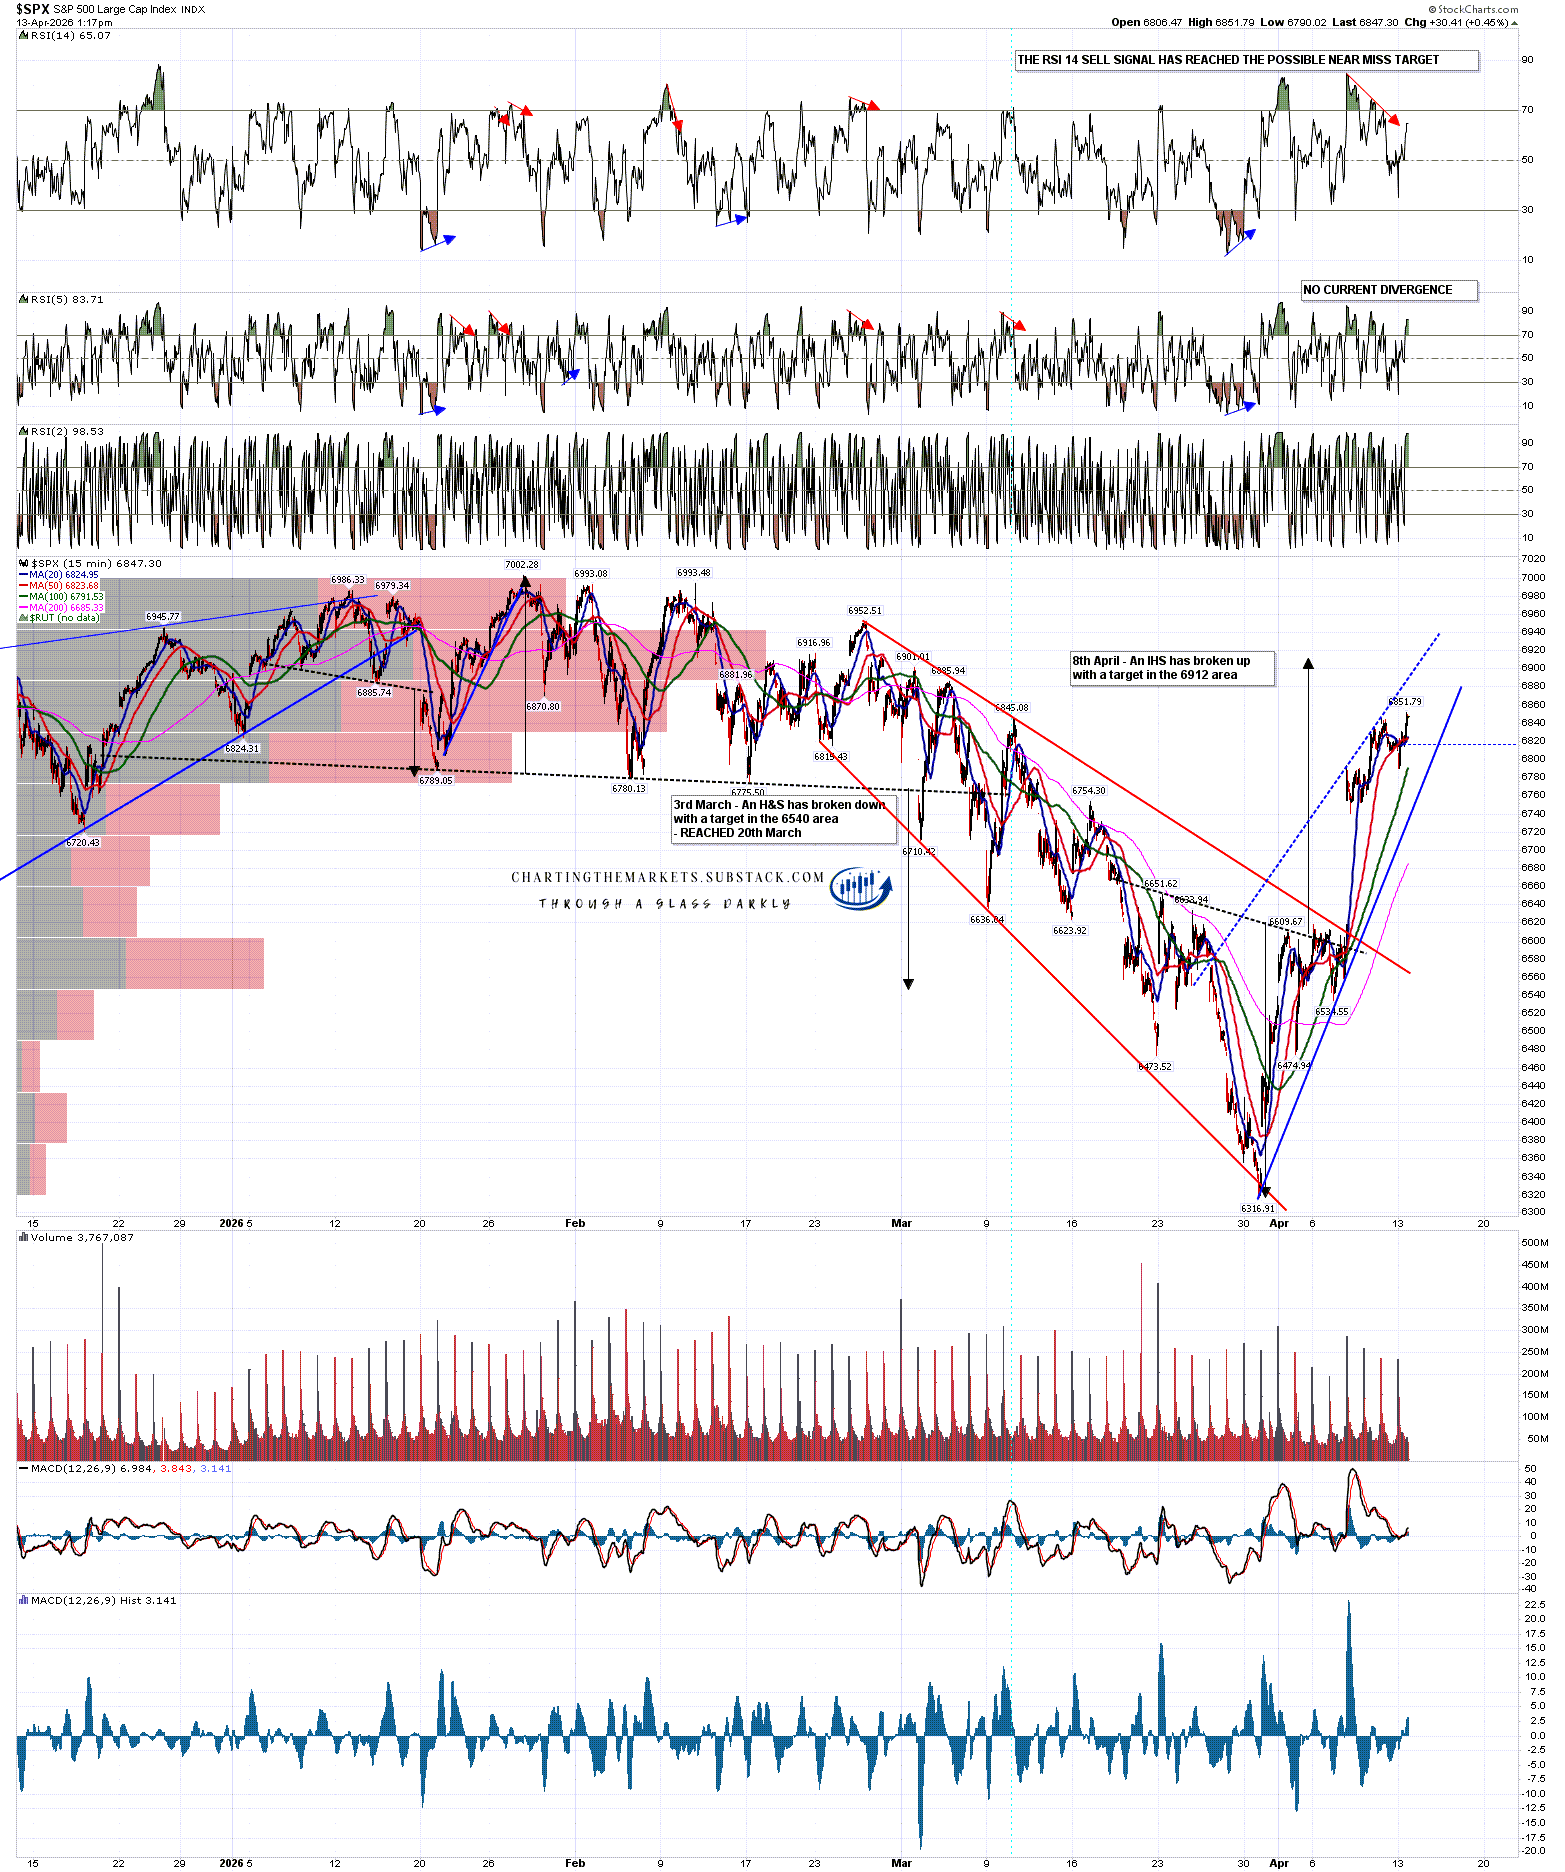
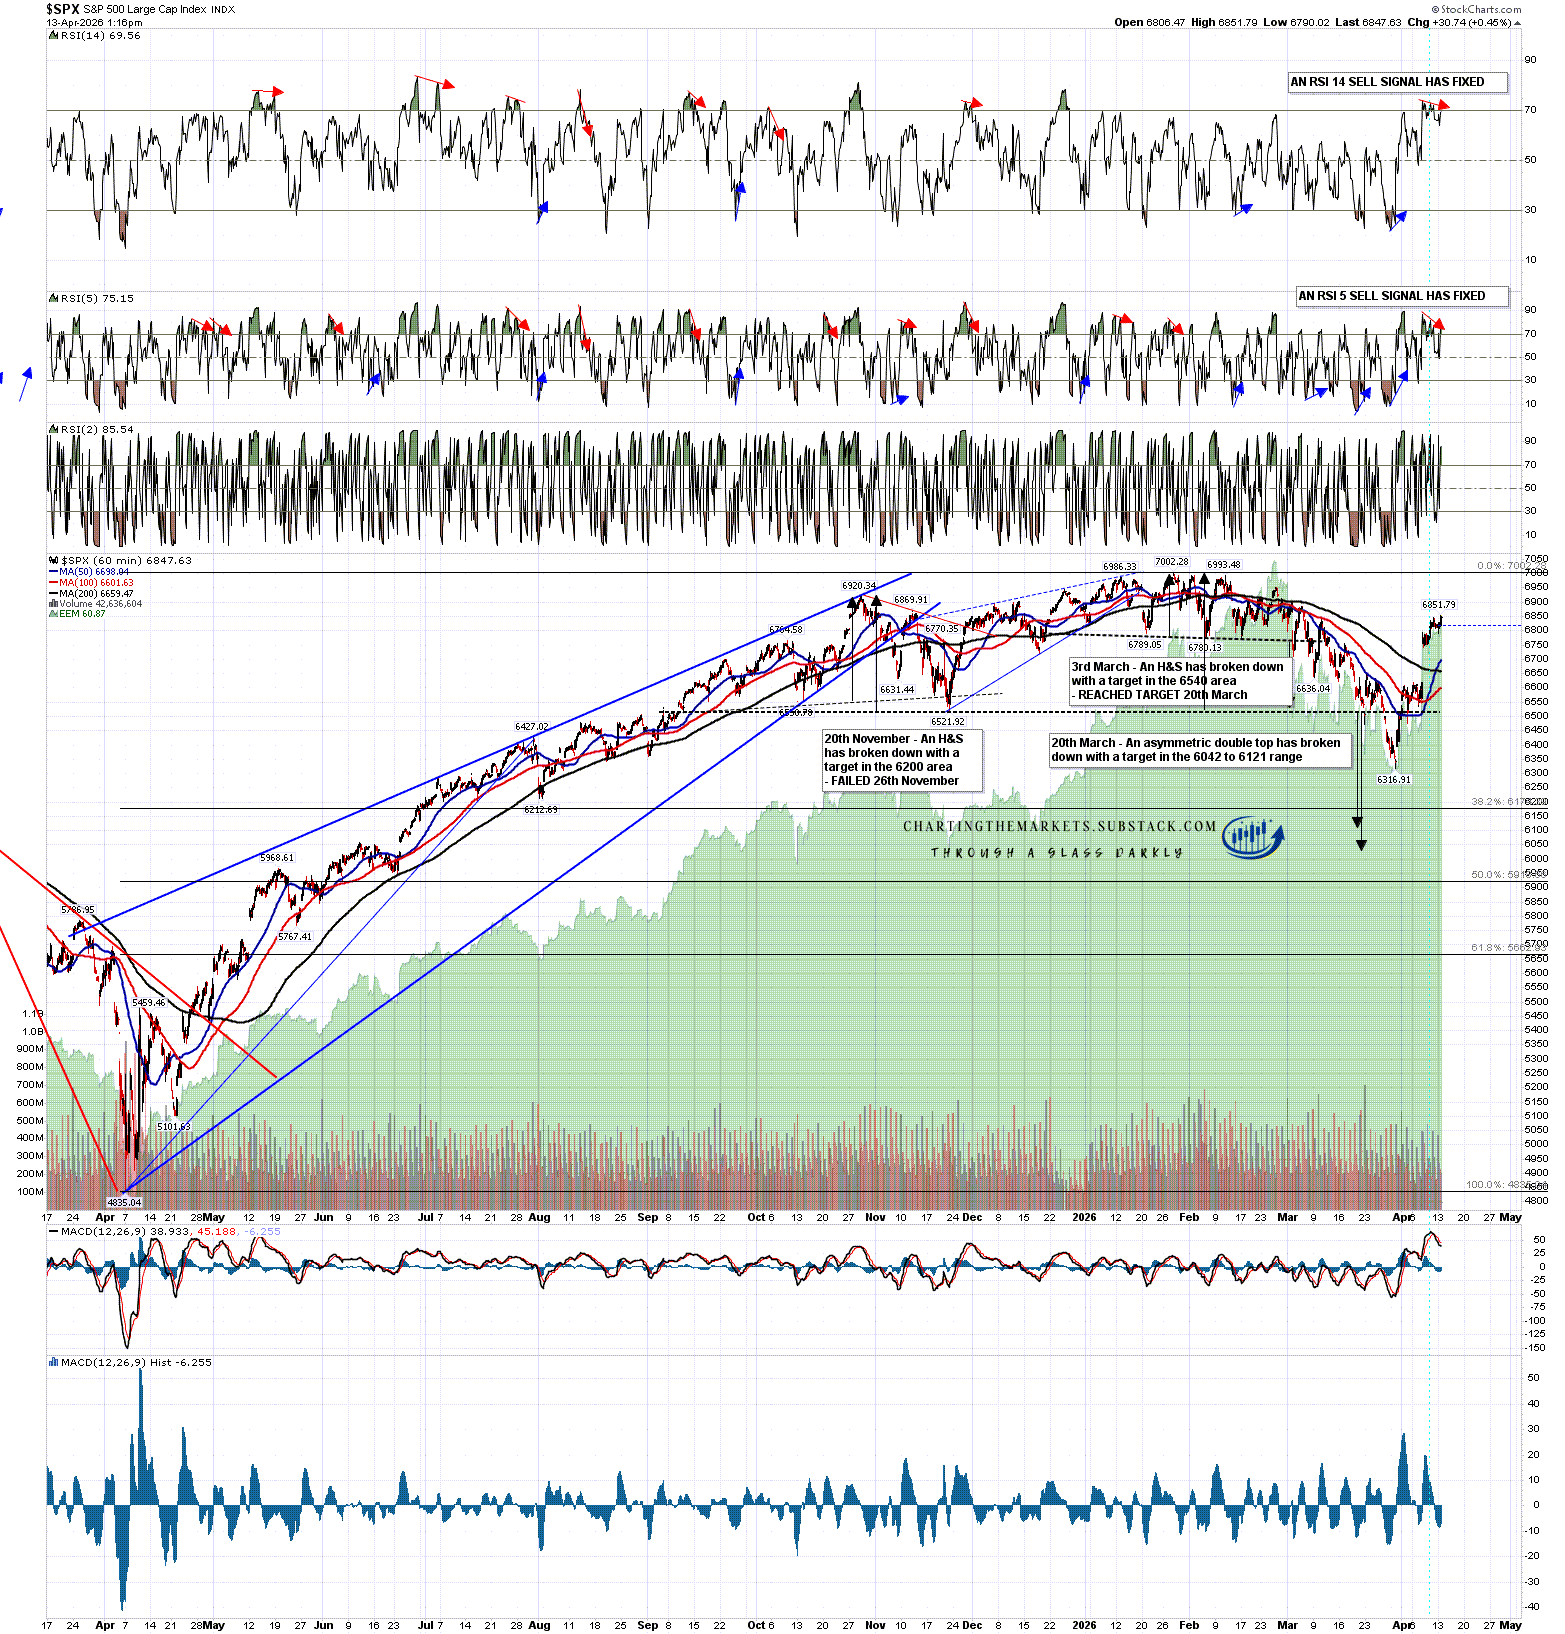
There is increasing negative divergence on US equity indices. On SPX a weak daily RSI 14 sell signal fixed at the close yesterday and a full daily RSI 5 sell signal fixed earlier this week. That’s not encouraging for more upside but the structure is suggesting at least some more upside, the first trading day of May tomorrow is solidly bullish and there isn’t a historically strongly bearish day until 13th May. With global surpluses of oil estimated to be exhausted by 10th May that still gives markets a couple of weeks for continued wishful thinking.
If SPX does turn down directly from here there is still a decent quality double top setup. We will see.
SPX daily chart:
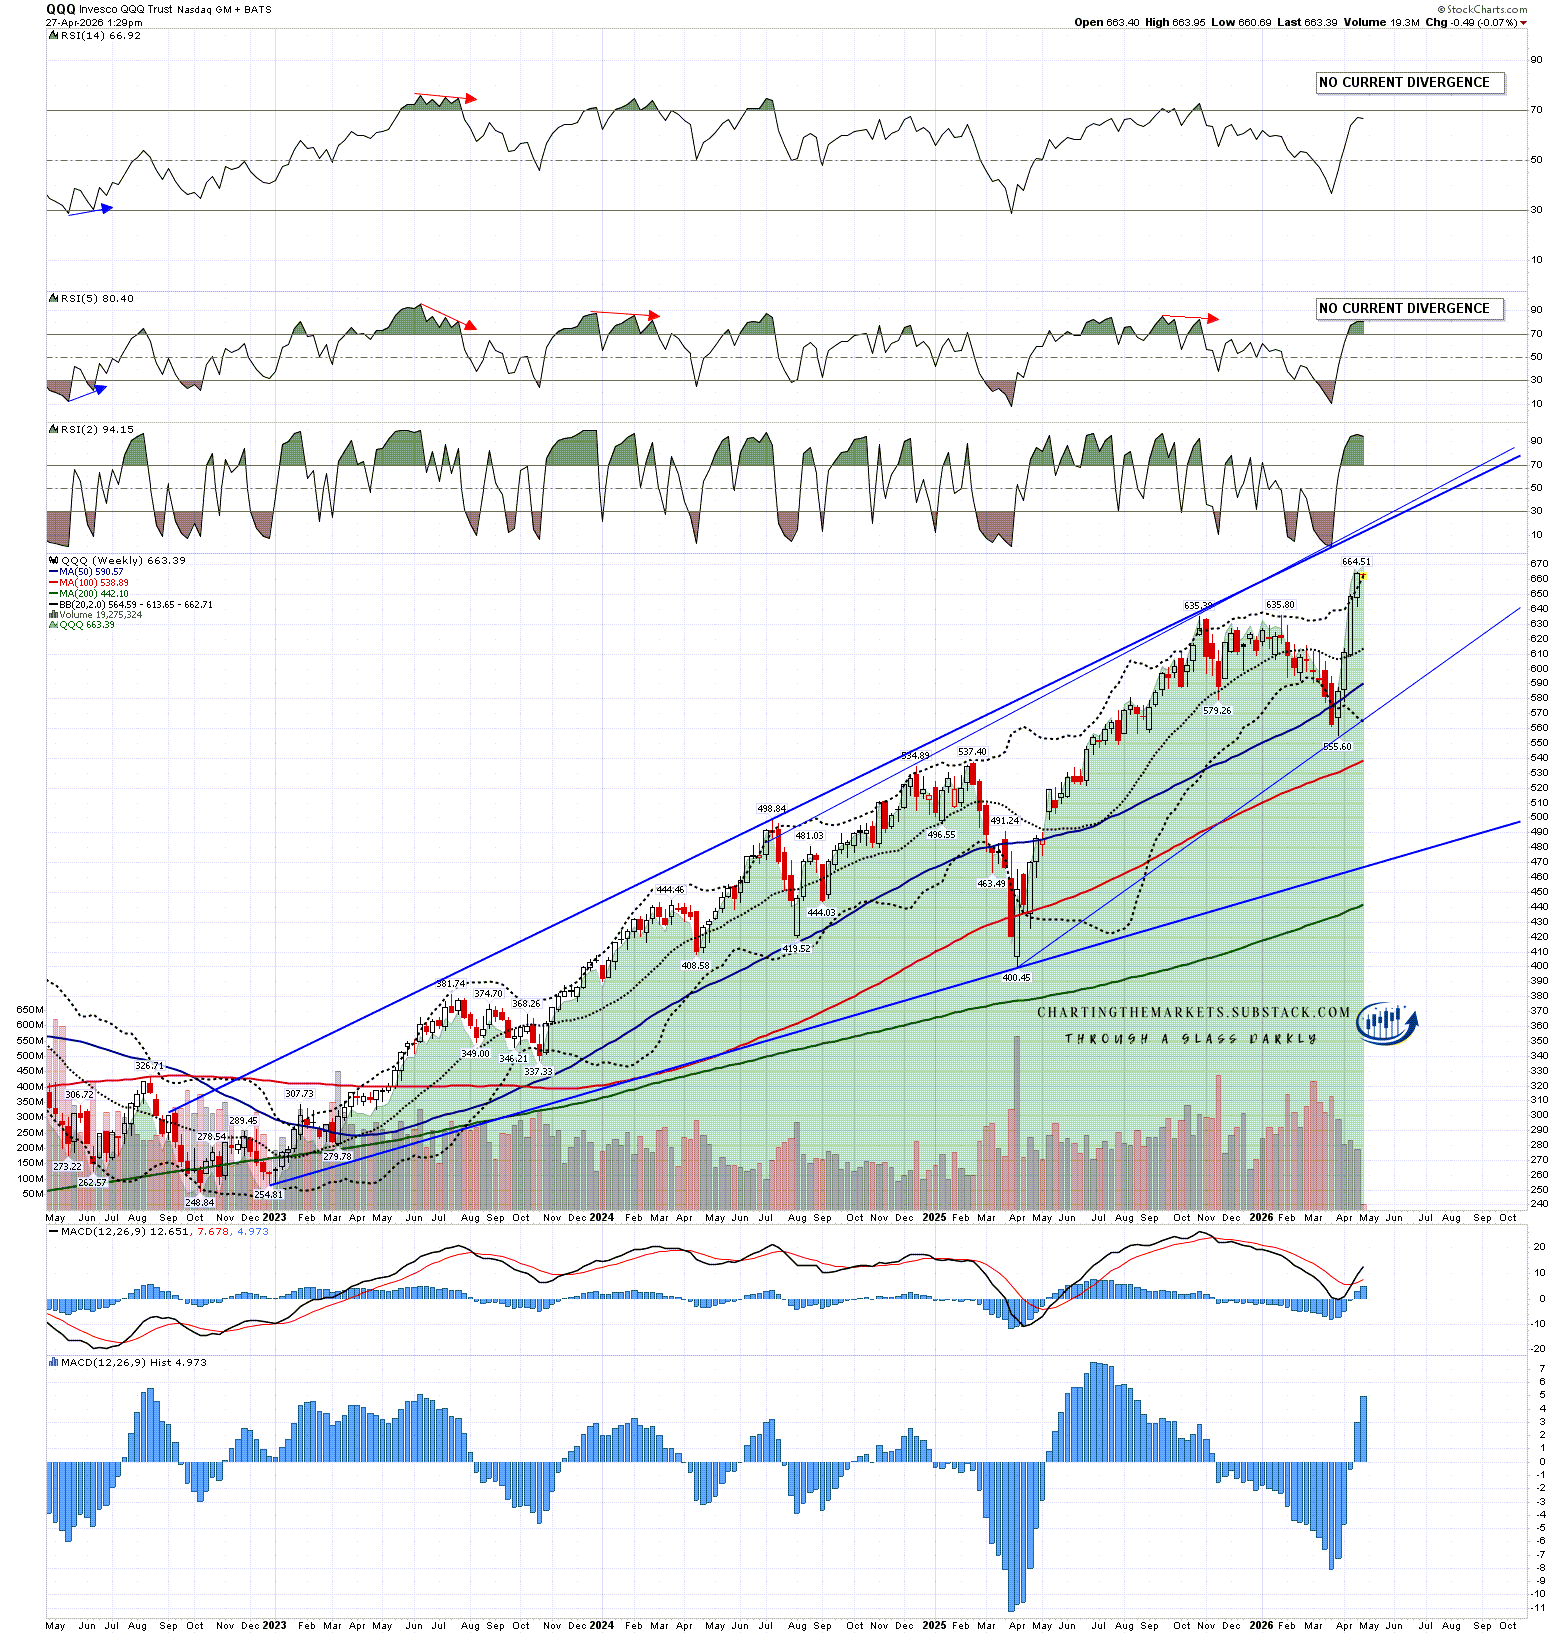
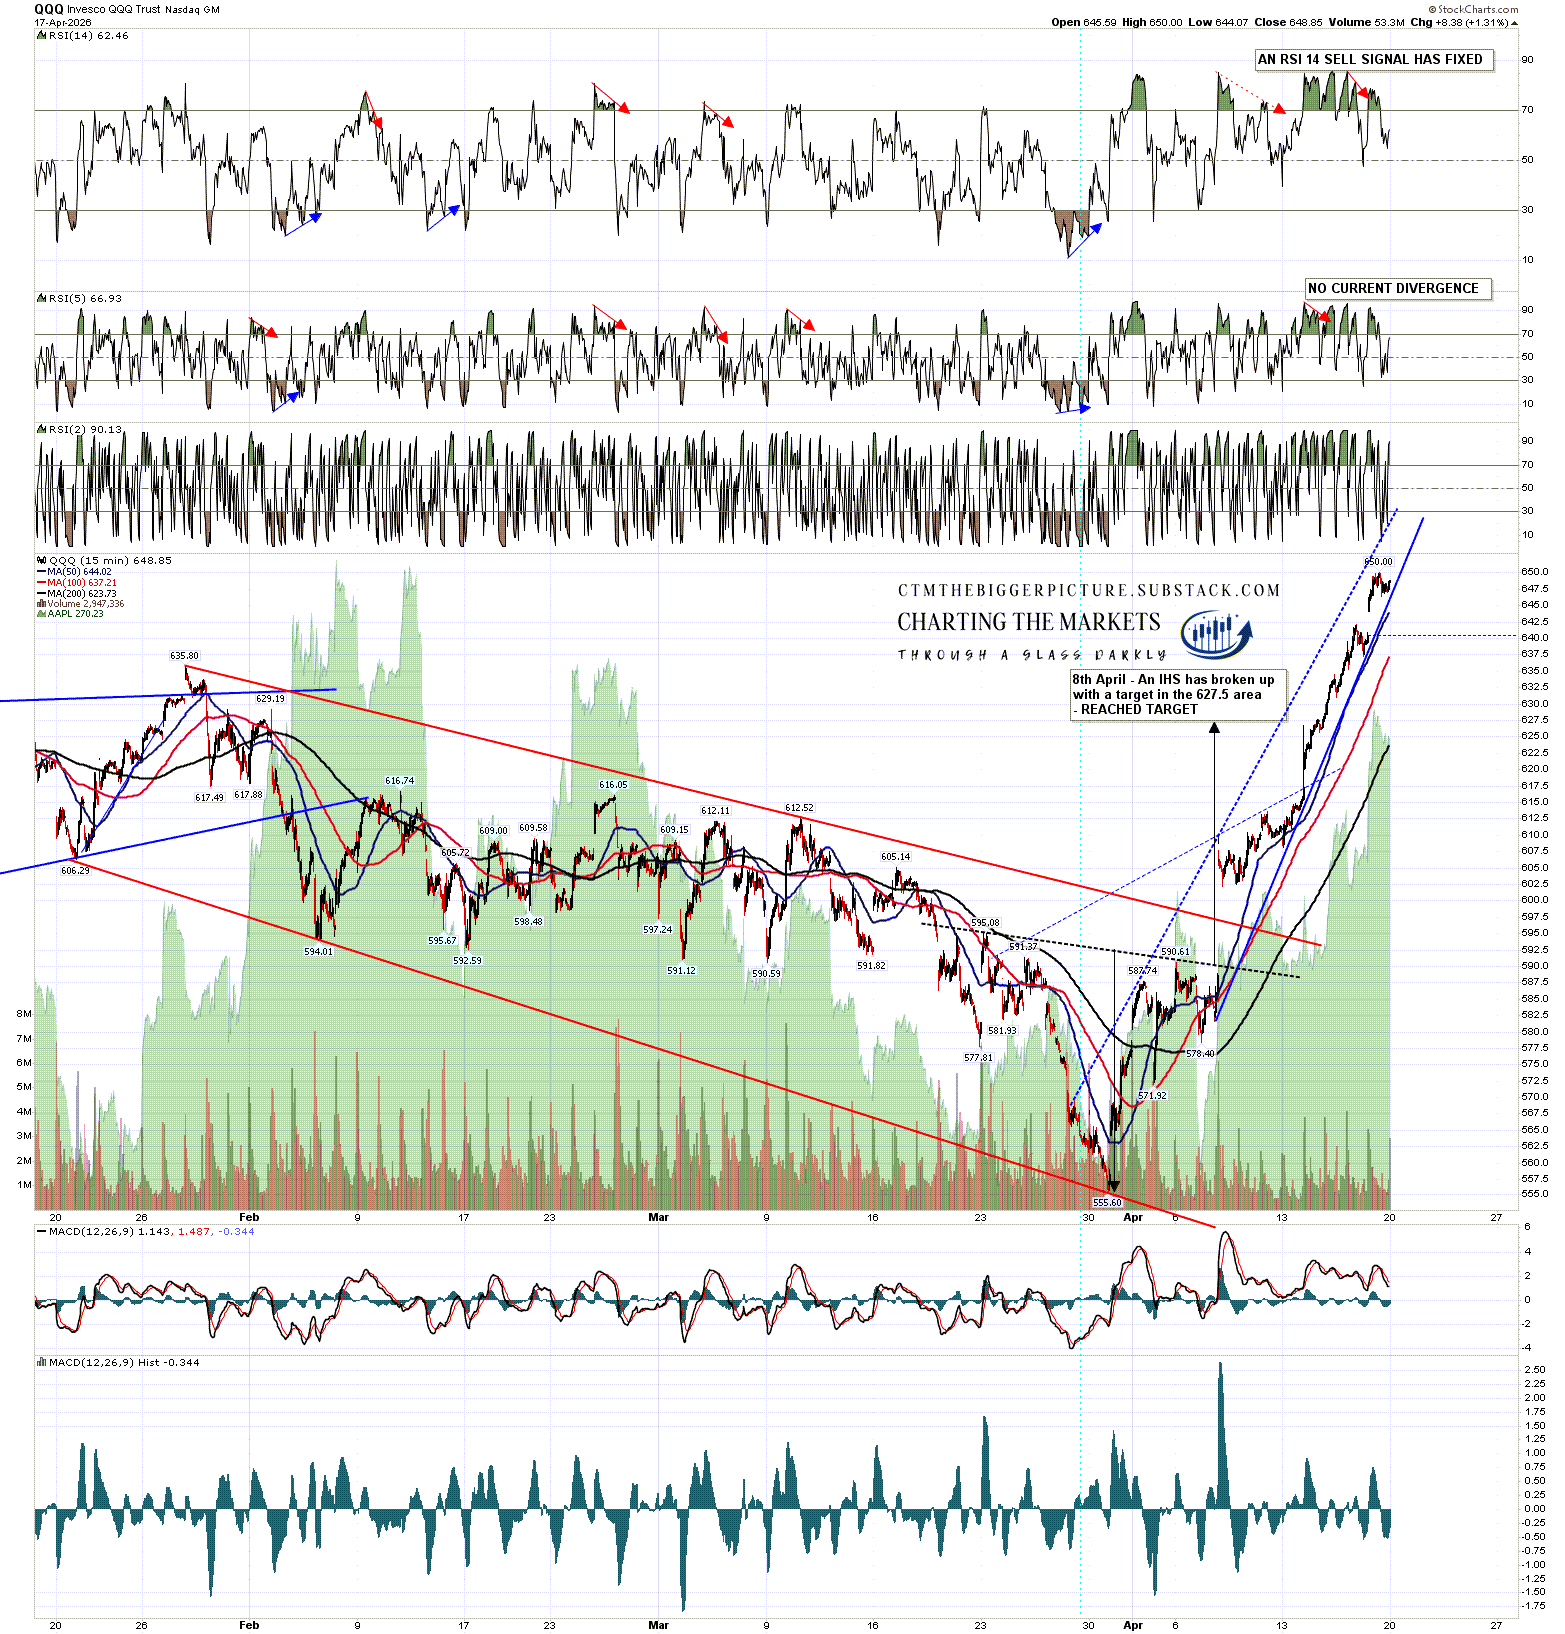
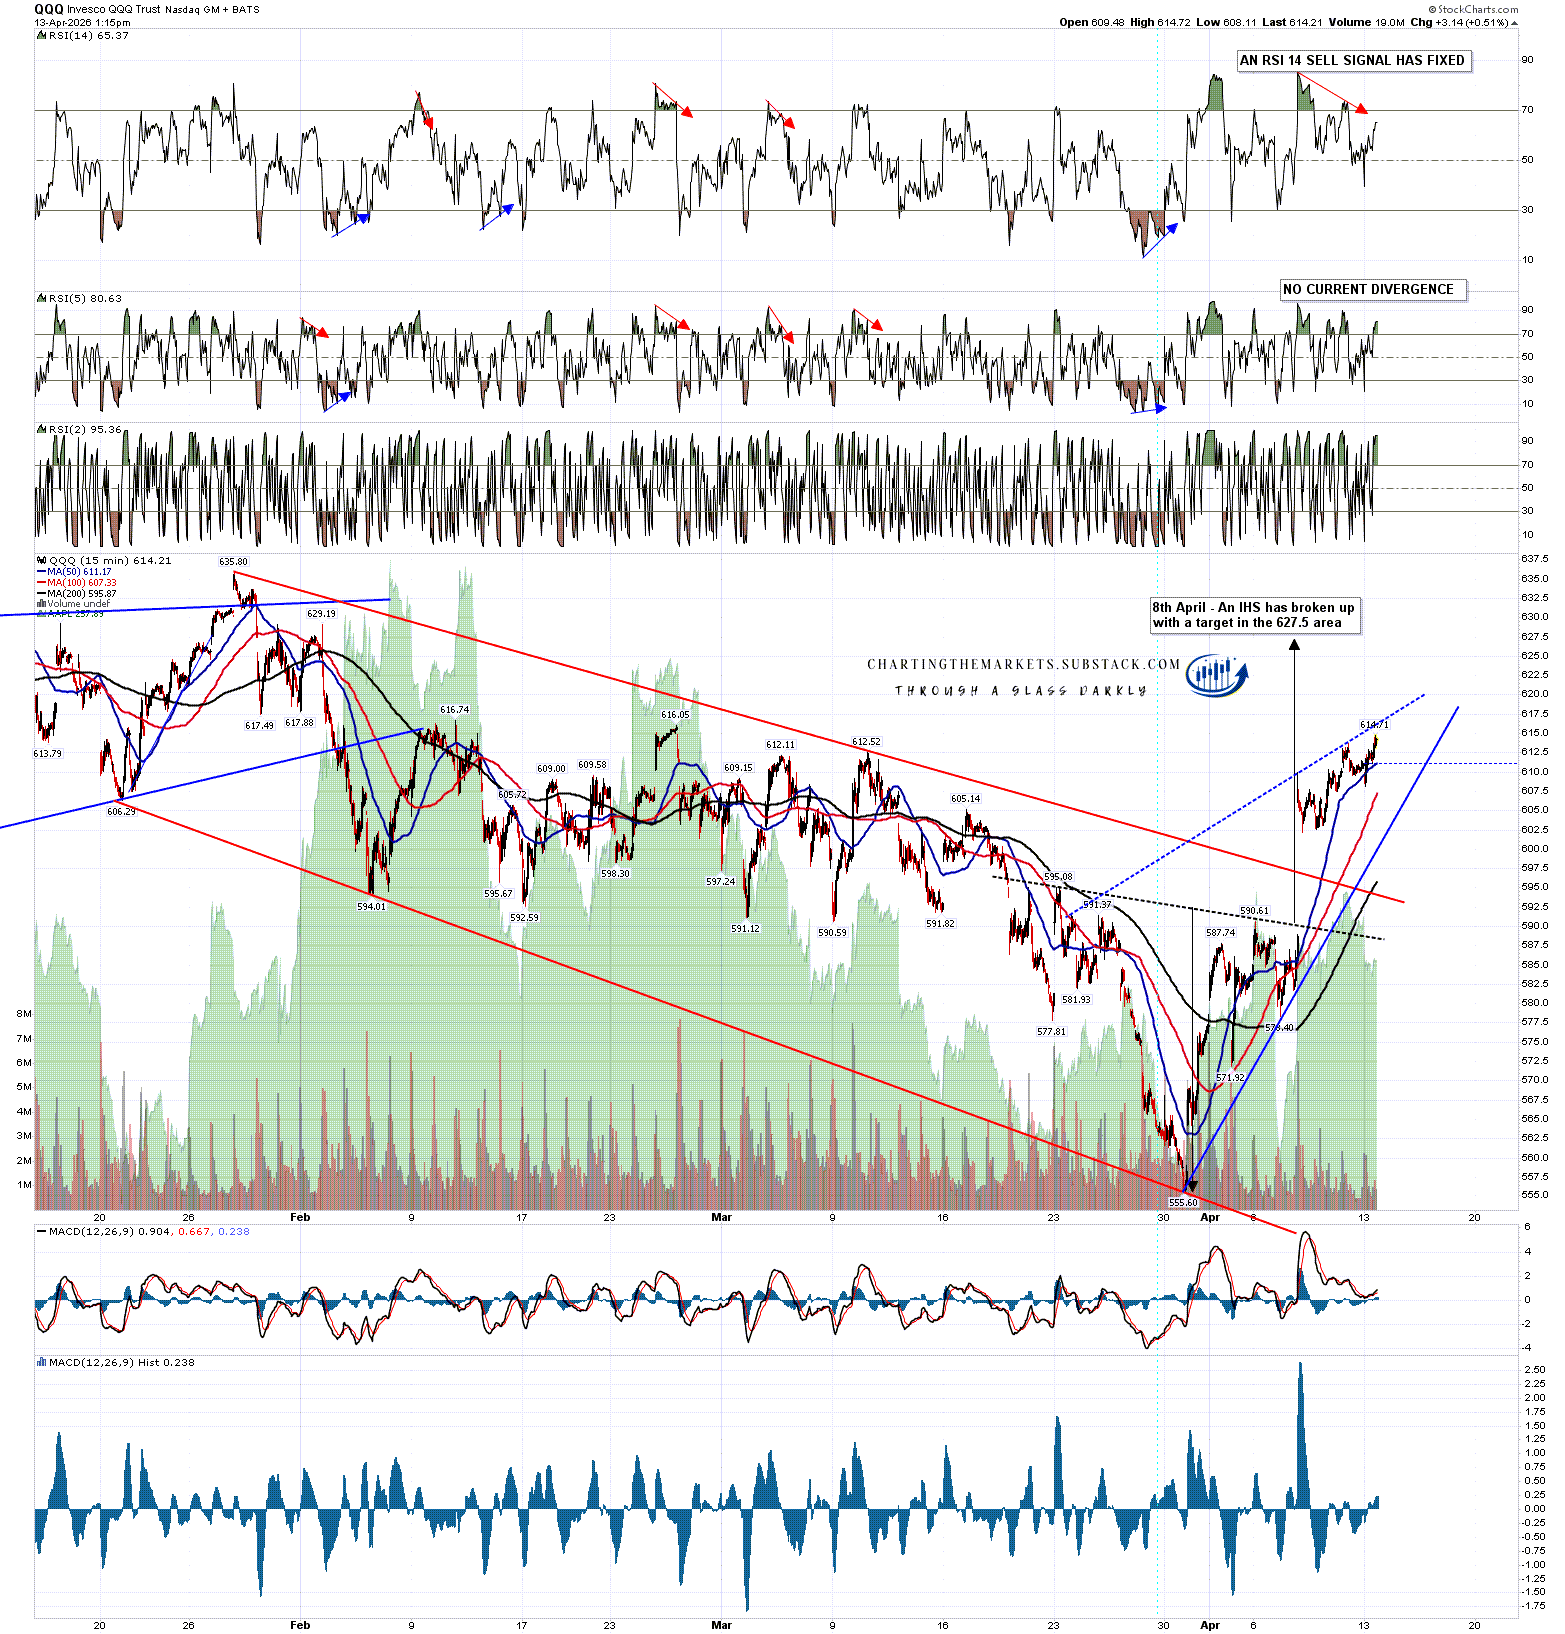
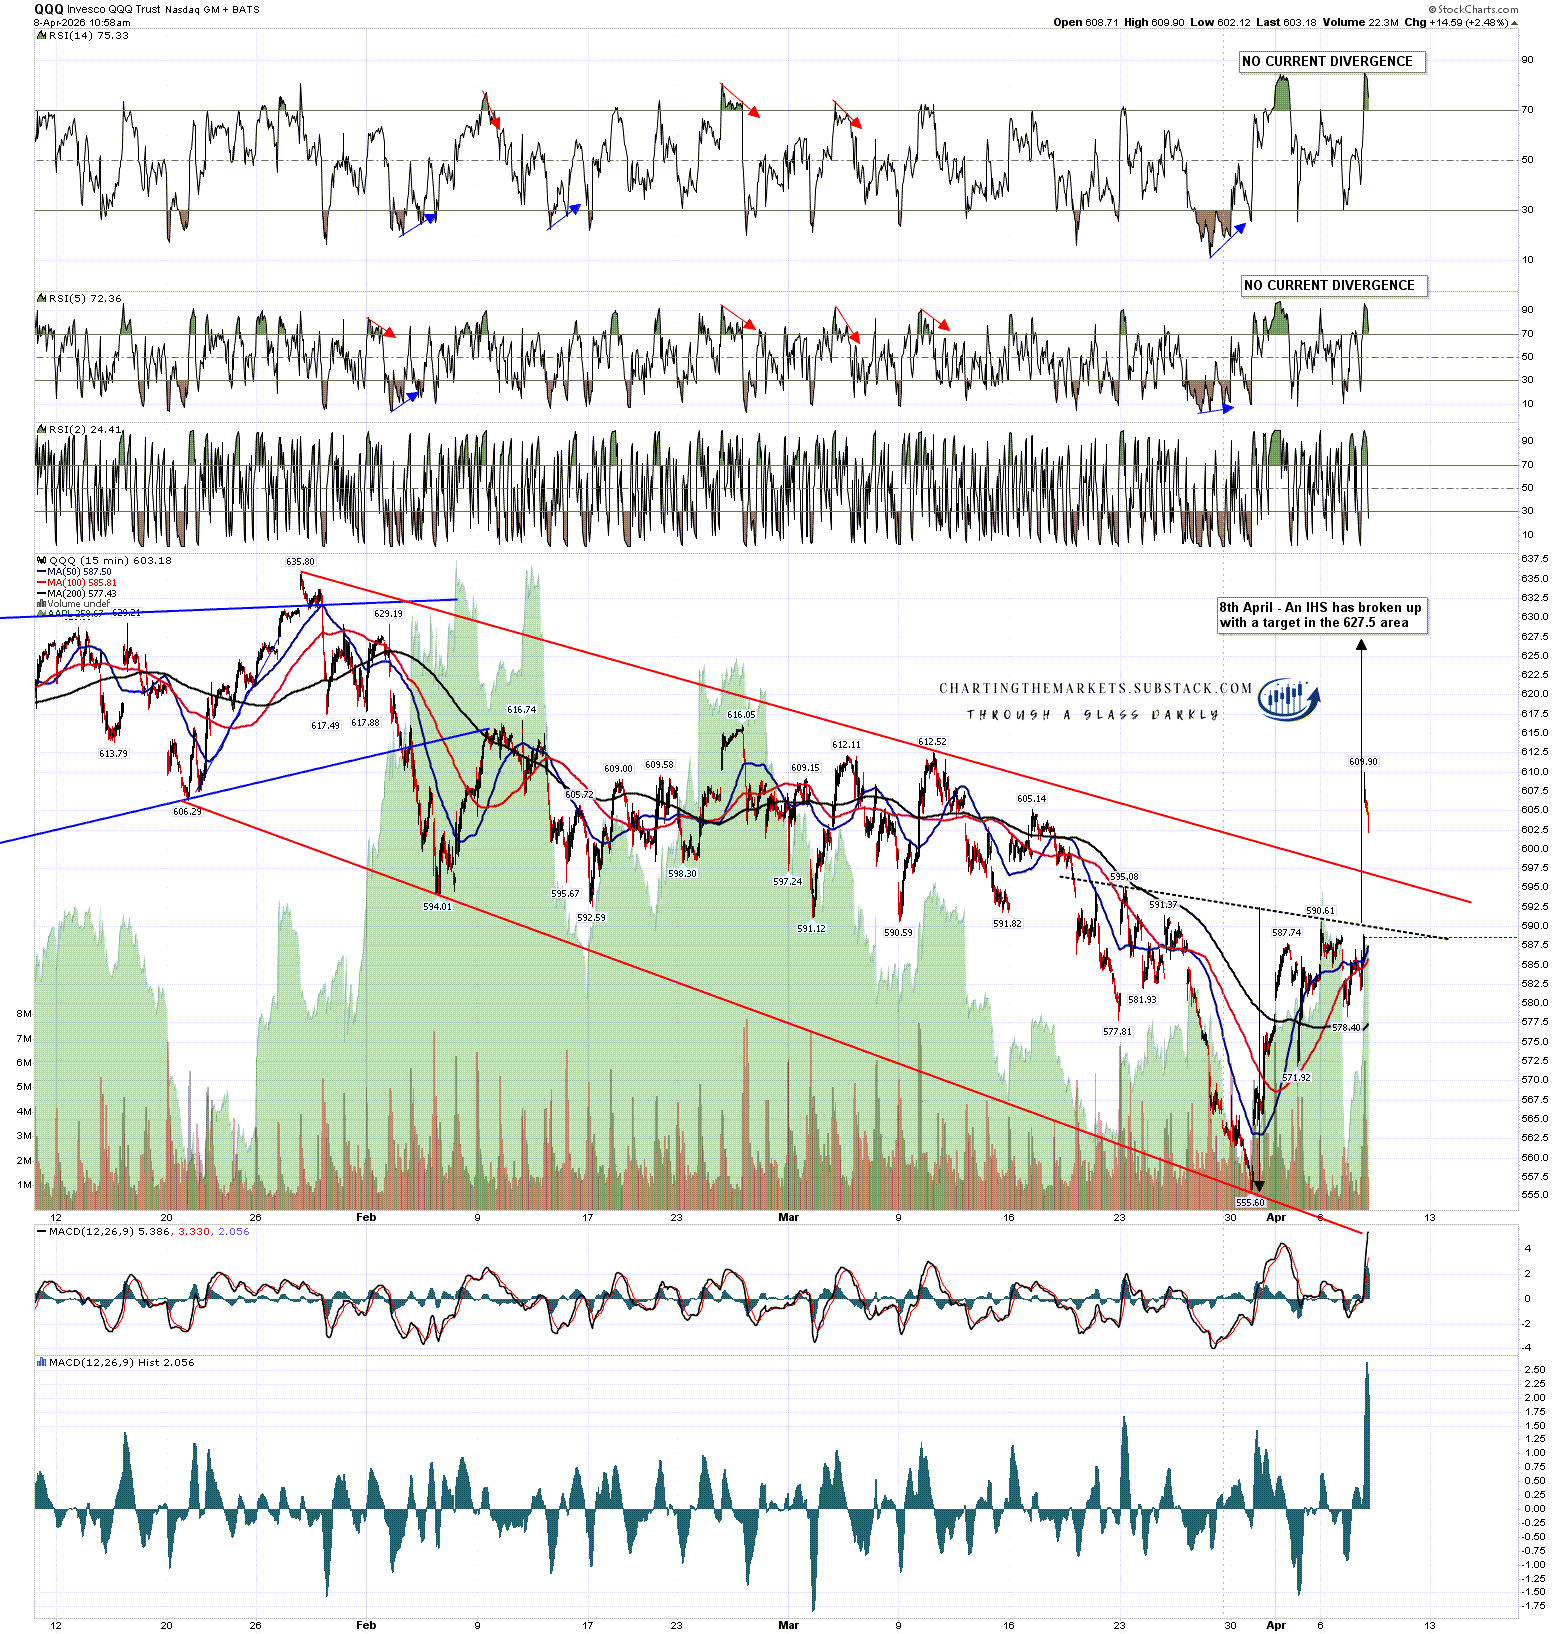
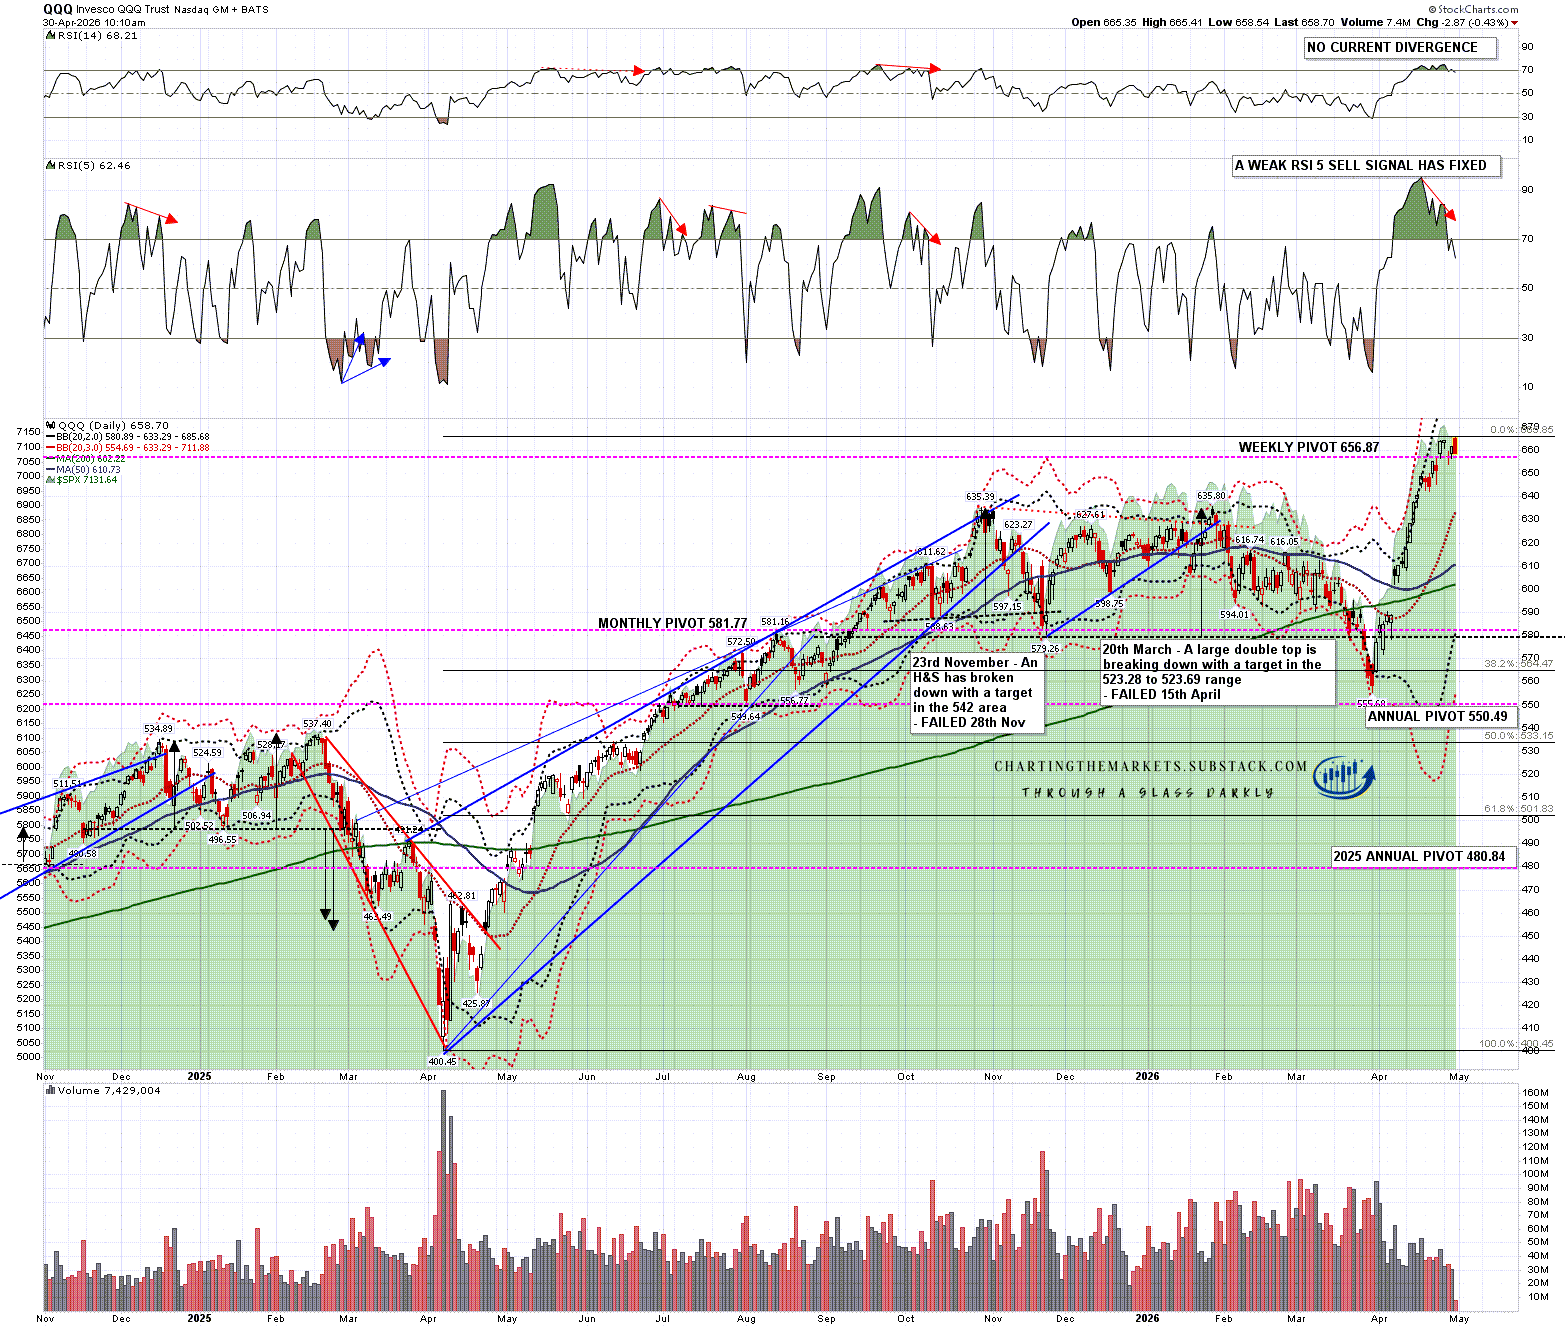
On QQQ a weak daily RSI 5 sell signal has fixed, and on the high retest today a possible full RSI 5 buy signal is brewing. If QQQ turns here there is still a decent quality double top setup.
QQQ daily chart:
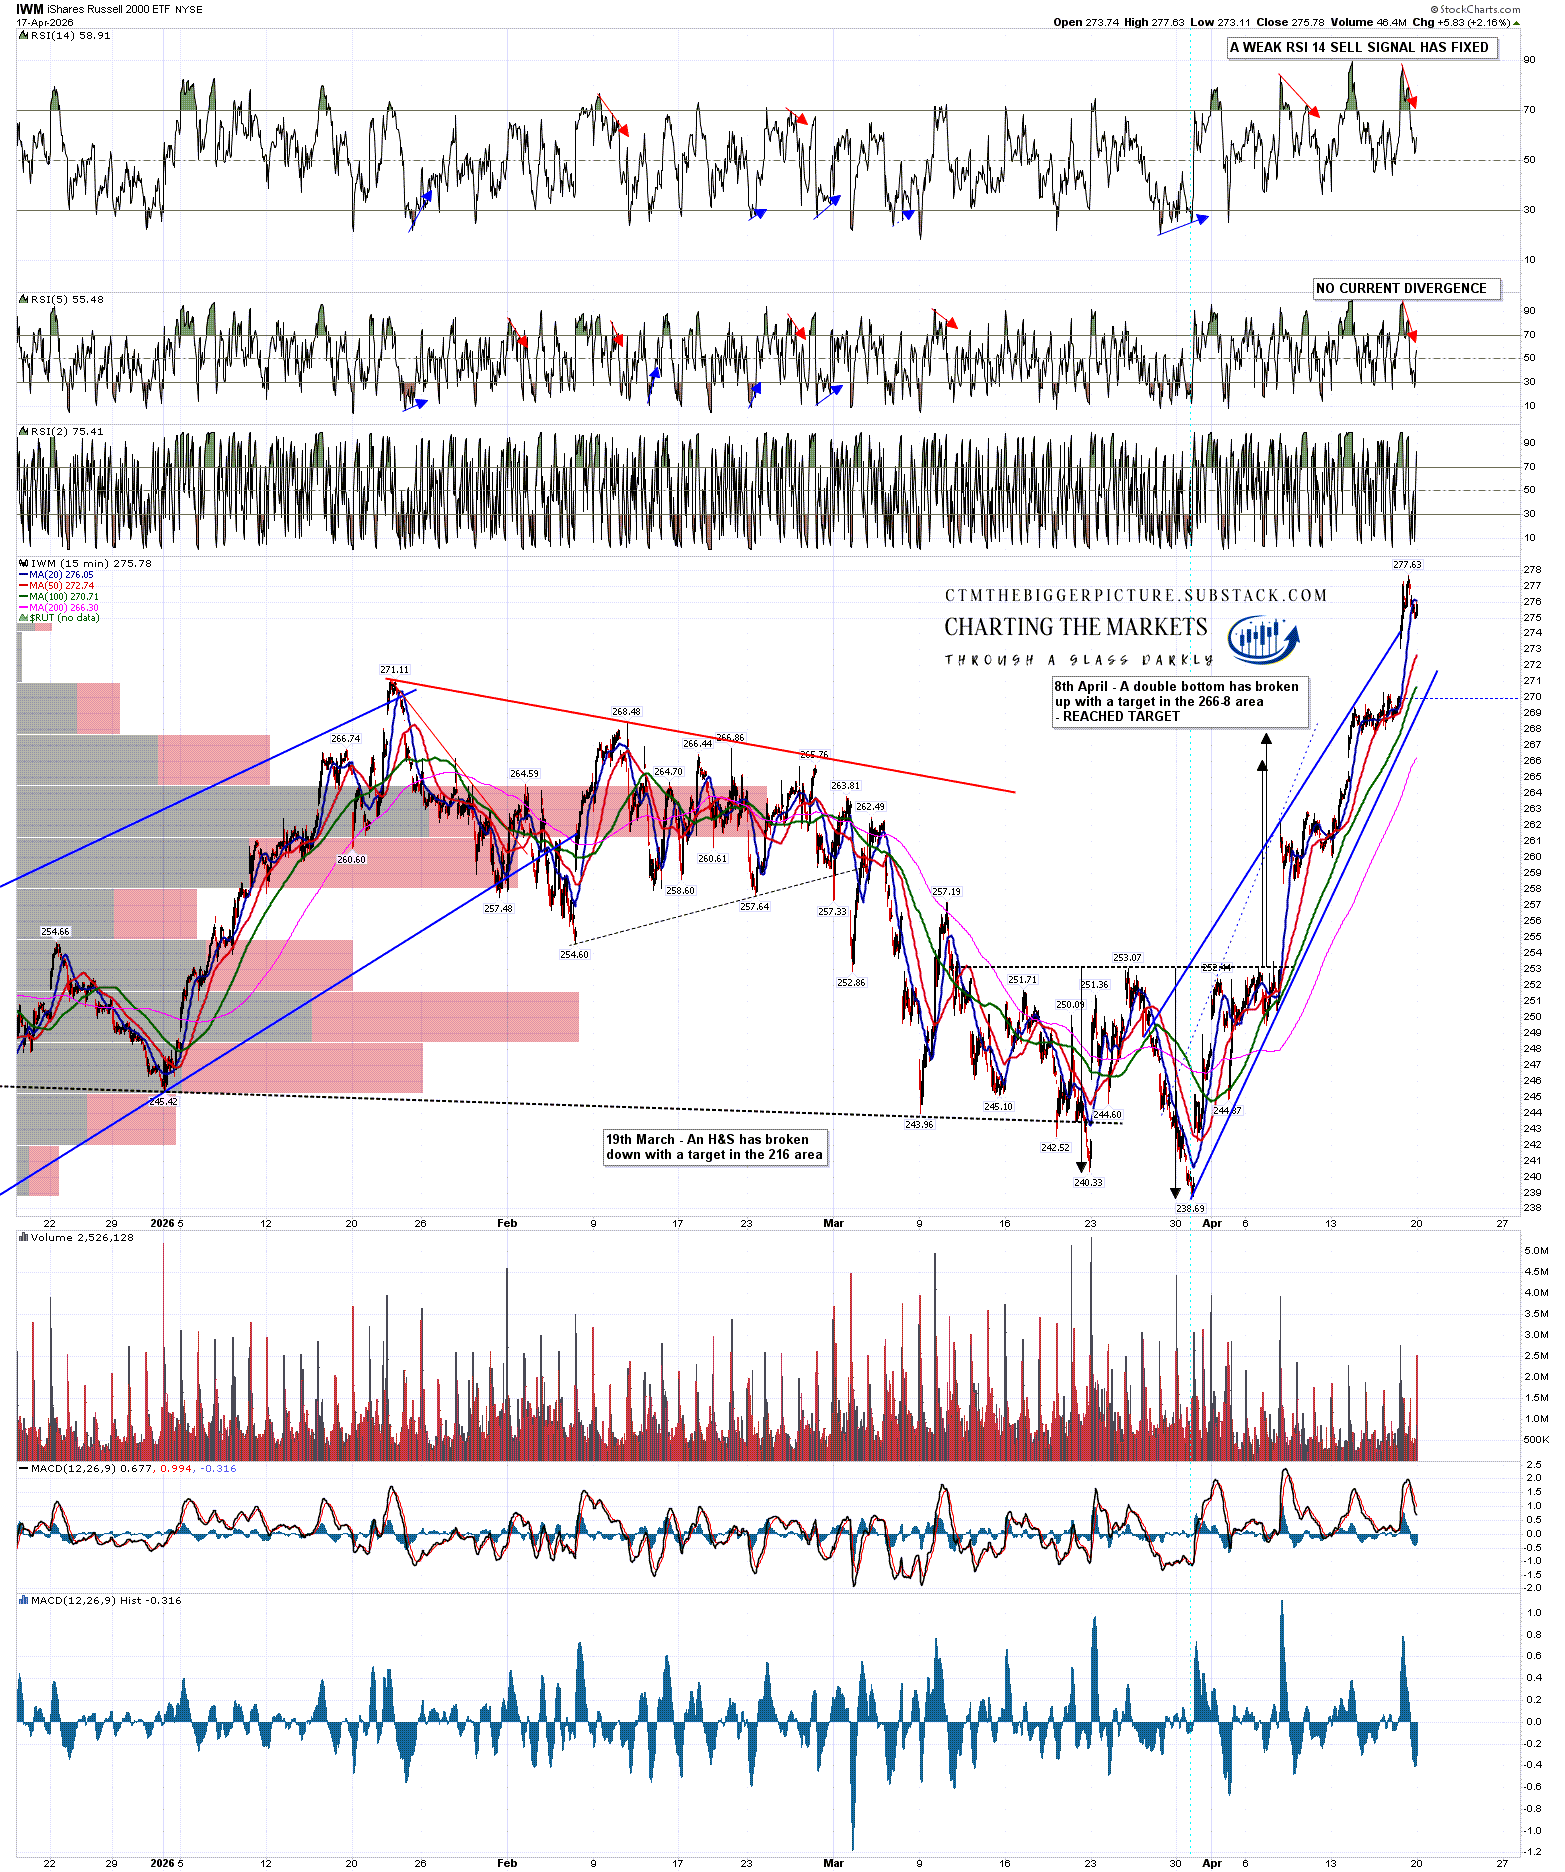
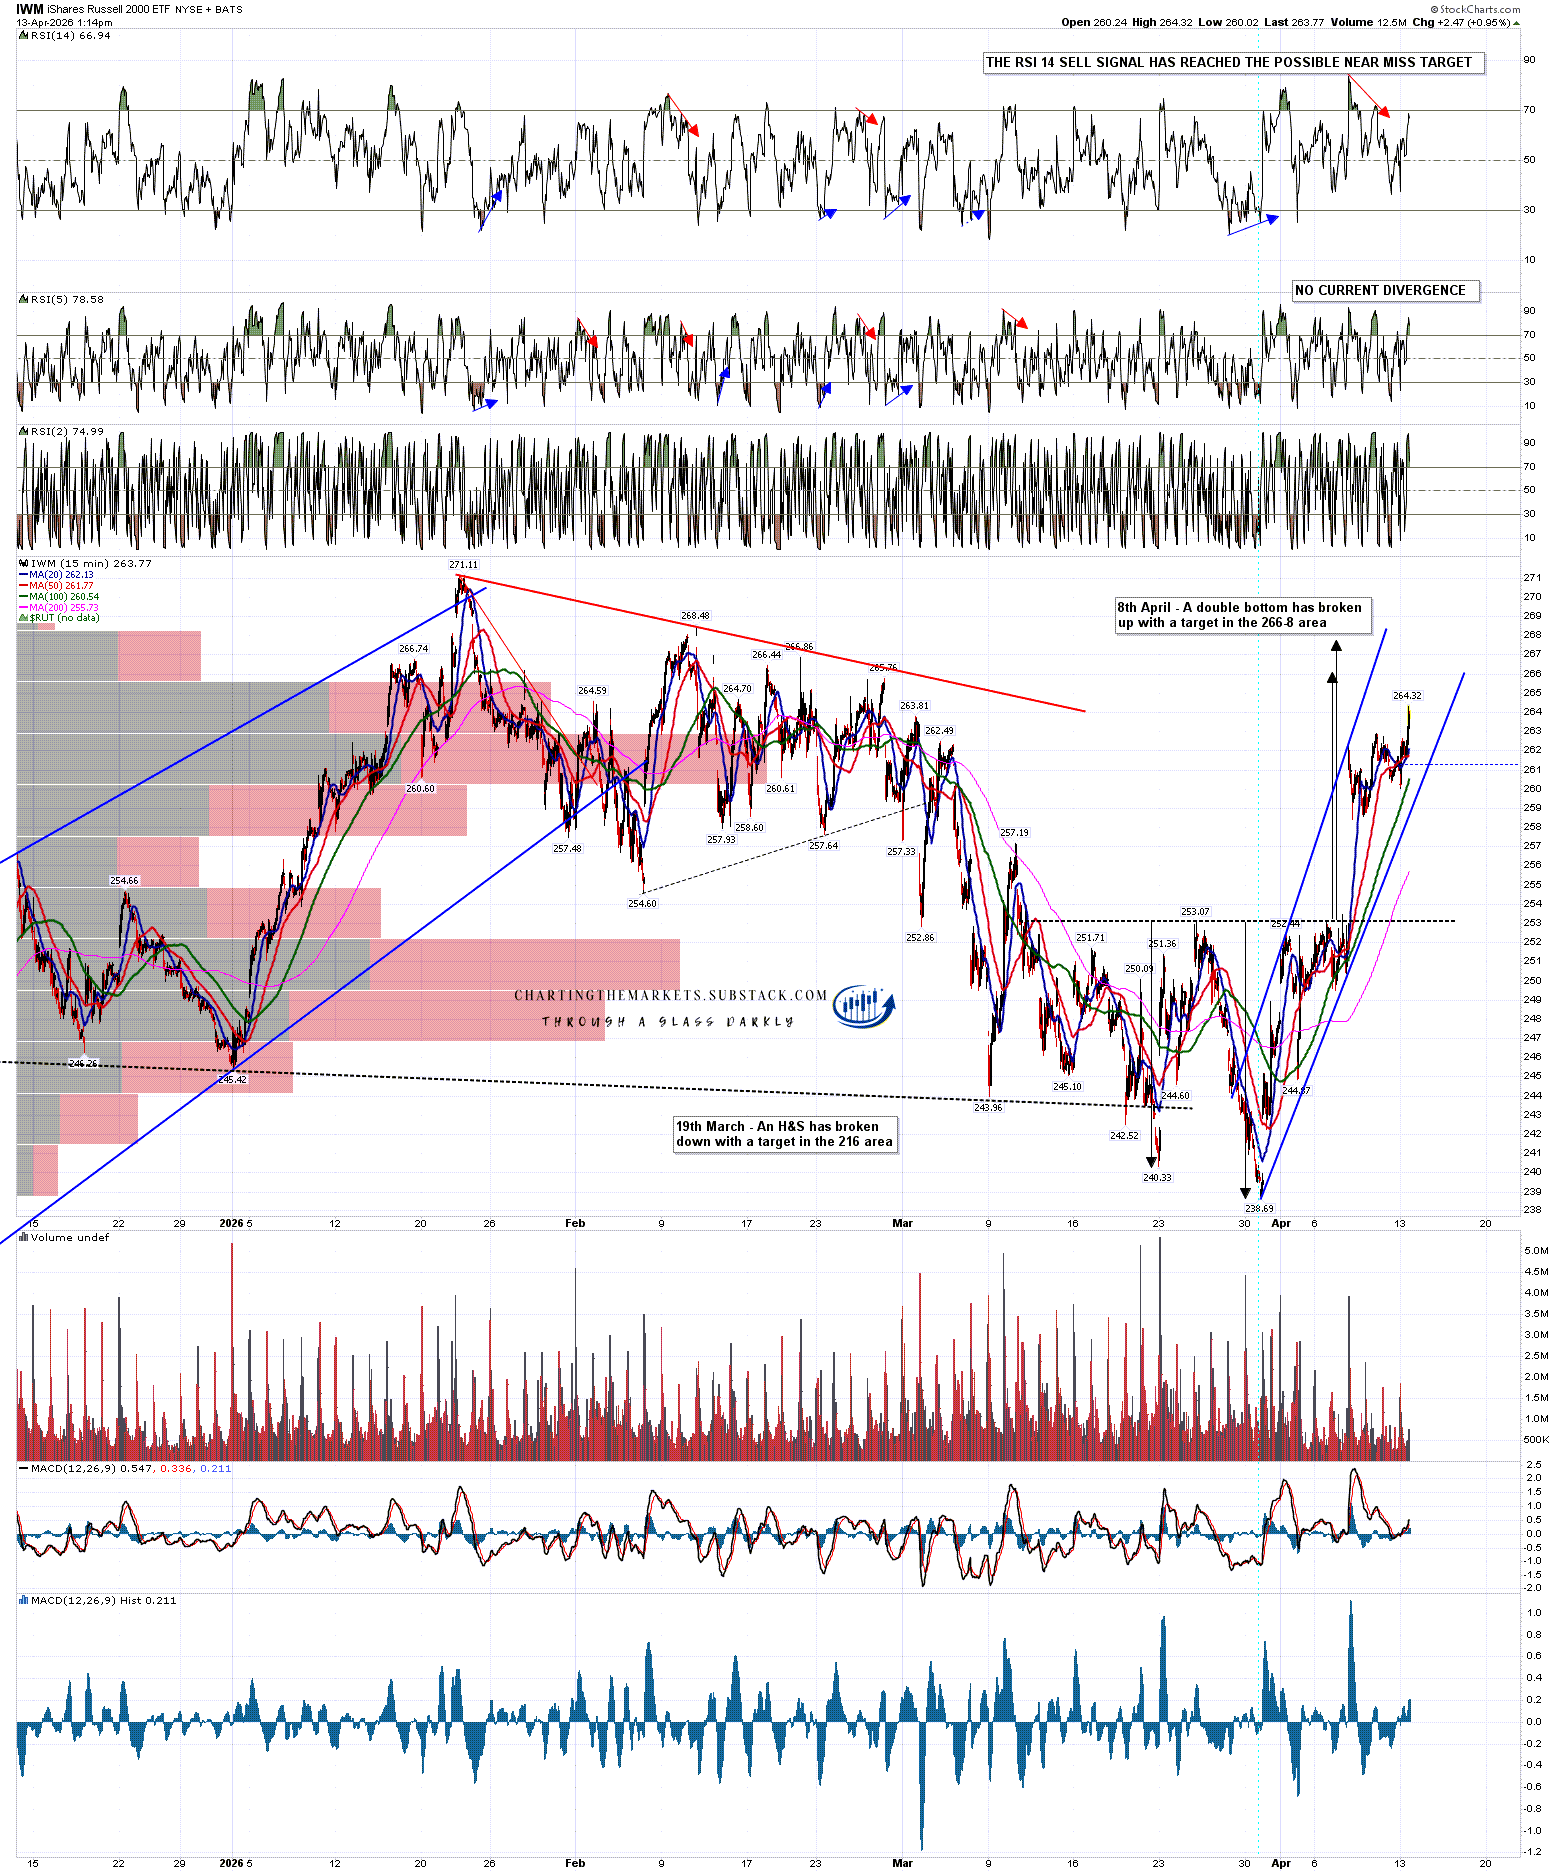
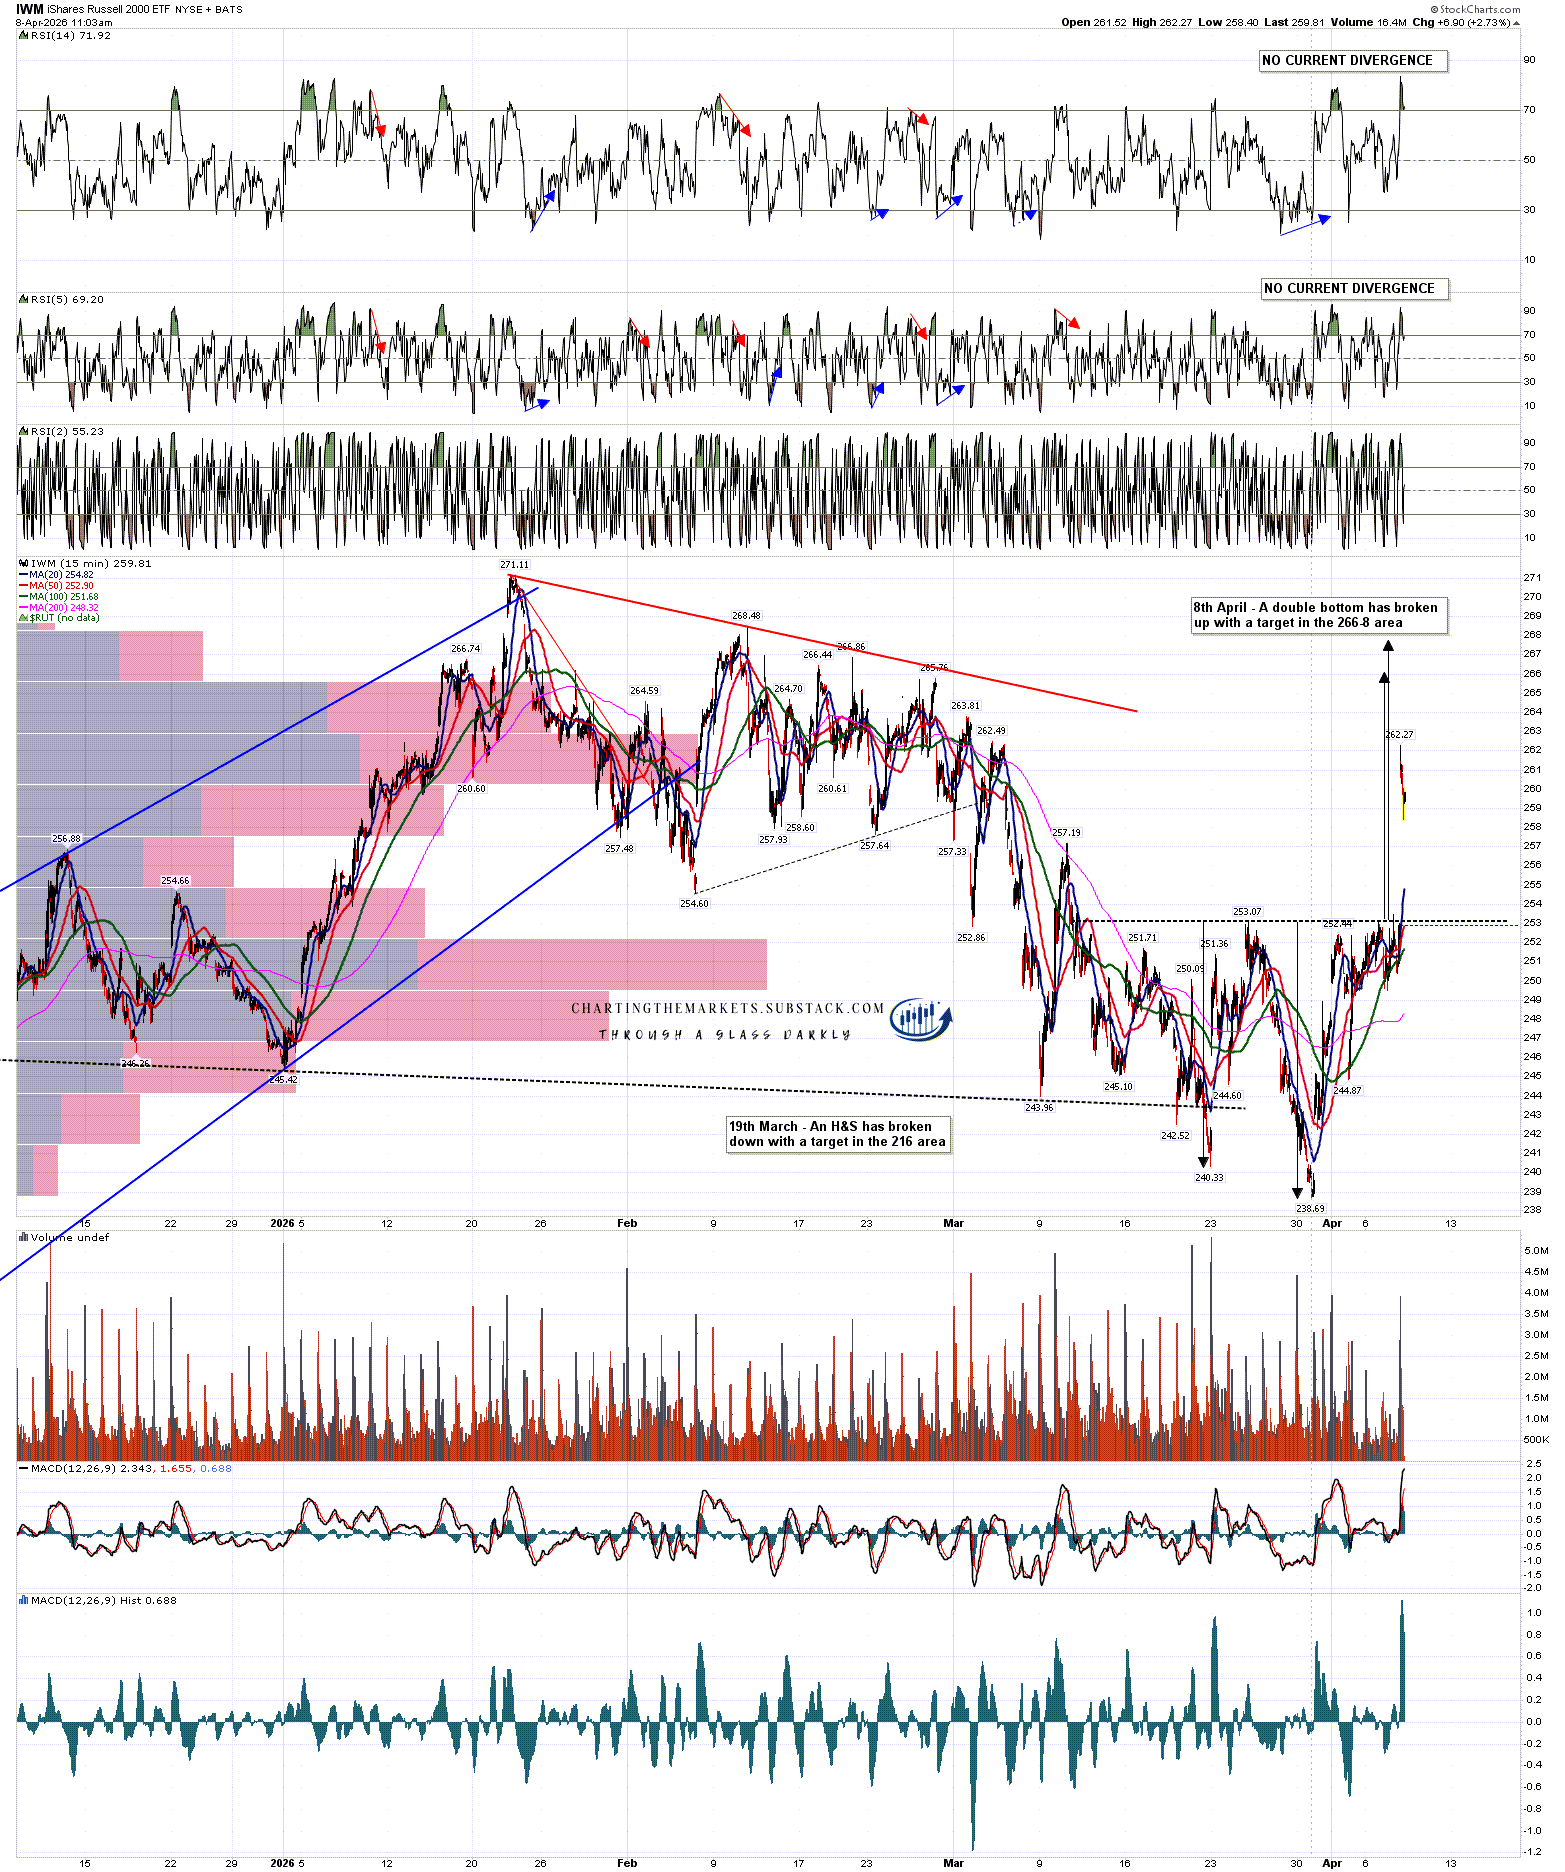
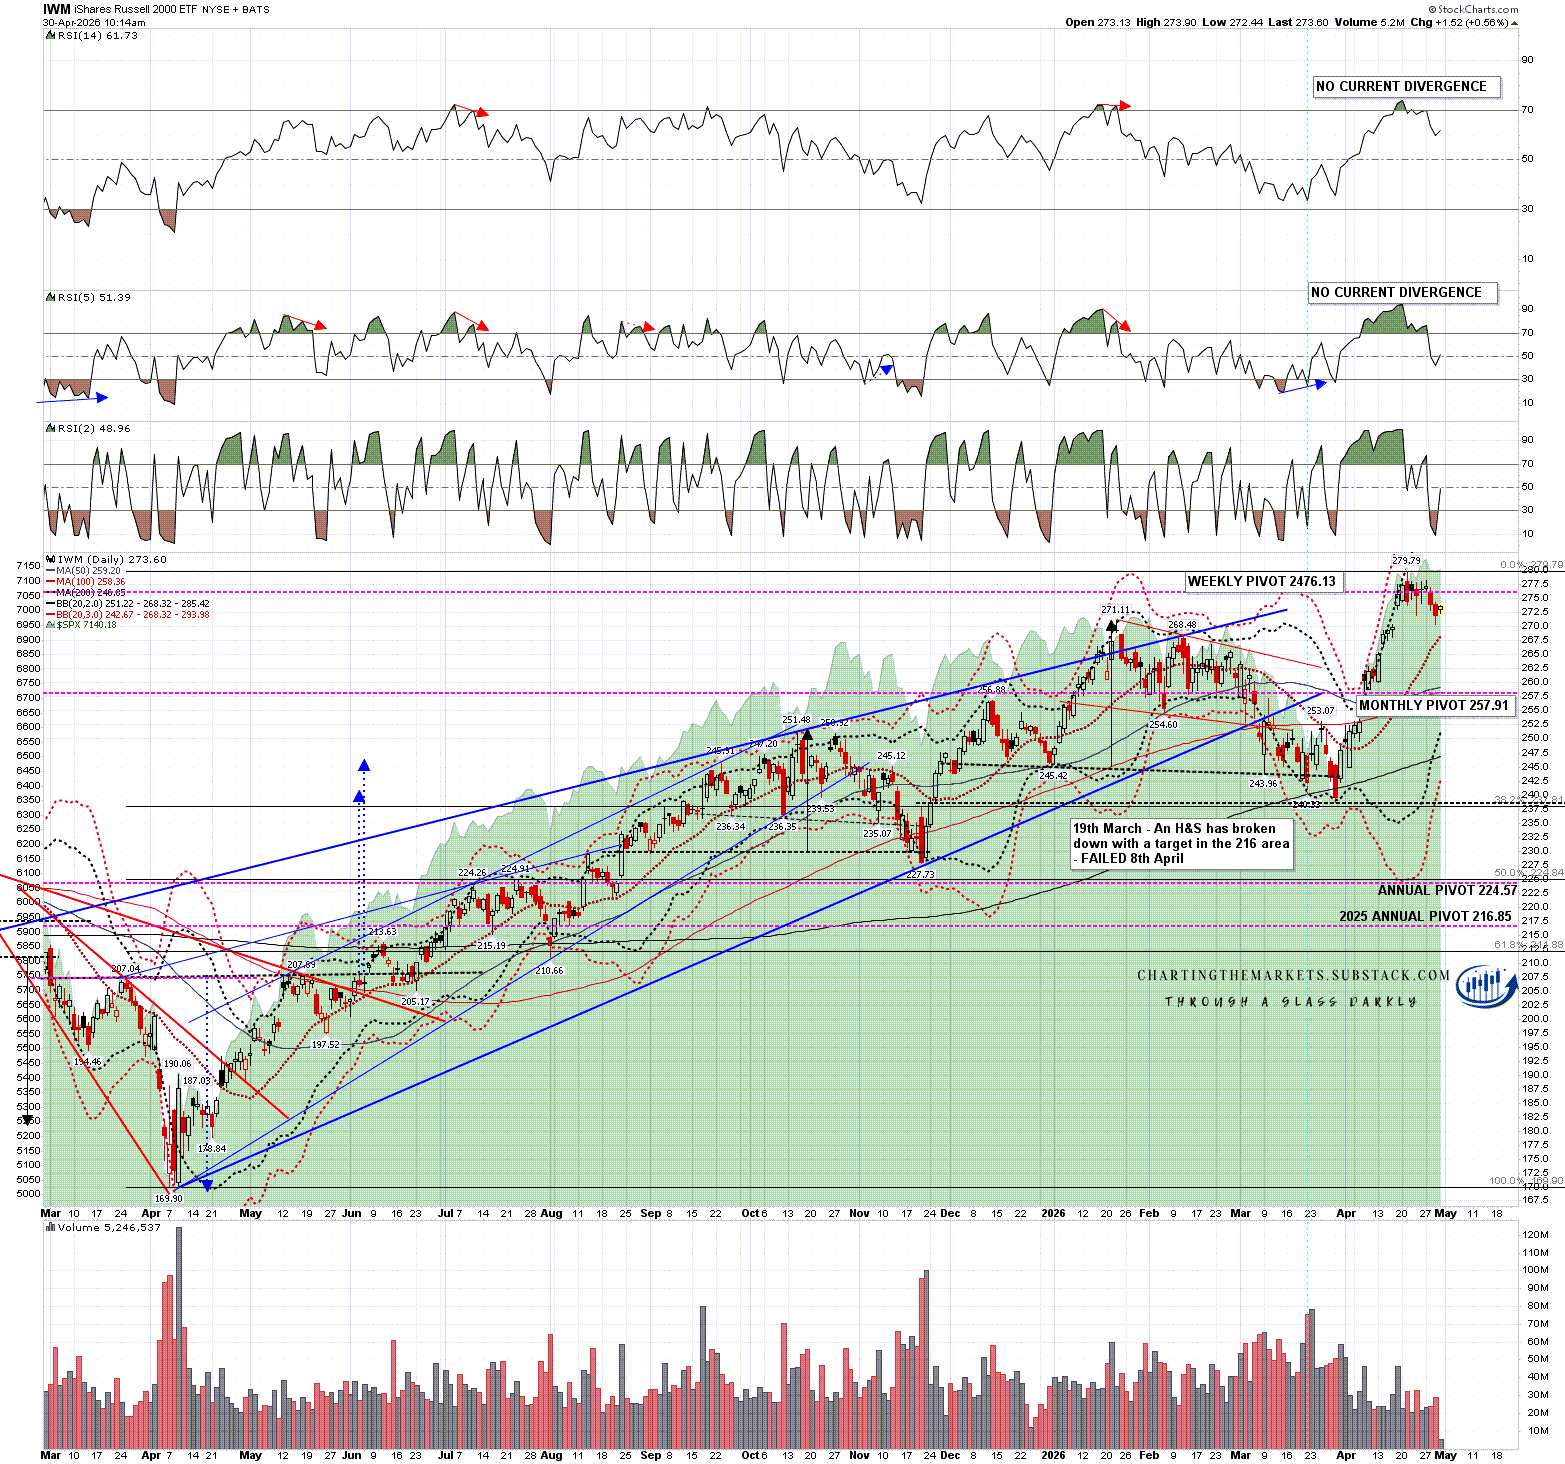
One of the reasons I am expecting to see at least some more upside is that there are clear short term bull flags on both IWM and DIA from the highs made at the start of last week.
On IWM there is no current negative divergence on the daily chart but on a retest of the last high (and all time high) at 279.79, a full daily RSI 14 sell signal would likely start brewing. If IWM turns here, or there, there is still a decent quality double top setup.
IWM daily chart:
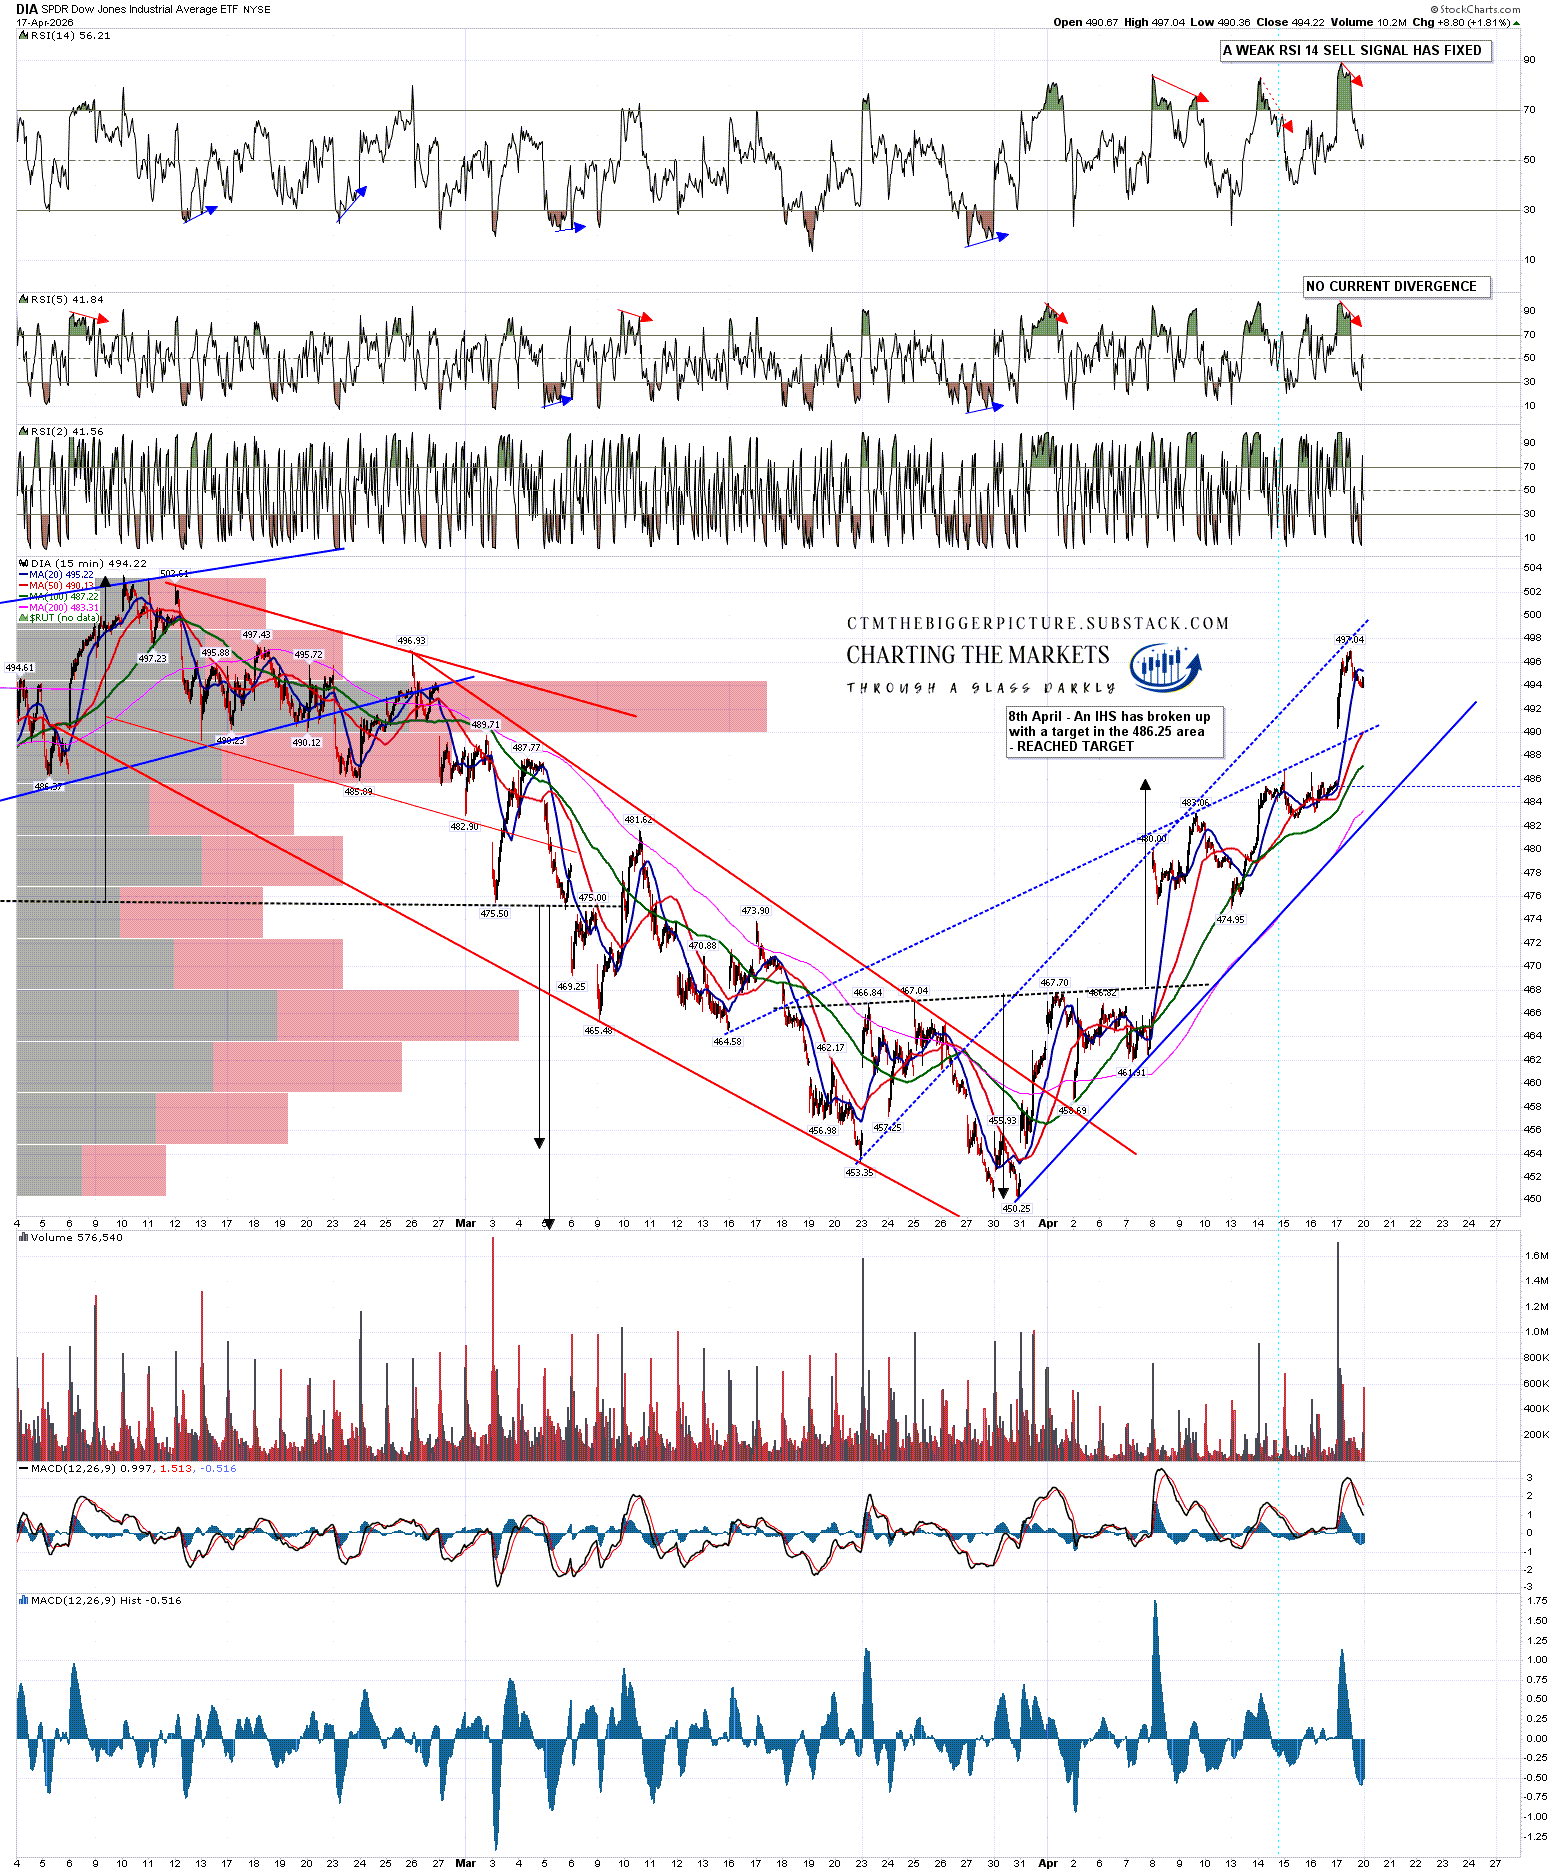
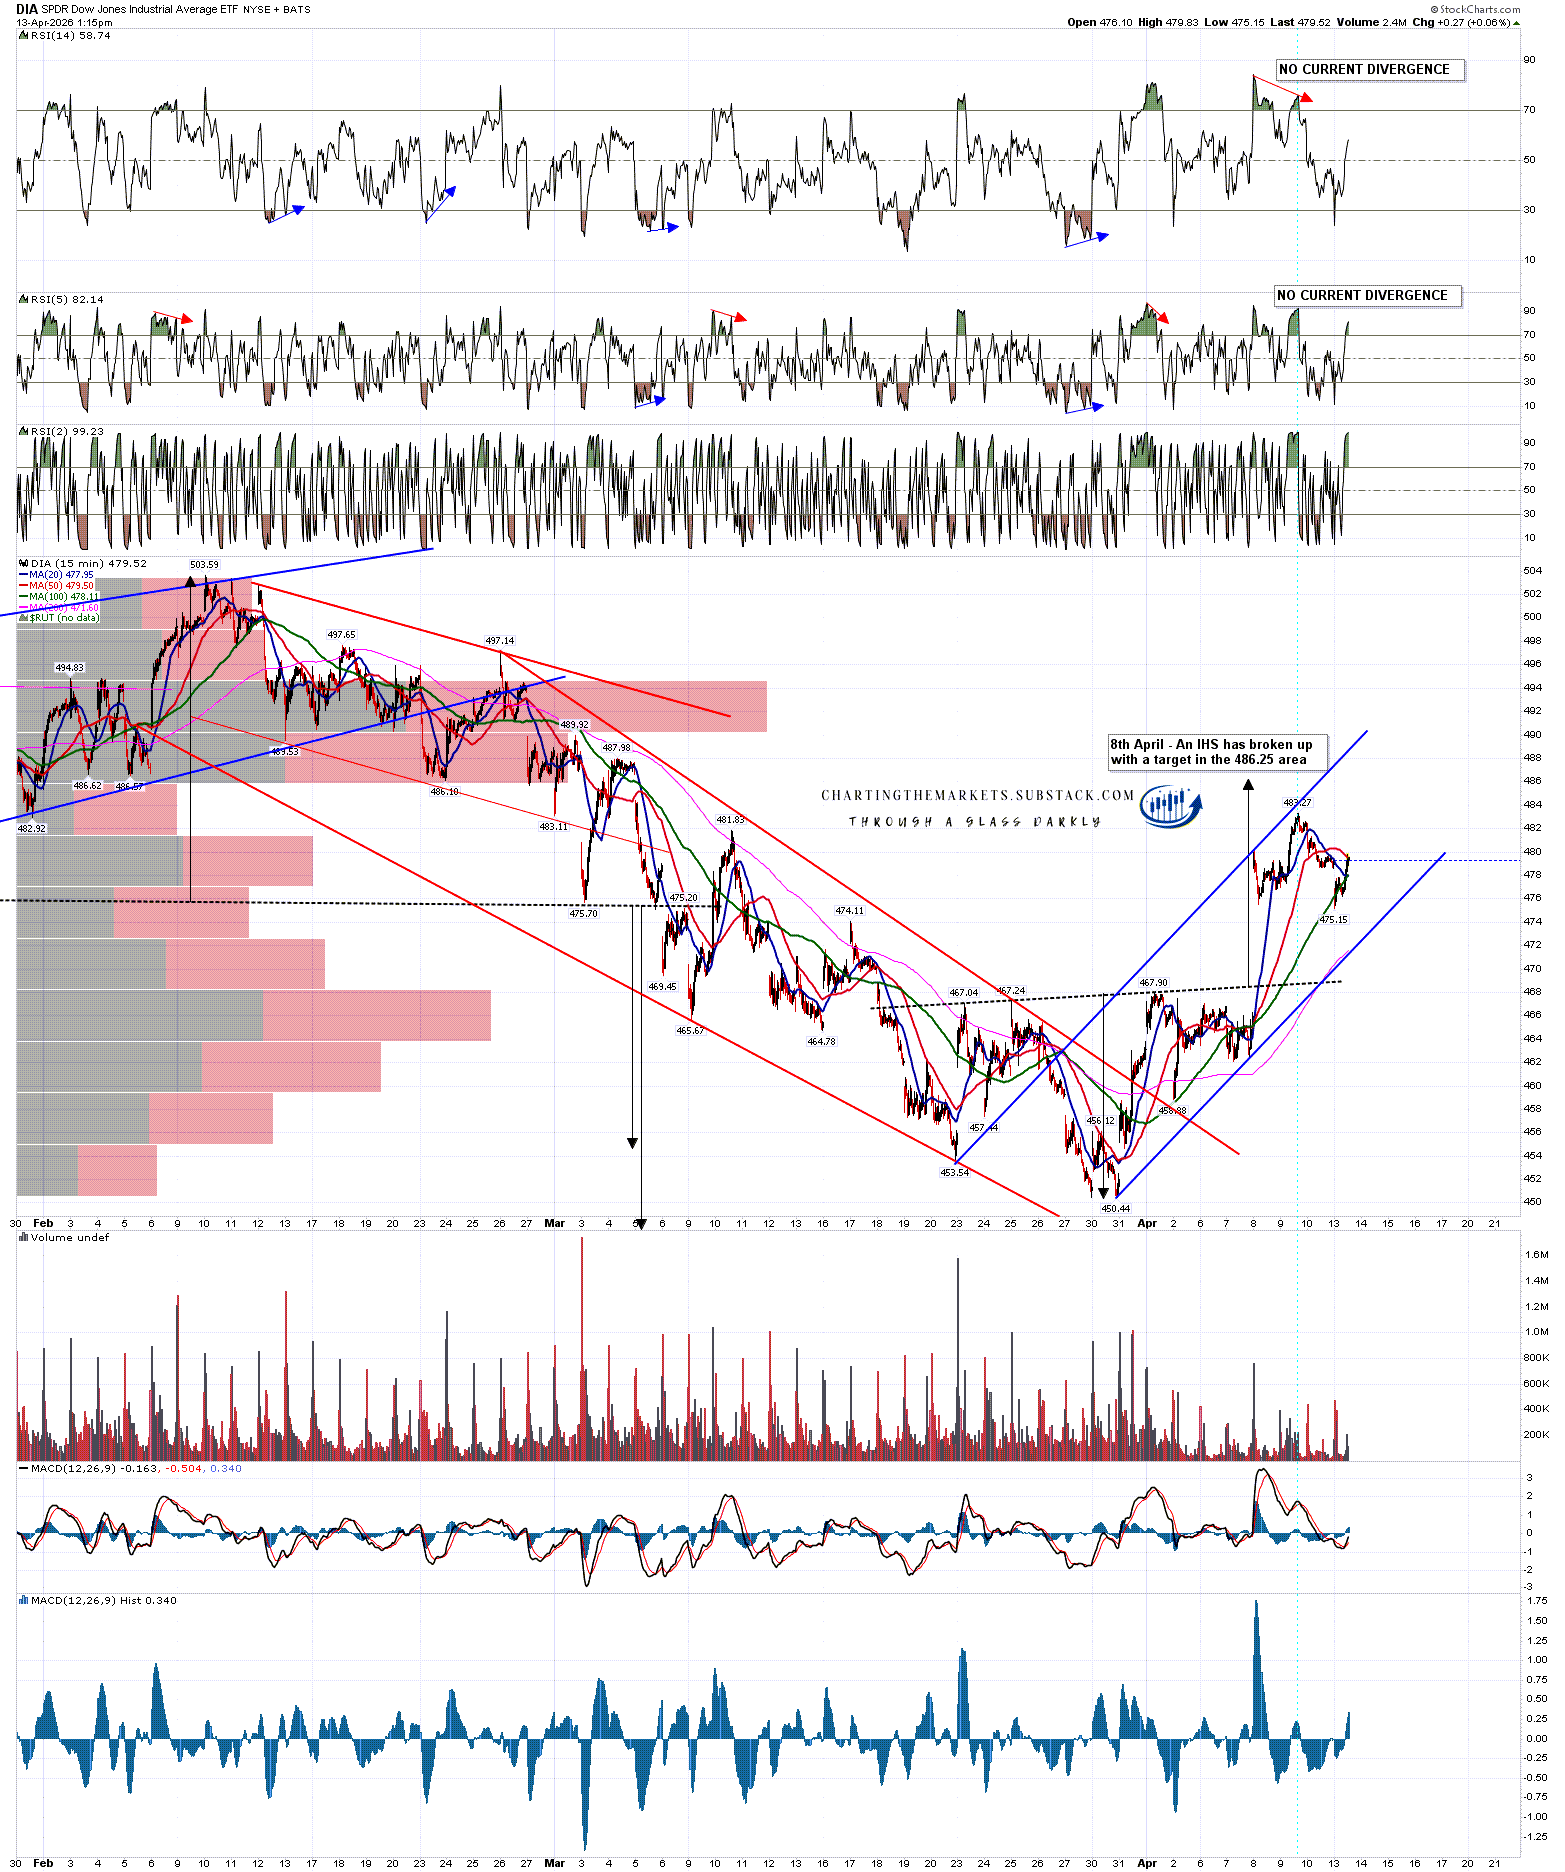
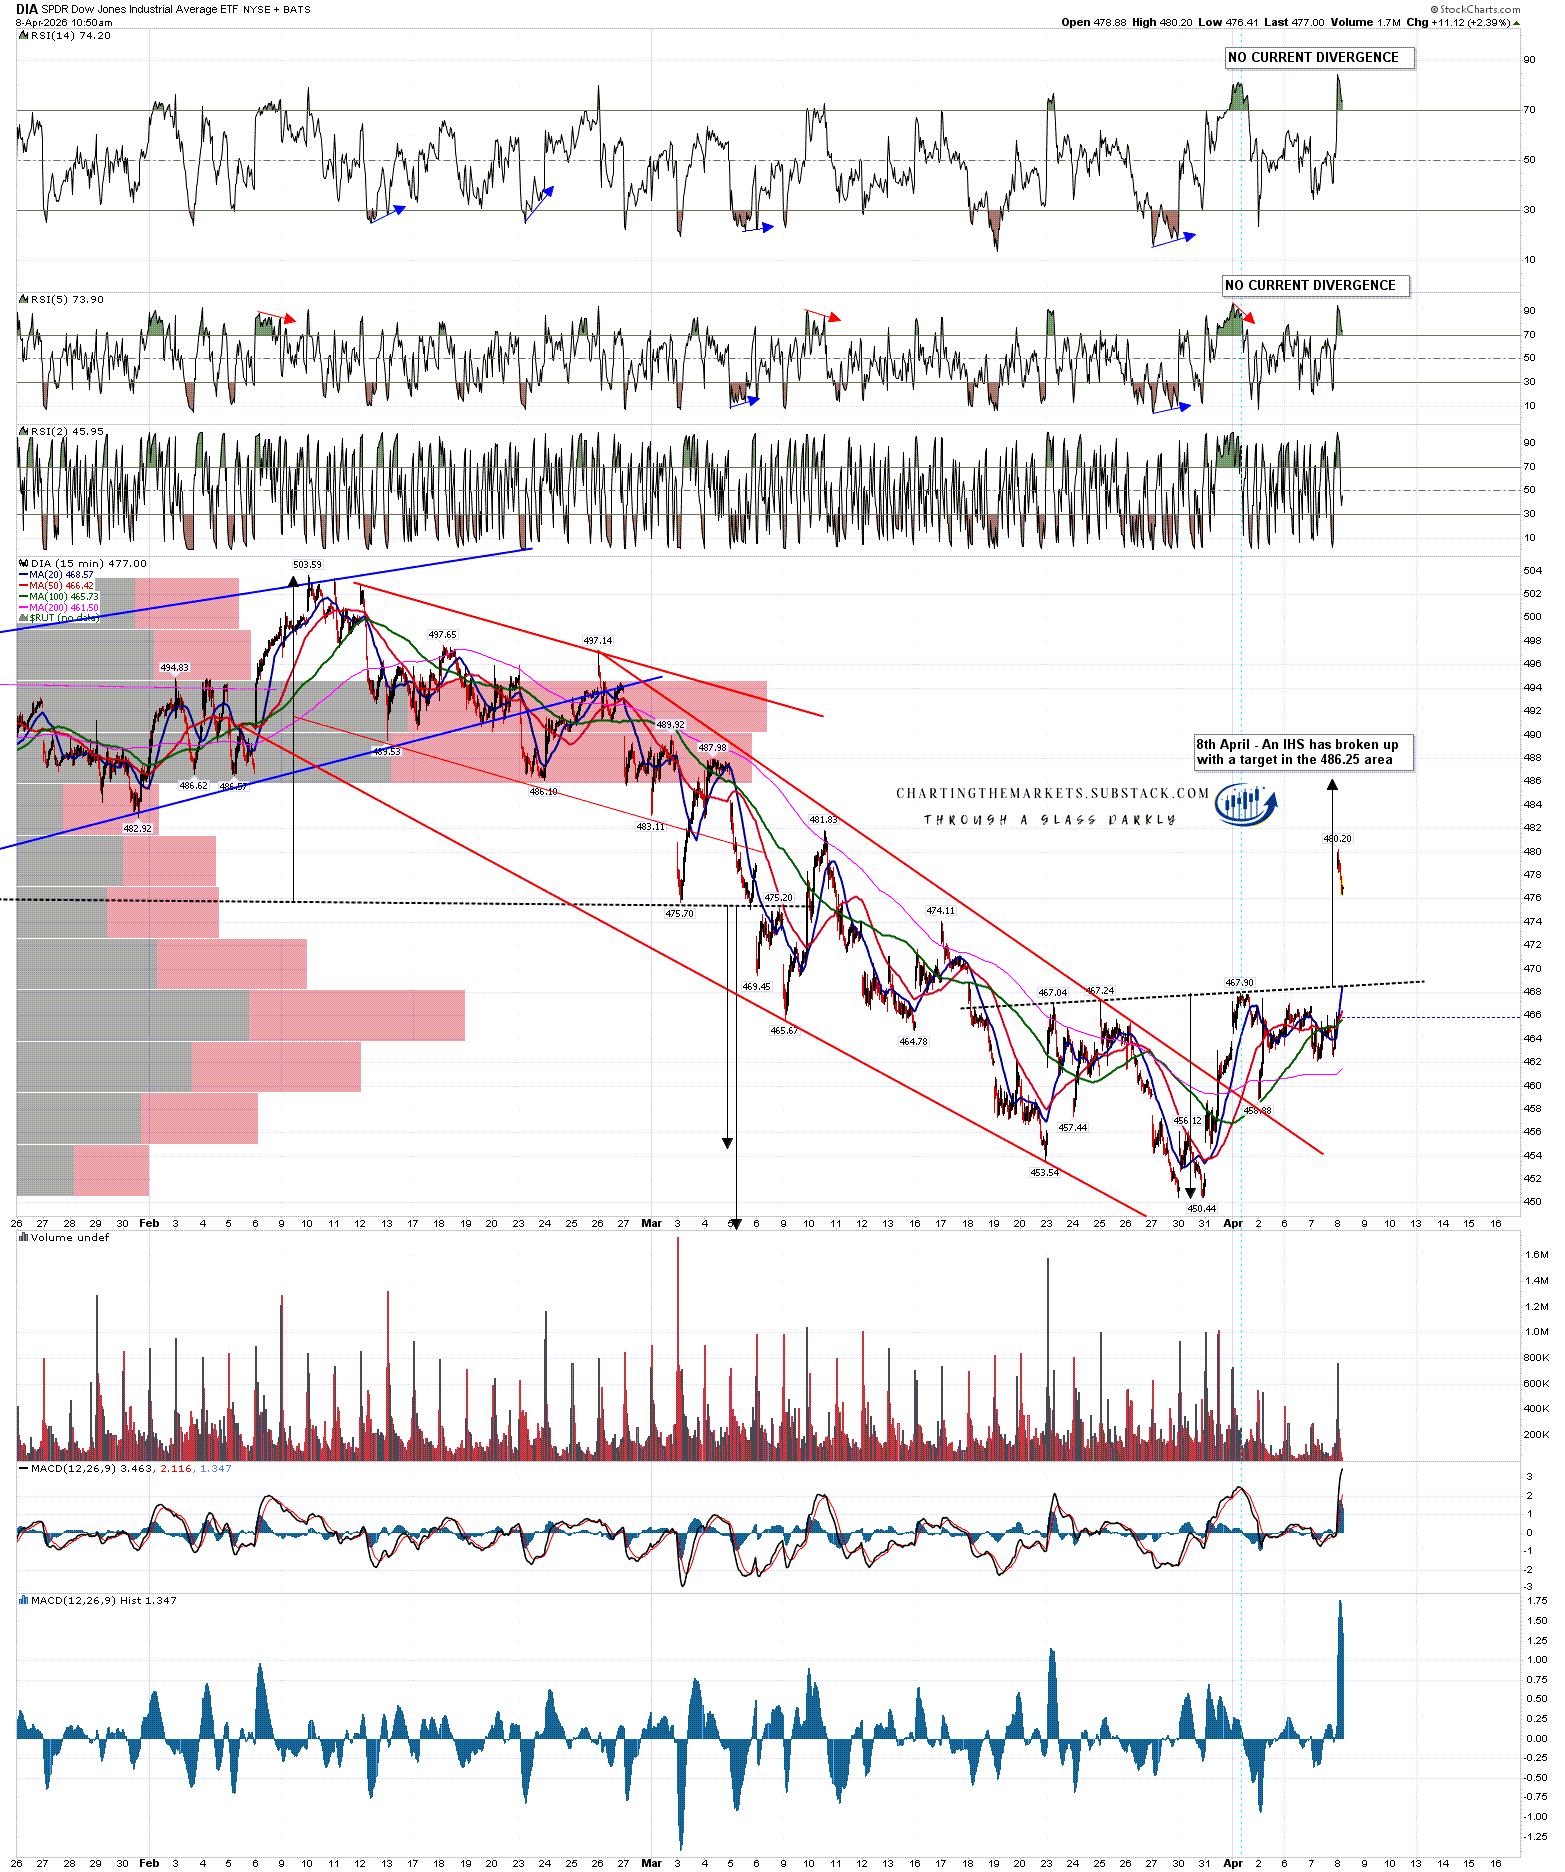
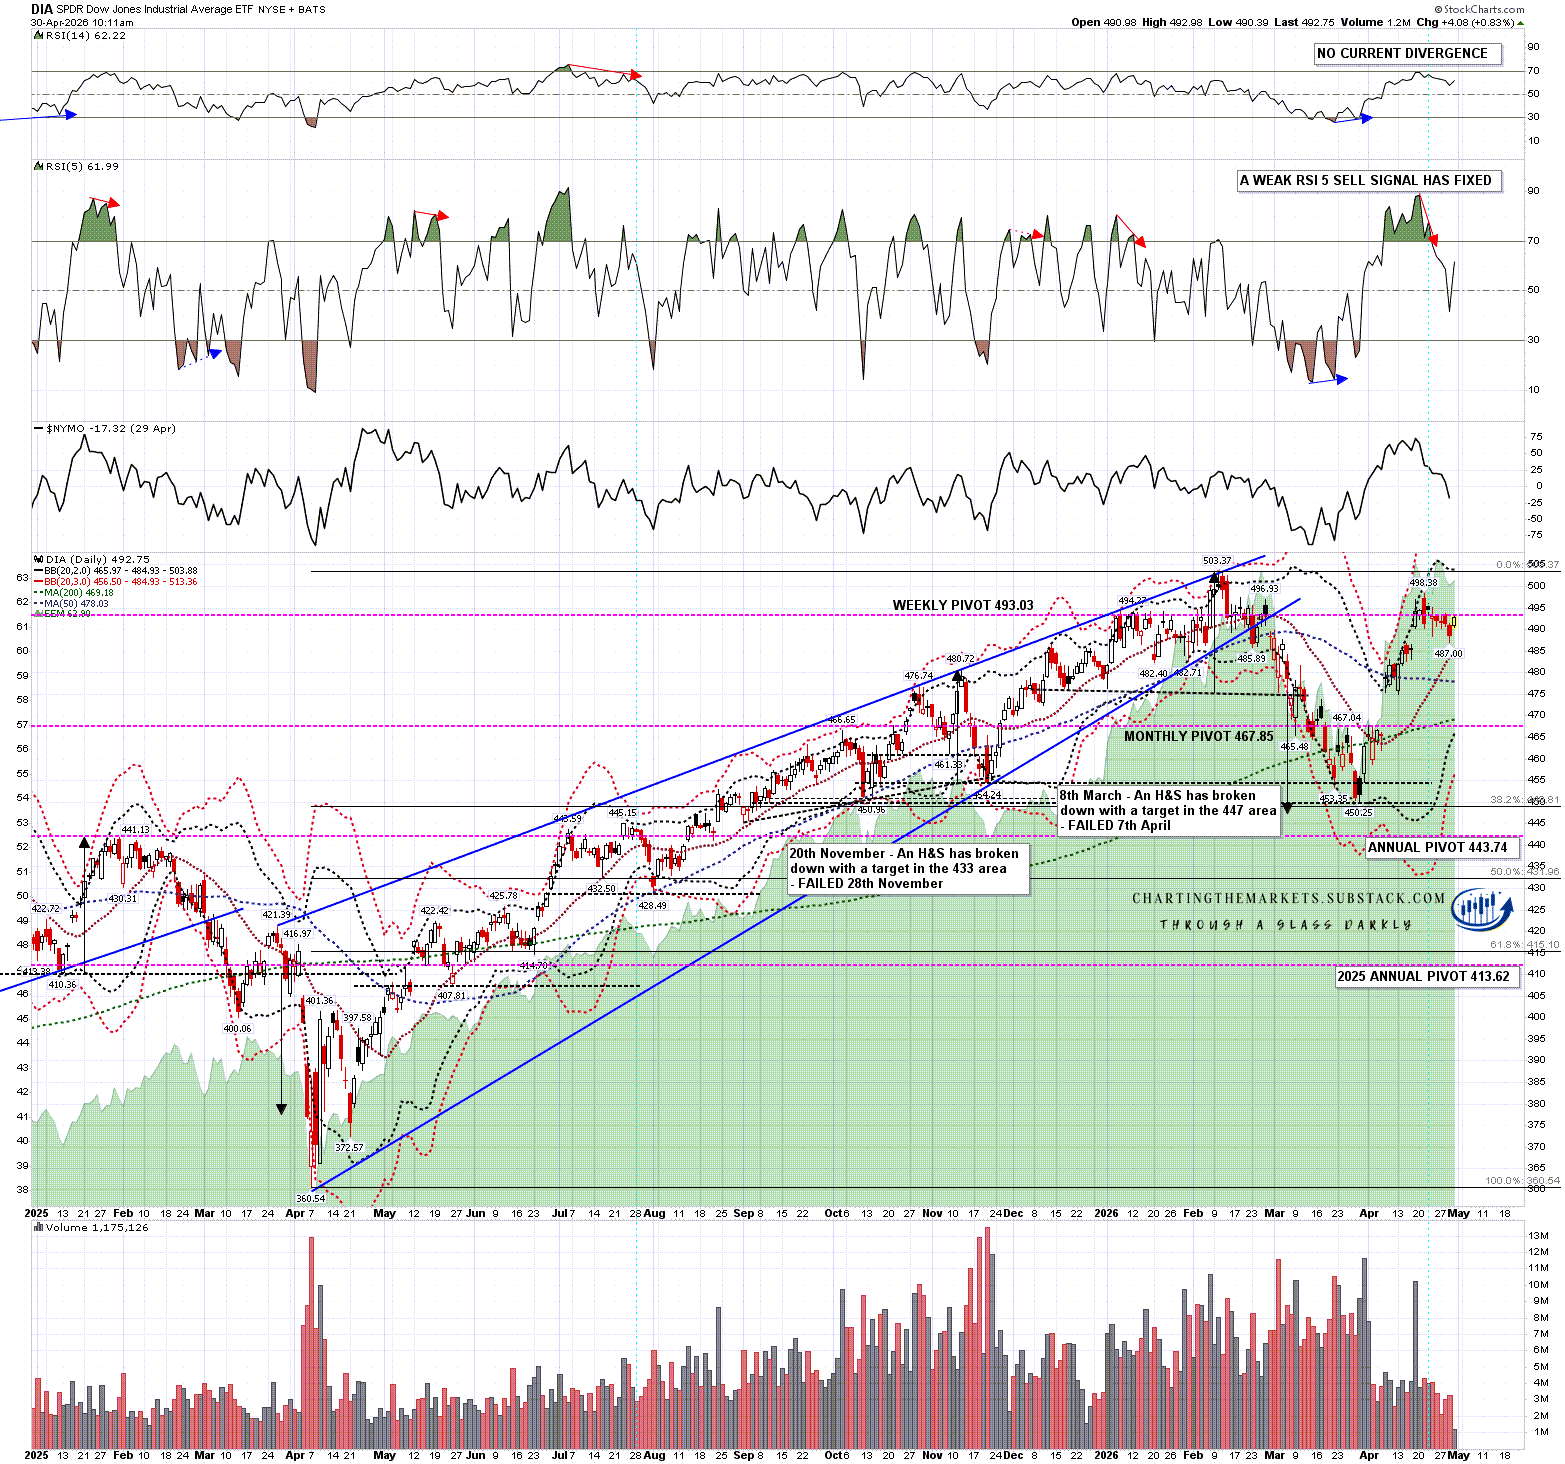
DIA is more interesting because there is no decent quality double top setup there, and for that reason I’d generally expect to see a retest of the all time high at 503.37 made in February. If we don’t see that there is a possible medium to low quality H&S setup but the left and right shoulders are very unbalanced. A weak RSI 5 sell signal has fixed.
DIA daily chart:
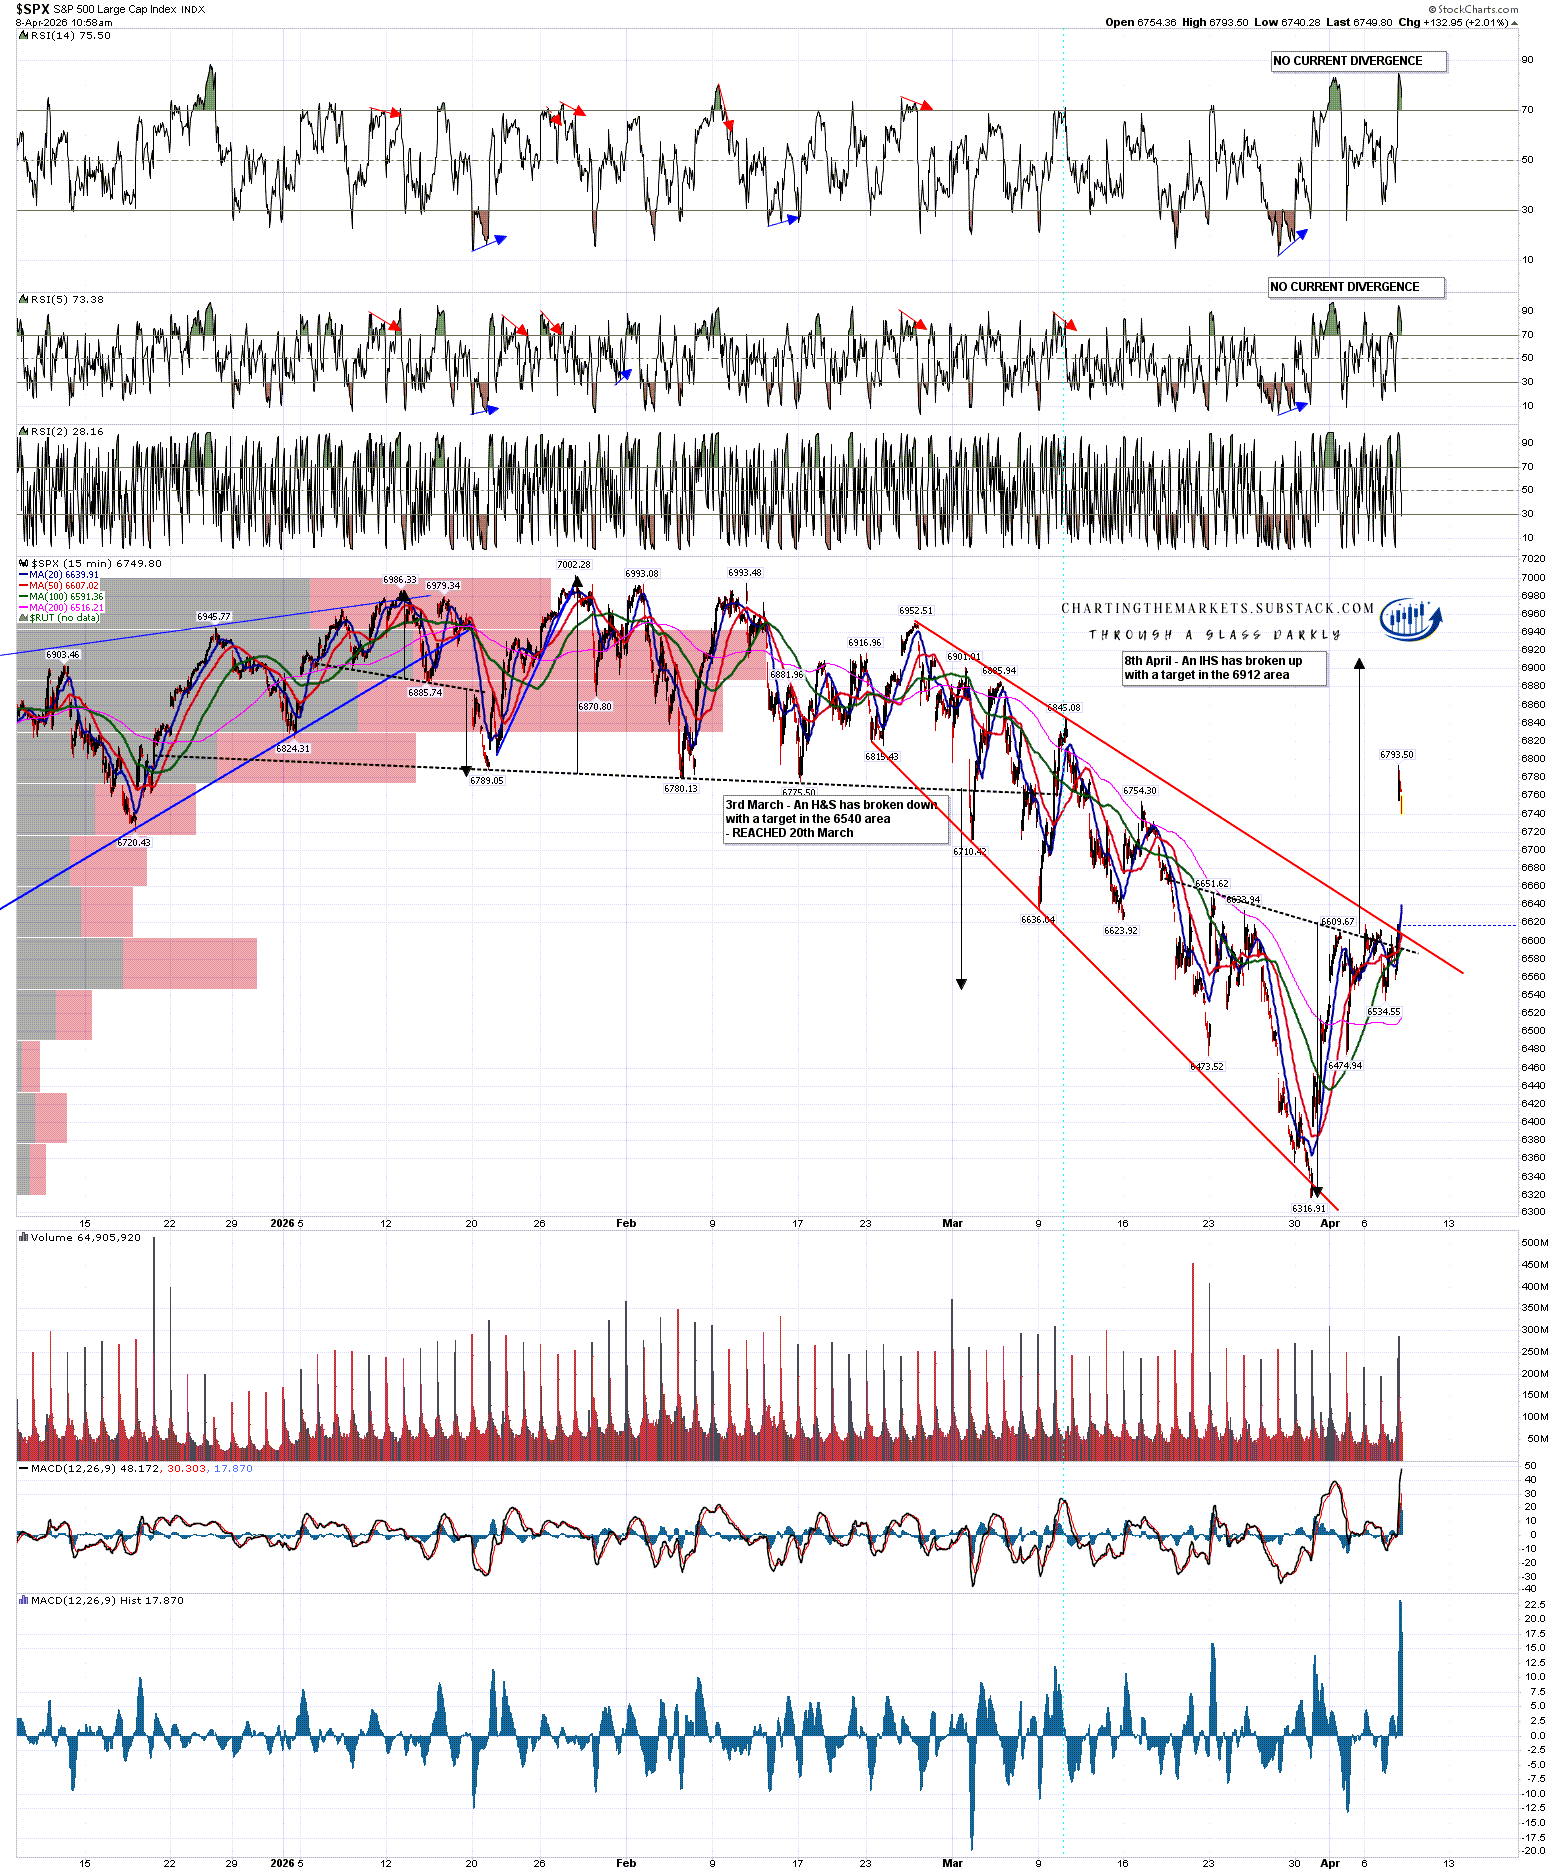
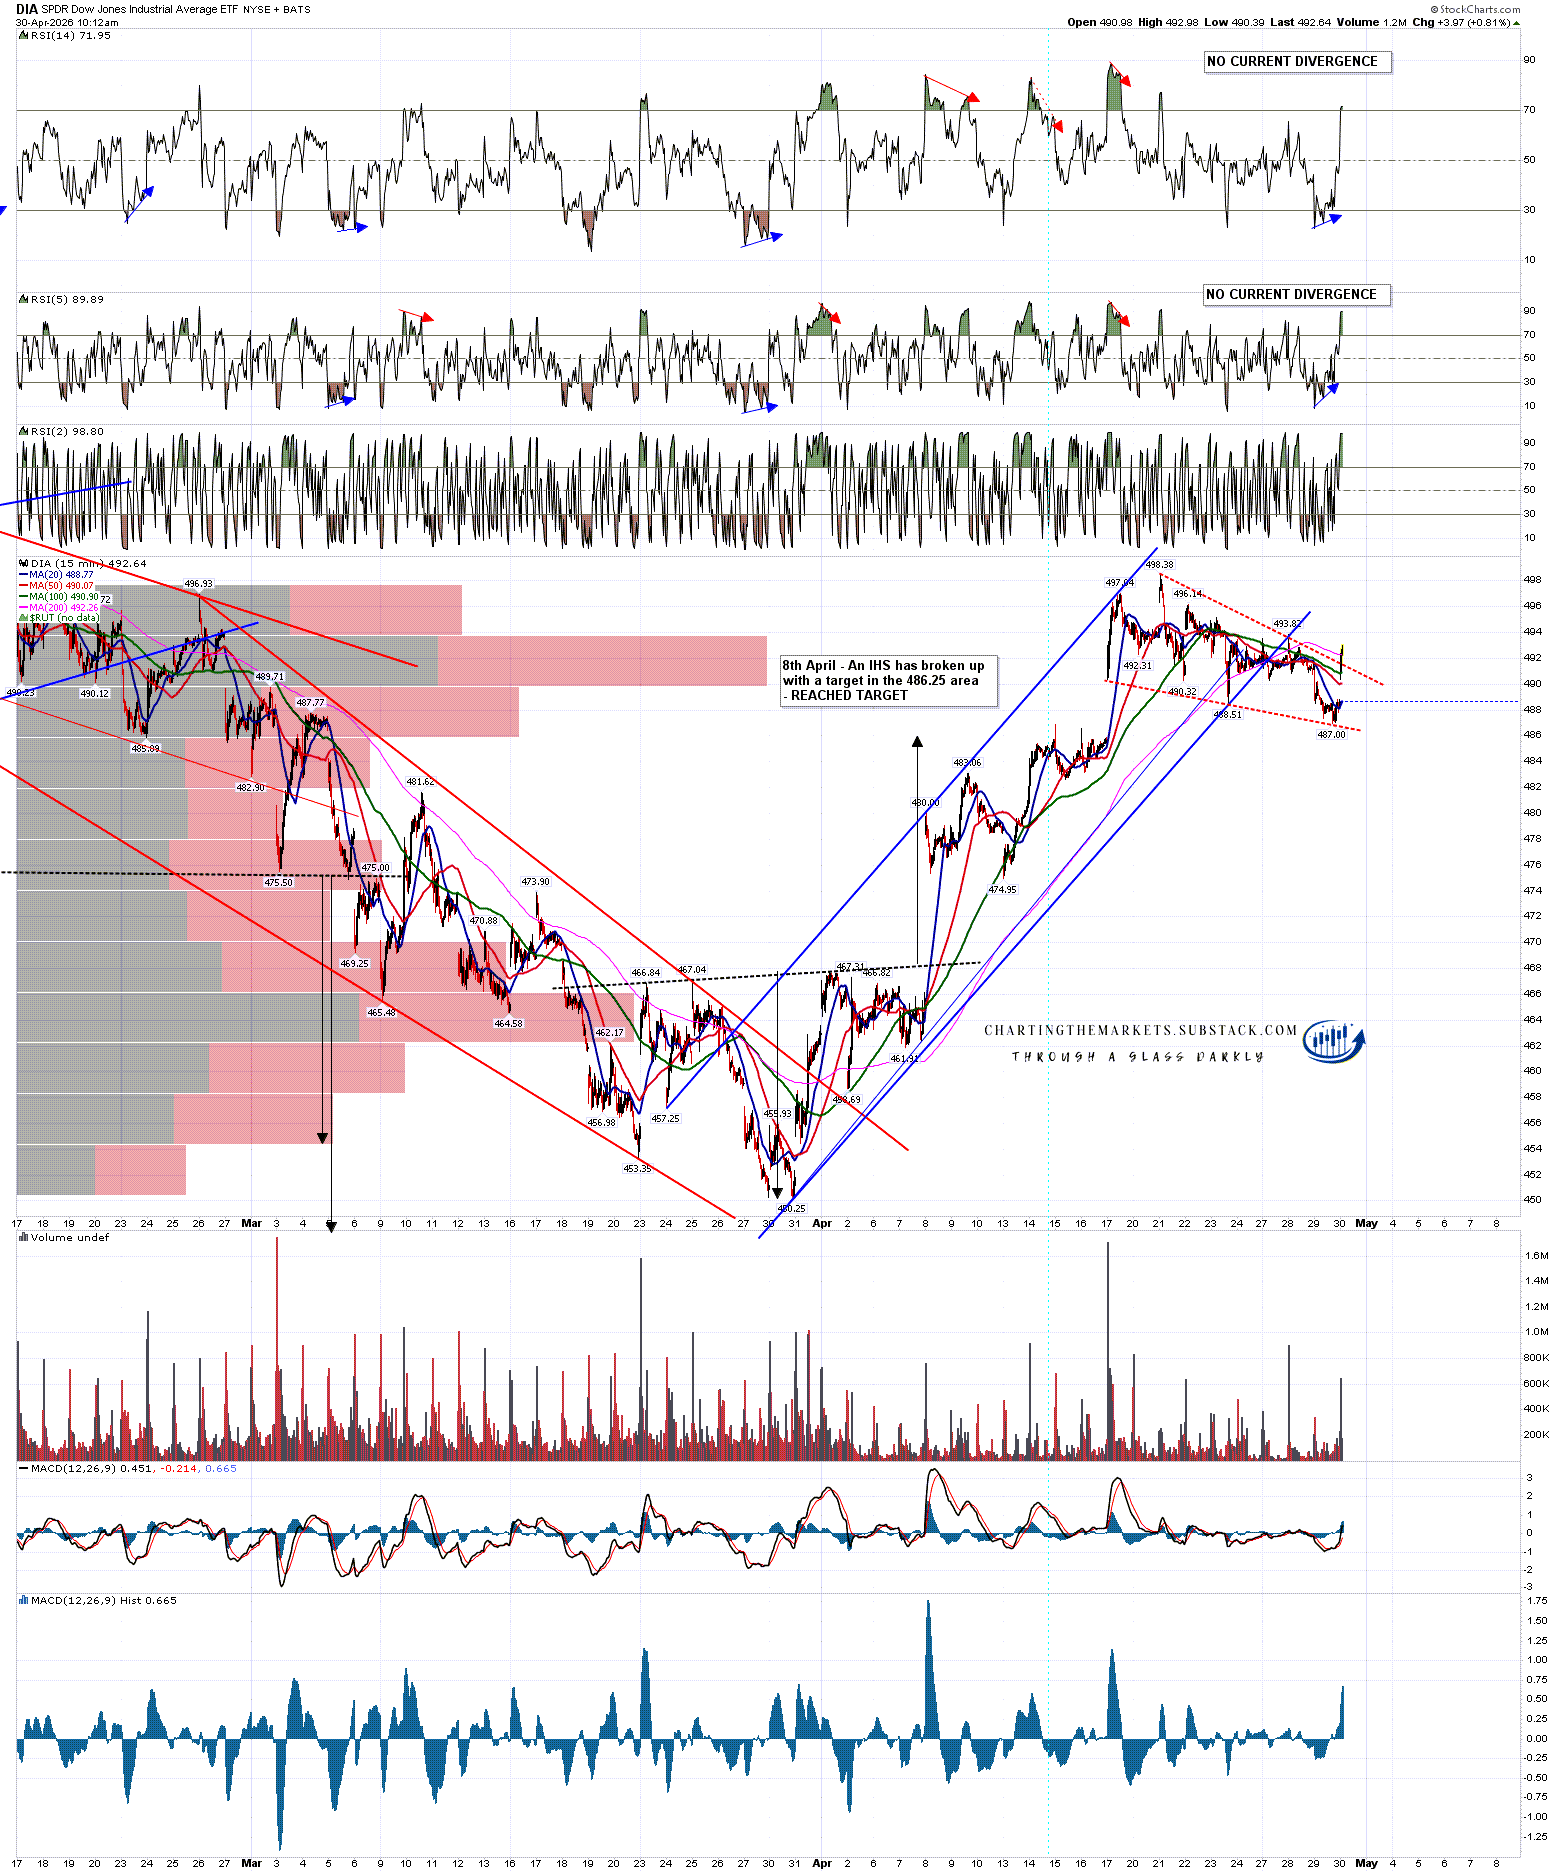
I won’t show the nice bull flag channel on IWM that is close to testing flag resistance at the time of writing, but instead I’ll show the decent quality bull flag falling wedge on DIA that broke up this morning with a target at a retest of the last high at 498.38.
DIA 15min chart:
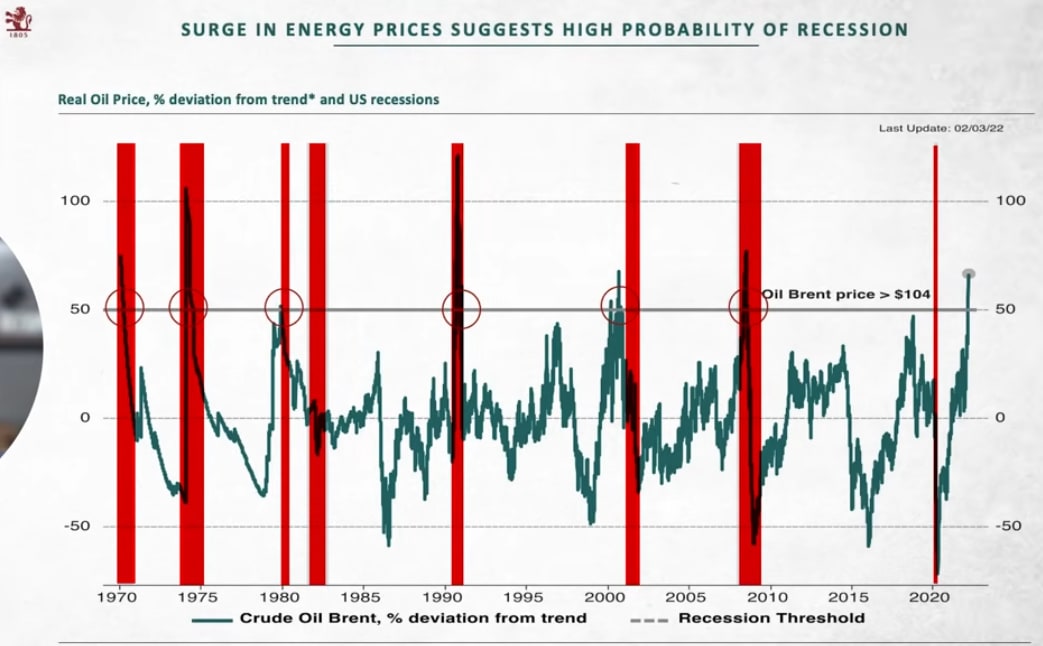
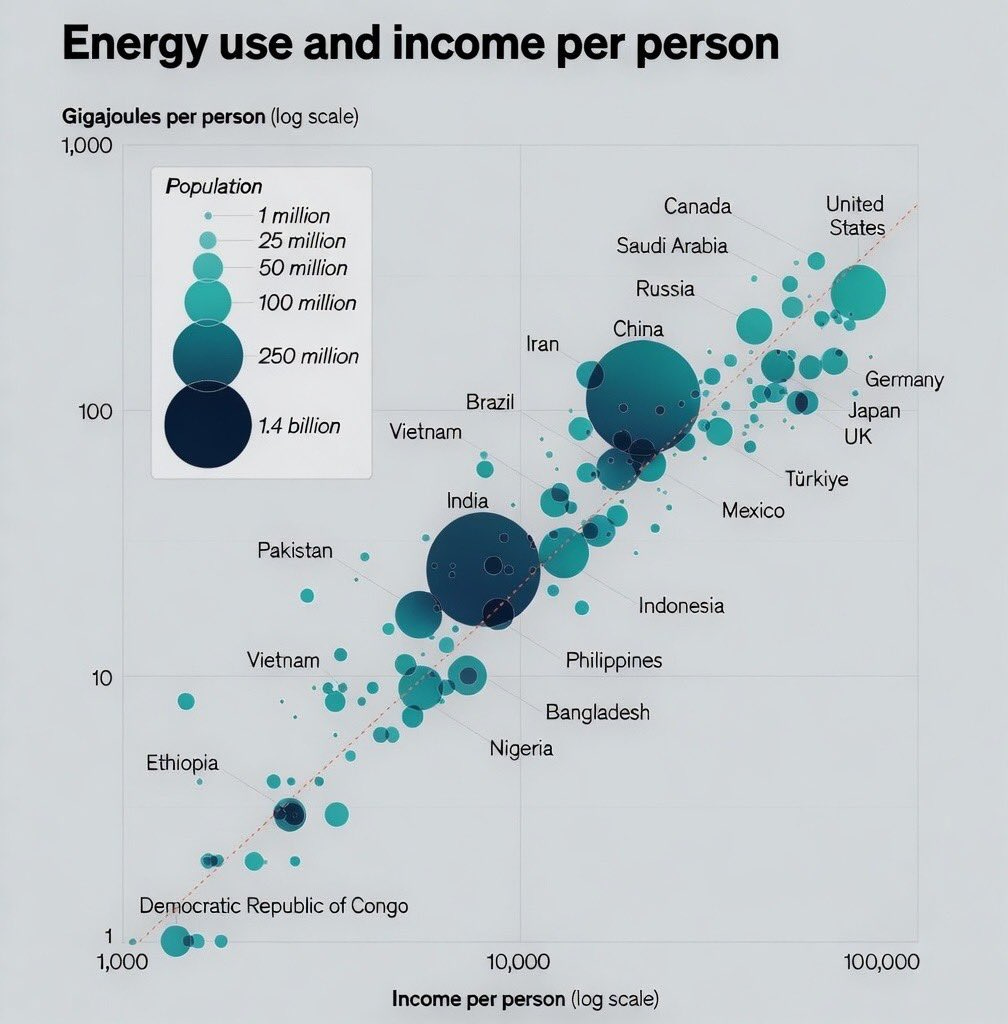
Why am I so pessimistic about prospects for the world economy and markets here? Simple, the world is in the early stages of a major oil shock with oil prices likely in my view to hit unprecedented levels and very possibly stay there for several months. As energy is used to make pretty much everything, we are now very likely to see a serious hit to economic activity, inflation and stock prices across the world.
As an illustration of that the chart below shows what is essentially a perfect correlation between energy use and income per person across the world. Normally that energy is free flowing and uninterrupted but for the next few months at least, that flow is going to be seriously disrupted.
If you like my analysis and would like to see more, please take a free subscription at my chartingthemarkets substack, where I publish these posts first. I also do a premarket video every day on equity indices, bonds, currencies, energies, precious commodities and other commodities at 8.45am EST, but only for paying subscribers. Other places to find me are my page on the platform previously known as twitter, and my YouTube channel.