- WE'RE JUST RANDOM SPECKS OF DUST IN A TORNADO TO THE MARKETS .......
- CHARTISTS MUST PUT ALL BIAS ASIDE AND LET THE CHARTS DO THE TALKING OR WE'LL SEE ONLY WHAT WE WANT TO SEE
- This blog has a copy of all header posts that I publish anywhere, so that those interested in seeing what my thoughts are on the markets can find them easily.
- I will be answering questions and responding to comments, so feel free to respond to any posts and I will see your comment even if it is not on the most recent post.
- If you're interested in seeing any intraday charts I post, I do that on twitter, and my twitter handle is @shjackcharts.
- The charts in the posts are as large as I can practically make them. if you would like to look at one more closely, click on it, and the link will take you to a larger version at screencast. If you click on that again, you will get a full page version, and can use the resizing function on your browser to enlarge parts of interest further.

Wednesday, 20 November 2024

Minority Report

On Friday morning I was looking at an interesting bull setup across the Crypto instruments that I look at every day. You can see that here if you’re interested in my Crypto channel on YouYube.

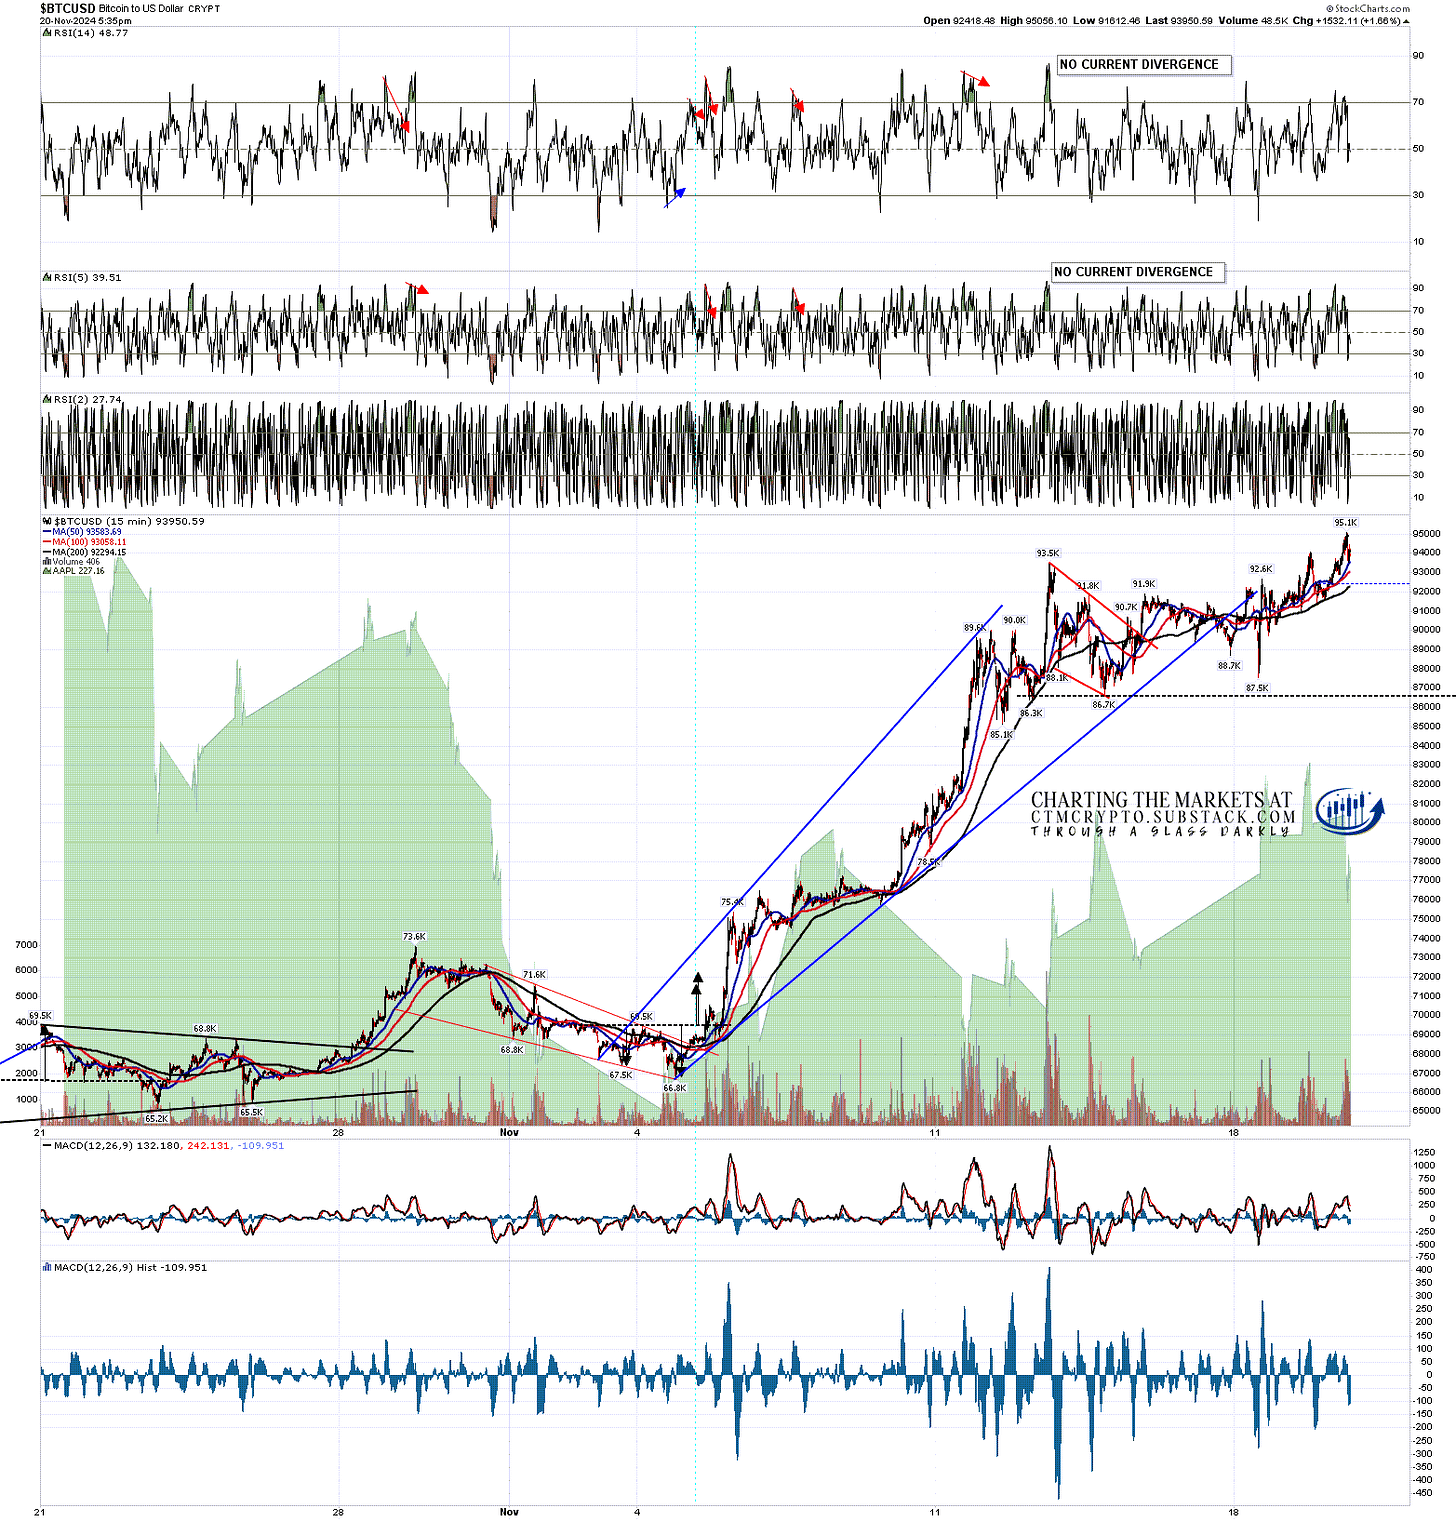
On Bitcoin (BTCUSD) a small but bullish leaning falling wedge was starting to break up, and I was saying that I was expecting that to deliver a retest of the all time high in due course. That has delivered now.

BTCUSD 15min chart:

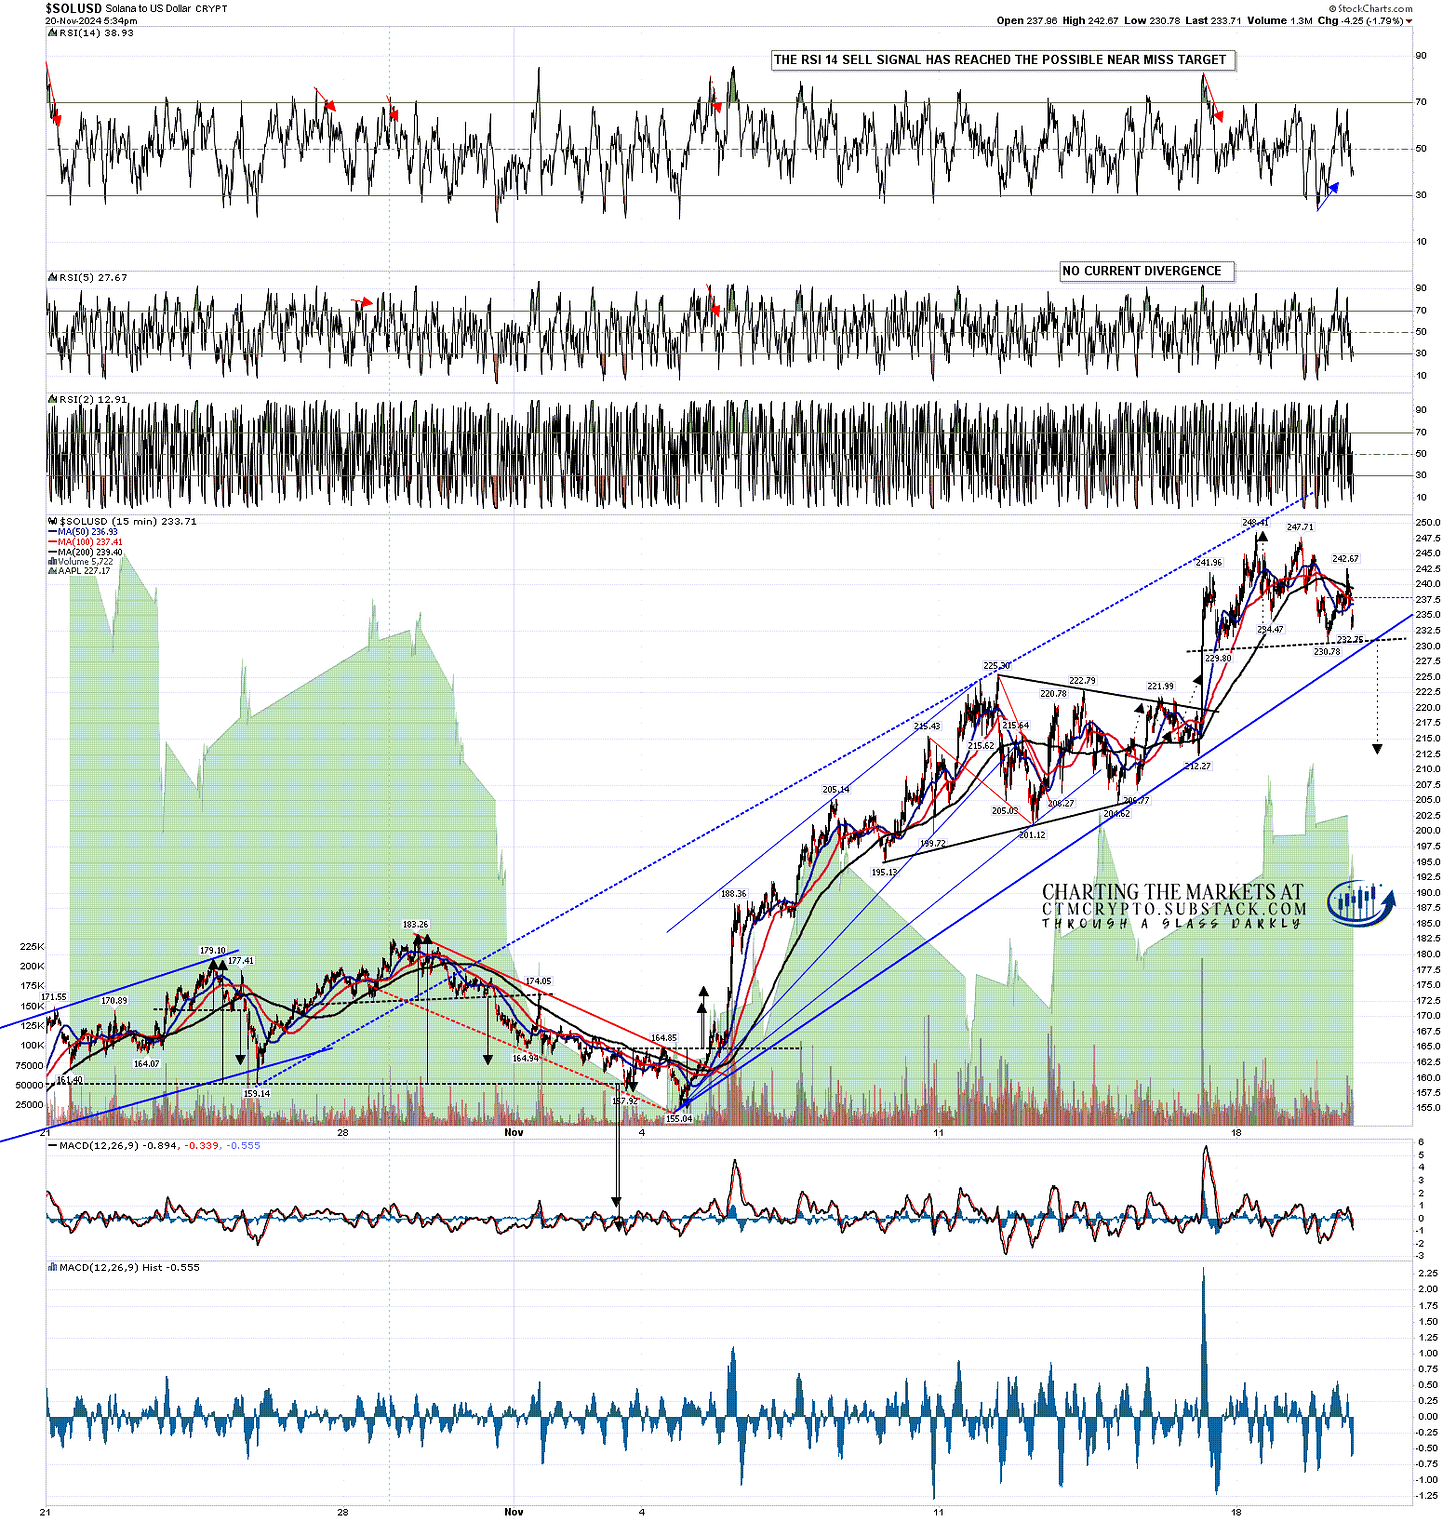
On Solana (SOLUSD) the part formed triangle on Friday morning more or less followed the ideal path arrows I drew on then and broke up into a new high. Since then a possible H&S pattern has formed that I was talking about in my video this morning, and since then that has almost completed forming, and we are waiting to see whether that will break down towards a target in the 212-4 area.

As with all H&S patterns, a break down followed by a rejection back above the right shoulder high at 242.67 would then likely deliver a retest of the current 2024 high at 248.41.

SOLUSD 15min chart:

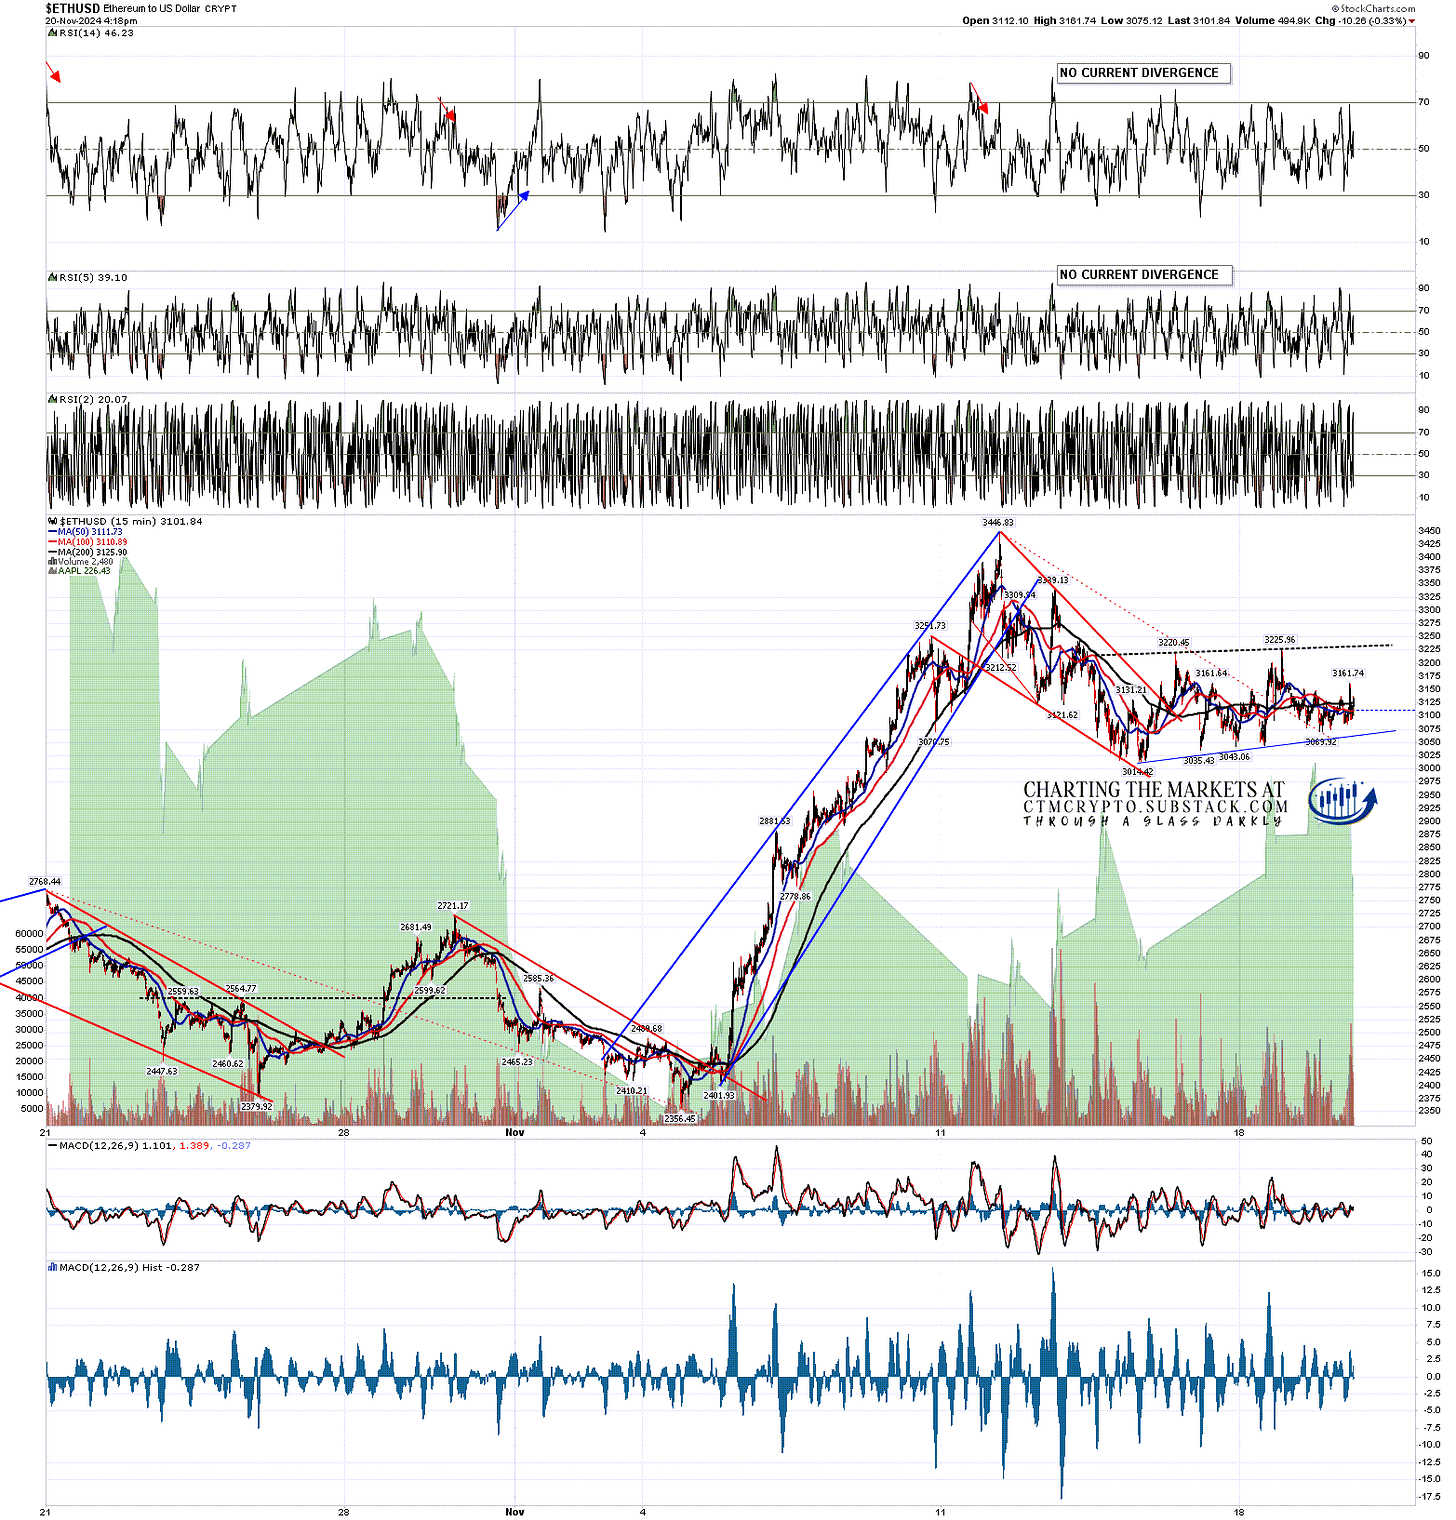
On Ethereum (ETHUSD) we have the minority report I mentioned in the title today. The bull flag falling wedge I was looking at on Friday broke up, then formed the likely bear flag shown on the chart below, and that is breaking down towards a retest of 3014.42. If seen that could deliver a possible double bottom for a retest of the November high at 3446.83, or a break down further that would likely still be, in my view, a larger bull flag forming.

ETHUSD 15min chart:

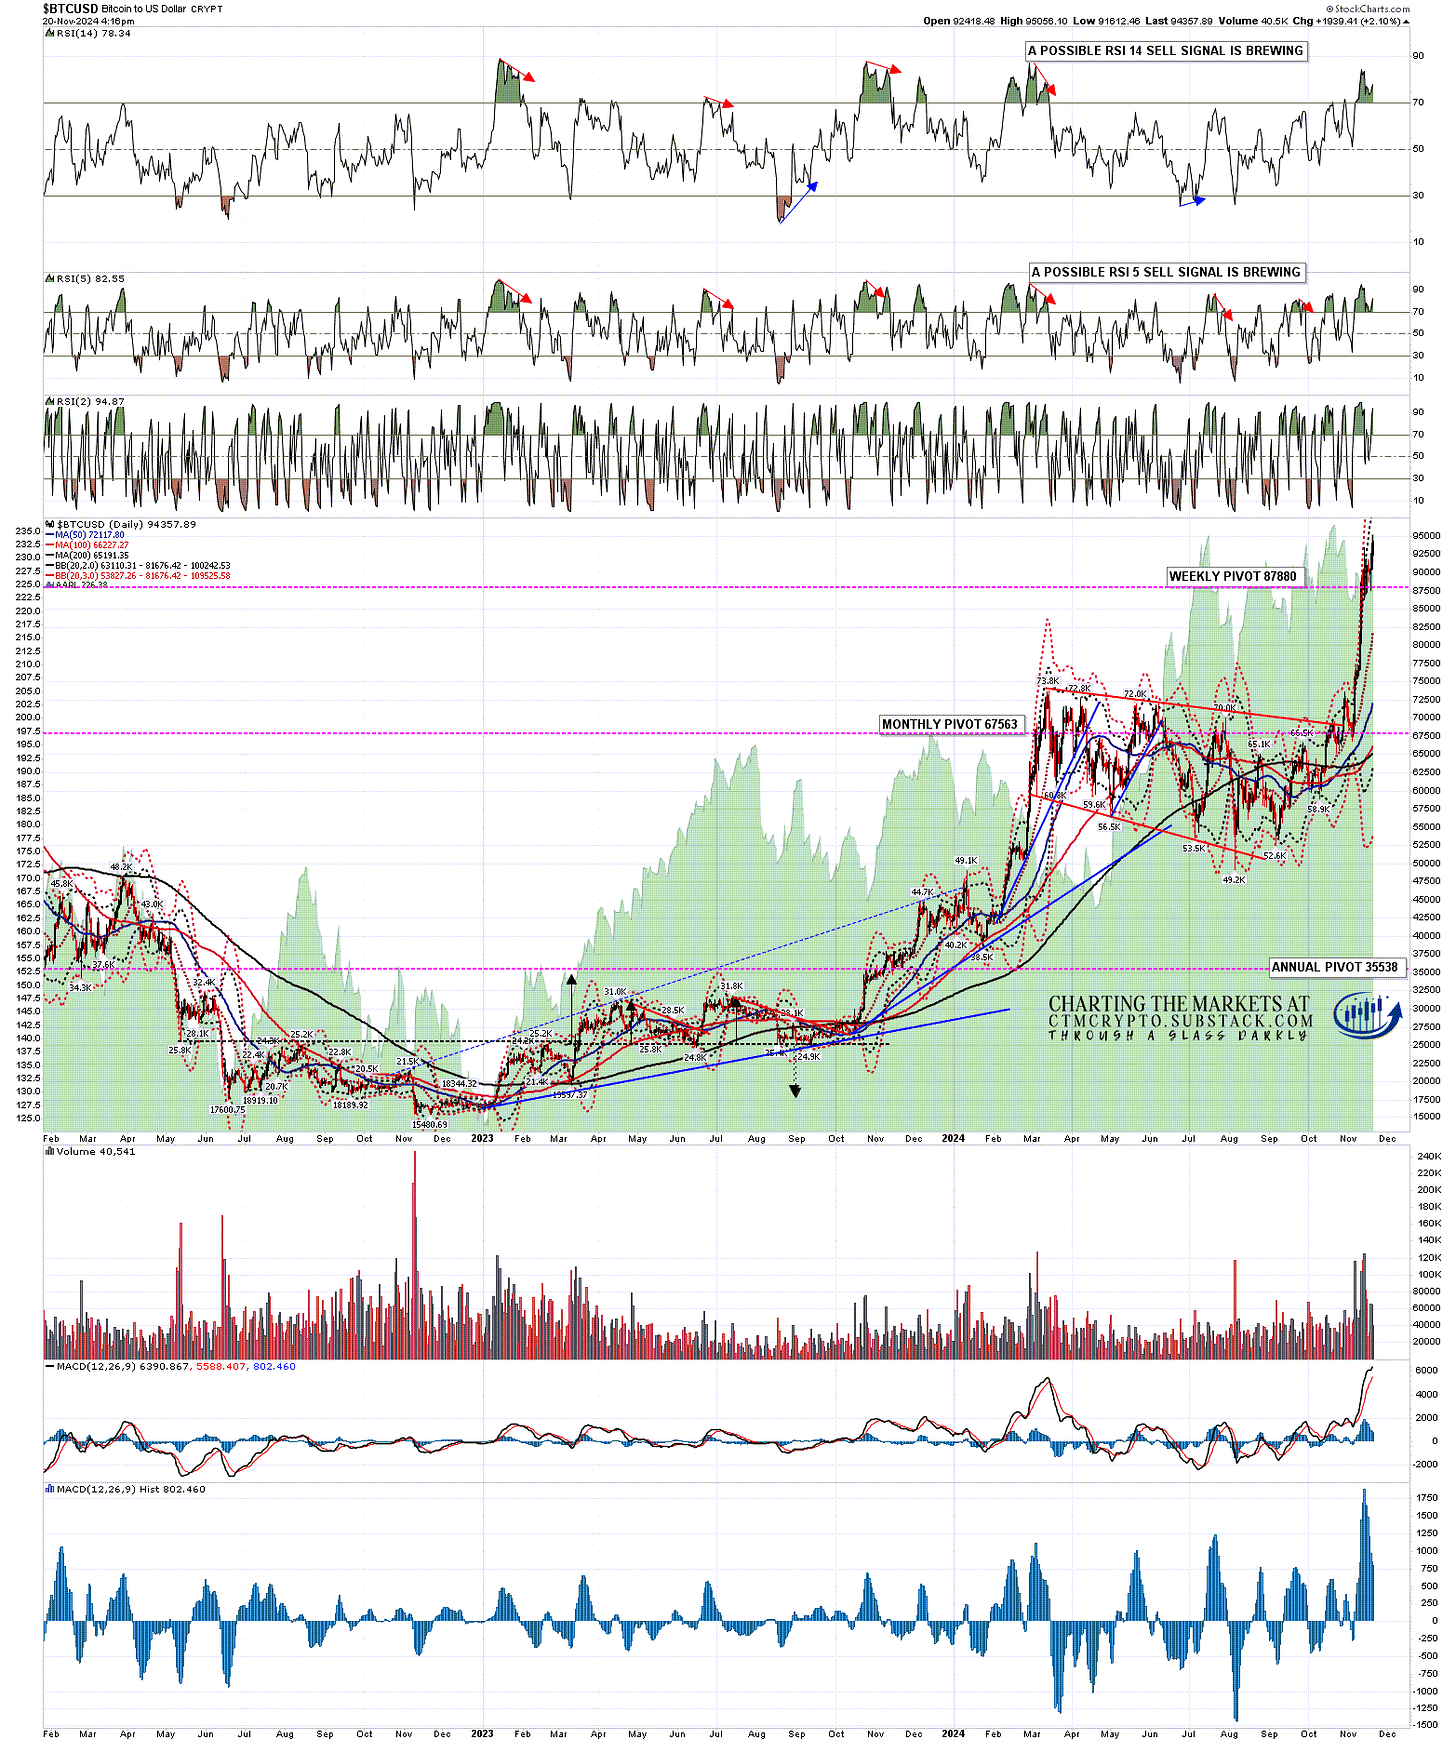
I was mentioning also on Friday morning that is we were to see high retests on Bitcoin and Solana, then good quality possible daily RSI 14 and RSI 5 sell signals would start brewing. Those are just potentials of course, but are telling us that a strong retracement may be close. You can see those have started brewing on the chart below.

BTCUSD daily chart

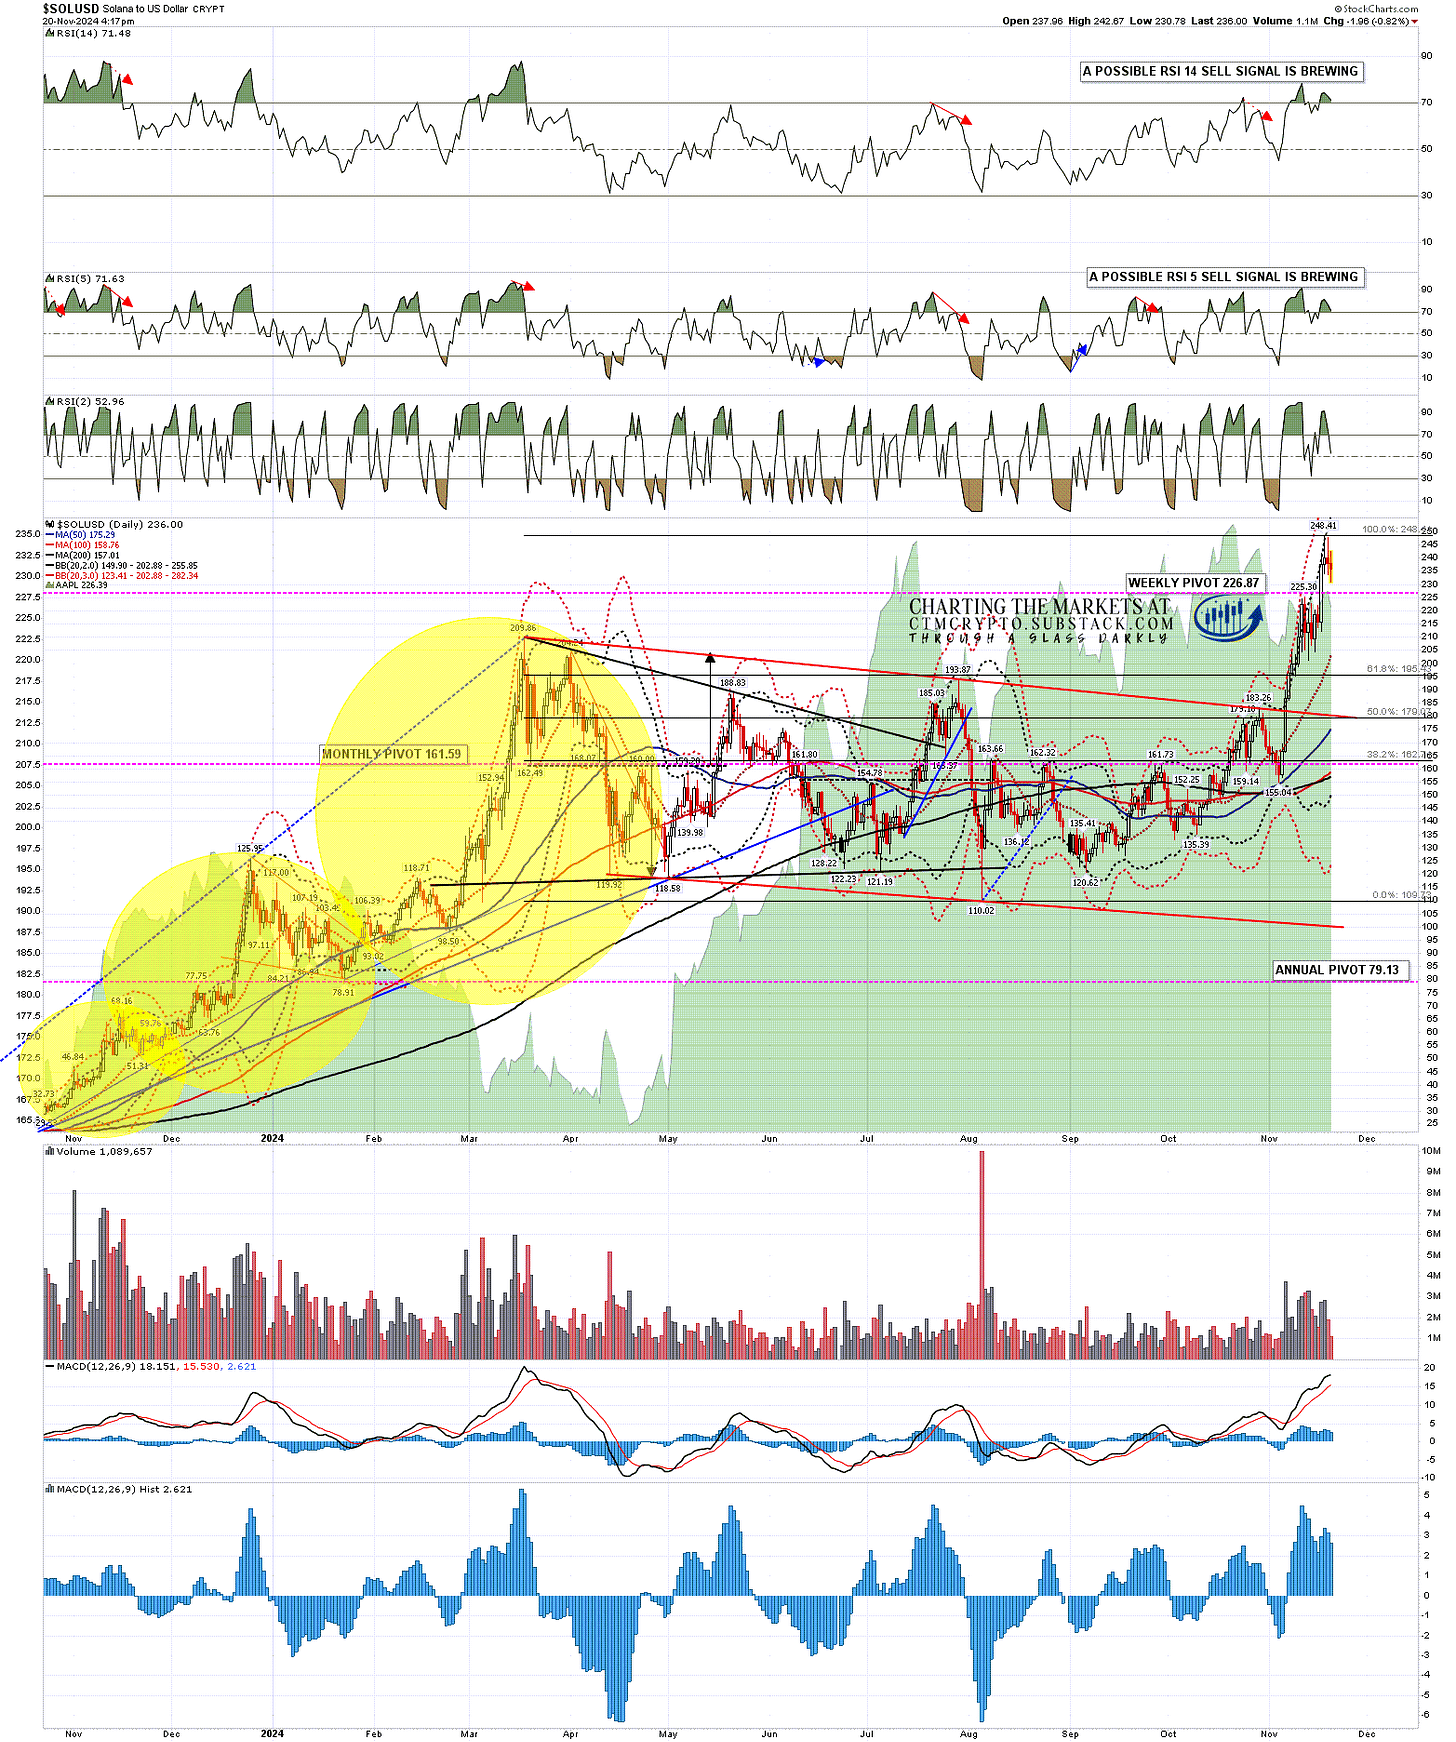
Solana also has both possible daily RSI 14 and RSI 5 sell signals below on the daily chart.

SOLUSD daily chart:

Every so often I see some really comical TA howlers online from forecasters who are somewhat longer on enthusiasm and volume than they are on knowledge or experience, as some of these are worth sharing as good learning opportunities.

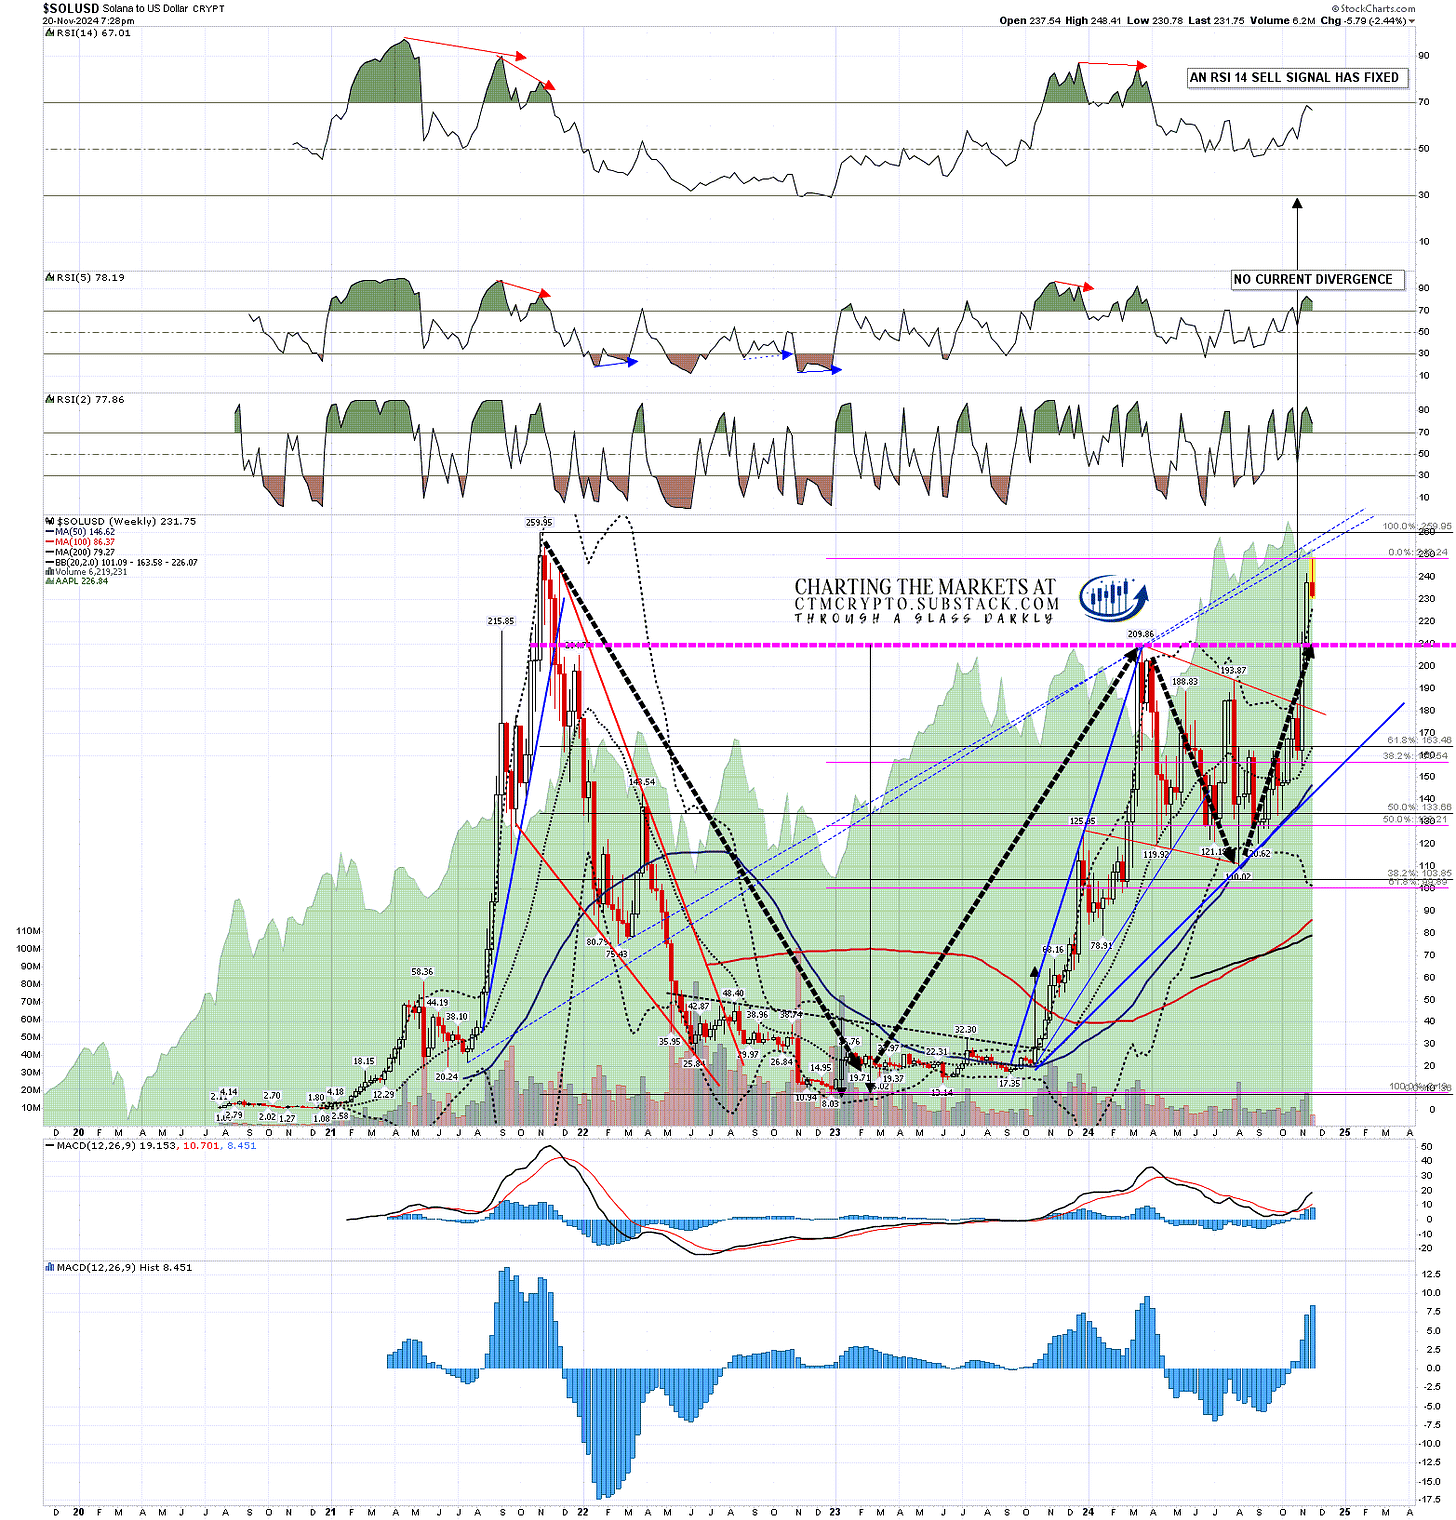
A few days ago a well known Crypto forecaster who shall remain nameless, but who has more than 100k followers on X, posted this on the Solana weekly chart as a cup with handle pattern and a friend of mine asked me this morning whether he was right.

You can see below that it is a nice looking pattern, though overall I think these patterns are a mediocre kind of bull flag, but I told my friend that in my view it didn’t qualify.

The reasoning is that if this is a cup with handle pattern then it has now broken up with a target in the $410 area. If Solana reaches that target, as I think it may well do anyway, then no doubt this forecaster will consider himself a charting genius.

However, the cup with handle is either a reversal or a continuation pattern, and what kind of bullish continuation pattern starts with a move that wipes out 97% of the instrument’s value? None. A 97% decline (259.95 to 8.03) is not a bullish continuation pattern forming, it is a really brutal bear market. As a reversal pattern it also fails, as a reversal pattern should never be so large that is dominates the trend that it is supposed to be reversing. The further over the 50% high to low level a reversal pattern grows, the less likely it is to be one. This one is slightly over 80% of the preceding trend, and by then there is no way this can be a reversal pattern.

What’s the takeaway here? Context is important.

SOLUSD weekly chart:

As a matter of fact my finger in the air working estimates for the next bull market highs on Bitcoin and Solana are in the $150k to $200k area for Bitcoin and $300 to $500 area on Solana, so that forecaster may well be right, but only because Solana was headed there anyway.

If you’d like to see more of these posts and the other Crypto videos and information I post, please subscribe for free to my Crypto substack.

I'm also to be found at Arion Partners, though as a student rather than as a teacher. I've been charting Crypto for some years now, but am learning to trade and invest in them directly, and Arion Partners are my guide around a space that might reasonably be compared to the Wild West in one of their rougher years. 


Sunday, 10 November 2024

Strange Days on US Treasuries

In my last post on oil and natural gas I was talking about starting to do a post every week or two reviewing a single instrument that I cover in my futures and currencies charts on multiple timeframes to sketch out the higher probability paths going forward. This is the first of those posts, apart obviously from my earlier posts on oil and nat gas. I’ll be aiming to do one of these posts every week.

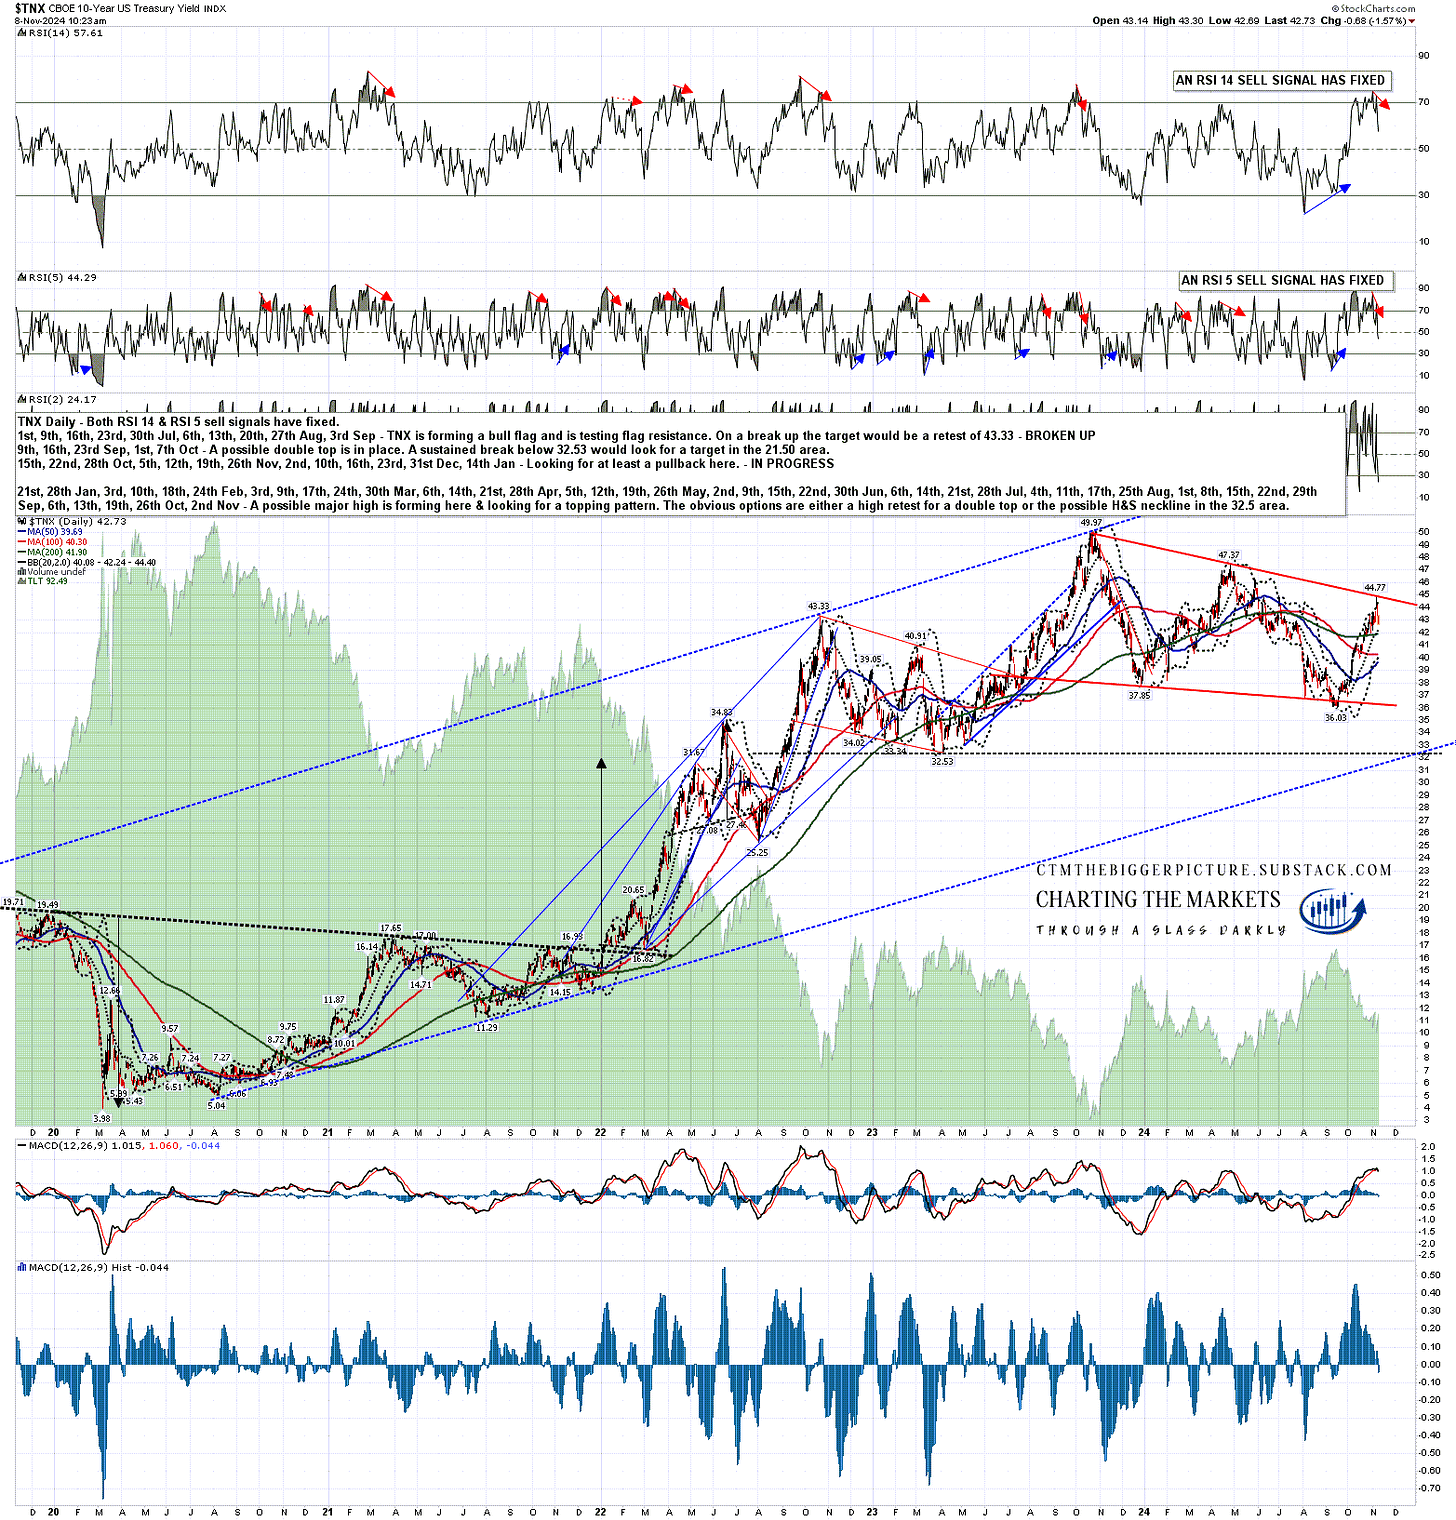
This week I’m going to look at a very important inflection point that looks likely to be coming up on US treasuries over the next few months to a year. I wrote in January on the TNX daily chart below that I was expecting a possible topping pattern to form, either a double top or an H&S after a test of the obvious possible H&S neckline at 32.53.

Three months ago I was leaning strongly towards the H&S option as inflation had returned almost to the Fed’s target, and the Fed was likely to start cutting rates, but to my surprise a retest of the 2023 high at 49.97 on TNX to form the second high of a possible double top now looks like the obvious next big target after we see some retracement here.

Why is that? Well the rally on TNX from the September low at 36.03 to the high at 44.77 this week was not something I thought was likely after the drops this year in inflation and the start of the Fed cutting interest rates, but I had drawn in a possible bull flag pattern that I was thinking could be forming and TNX perfectly hit and confirmed that bull flag falling wedge at the high this week.

As a matter of fact I was looking at a very similar setup a few days ago when SOLUSD (Solana) hit flag resistance there. Again there was a good setup for short term reversal there that delivered, and after that Solana broke up from the flag and has now reached the flag target at the retest of the 2024 high at 209.86. You can see the post I wrote on 30th October at that flag resistance test here, and the SOLUSD daily chart I showed in that post with the bull flag resistance test is here.

What is the obvious path forward for TNX here? Pretty much exactly what we have seen on Solana since, a pullback short term, then a break up through bull flag resistance towards the flag target at the retest of the 2023 high at 49.97. It probably won’t play out as fast though.

TNX daily chart:

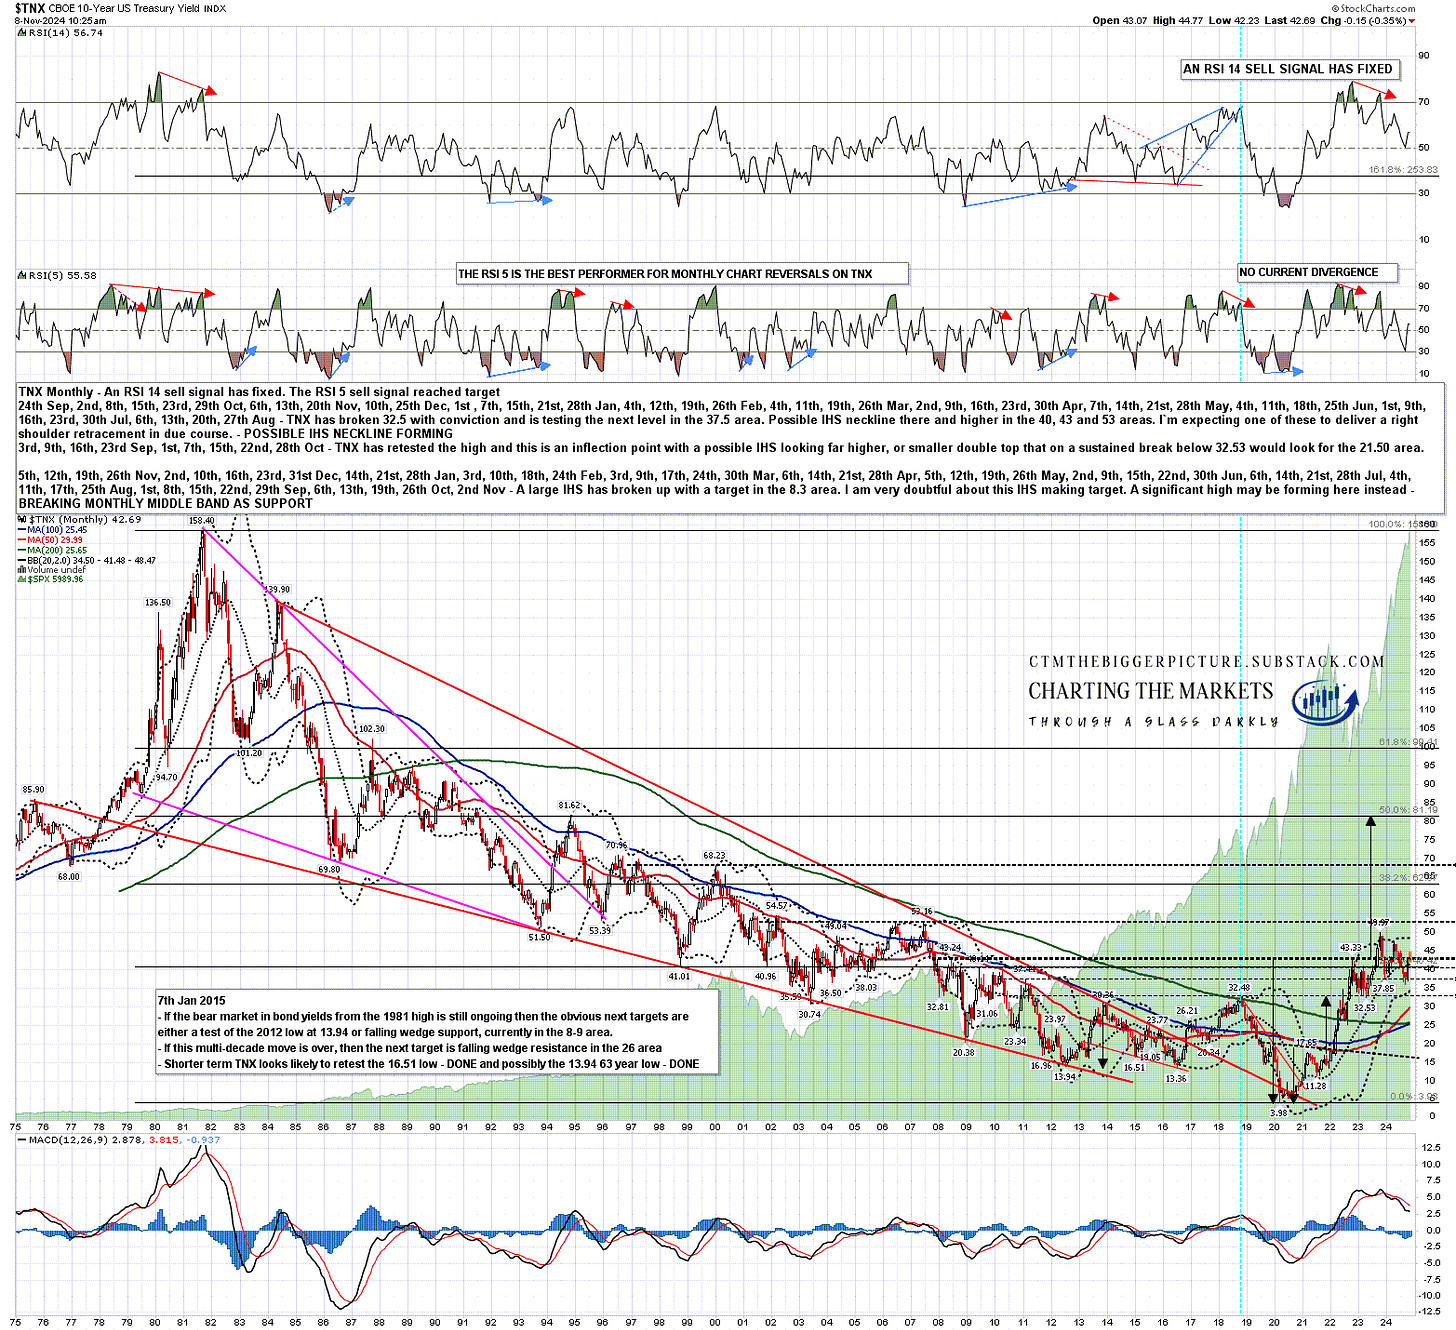
If that bull flag target on TNX is reached, there would then be a possible double top setup on TNX that on a subsequent break down from 32.53 would be looking for a target in the 15 area. If seen that would be a return to the very low interest rates that marked the lows on TNX in the 2011-6 period. That isn’t the only scenario however.

At that high retest we would have an inflection point where TNX could also break up. Equally, if that double top broke down instead there would be another inflection point, where TNX could continue down to that target in the 15 area, or reject back up to the decade highs.

TNX monthly chart:

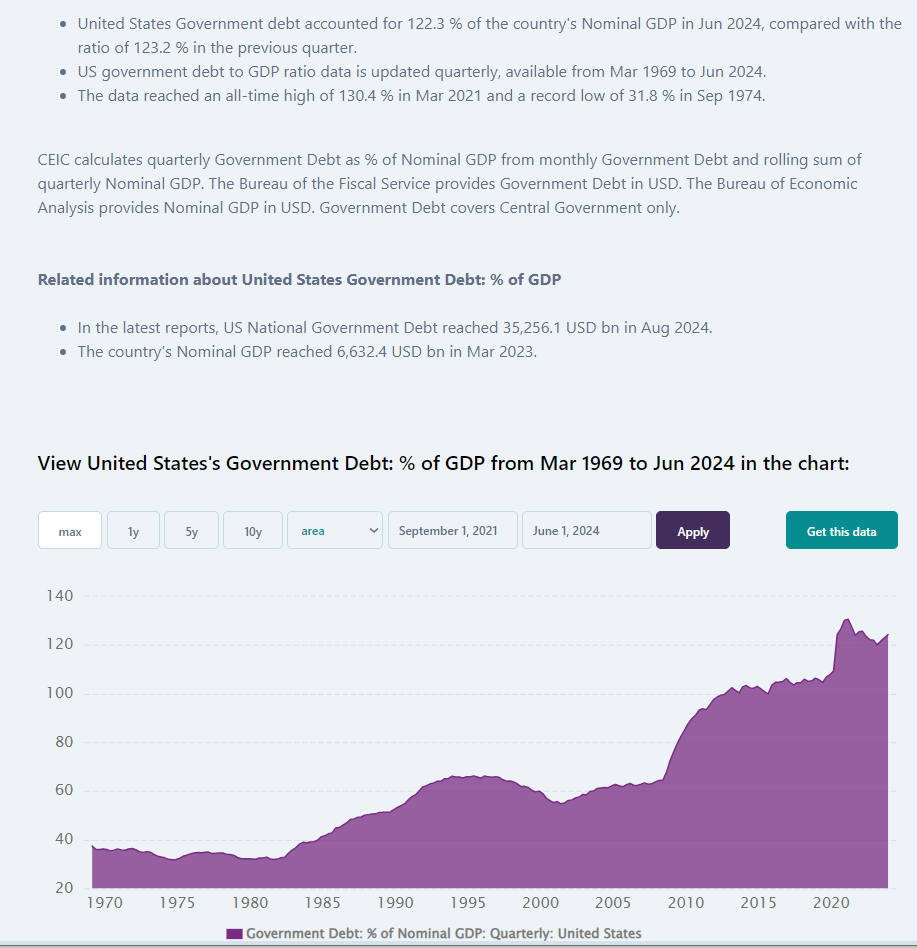
Under what circumstance might we see longer term interest rates hit 5% or higher for an extended period in the next few years? Well the US is at a delicate point in terms of government debt, with government debt in nominal GDP terms doubling to 130% between 2009 and the COVID debt high in 2021. For reference, the peak on US government debt to GDP in the last century was at 106% in 1946 after WW2, and that then fell to just 23% in 1974, as the last serious inflation and interest rate shock was getting going.

US government debt at this level constrains the options of this incoming administration in a way that it did not in the 1970s. Why is that? It’s because while TNX rose from a low at 53.8 in 1971 to 158.40 in 1981, effectively a rise in interest rates of 5.38% to 15.84%, debt was low, so while the interest rate shock was very serious, it was still manageable. That’s not the case now, and if the US government fails to keep bond markets happy with the direction of policy and the effect of that policy on debt, the results won’t be pretty.

As an aside one thing worth noting on the chart below is the drop in debt vs GDP just after the 2021 high from 130% to 120% two years later. Was this because of the administration’s fiscally conservative policies? No, it was because of the inflation that was triggered by all that COVID over-stimulus. Cumulative inflation since 2021 has been 16.4%, and that increase is in the nominal GDP figures as well as growth over the period. That increase in nominal GDP was therefore just a lot more than the increase in government debt over that period. That is the key reason that government debt remained low and on a downward trend 1971-1981.

CEIC 1969-Date US Gvt Debt to GDP chart:

So why is the level of debt now such a constraint? Well two parts of one reason, and the first part is that the general rule of thumb on government debt in terms of GDP is that a level over 135% of GDP is historically the level at which bondholders need to start being seriously concerned that the government they are lending money to may default rather than repaying their money at the expiry of that government bond. A move over that level, or a policy direction that risks moving debt over that level brings us to the second part which that a loss of confidence by the bond market in a governments ability to repay their debt is shown in much higher interest rates, and when debt is that high already, that risks making the situation much worse.

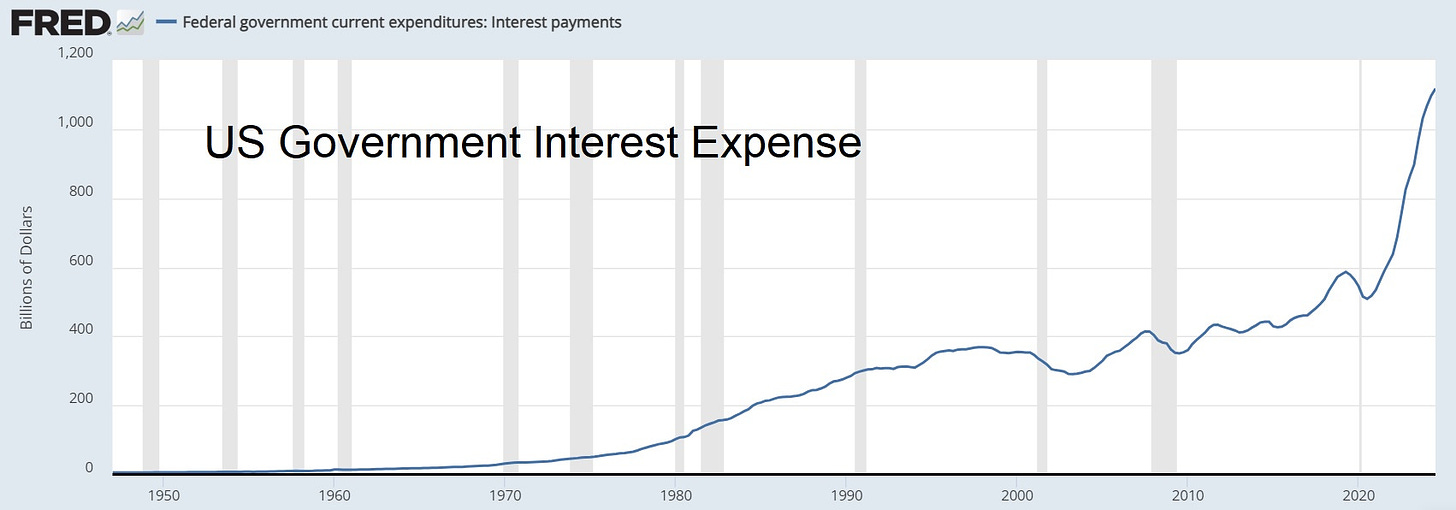
To illustrate that, let us consider the chart below, where you can see that the cost of servicing US government debt has increased from a low in 2020 at an annualised $500bn to more than double that in 2024, an annualised increase of $600bn per year due in small part to an increase in the level of debt, but mainly to rising interest rates over the period.

US government debt is currently slightly under $36 trillion dollars. At an average interest rate paid at 2% the annual interest cost would be $720 billion dollars per year. In 2024 you can see that the average interest rate paid is about 3%, so the annual interest cost is at about 1.08 trillion dollars per year, and for every 1% rise in that interest cost that cost will increase by $360 billion dollars per annum.

For reference, US military spending in 2024 is at about $850 billion, and that is at about half of all discretionary (non-mandated) spending by the federal government in 2024. An increase of 5% in the average interest rate paid on US government debt would therefore be an increase of more than the whole of current federal government discretionary spending. At the current level of indebtedness, it is very important not to upset the bond markets.

FRED 1948-Date US Gvt Interest Expense:

This is liable to cast a long shadow over some of the possible policy changes that Trump was talking about on the campaign trail, notably:

  1. Taxing & spending: Any increase in deficit spending that significantly increases the level of debt to GDP will likely result in higher interest rates.

  2. High trade tariffs: Inflationary and would likely result in higher interest rates.

  3. Substantially reducing the value of the US dollar against other currencies to increase exports: inflationary and would likely result in higher interest rates.

That doesn’t mean these can’t be done, but that they would need to be done carefully, and might need to be reversed quickly if the bond market reaction was sharply negative. The net result of this pressure may well mean that Trump becomes the first President since Clinton, and the first Republican President since Nixon, to oversee an overall reduction in government debt to GDP during his next term in office, and that would likely also have been the case for Kamala Harris if she had won instead. The incoming US President is standing on a mountain of debt close to a cliff edge, and the fast way to the bottom is not one anyone would willingly choose. The slow way down from the mountain will take a long time and require some hard choices.

Could the Fed solve this problem by keeping interest rates low? No, real long term interest rates are set by the government bond markets, and those long term treasury yields, ten year yields on TNX and thirty year yields on TYX, are determined by supply and demand on those bond markets. That’s the reason that while the Fed has reduced their benchmark rate by 0.75% over the last two months, government bond markets raised the yield on US 10 year treasuries by 0.88% over the same period. The Fed doesn’t control bond markets, any more than sailors control the sea.

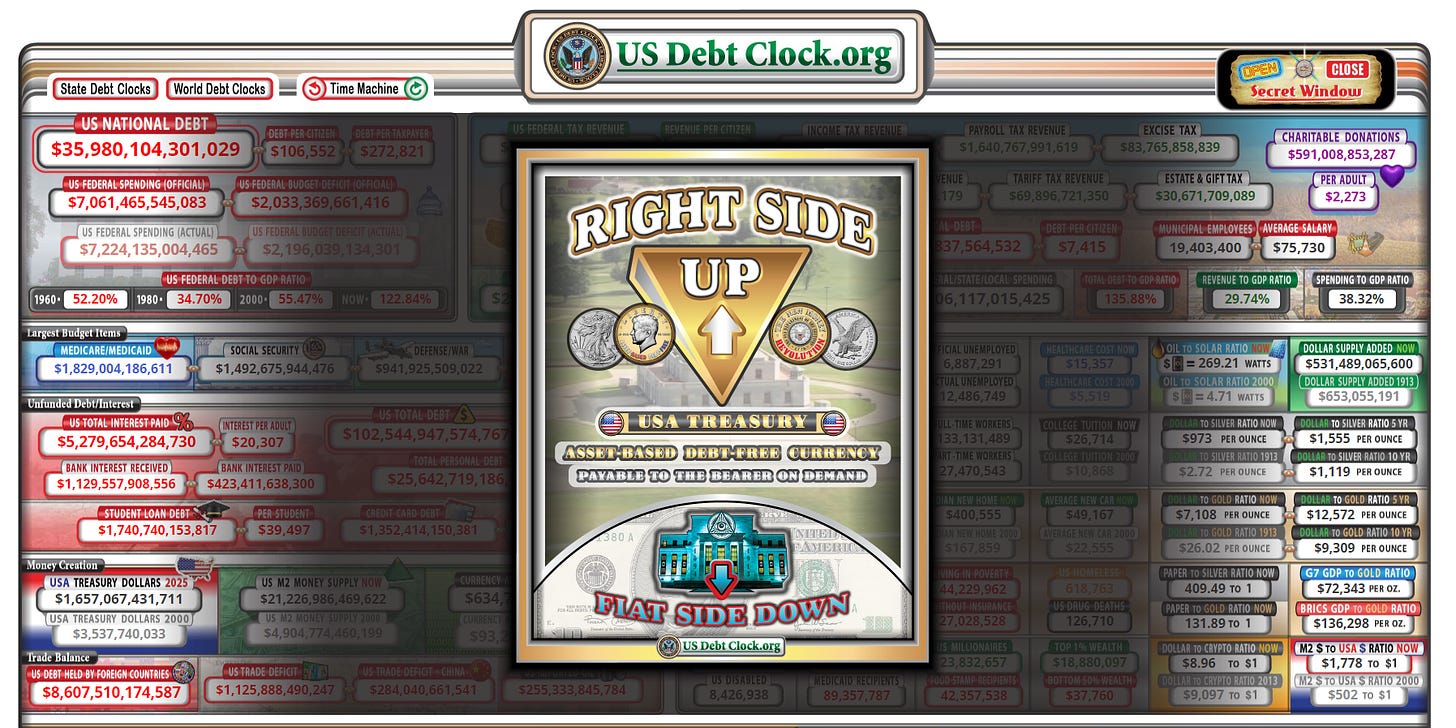
US Debt Clock:

I think that at least two big western governments are at serious risk of defaulting on their debt in the next decade. The first is Japan, with government debt to GDP at an amazing 255%. Japan was described by John Mauldin as a (fiscal) bug looking for a windshield in 2011 and remarkably is still looking for that windshield, mainly as most of that debt is owed to Japanese citizens at ultra-low interest rates outside bond markets. Singapore has a high looking government debt to GDP at 167%, but net government debt is actually zero and their debt is AAA. Greece (not big but western) and Italy are next at 172% and 144% of GDP respectively and but are protected by low interest rates in the Euro area, so far at least. All the others above the USA on the top 20 countries with the biggest national debts have interest rates above six percent with outliers like Sudan and Venezuela with interest rates at over 40% and 60% respectively.

The way this world government debt bubble plays out will be one of the most interesting economic stories of the next two decades. Take a free subscription to my substacks and watch it with me as it plays out. :-)

If you like my analysis and would like to see more, please take a free subscription at my ctmthebiggerpicture substack, where I will be publishing my posts covering other than equities or crypto, and where I do my The Bigger Picture webinars on Sunday and Wednesday nights.

If you like my analysis and would like to see more of my work on equity indices, please take a free subscription at my chartingthemarkets substack, where I publish my equity index posts, and do a short general premarket review every morning.

If you like my analysis and would like to see more of my work on crypto, please take a free subscription at my ctmcrypto substack, where I publish my crypto posts, and do a short crypto premarket review every morning.

Thursday, 7 November 2024

Huge News Week Part Two

On election day I was writing that the huge news this week would likely dominate the markets, and the first and larger part of the news is in, with Trump elected President again, and markets breaking higher in response.

I was also writing a few days ago about two unfinished business targets above that I was expecting to see hit within weeks and they were a new all time high on QQQ (done), a retest of the 2024 high on IWM (done) and possibly a retest of the 2021 all time high on IWM (also done). That has cleared out the unfinished business targets above so today I’m going to be looking at possible targets higher on the US indices.

I would also note that the second big ticket item on this huge news week is at 2pm EST today and that is of course the Fed decision on interest rates. The market consensus seems to be for a cut of 0.25% which I’m leaning towards too and, unless that is much different, I’m expecting that the market reaction to the news will be considerably more muted than the reaction to the election news.

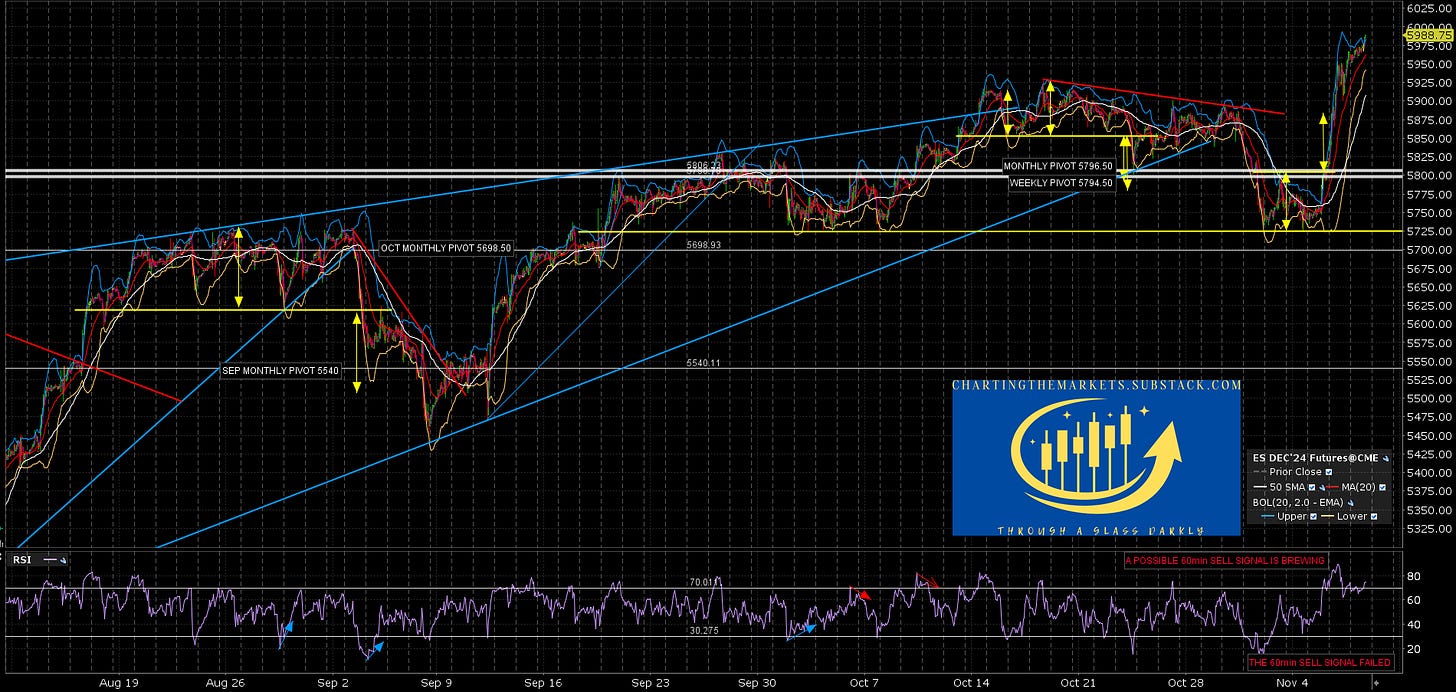
In the short term there is quite a bit of short term negative divergence on hourly futures and RTH 15min charts on the US indices and I was saying in my premarket video this morning that we might well see some retracement of the big up moves in the last couple of days this morning. So far there has been no sign of that happening but we might still see some of that before the Fed announcement, or in reaction to it.

ES Dec 60min chart:

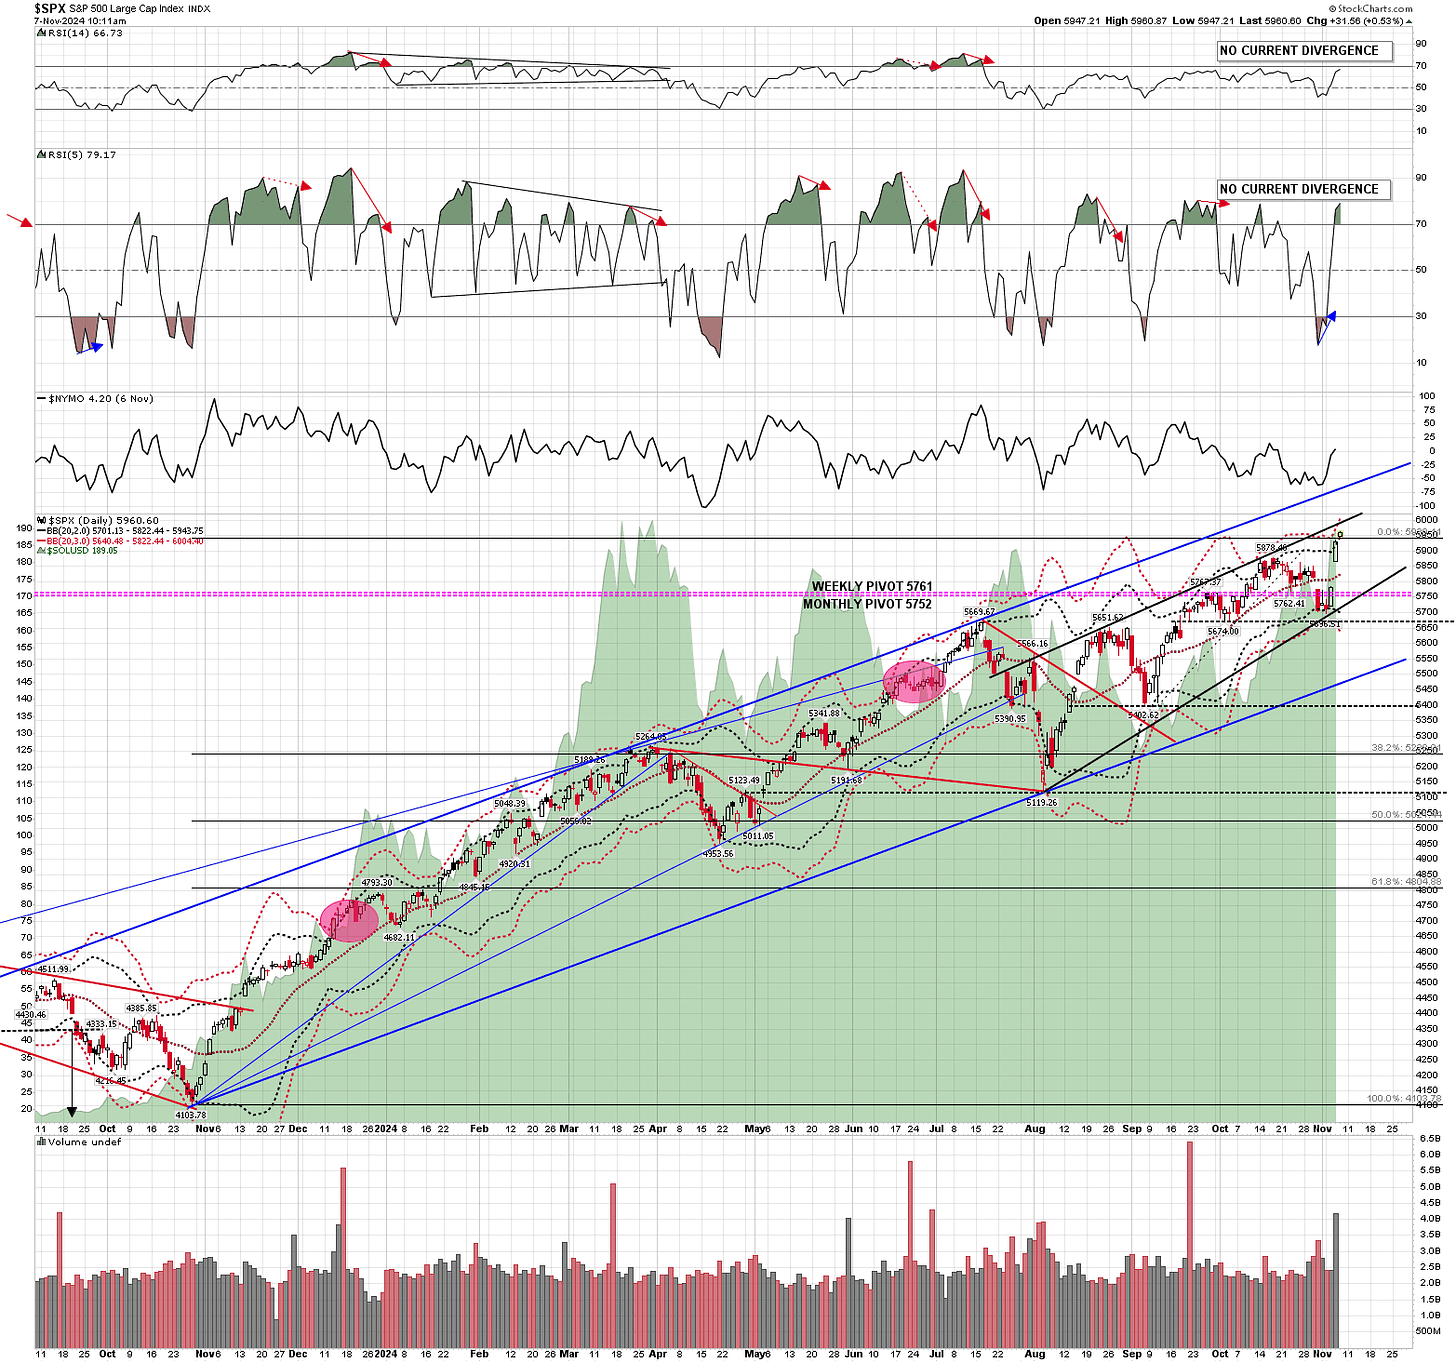
On the SPX chart I first mentioned in August that there was a large channel on SPX and that the channel resistance was the obvious next target on a strong move higher. I now have that in about the 6120 area and I have pencilled in as a target to be hit by the end of the year.

There is a shorter term rising wedge from the early August low though, with resistance currently in the 5990-5 area, and if that is hit in coming days I’ll be watching that area for resistance, particularly as it is currently a match with the 3sd upper band.

SPX daily chart:

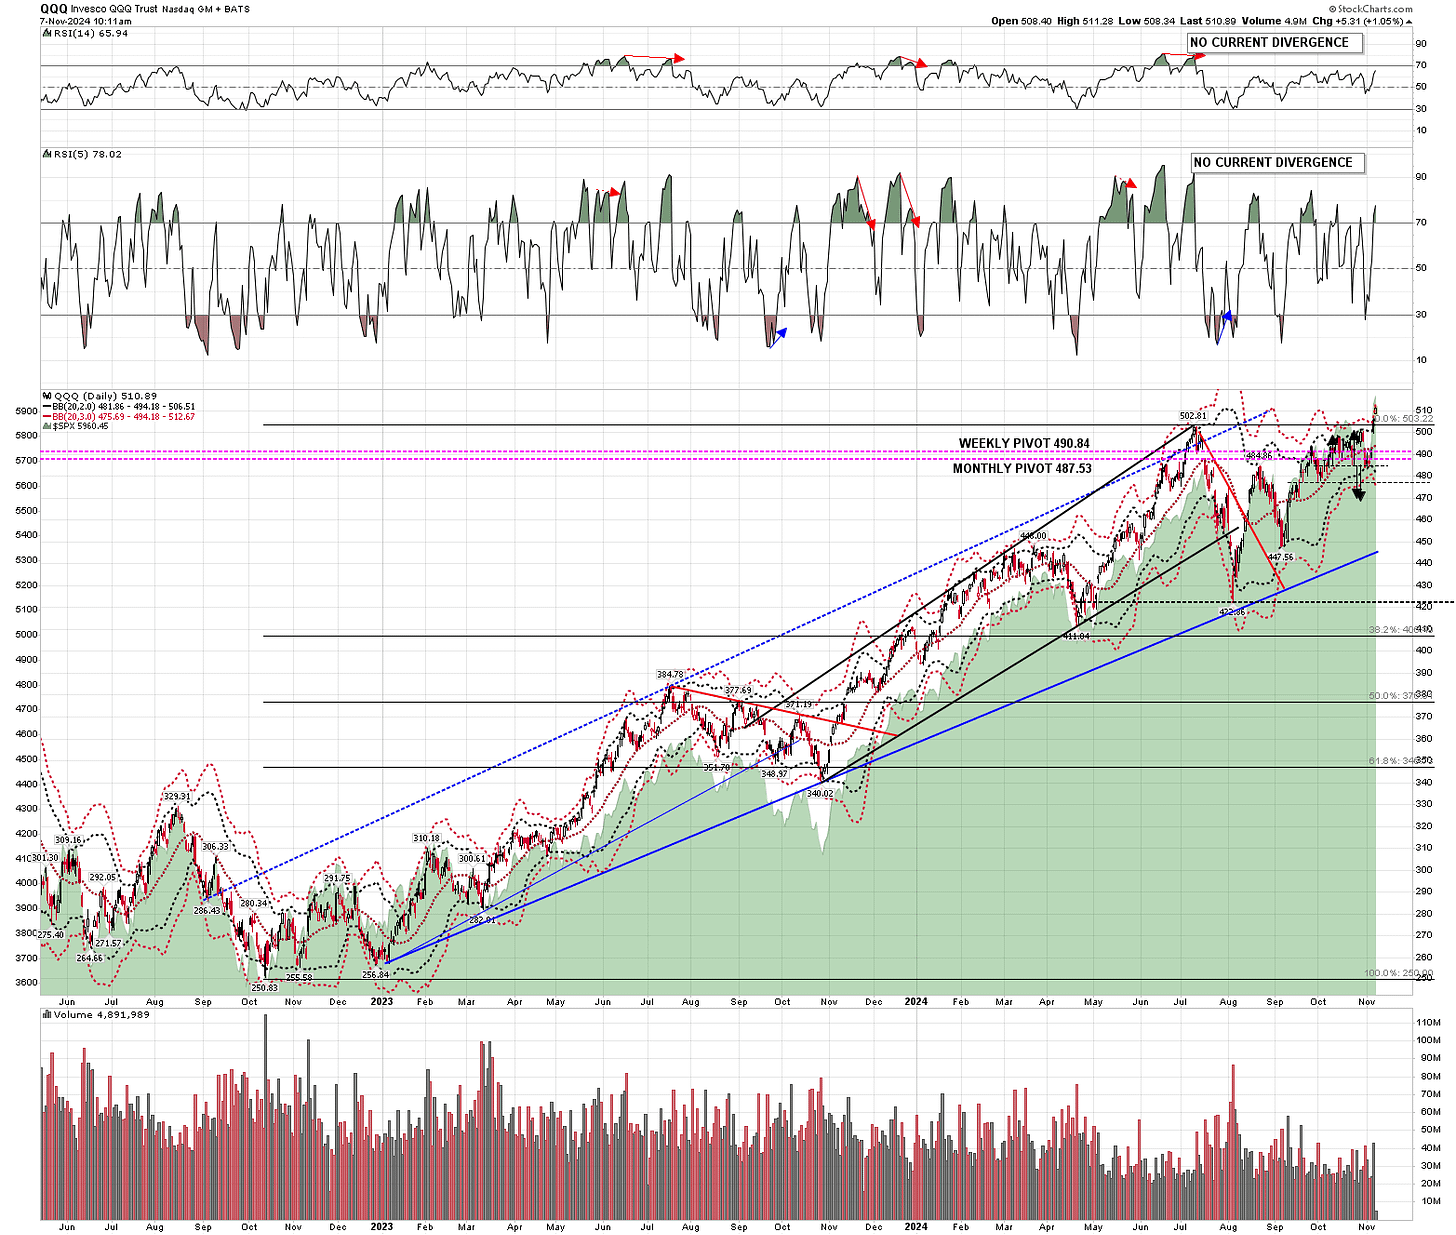
On the Qs I don’t have any obvious resistance trendline targets above, but I would note that the 3sd upper band has been hit both yesterday and today. That is usually a sign that some short term consolidation lasting at least three or four days is close and means that Tech stocks are stretched here.

QQQ daily chart:

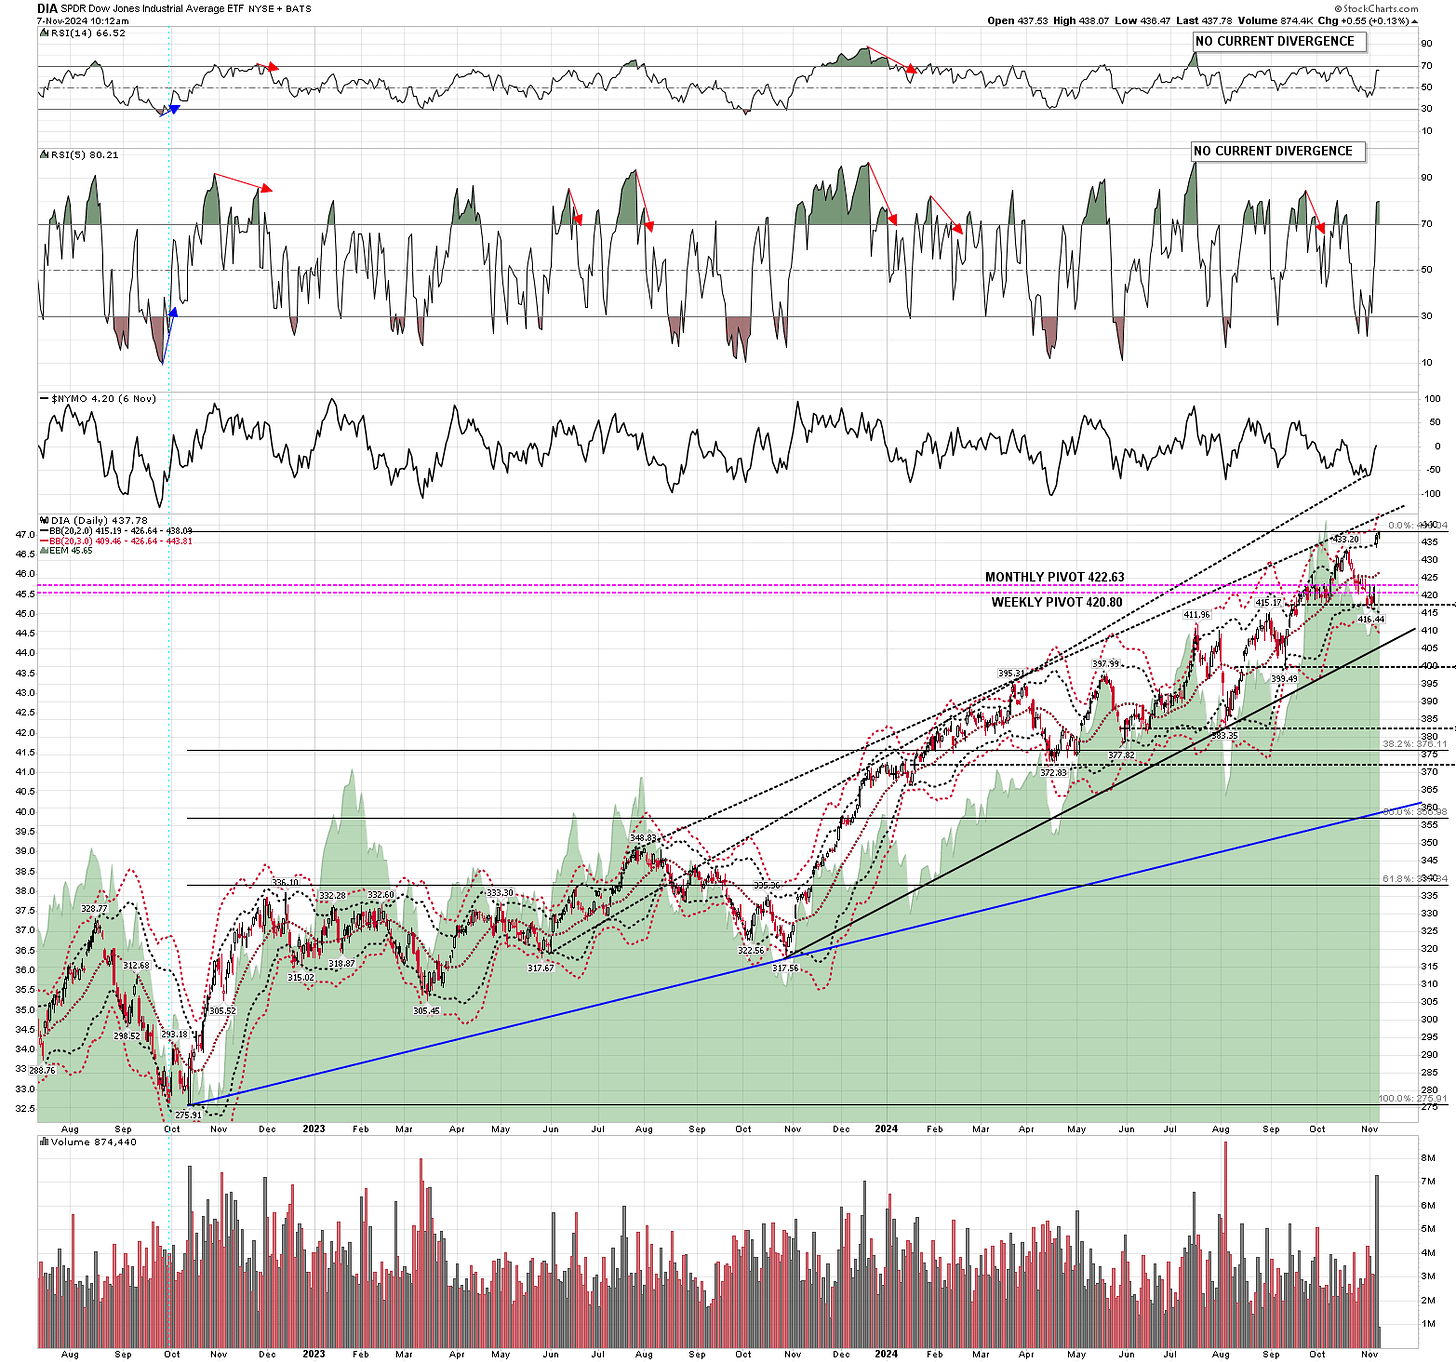
On DIA I have two decent looking resistance trendline options above. The closer is in the 442/3 area but the higher option is the better trendline, currently in the 455 area.

DIA daily chart:

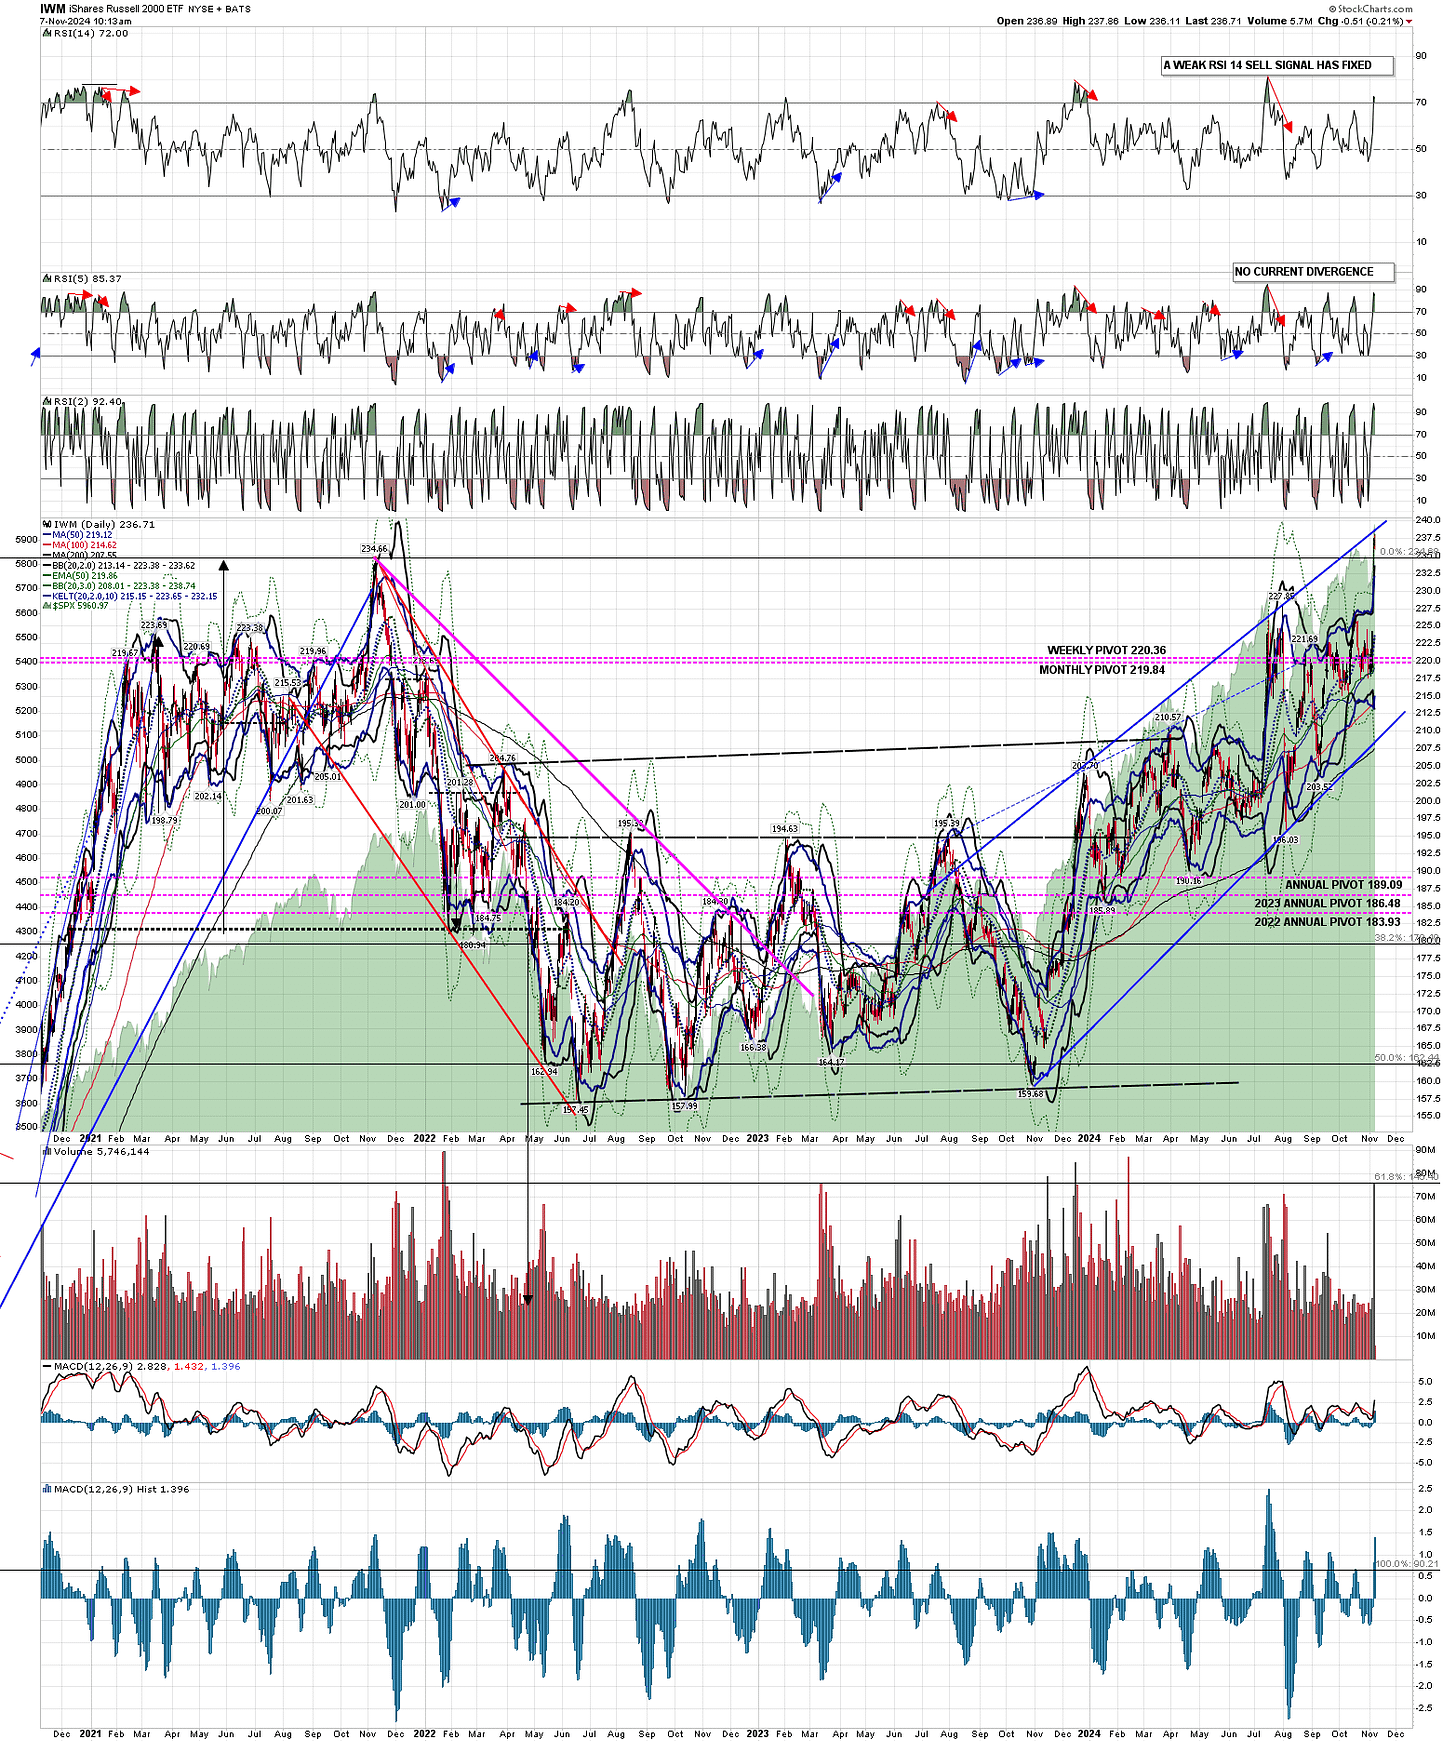
On IWM I’ve had a decent resistance trendline pencilled in for weeks now and that is being tested right now. I’m a bit doubtful about that holding long but IWM does tend to plough a lone furrow among the US markets so maybe.

IWM daily chart:

I was saying on Tuesday that if the news this week didn’t tank the equity markets then the seasonally obvious direction is still up. The markets haven’t tanked this week so far and that remains the case. The obvious direction is up into December, so we’ll see how that goes.

If you like my analysis and would like to see more, please take a free subscription at my chartingthemarkets substack, where I publish these posts first and do a short premarket review every morning.

Wednesday, 6 November 2024

Three Crypto Bulls

In the conclusion to my post yesterday I said:

‘So what’s the takeaway here? Well before the open this morning I was talking about the decent looking possible double bottoms on Bitcoin, Solana, SPX and DIA. Those have broken up on Bitcoin and Solana, and the ones on SPX and DIA are heading that way at speed at the moment. We could see a strong rally across the board today and, subject to the huge news week this week, that could take all of these back to last week’s highs. ‘

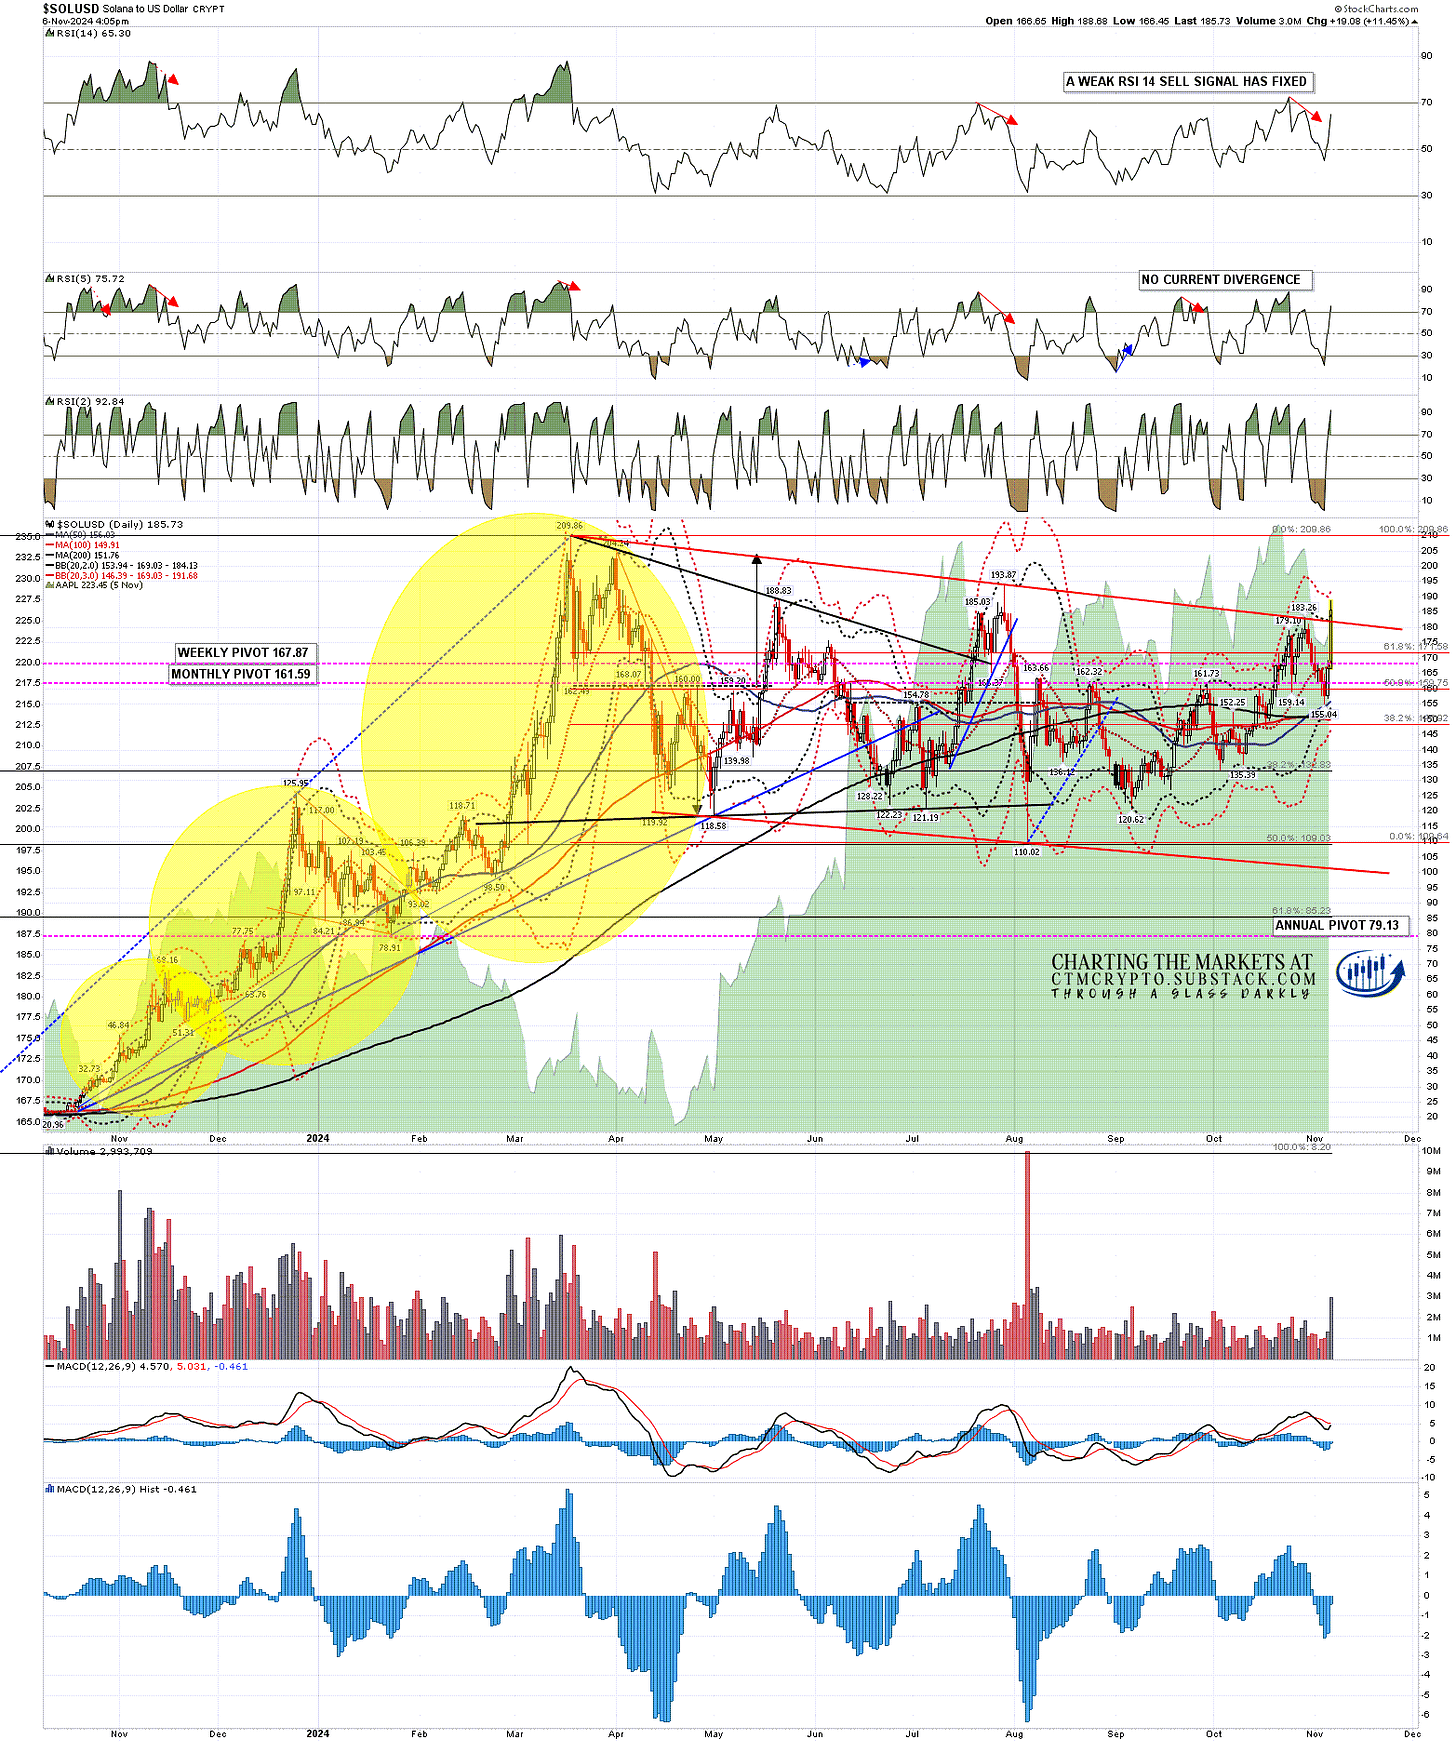
So here we are, they all broke up and made target, Bitcoin (BTCUSD) has made a new all time high, Solana (SOLUSD) has broken over bull flag resistance with a target at the retest of the 2024 high at 209.86, and even Ethereum (ETHUSD) had a decent day and broke back over the daily middle band with confidence.

There are likely three bull markets going on here and they are all at different stages, so I’m going to review those quickly.

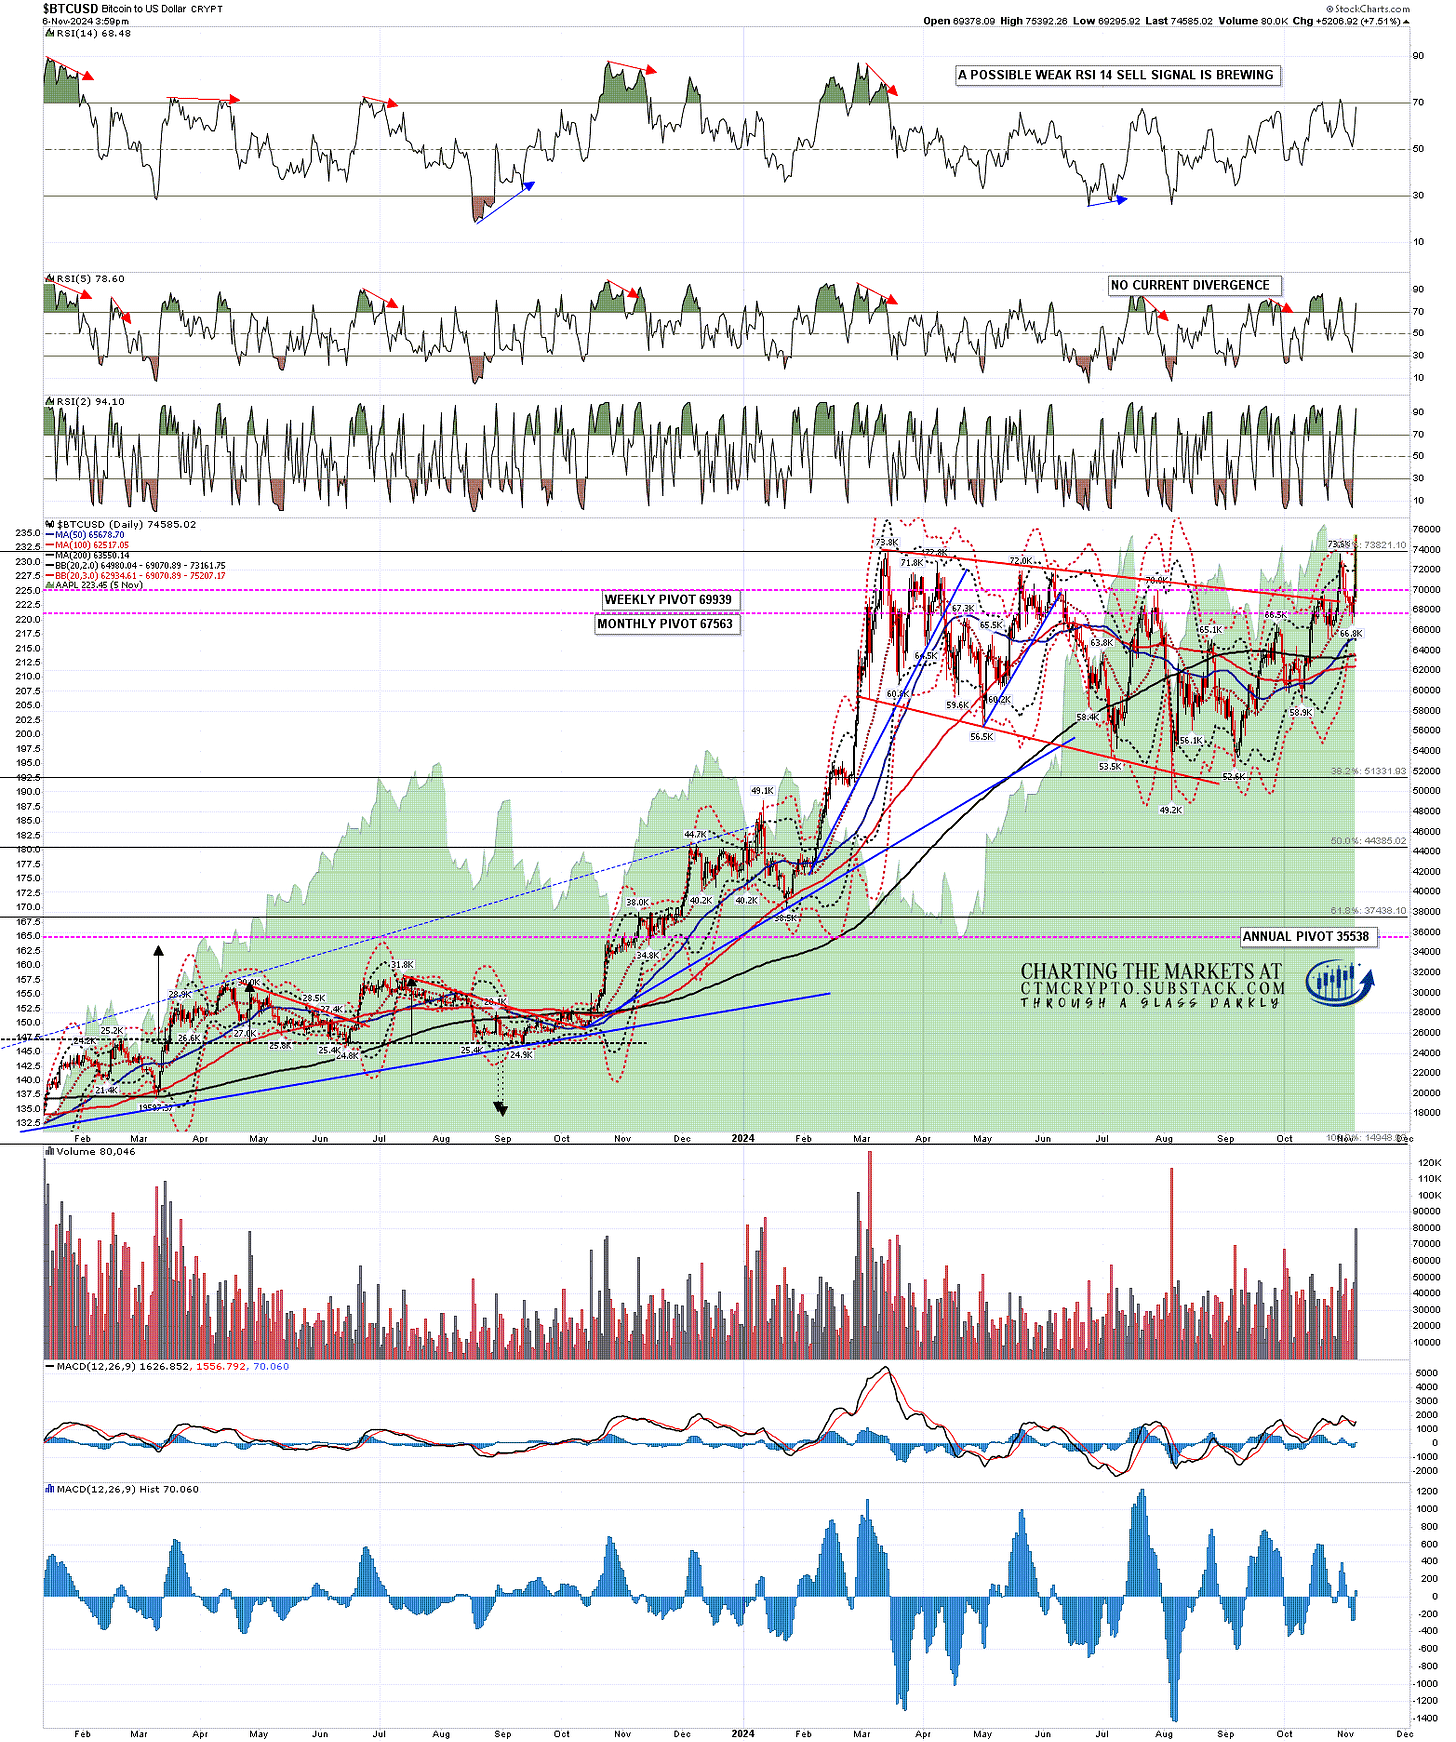
Bitcoin is clearly Daddy Bull here, with a new all time high made earlier this year and again last night as the news filtered through that Trump was the likely election winner. How good will Trump be for Crypto? Well likely positive but I’m not sure it was really going to make much difference to Crypto whoever won the election on the bigger picture. On the smaller picture it has delivered a solid looking new break higher.

Whenever a high is retested a possible double top of whatever size is formed. The one formed here is large but I won’t be paying any real attention to it unless we see a hard reversal here which, unlike the very nice reversal setup I called last week, doesn’t seem that likely.

BTCUSD daily chart:

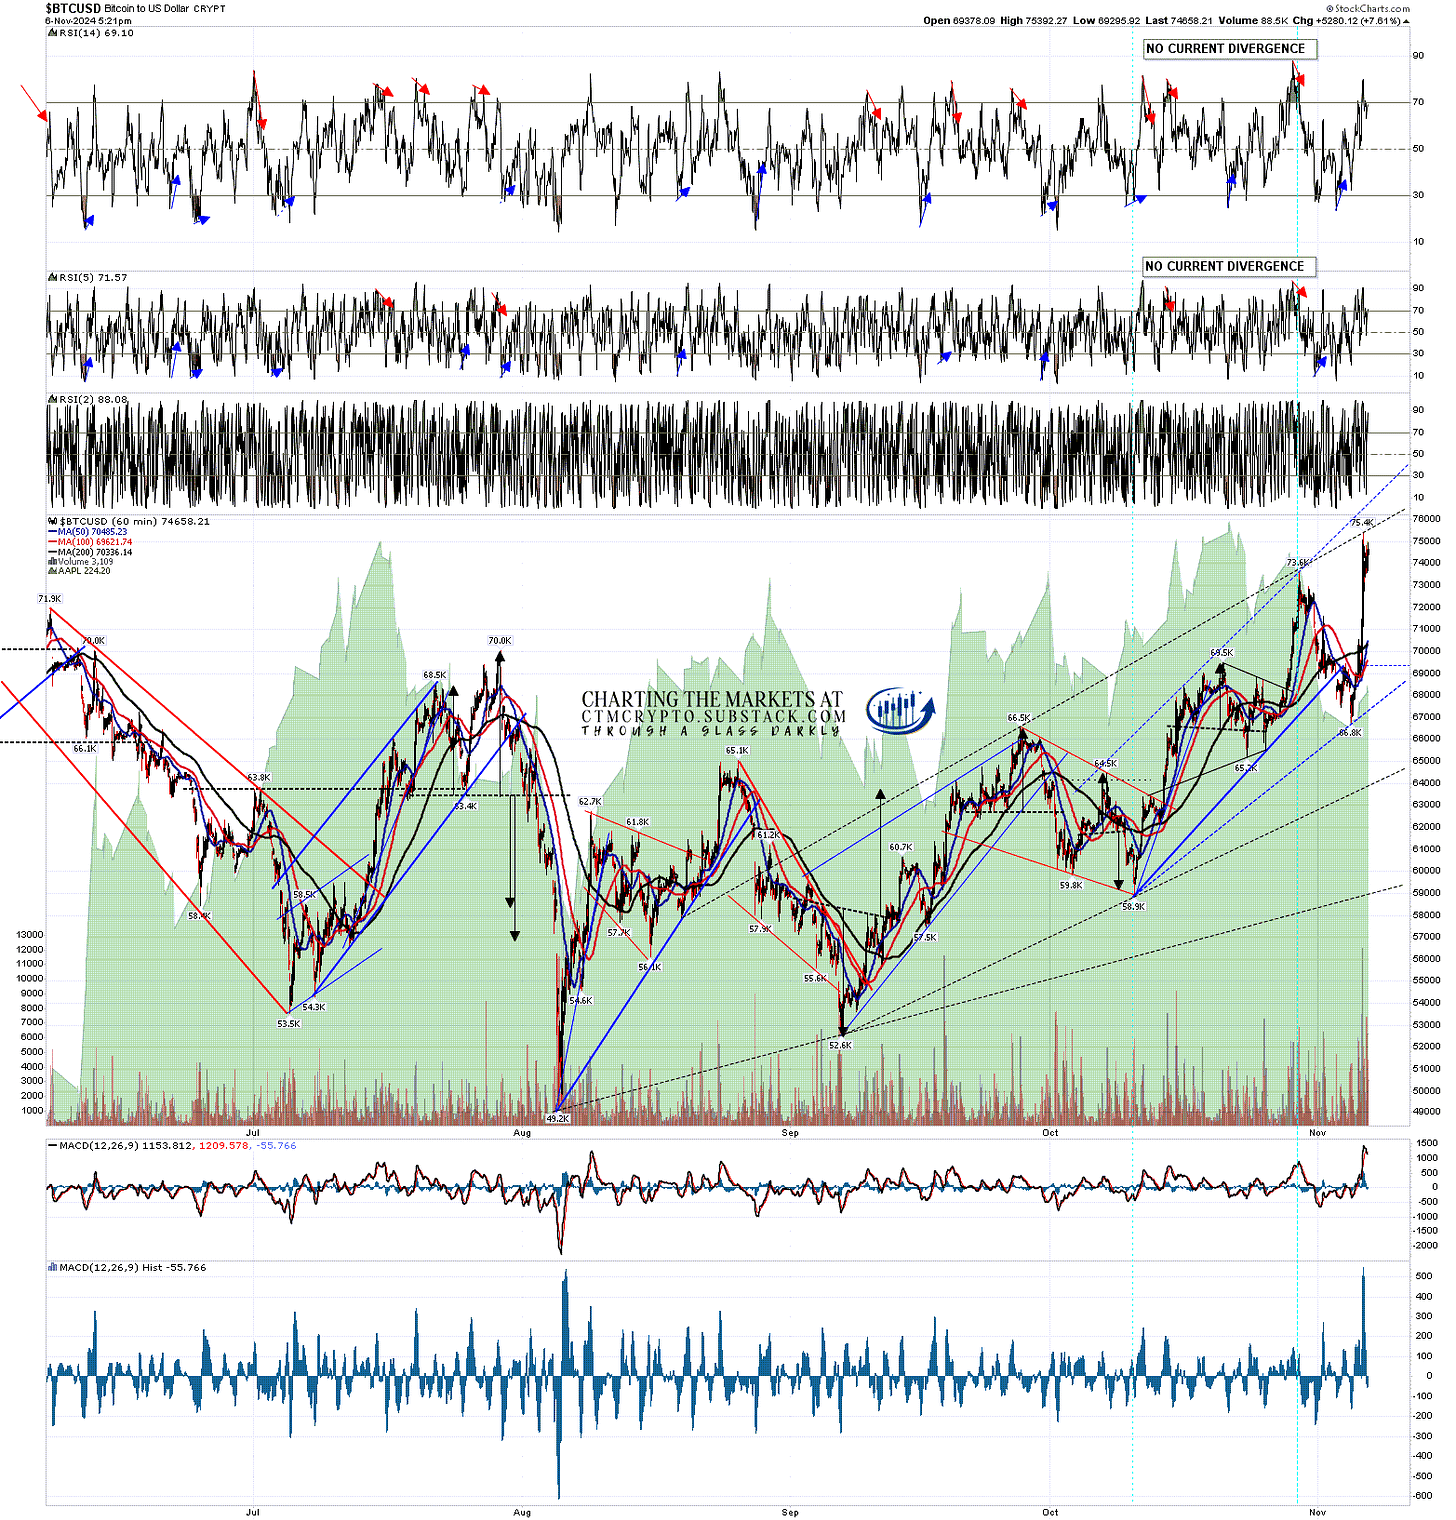
On the hourly chart I’ve been looking at the resistance trendline options and I have a couple of short term ones, one of which was hit overnight, but nothing serious to suggest that Bitcoin won’t be going higher soon.

BTCUSD 60min chart:

Solana is Mommy Bull here, with a reversal at main bull flag last week and then a clear break up through flag resistance last night. The bull flag target is at a retest of the 2024 high at 209.86, and after that I’m leaning strongly towards a run at the retest of the all time high at 259.95.

Bitcoin bottomed at 15480.69 in late 2022, and at the new all time high last night at 66793.64 it was up an impressive 331% from that low.

The late 2022 low on Solana was at 8.03, and at the high last night at 188.68 it was up 2250% from there. At the 2024 high at 209.66 it was up 2510%. To retest the all time high from last night’s high it just needs to go up another 37.78%. That doesn’t seem a stretch and I’m expecting to see that in the next few months.

SOLUSD daily chart:

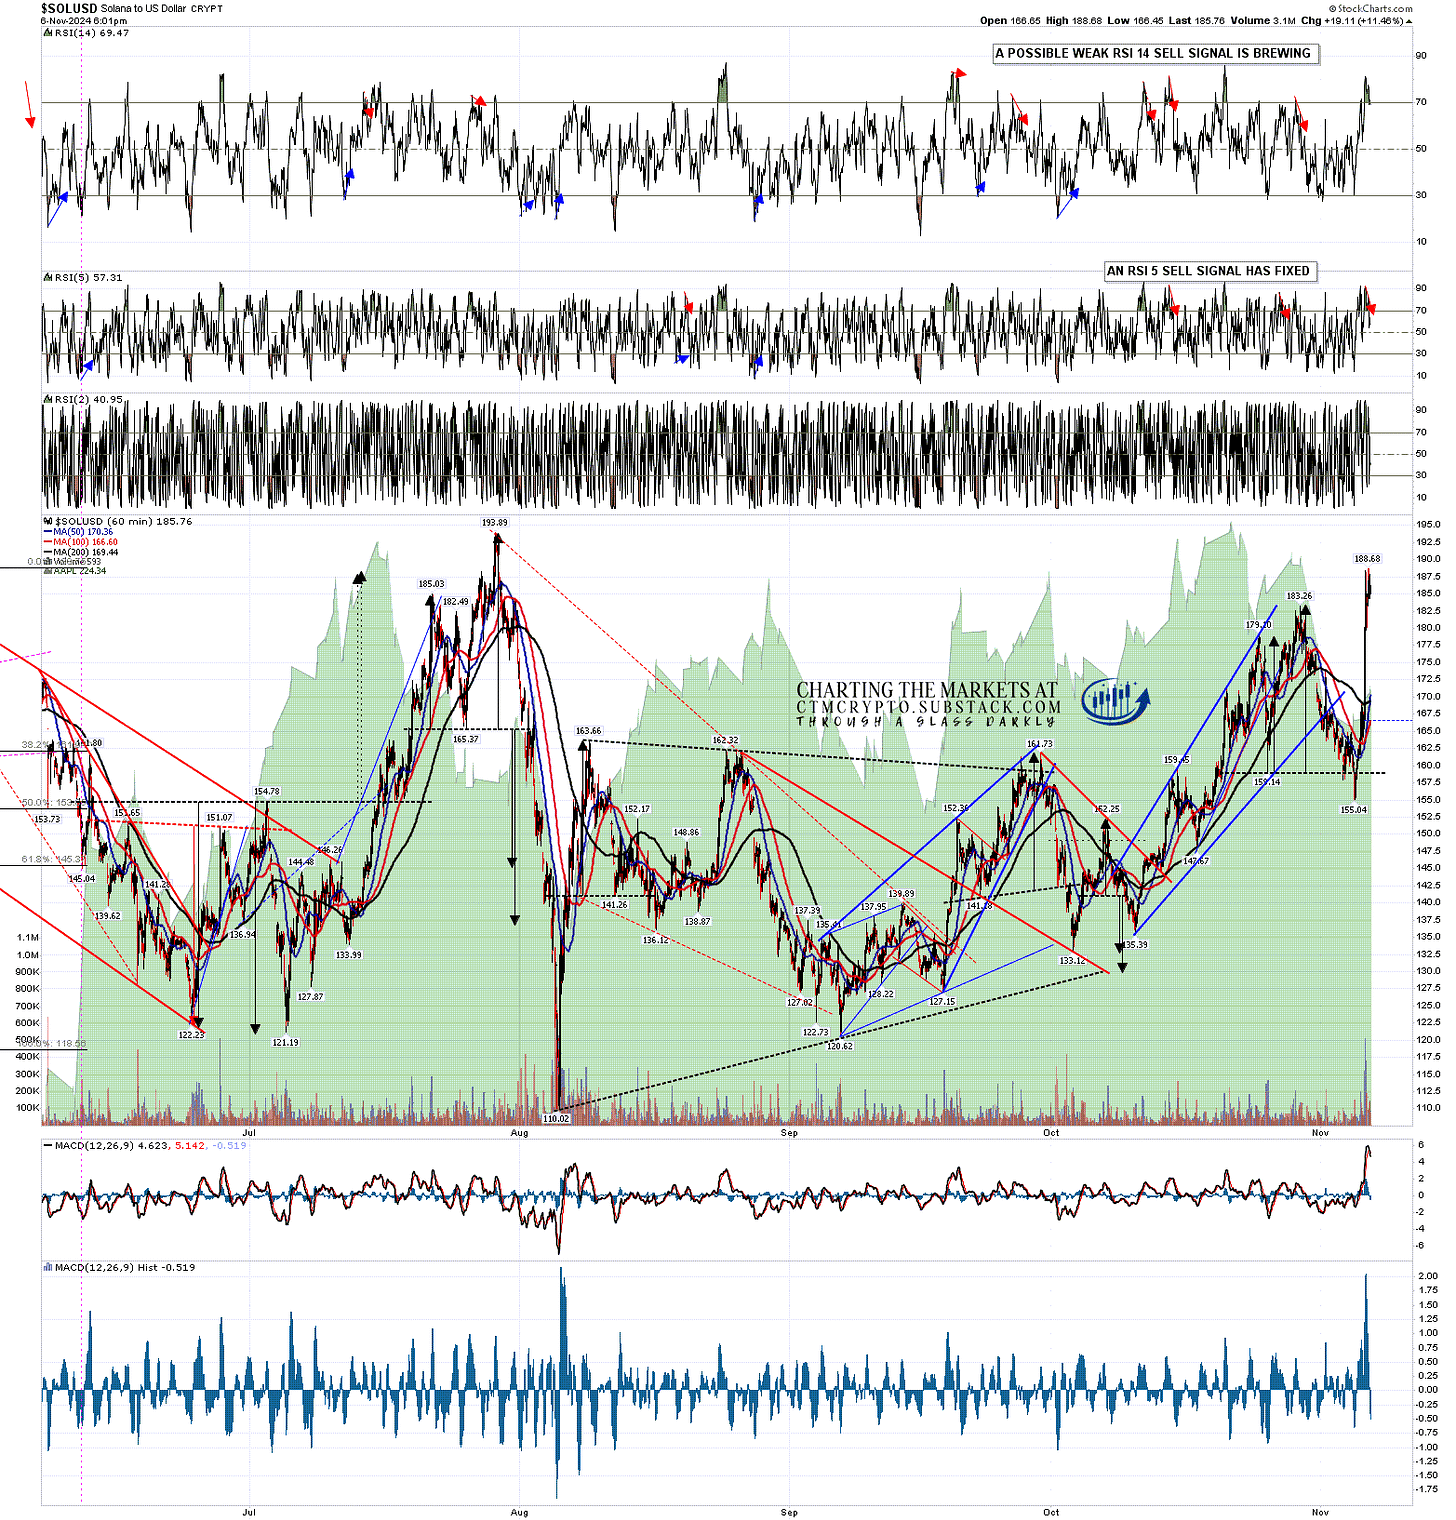
The setup from the high last week on Solana was a clear double top which formed, broke down, and then failed into a retest of the prior high. A classic sequence. No obvious resistance trendline above but there is some short term negative divergence and a small double top that on a sustained back below 183 would look for the 177/8 area.

After that the bull flag target is at 209.86.

SOLUSD 60min chart

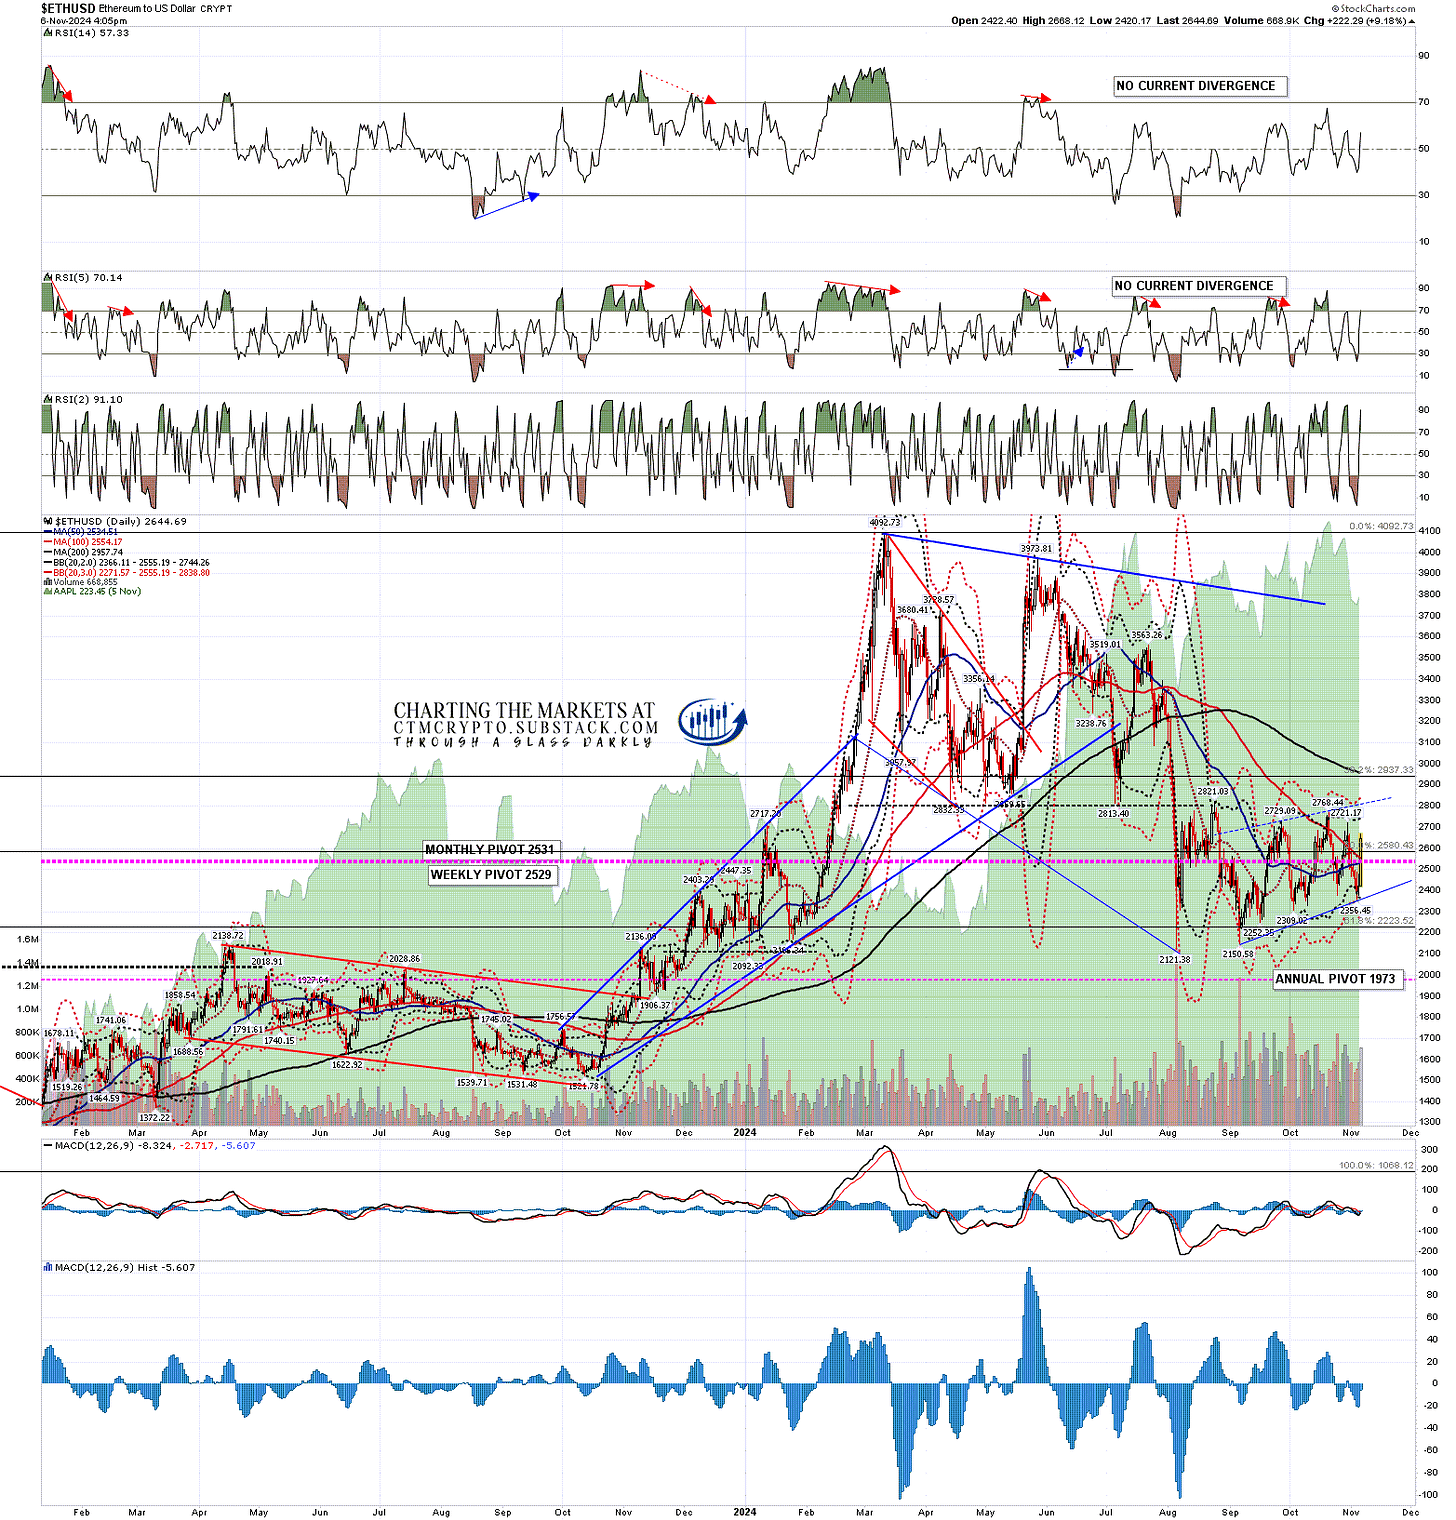
Baby Bull here is Ethereum, though that has been so hesitant over the last three months that I’m wondering whether it is still in a bull market at all.

Ethereum has larger issues, in that while it was touted as a big up and comer in past years, it is now struggling to seem relevant in a situation where Solana is much cheaper, faster and easier to make transactions.

The weekly middle band, currently at 2726, has been strong resistance since June. If Ethereum can break back over that and convert it to support then it may have a shot at a retest of the 2024 high at 4092.73.

Until then the move up from the August low is looking uncomfortably like a bear flag or triangle forming, and I’d be wary on the long side.

ETHUSD daily chart:

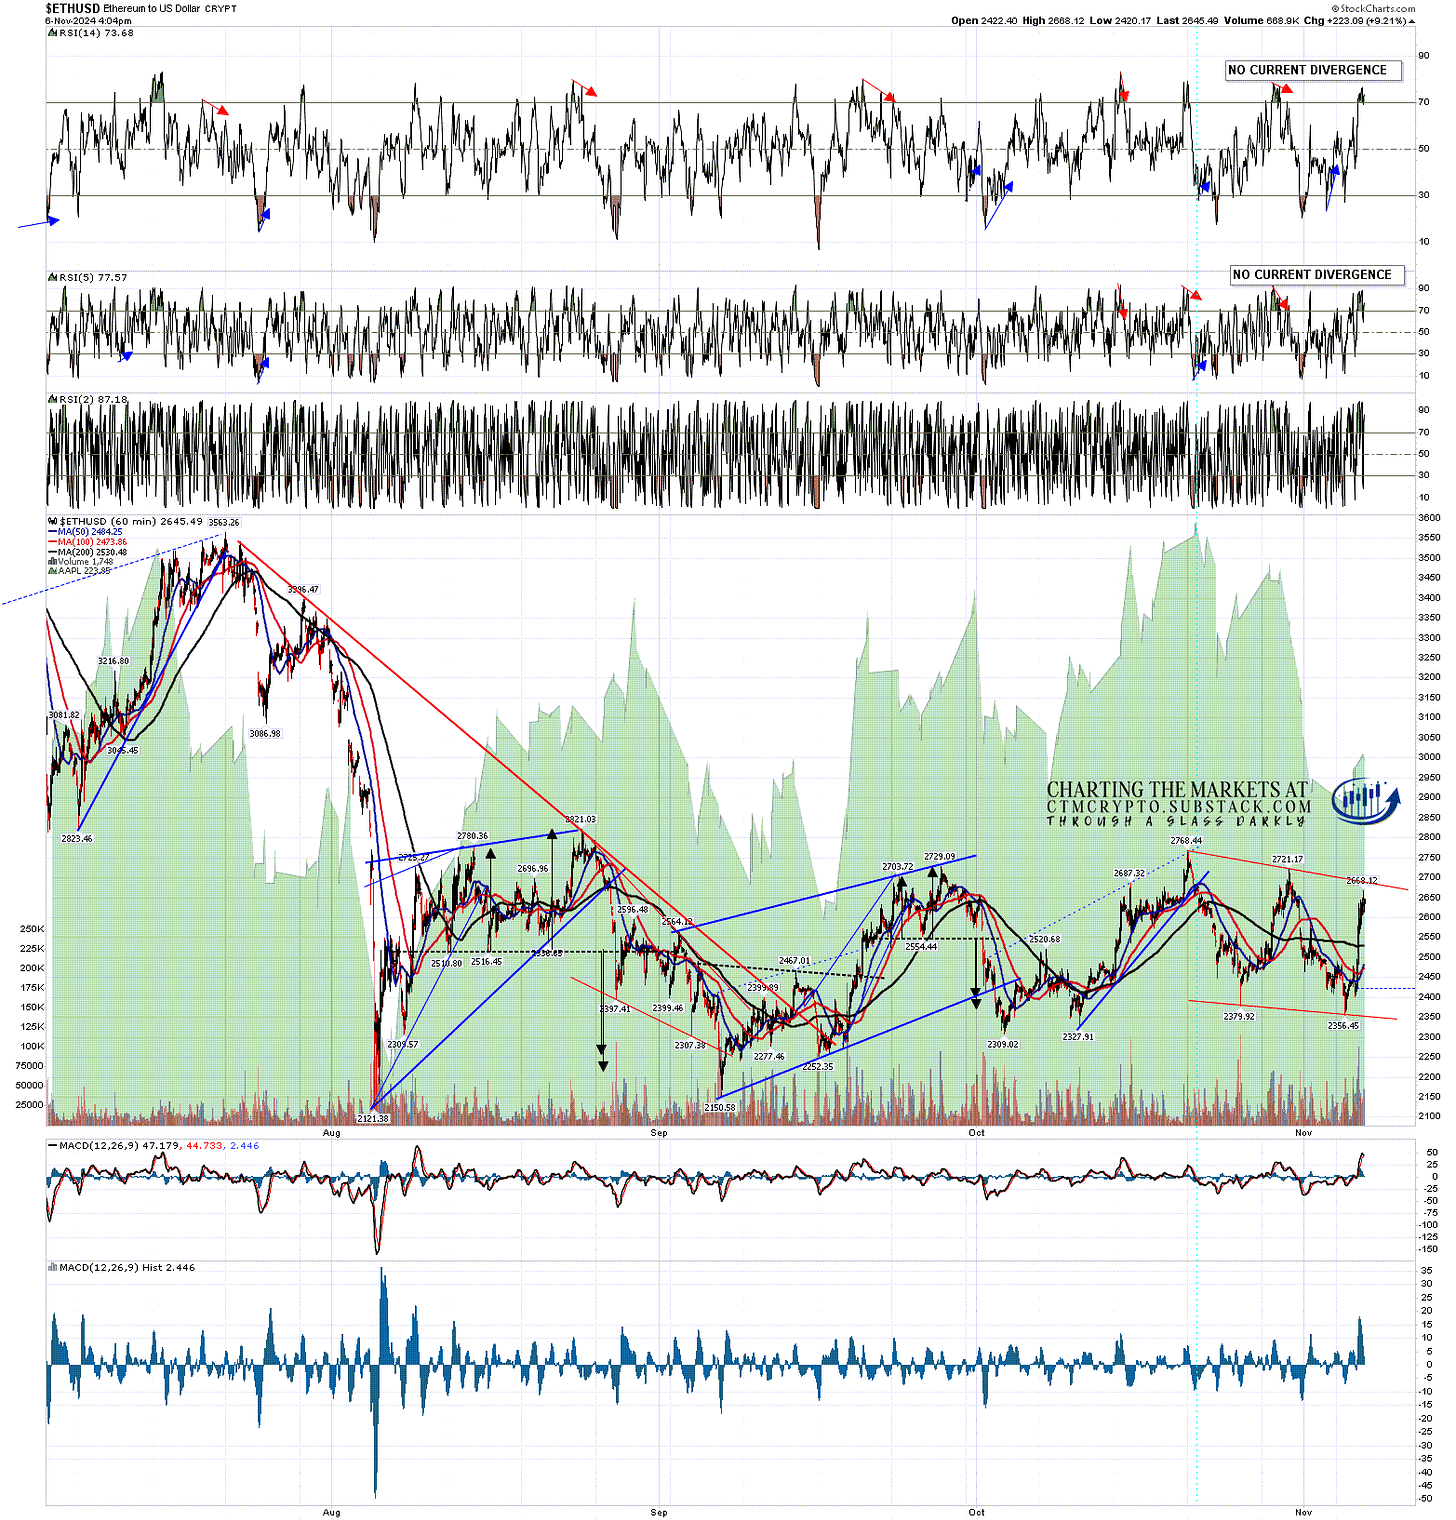
I have a short term resistance trendline on Ethereum that is currently in the 2690 area, and I’ll be watching that for resistance when it is reached.

ETHUSD 60min chart:

The break up last night was impressive and while we may well see some retracement here, I’m not expecting that move to be fully retraced and I’m expecting follow through to the upside soon.

I have a question for my readers today.

I’ve been charting Crypto for a few years now, and started doing morning webinars on it every day in about April this year. When I set up my Crypto substack in early August I continued them there and, as my brand of charting works really well on Crypto, I’m not aware of any other Crypto analyst that has called the moves and reversal on Crypto since April as well as I have.

My readership is still small though and word of mouth has not been working so far. I clearly need to do more to promote my work.

I’m considering taking a writing gig at a Crypto exchange or site to get access to a wider audience & I’d welcome suggestions for that. Equally there may be places that I should frequent and drop links daily to promote my work. All suggestions very welcome.

If you’d like to see more of these posts and the other Crypto videos and information I post, please subscribe for free to my Crypto substack.

I'm also to be found at Arion Partners, though as a student rather than as a teacher. I've been charting Crypto for some years now, but am learning to trade and invest in them directly, and Arion Partners are my guide around a space that might reasonably be compared to the Wild West in one of their rougher years. 


Tuesday, 5 November 2024

Binary Setup Here On Crypto

Solana (SOLUSD) is the pattern leader on Crypto here, so I’ll start with that today.

I was looking at the possible inflection point on Solana last week as it hit main bull flag resistance and reversed there, and so far that has been playing out in a way that is suggesting that we might see that possible big reversal that I was looking at.

CTM Crypto Substack is a reader-supported publication. To receive new posts and support my work, consider becoming a free or paid subscriber.

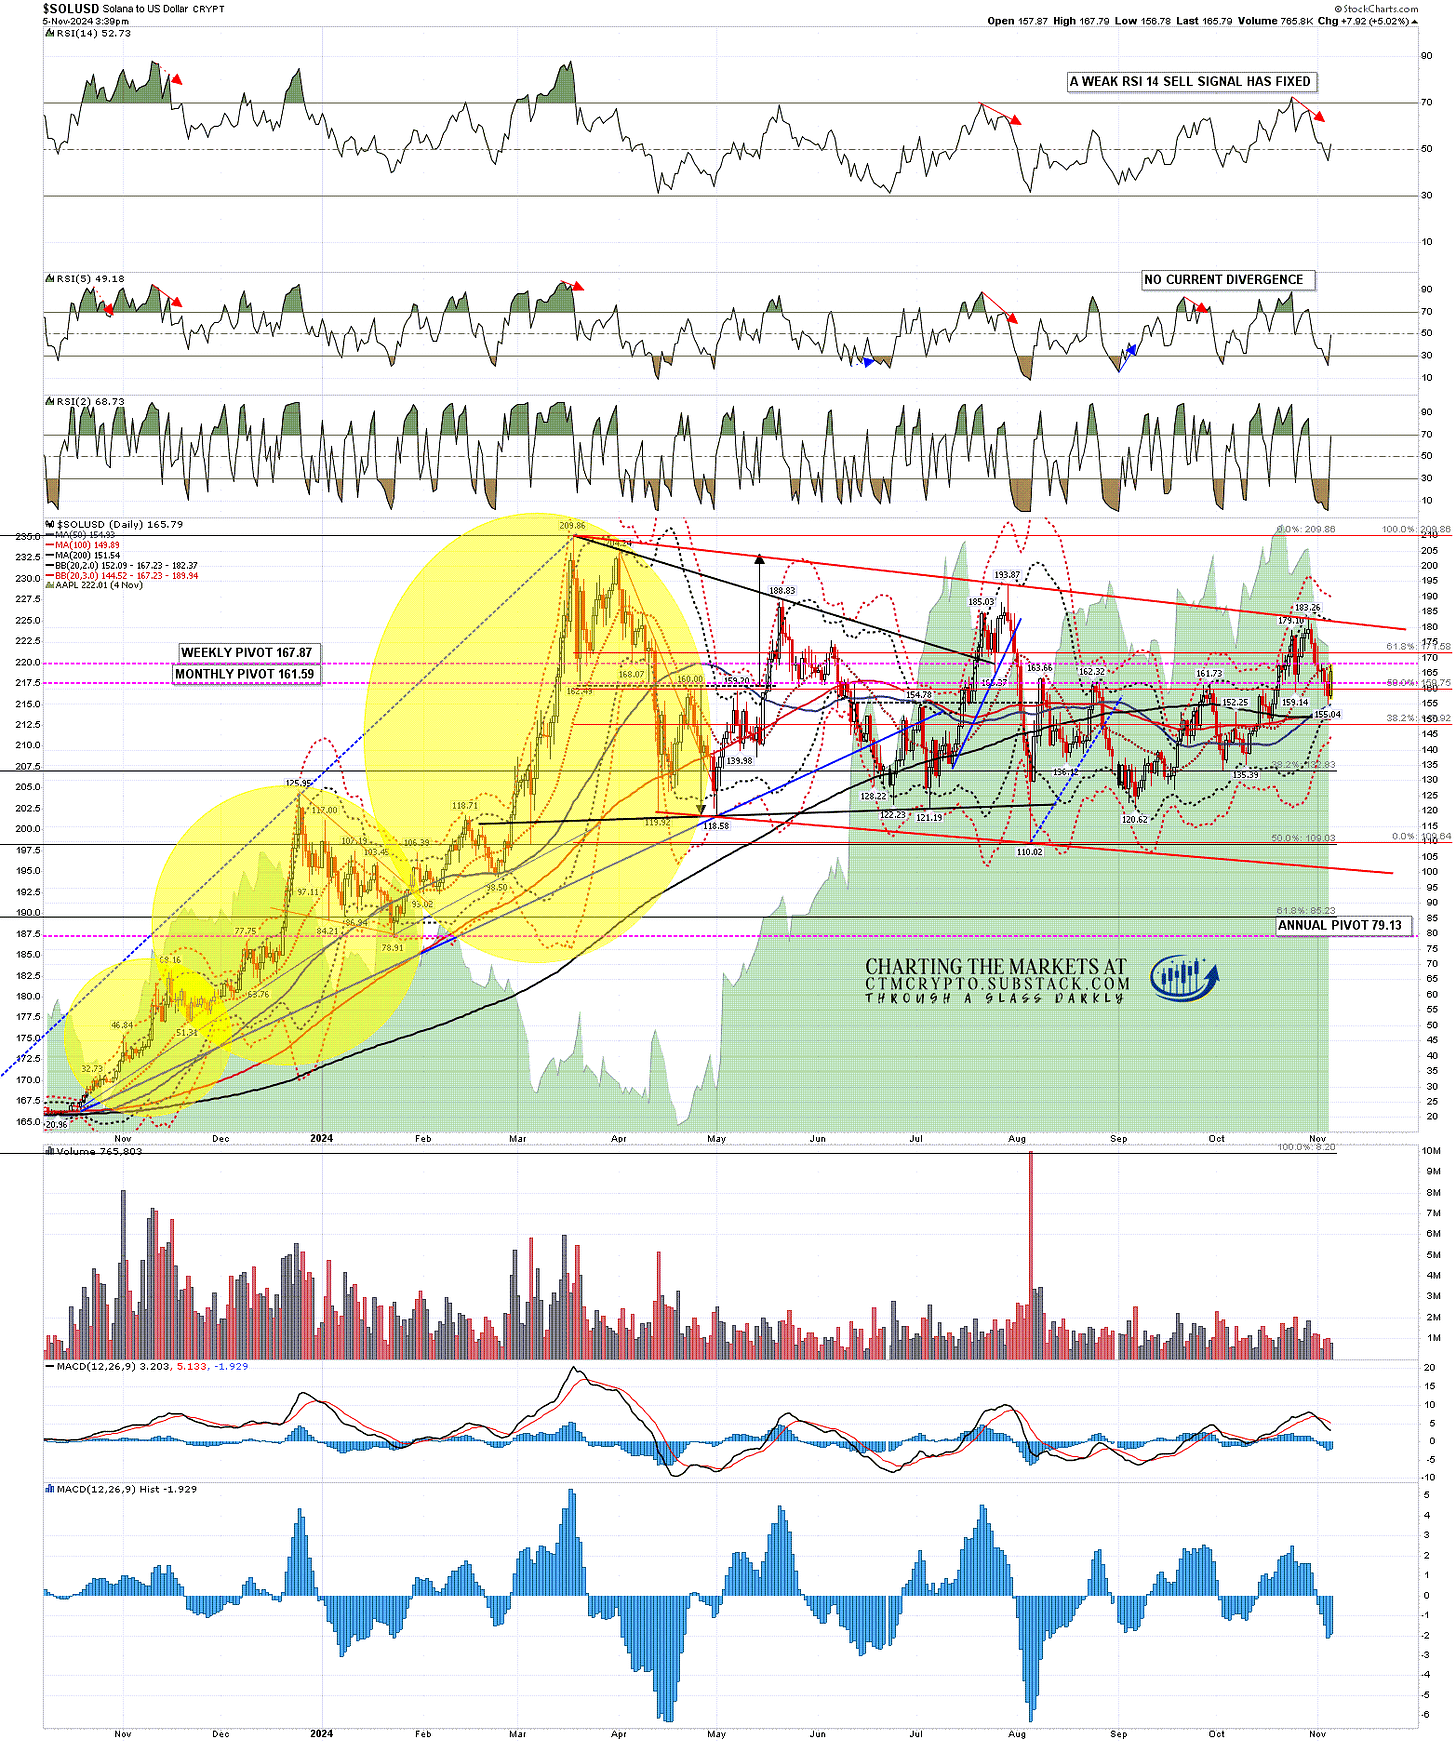
On the daily chart a daily weak RSI 14 sell signal has fixed, Solana has broken back below the daily middle band and backtested the 50dma, currently at 154.90, and resistance is at the daily middle band, currently at 167.15.

SOLUSD daily chart:

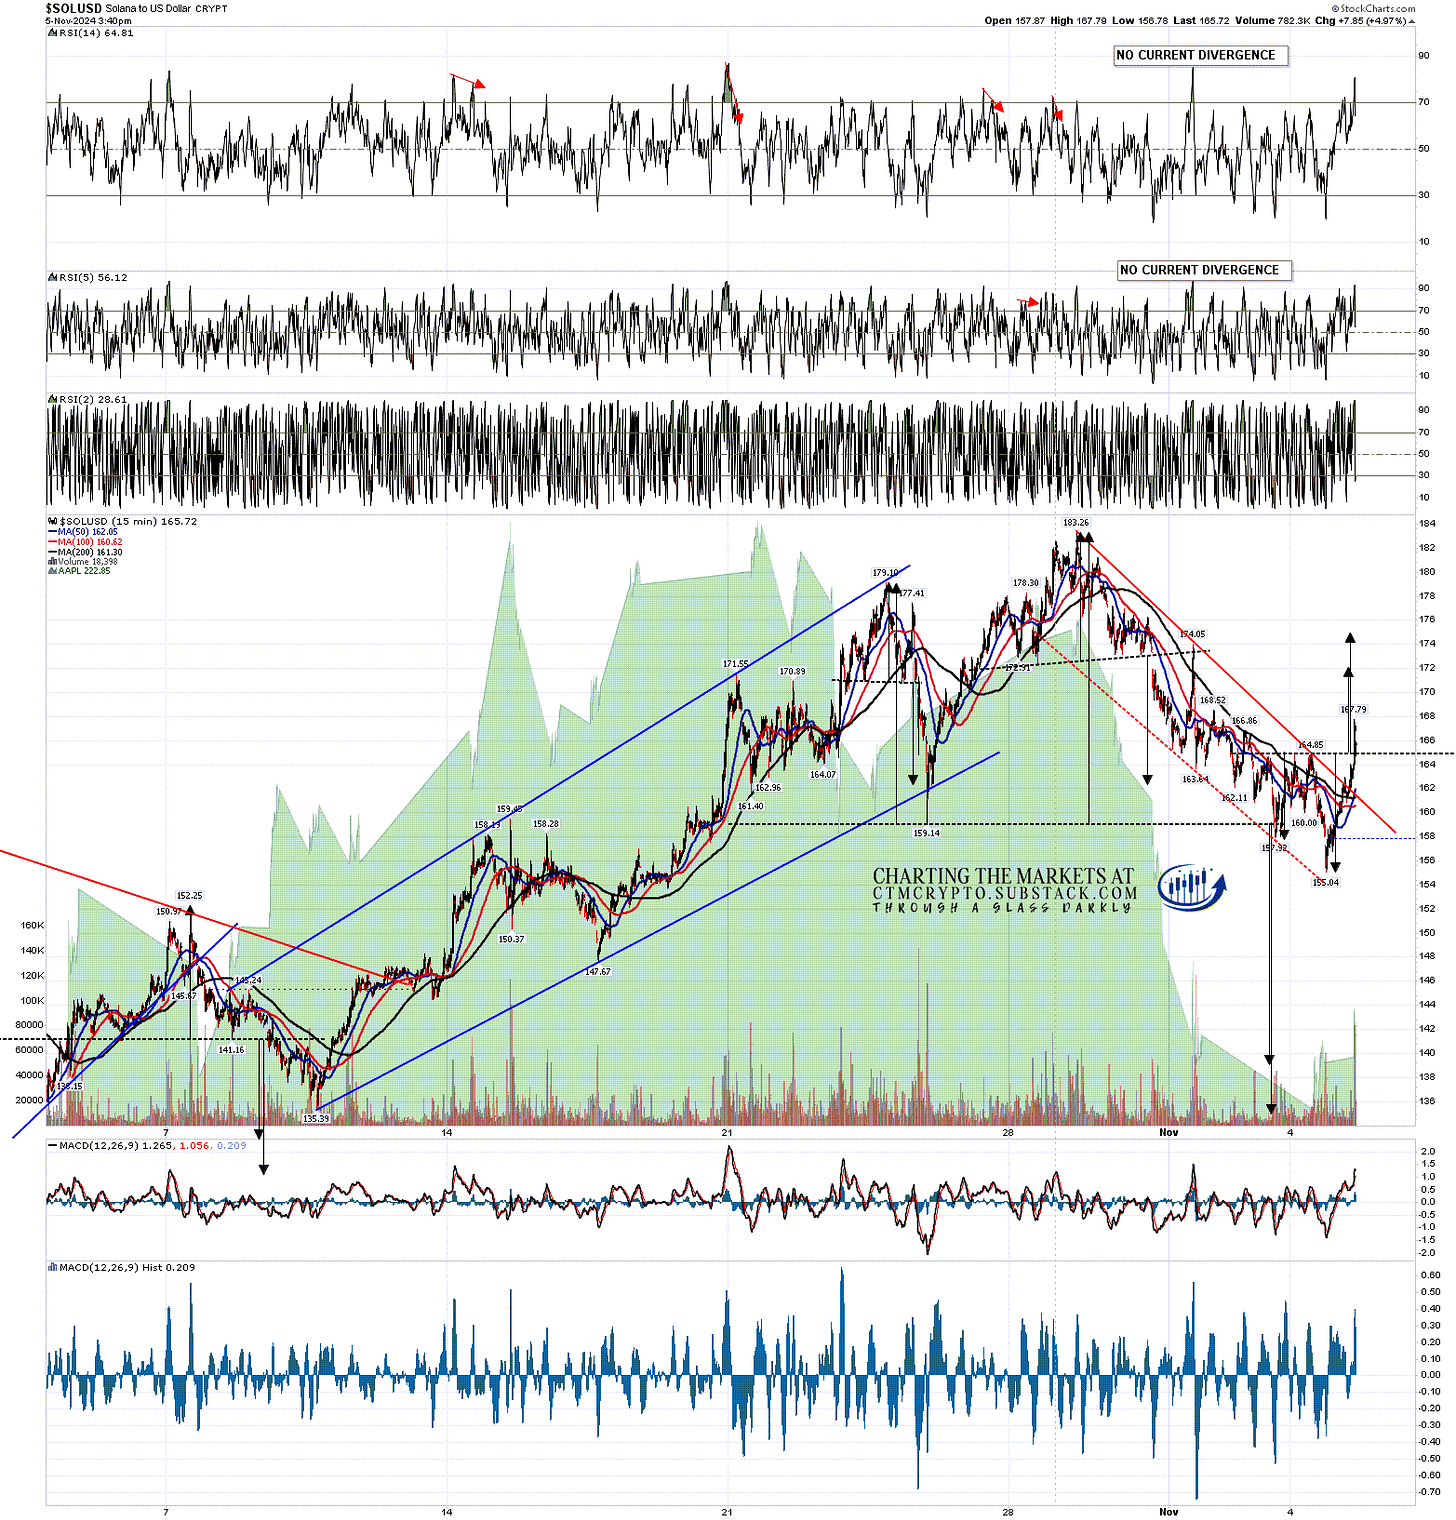
On the 15min chart Solana has broken the possible double top support I was looking at last week with a target in the 135-9 area, and that leaves us with a binary setup here where SOLUSD will likely either head down to that target or reject back up to retest the last high at 183.26.

In the short term I was looking in my premarket video this morning at the possible double bottom that formed yesterday on Solana that on a sustained break over double bottom resistance at 164.85 would look for the 172-5 area. As I write, that double bottom is breaking up and Solana is backtesting the daily middle band.

SOLUSD 15min chart:

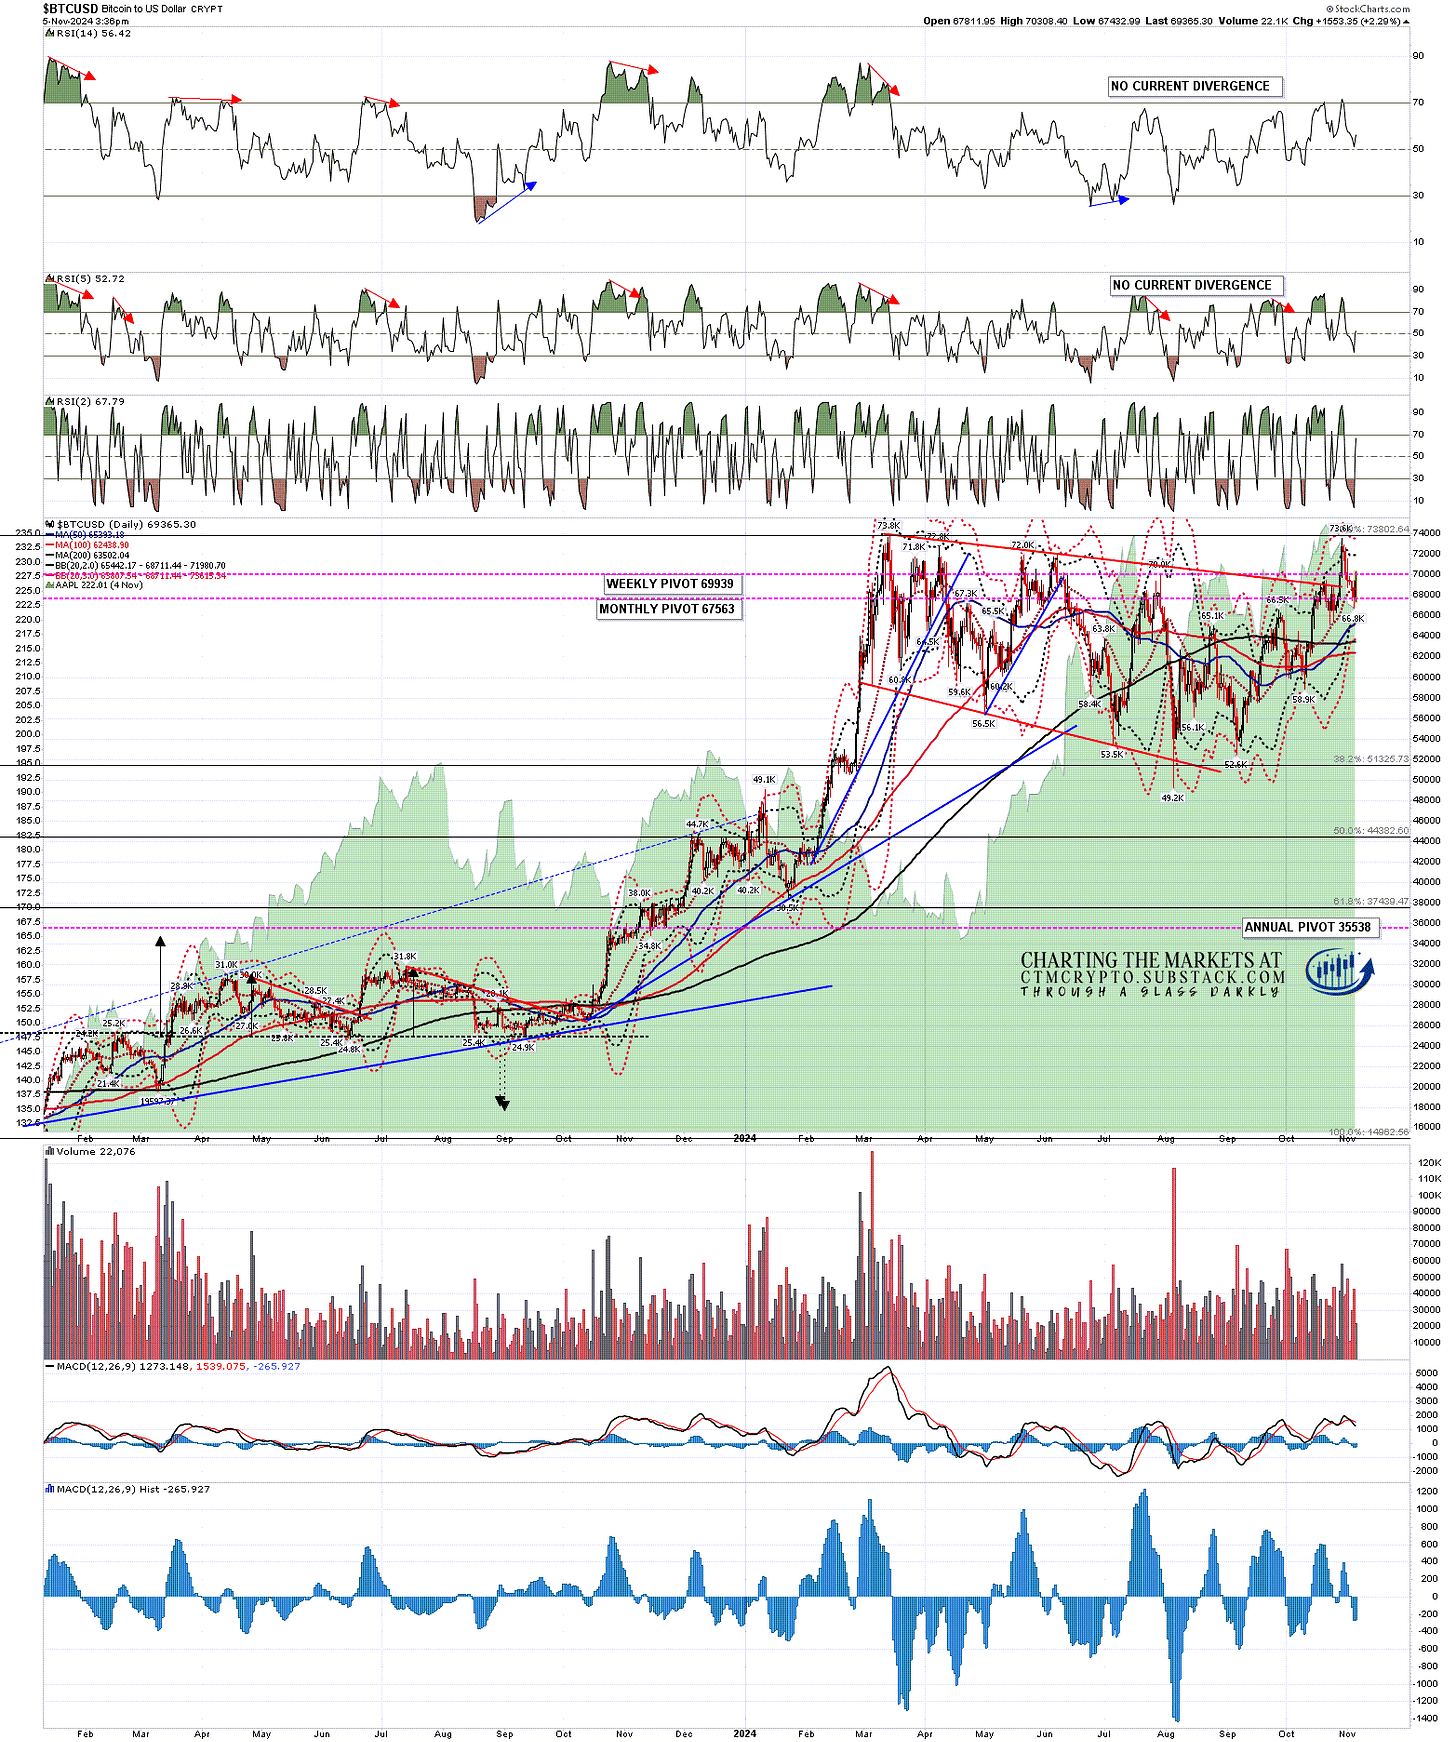
On Bitcoin (BTCUSD) we have seen a break back under the daily middle band, currently at 68,740, though not with great confidence, and an attempt to break back over that today that may be successful.

BTCUSD daily chart:

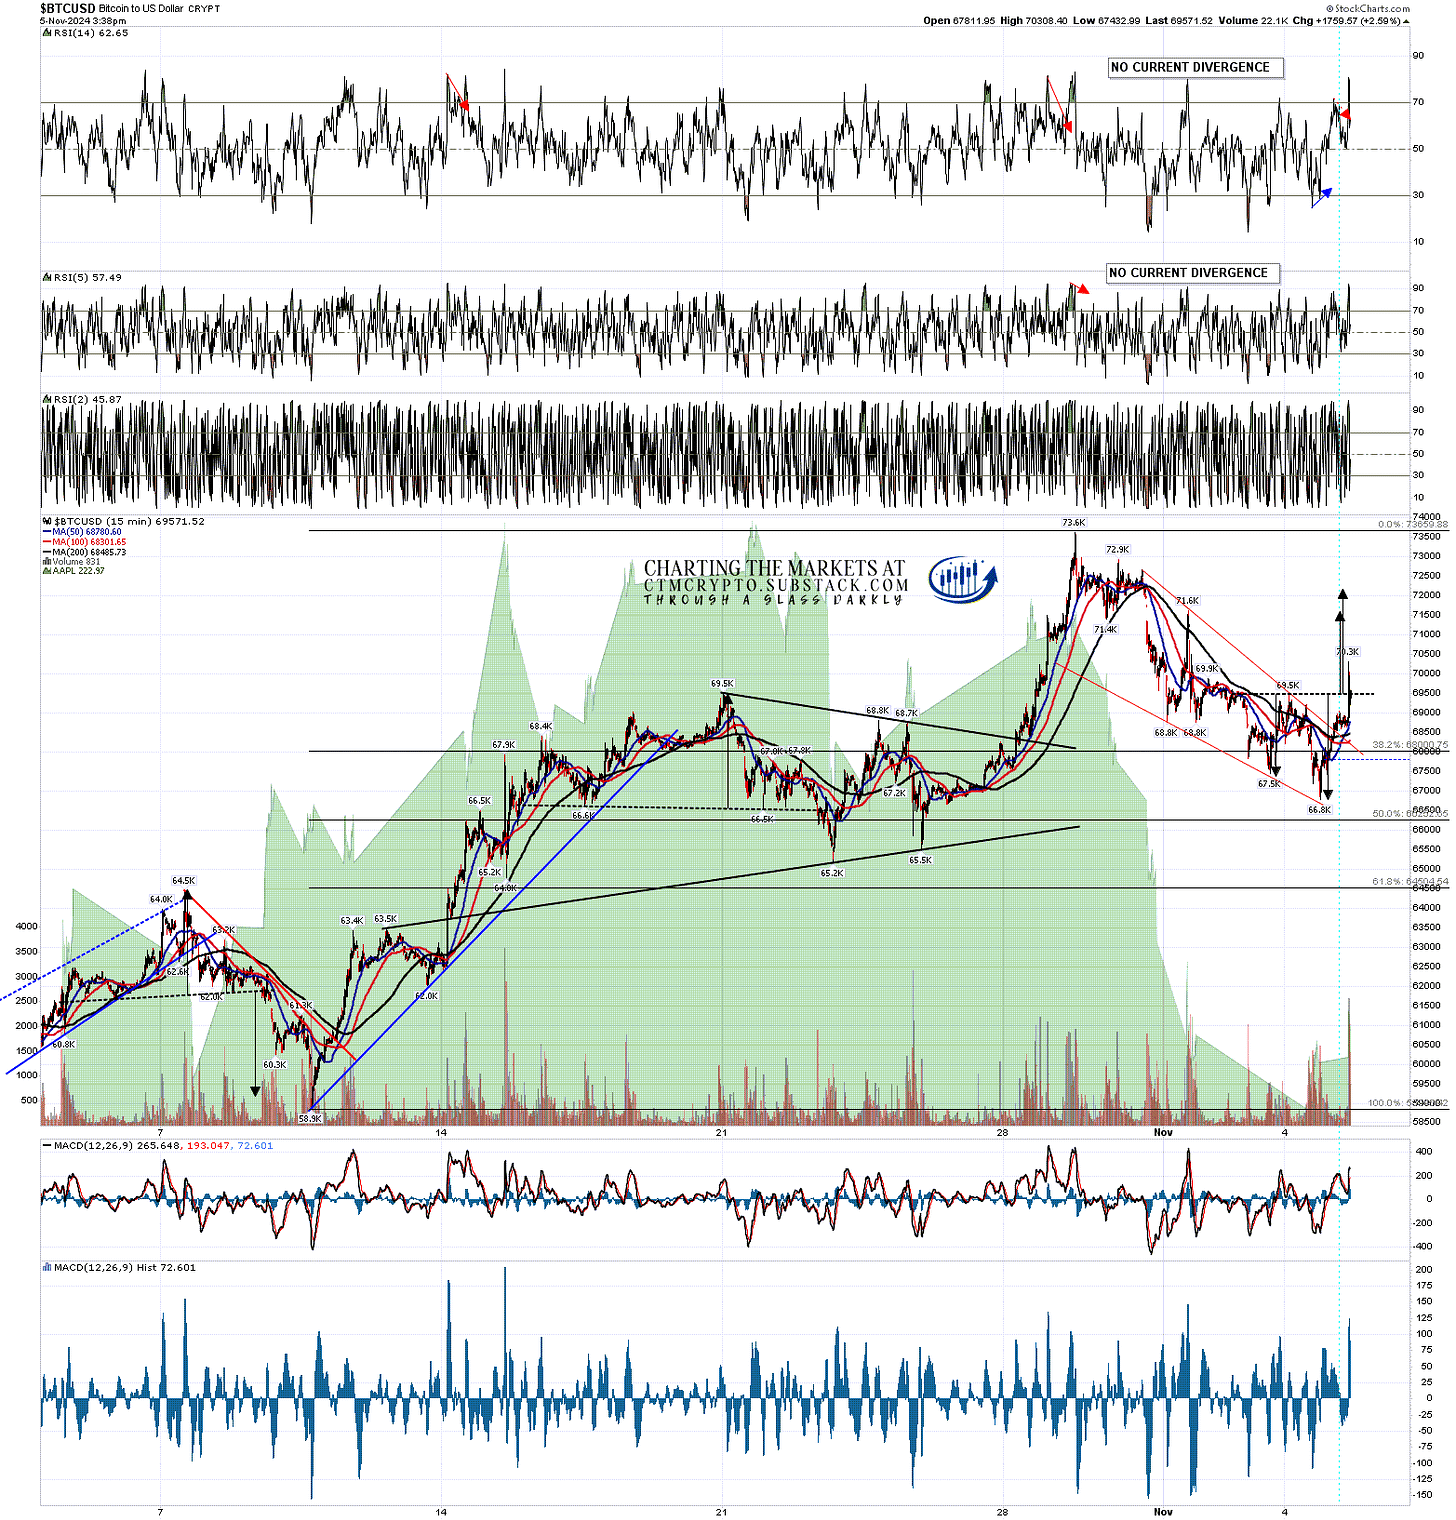
On the 15min chart Bitcoin formed a small falling wedge that has broken up and a small double bottom has formed that on a sustained break back up over double bottom resistance at 69.5k, the double bottom target would be in the 71.5k to 72.2k area. Again, as I write, that double bottom has broken up.

BTCUSD 15min chart:

Not much to add on Ethereum (ETHUSD) here other than to say the obvious resistance is at the 50dma, currently at 2529, and the daily middle band at 2554/5.

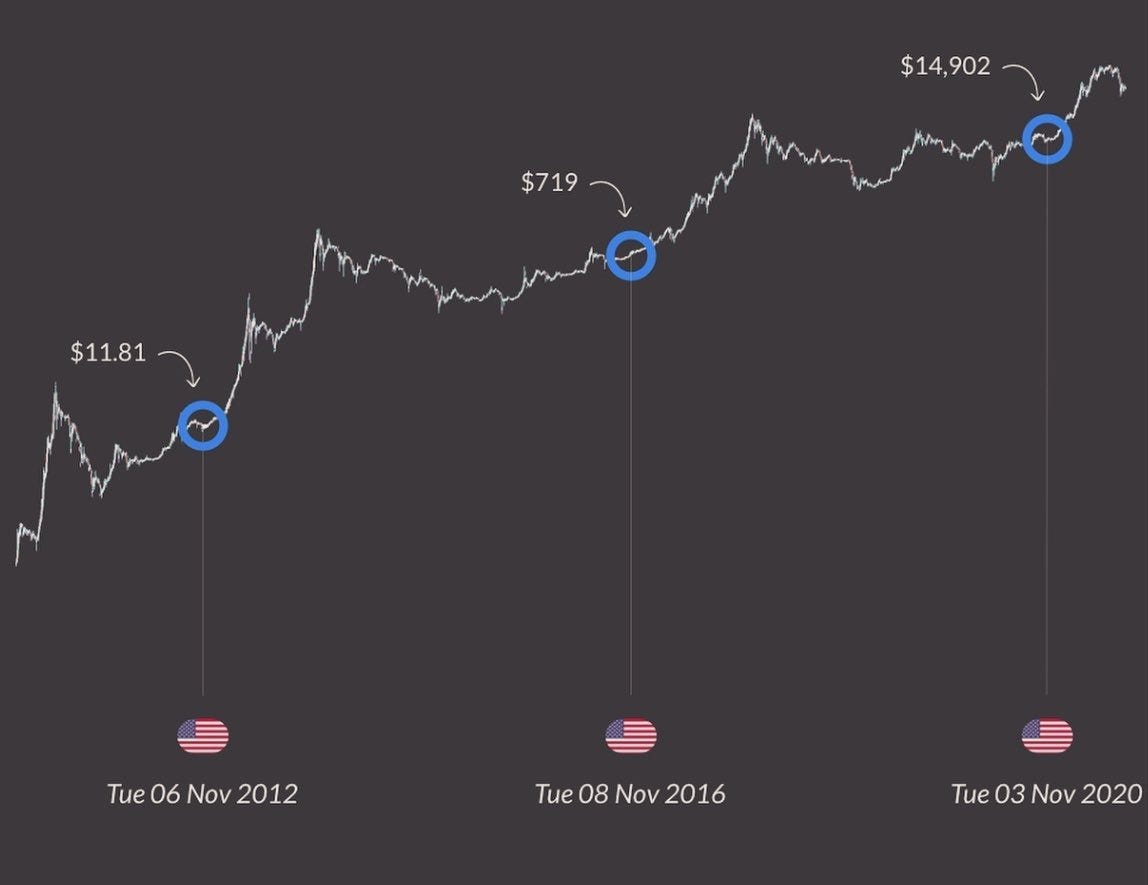
Instead of an Ethereum chart I’ll repost an interesting looking chart from Quinten Francois on twitter noting that the last three presidential election all set Bitcoin price floors that have never subsequently been broken. That’s not necessarily significant, but it is interesting.

BTCUSD vs Presidential Elections 2012-20:

So what’s the takeaway here? Well before the open this morning I was talking about the decent looking possible double bottoms on Bitcoin, Solana, SPX and DIA. Those have broken up on Bitcoin and Solana, and the ones on SPX and DIA are heading that way at speed at the moment. We could see a strong rally across the board today and, subject to the huge news week this week, that could take all of these back to last week’s highs.

I would add that a lot of people have been building up the presidential election as Trump good for Crypto & Harris bad for Crypto. I personally don’t think that Trump would be particularly great for Crypto or that Harris would be bad. I think that either would likely be good, but if there is a strong perception that a Harris win would be bad for Crypto, then we might have a short term sharp decline coming this week if she wins.

If you’d like to see more of these posts and the other Crypto videos and information I post, please subscribe for free to my Crypto substack.

I'm also to be found at Arion Partners, though as a student rather than as a teacher. I've been charting Crypto for some years now, but am learning to trade and invest in them directly, and Arion Partners are my guide around a space that might reasonably be compared to the Wild West in one of their rougher years. 


Huge News Week

It’s election day today and that is one of the two big news events this week that we are aware of, the other being the Fed decision on interest rates. There is a possible setup here for a substantial decline and also for a high retest and when that news is in we may well be see one or the other.

In terms of the high retest, the retest of the low yesterday set a possible daily RSI 5 buy signal brewing on SPX. If that fixes that could support a high retest from here.

SPX daily BBs chart:

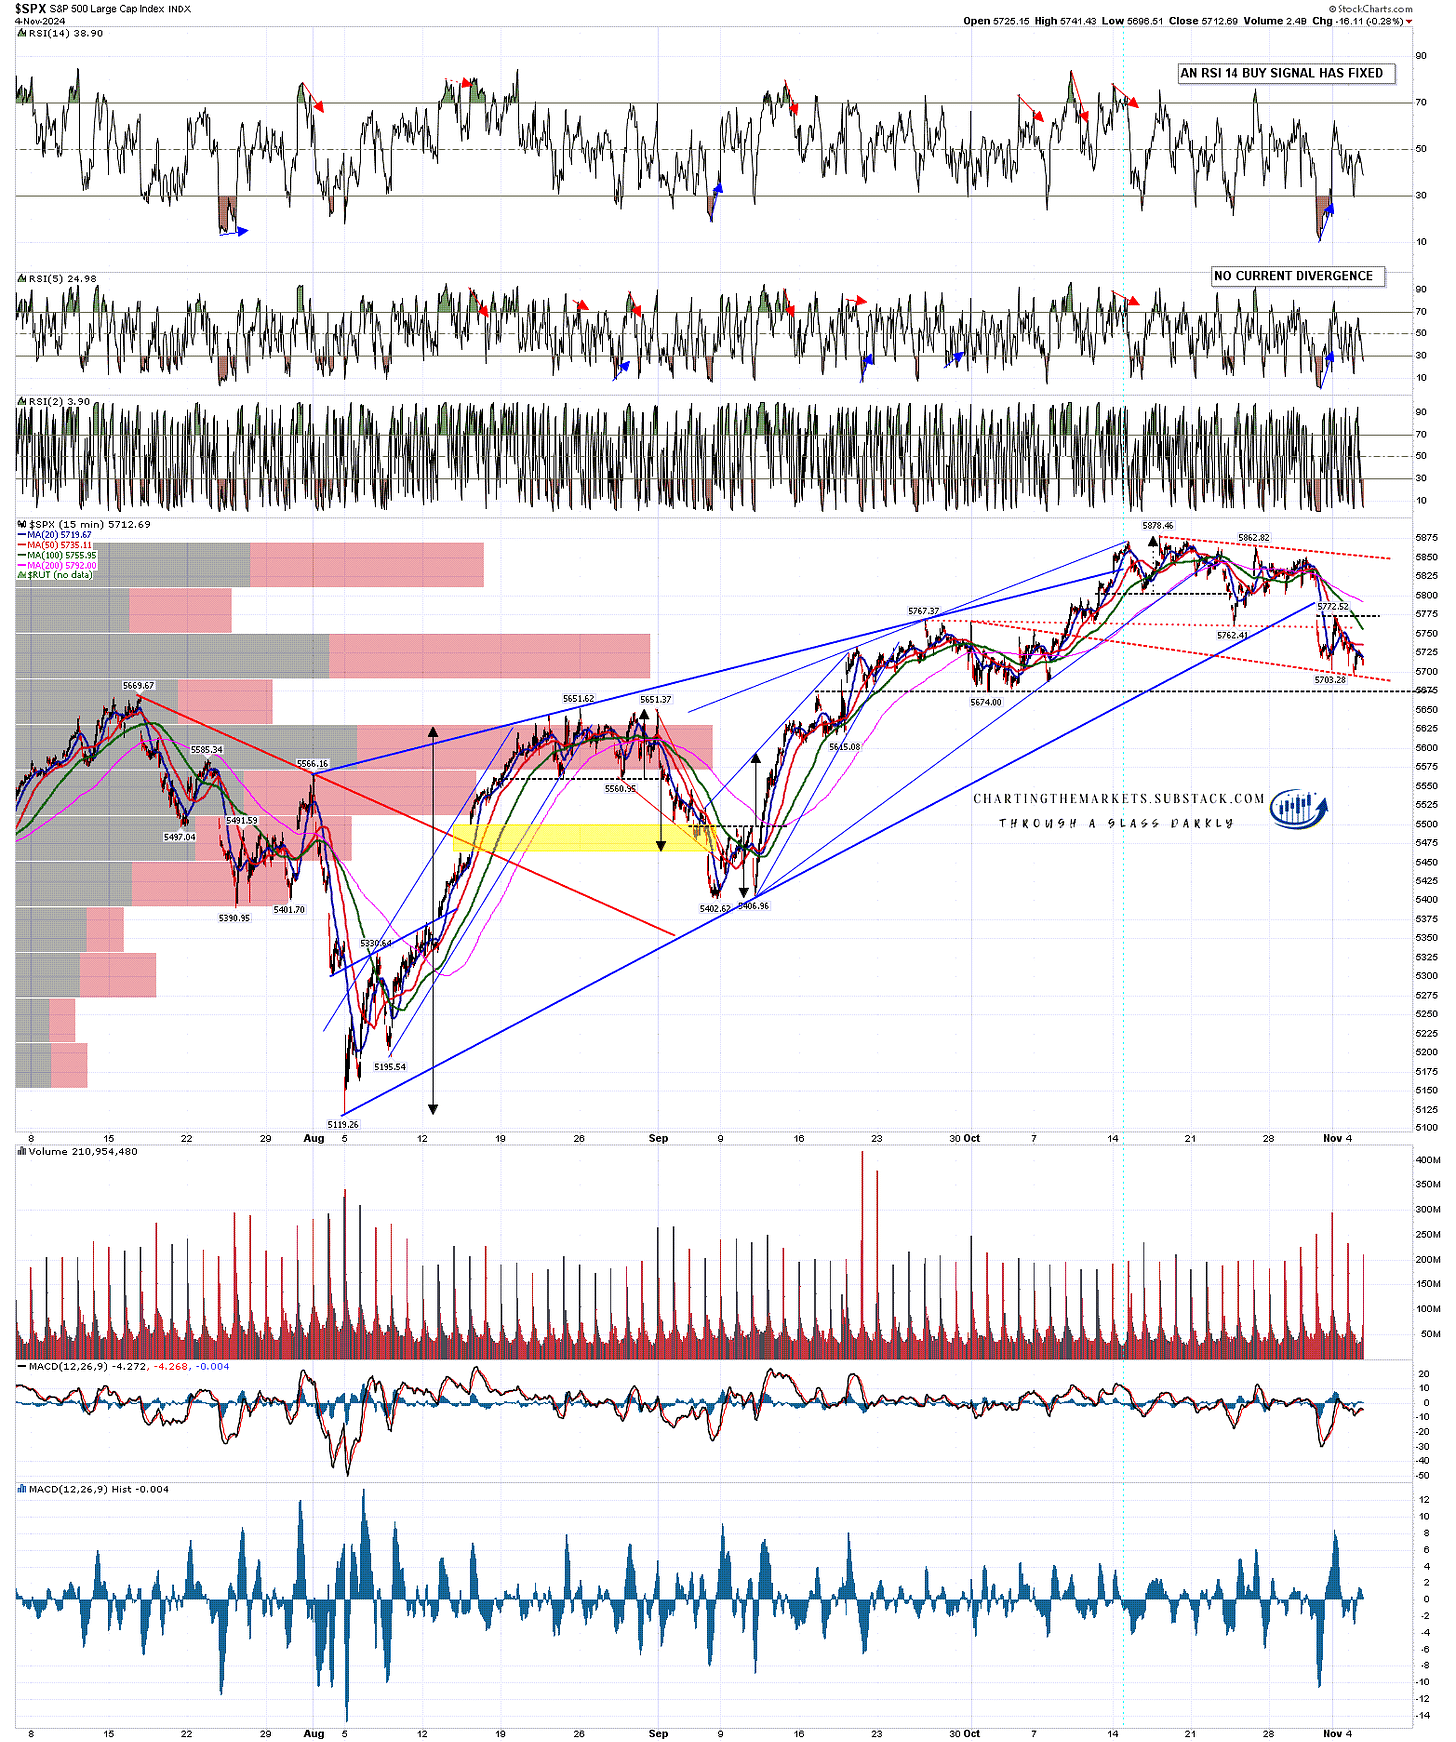
On the 15min chart there may still be an H&S forming as I was looking at last week.

On the bull side though, there is also a decent looking bull flag pattern forming here that retested flag support at the low yesterday. That could be setting up a high retest.

There is also a small double bottom in place on SPX that on a sustained break over 5772.5 would look for the 5845 area. That would take SPX back to the bull flag resistance trendline, currently in the 5850 area.

SPX 15min chart:

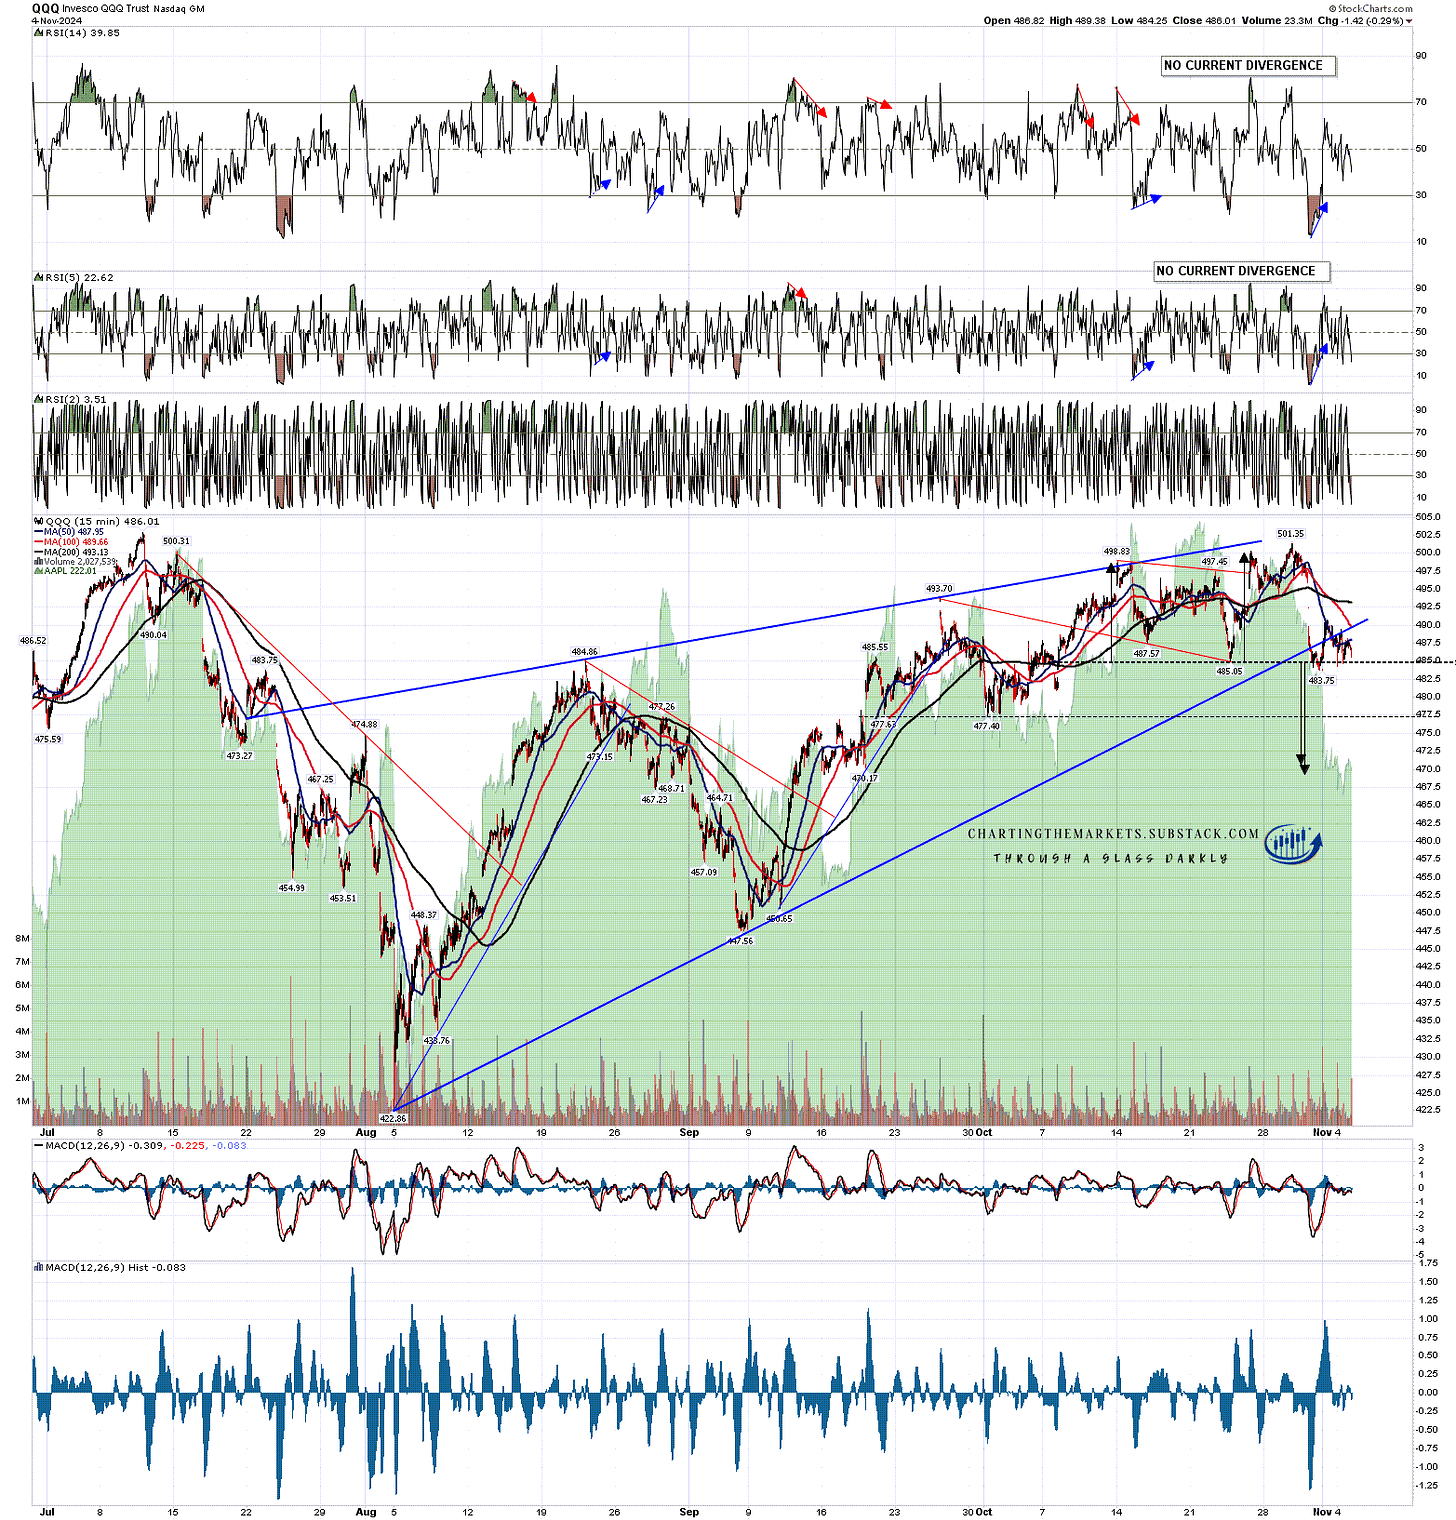
On the Qs a modest double top has broken down with a target in the 469.5 to 471 area. That may well deliver but, if it doesn’t, a rejection back up would look for a retest of the high at 501.35.

QQQ 15min chart:

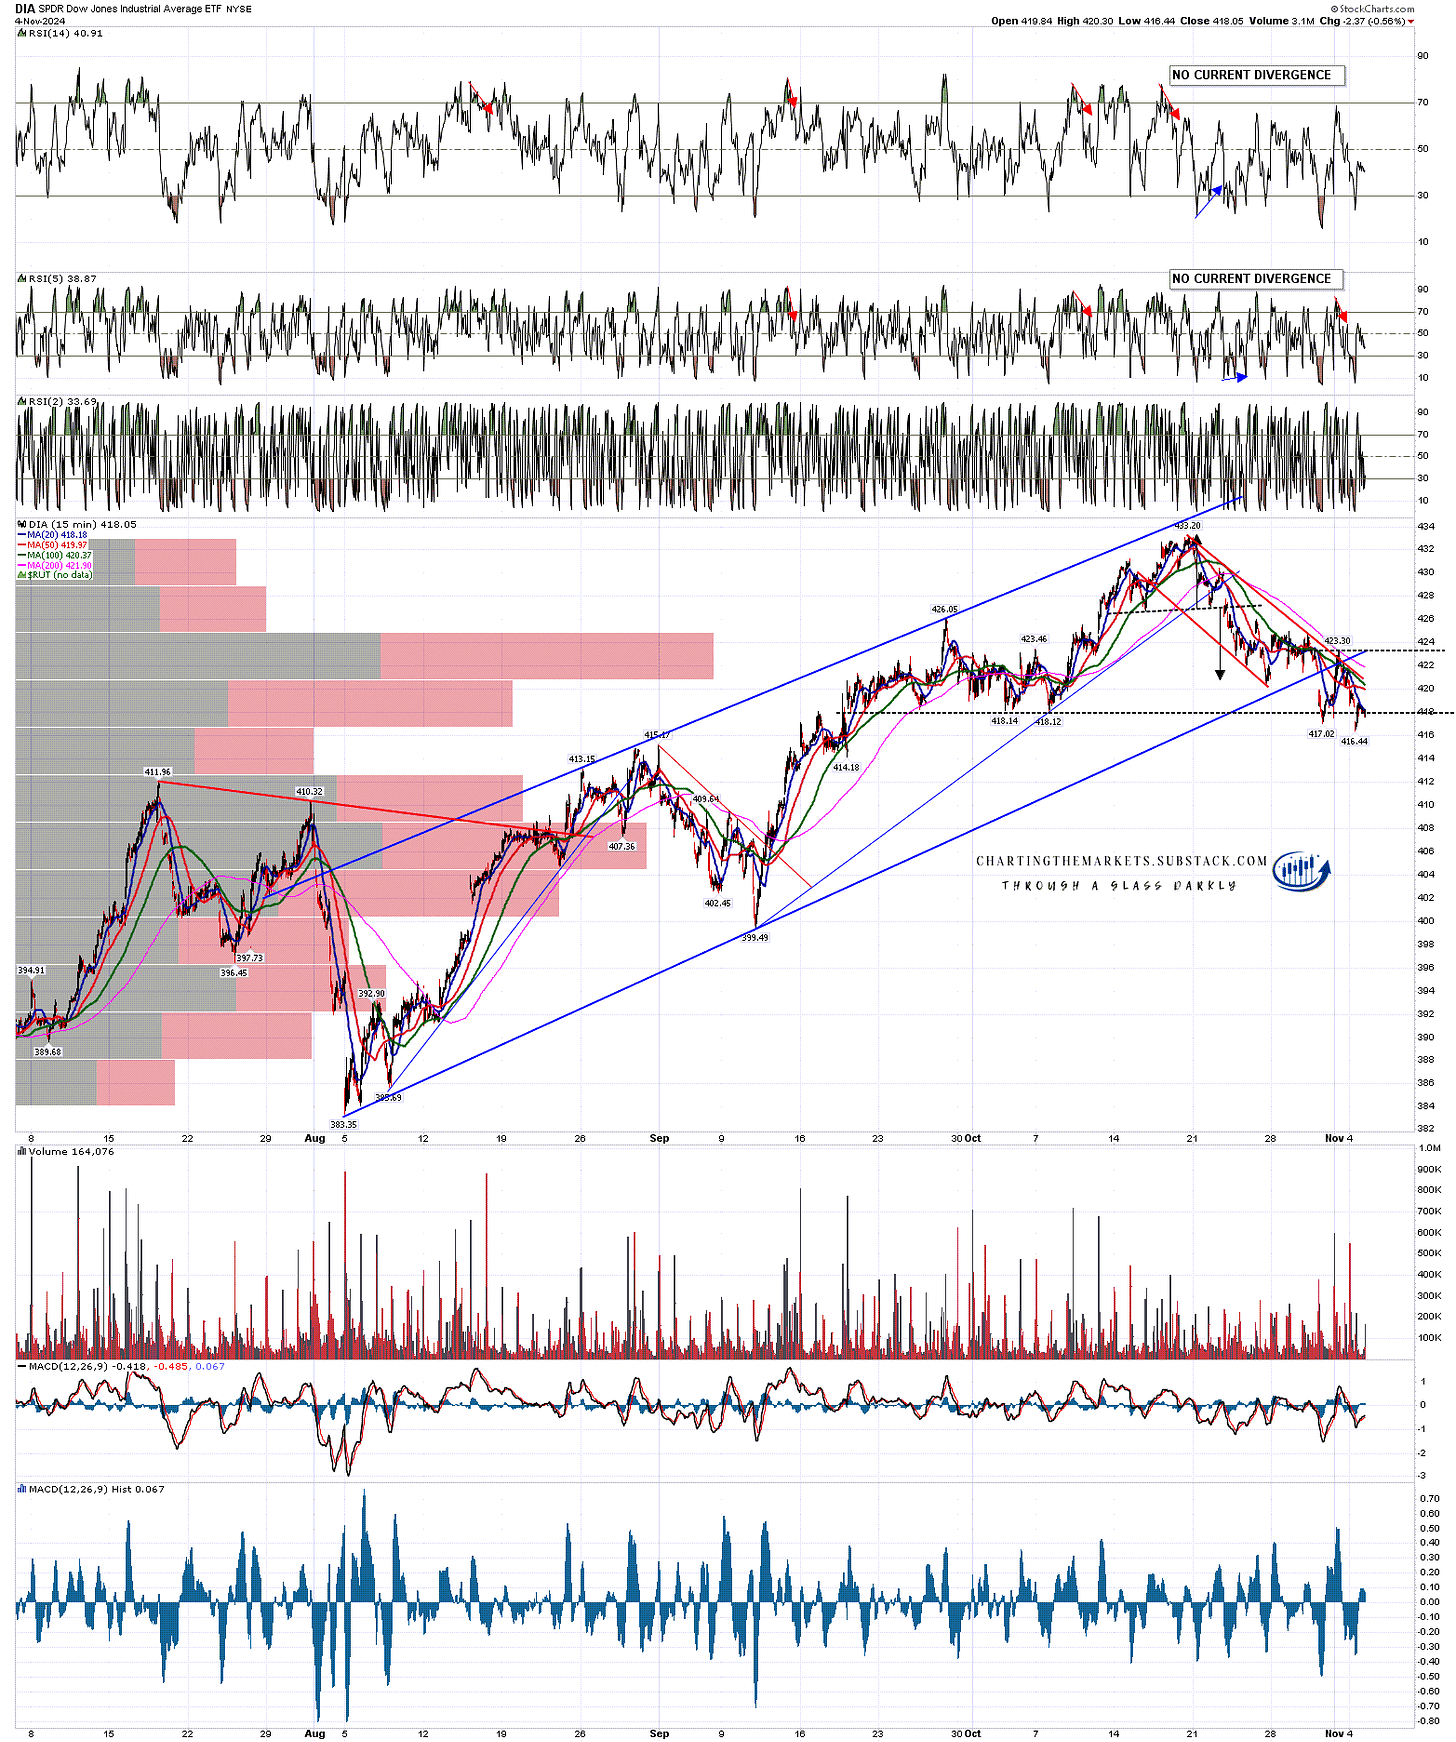
On DIA an H&S may be forming and could have already formed and broken down, though the pattern would look very light on the right shoulder. A possible small double bottom has also formed though that on a sustained break over 423.30 would look for the 429.60 to 430.2 area. Not a full high retest but getting close.

DIA 15min chart:

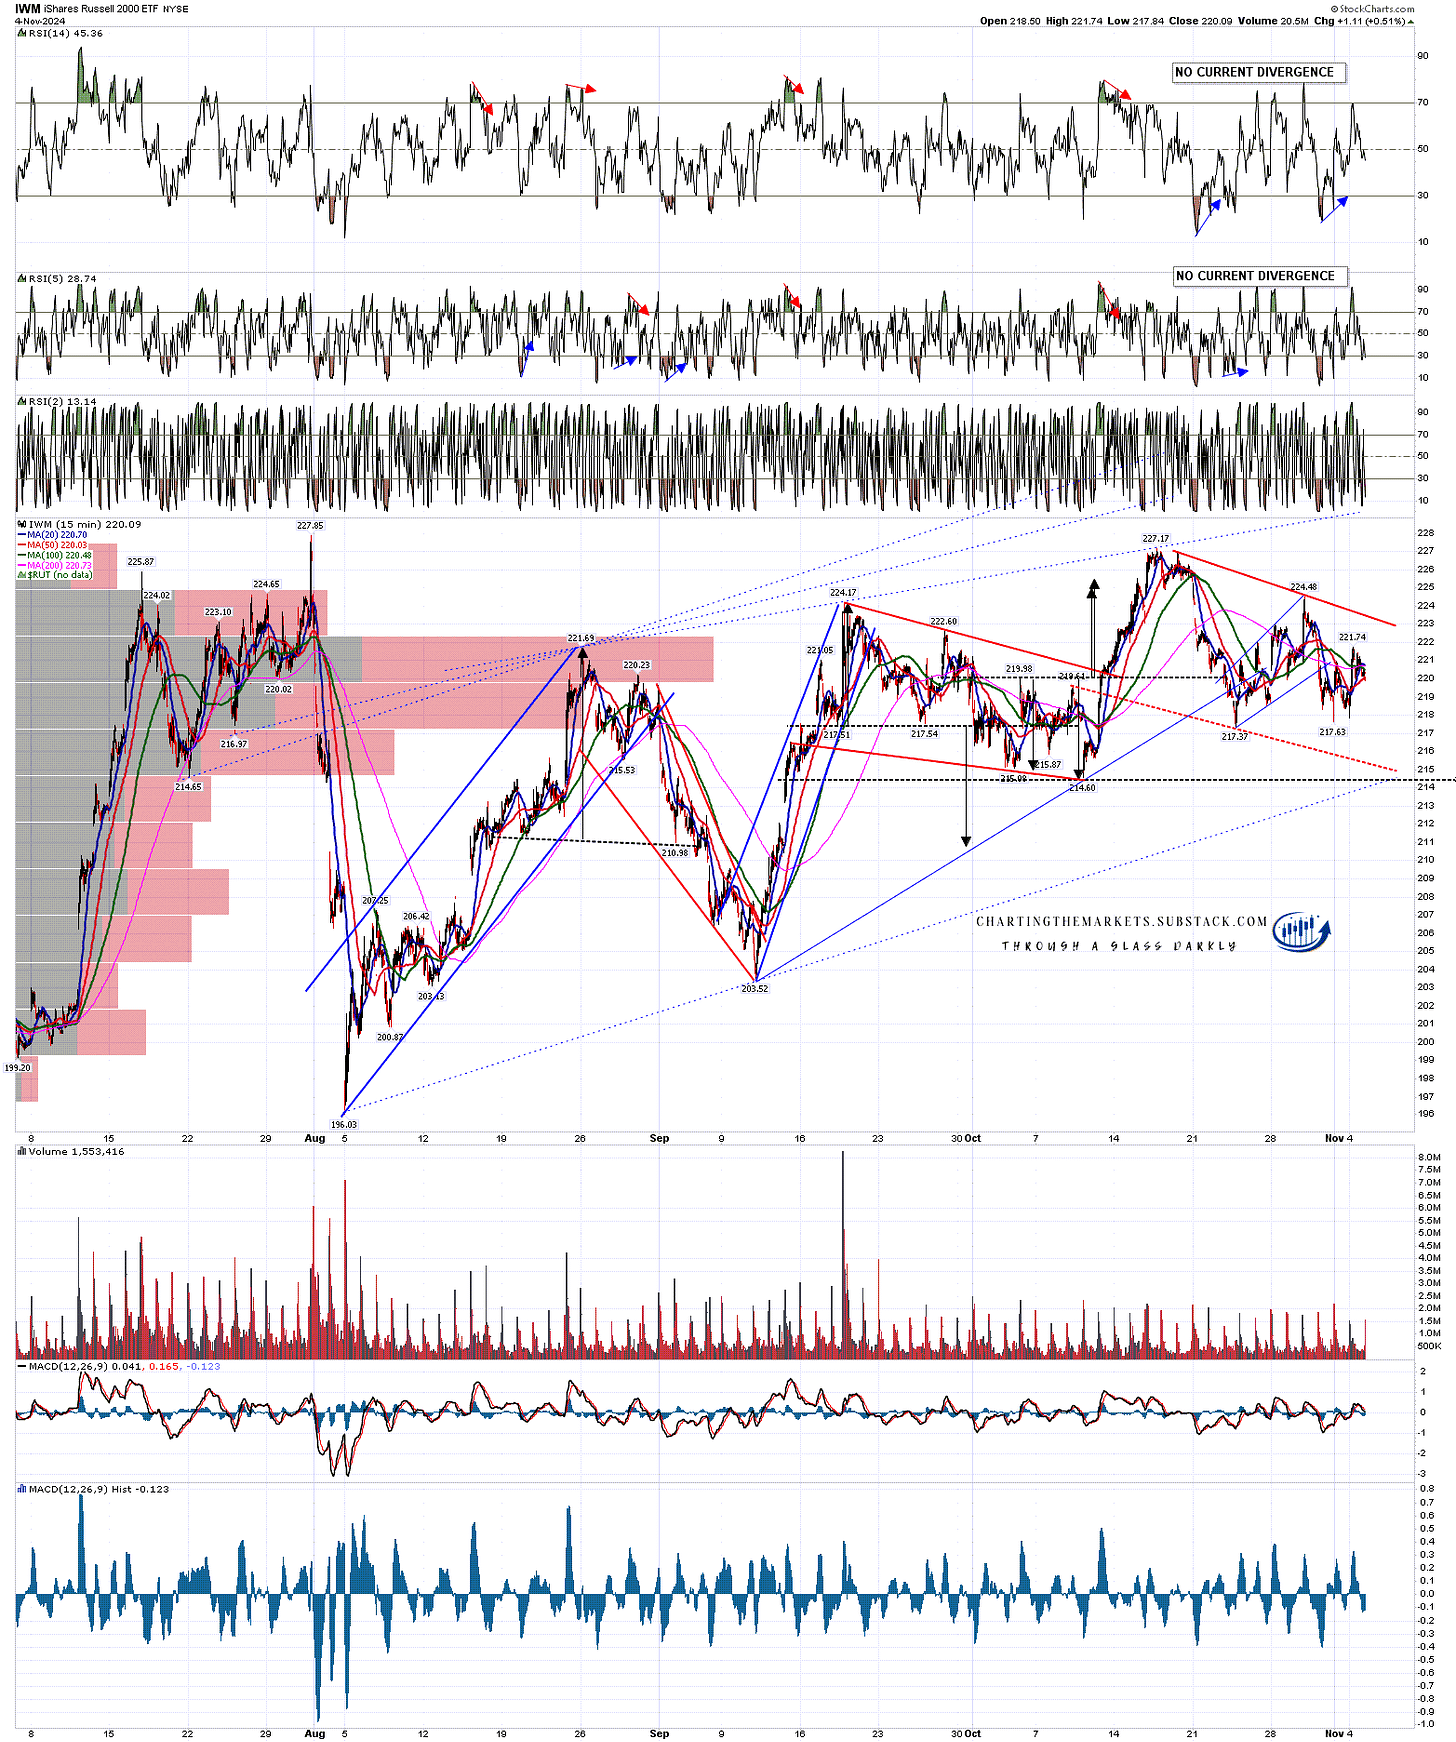
Not much happening on IWM here, though there is still a possible large double top in place that on a sustained break below 214.60 would look for the 201-5 area.

IWM 15min chart:

Hard to say which way the election goes today, or to predict what impact a victory by either side would have on markets. Equally hard to call the Fed decision this week, though I’m leaning towards a 0.25% cut. We’ll see.

If the news doesn’t tank the markets though, the seasonally obvious direction is still up.

If you like my analysis and would like to see more, please take a free subscription at my chartingthemarkets substack, where I publish these posts first and do a short premarket review every morning.
Friday, 1 November 2024

Technical Damage Yesterday & Options From Here

It is the first day of the month today, and I’ve just used daily charts in the charts posted below, as these have all the new monthly pivots marked on them. I’ll also be posting the full list including all the futures I chart at my Substack at the weekend with all the new weekly pivots as well.

This is also really the first post of two. Today I’ll be looking at possible patterns forming and resistance levels, and on Monday morning I’ll be looking in detail at the possible topping patterns forming on the US equity indices in case we are going to be seeing significant further downside.

I’m still somewhat doubtful about seeing that. November is one of the most historically bullish months of the year and based on the daily closes in the last 68 years there are just five trading days in November that have closed green less than 50% of the time, and those five are all slightly north of 49%.

Have we seen big declines in Novembers in the past? Yes, and the last significantly red November was as recently as 2022, they’re just significantly rarer in November than in most other months of the year.

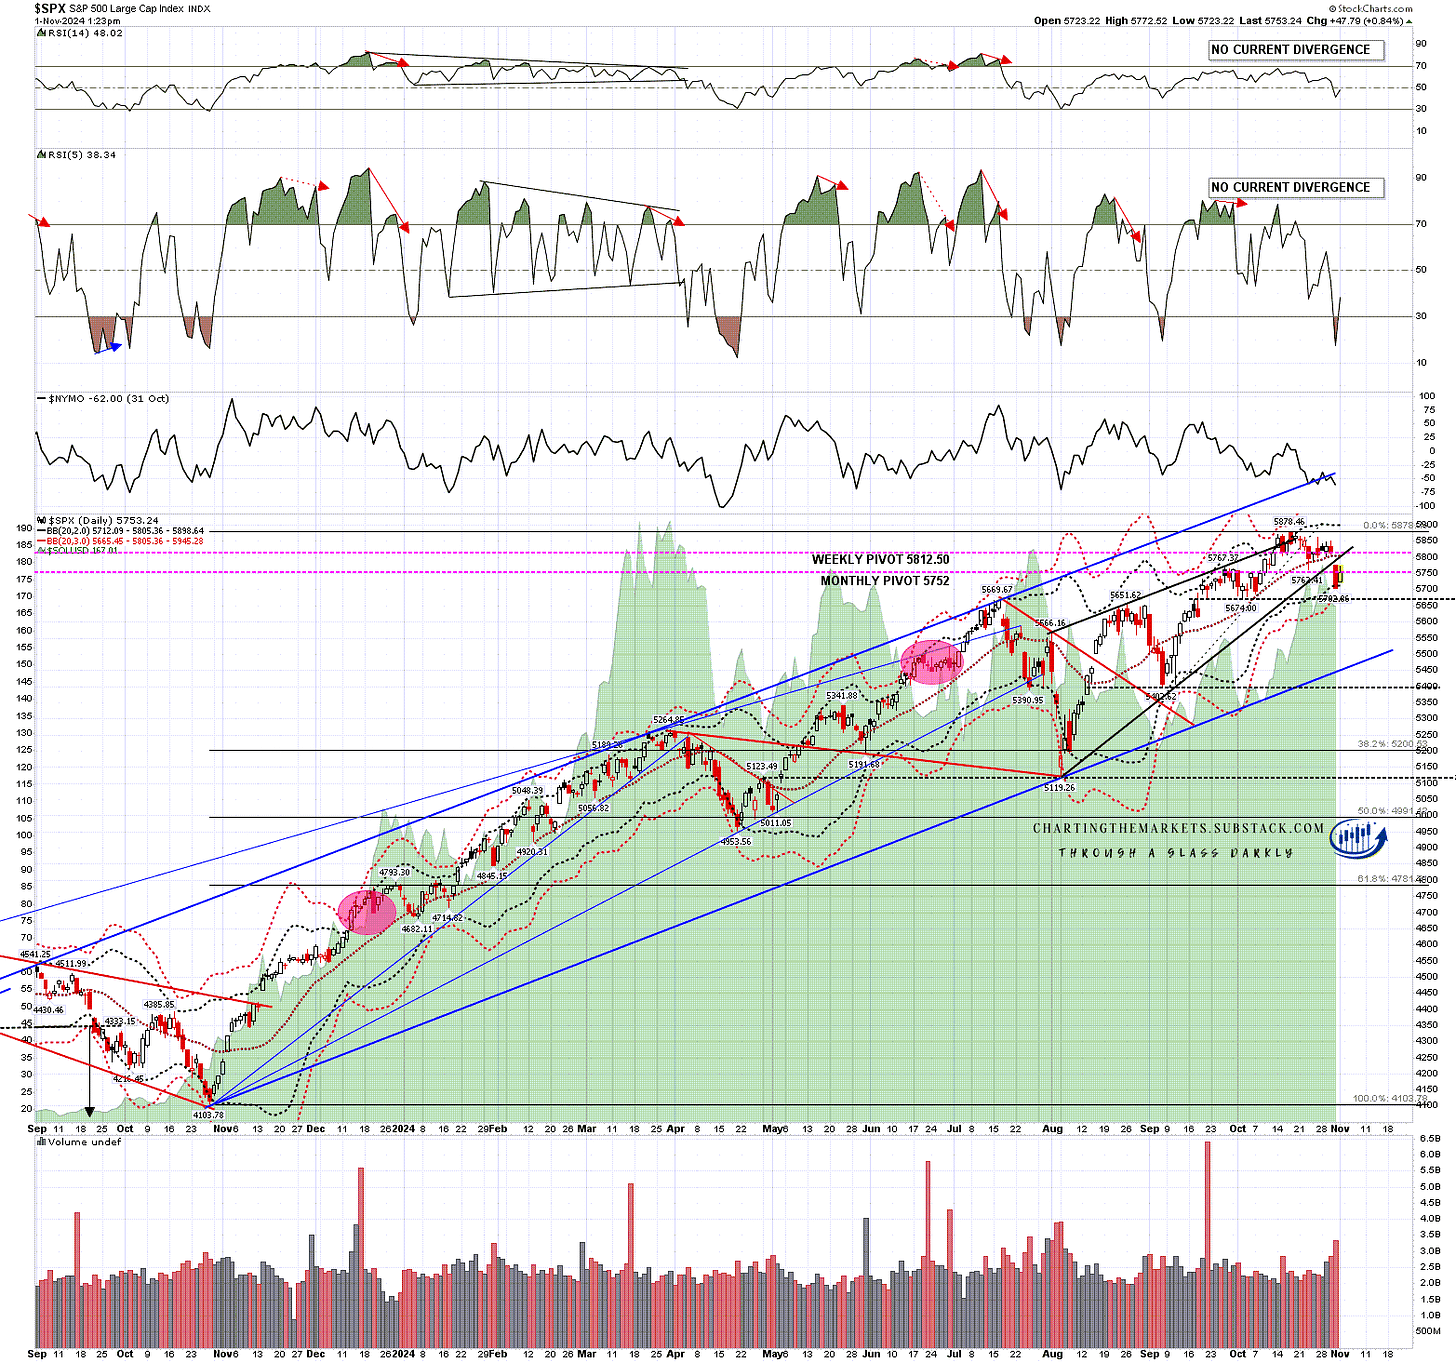
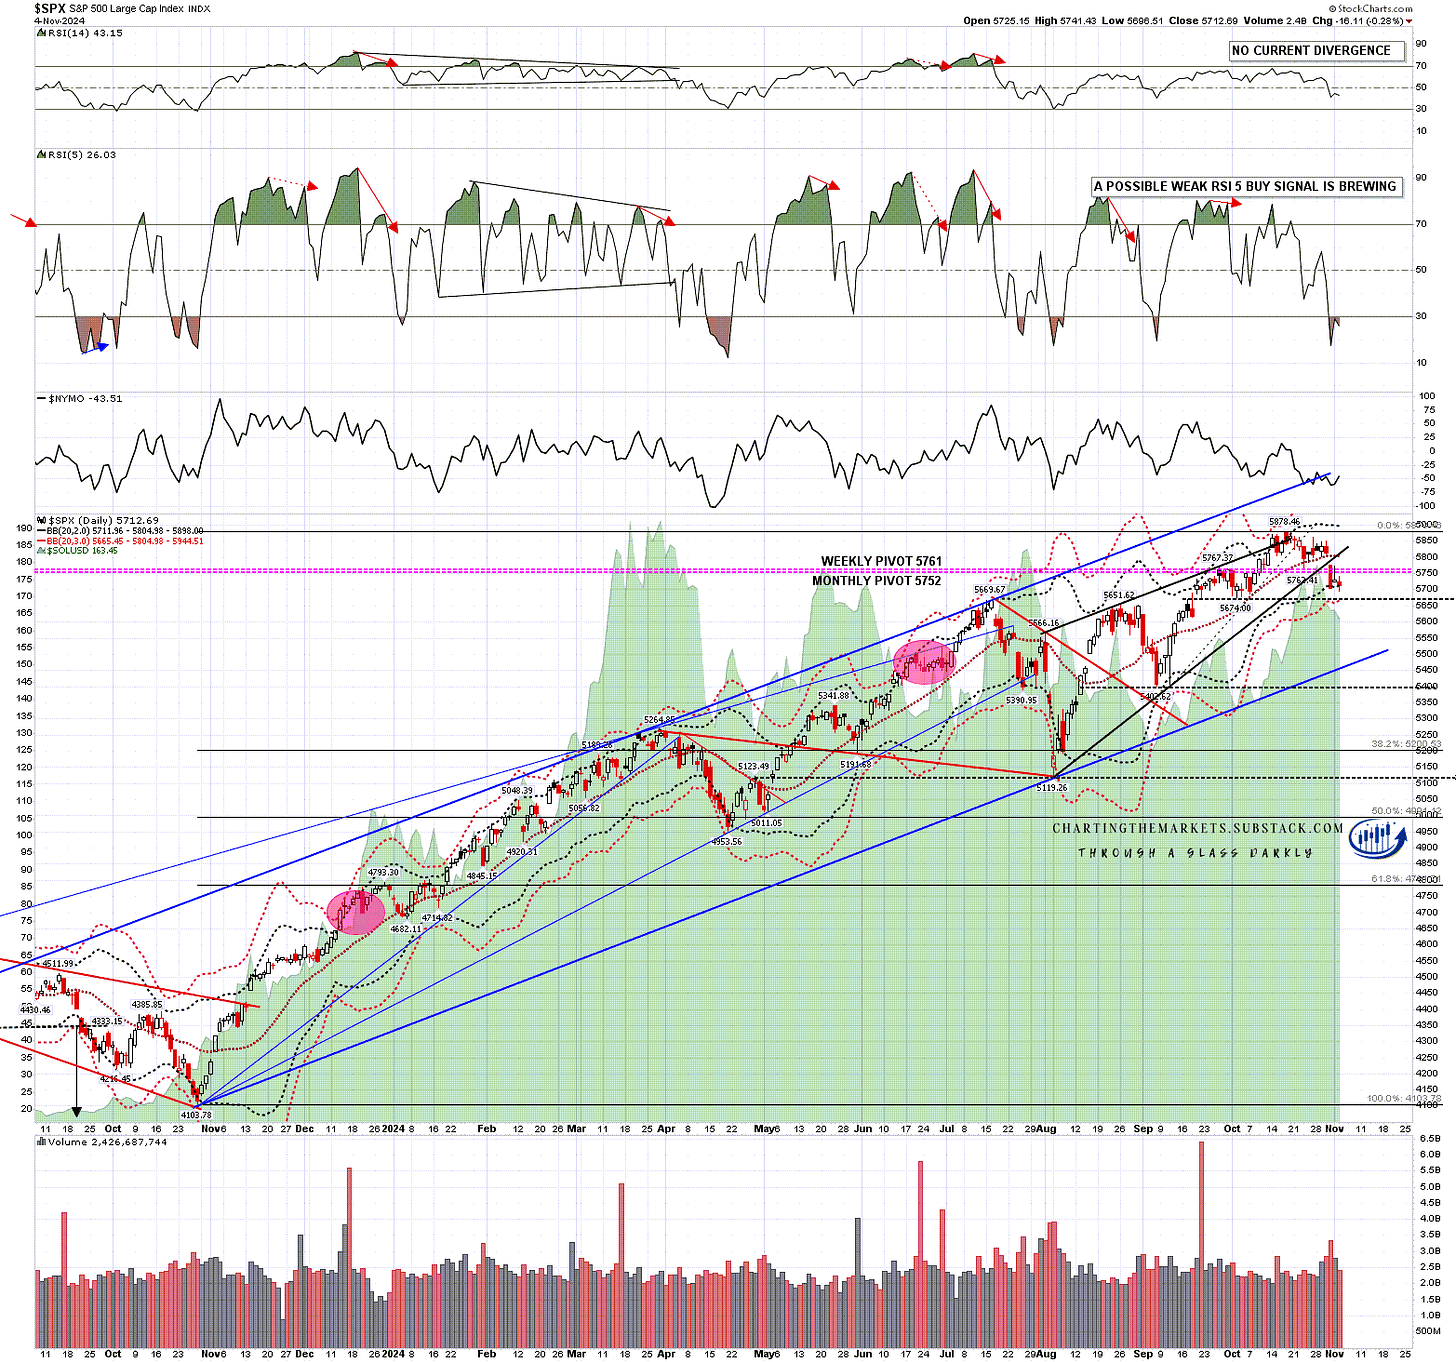
SPX gapped hard through the daily middle band and hit the daily lower band at the low. We’ve been seeing a relief rally today and the obvious areas to watch are the possible H&S right shoulder in the 5767 area, and broken support at the daily middle band, now in the 5805 area. A sustained break back over the daily middle band would suggest a retest of the all time high and very possible continuation higher.

SPX daily chart:

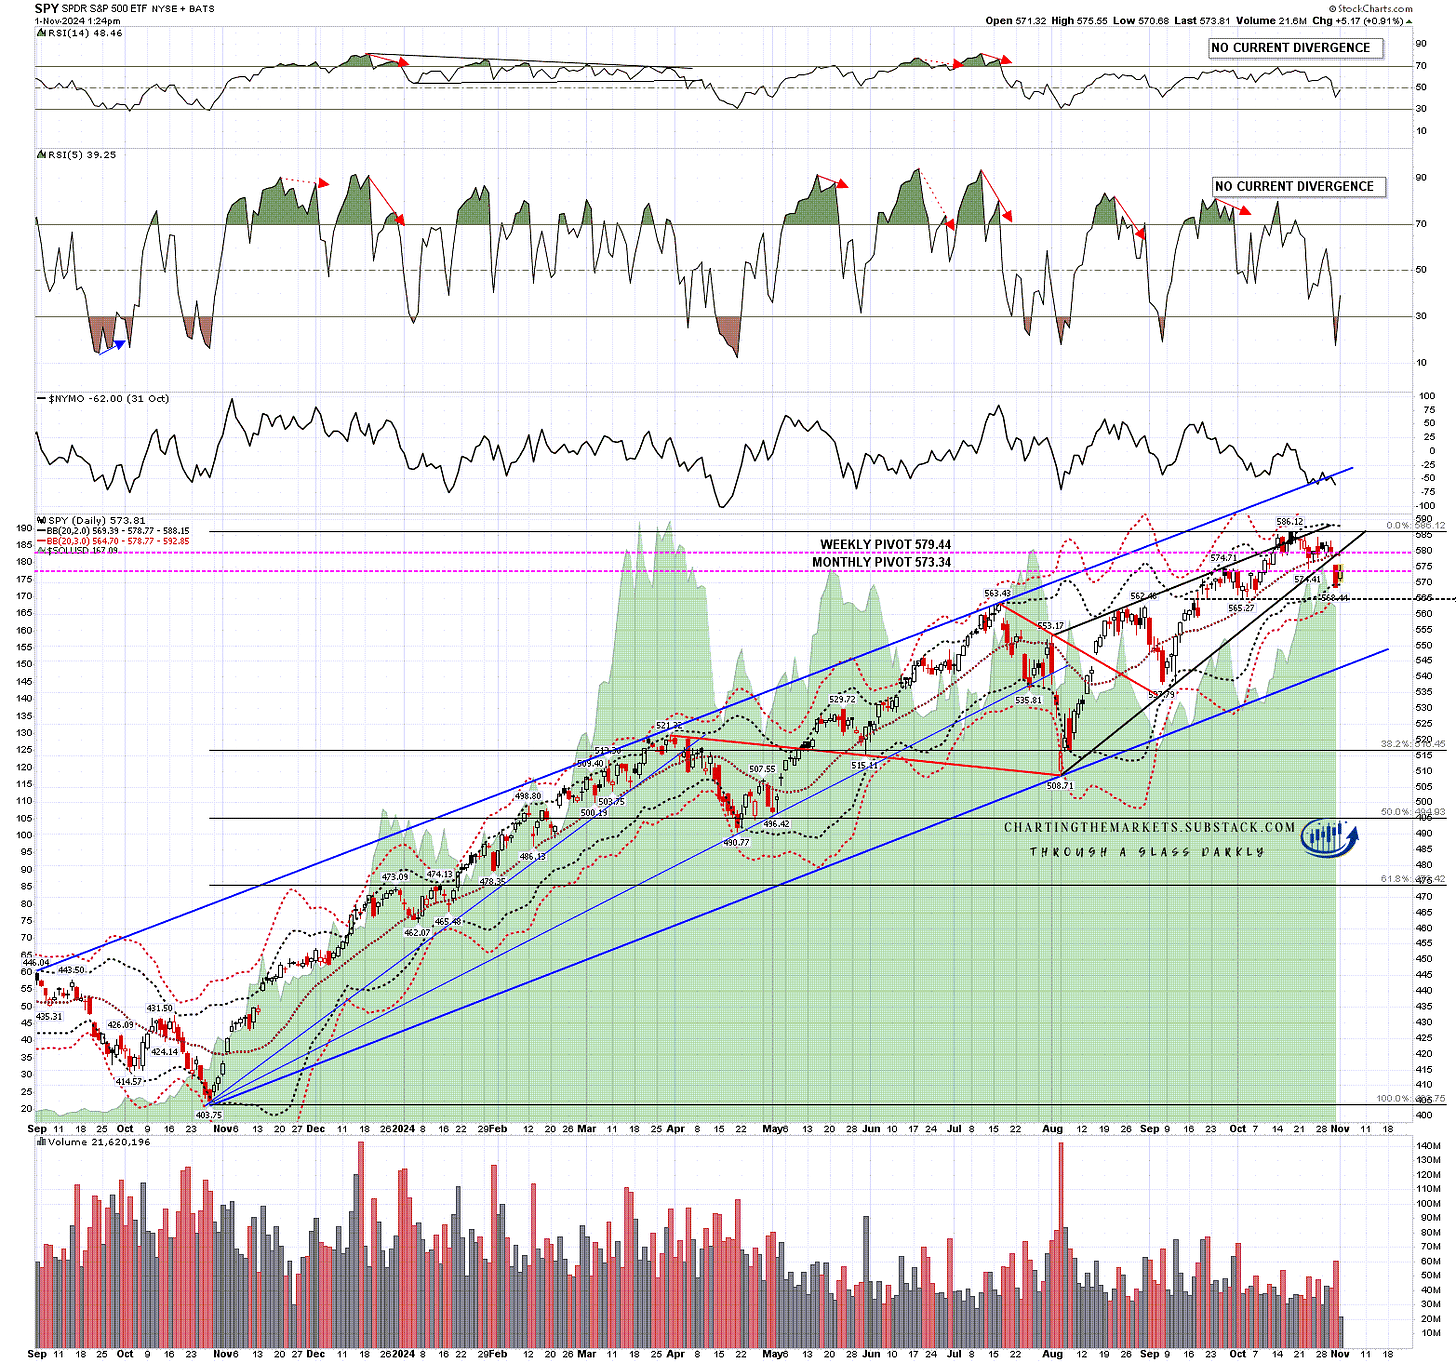
A similar picture on SPY of course, with the possible H&S right shoulder high in the 574/5 area and the daily middle band currently at 578.77.

SPY daily chart:

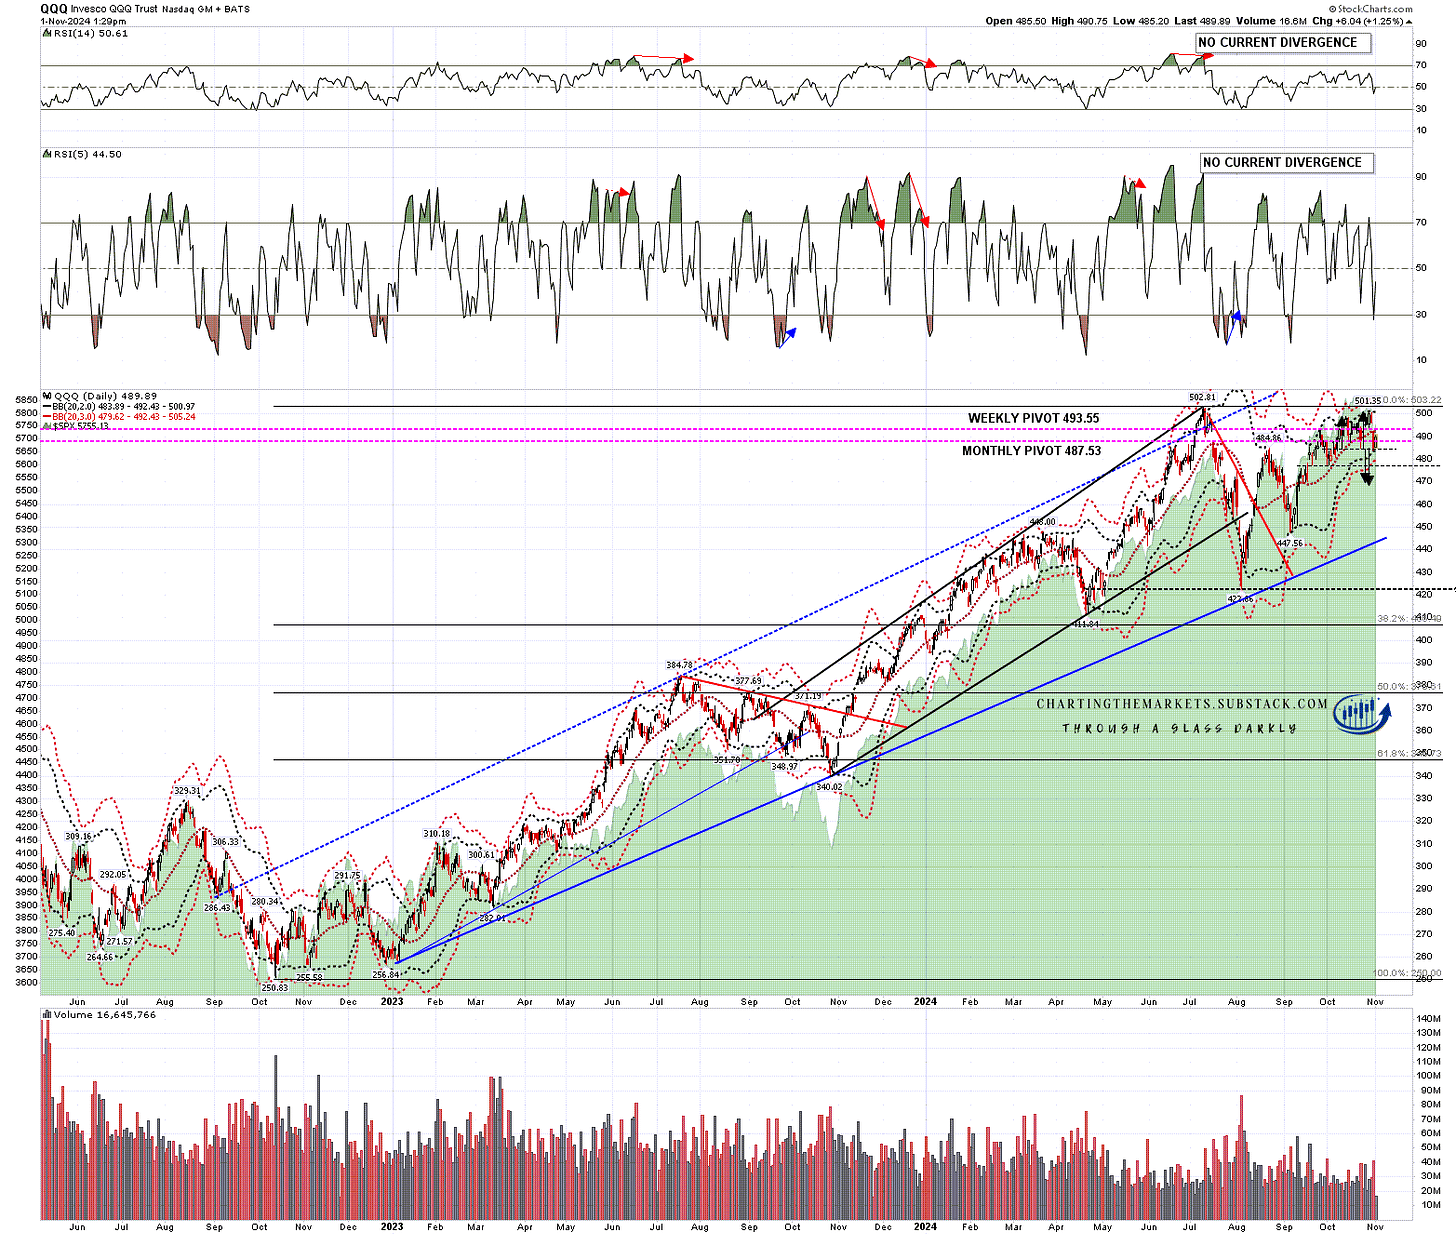
QQQ also gapped through support at the daily middle band and touched the daily lower band at the low. Main resistance is again at the daily middle band, currently at 492.43, and on the smaller picture the possible small double top that I mentioned earlier this week has broken down at the low yesterday with a target in the 470-2 area.

QQQ daily chart:

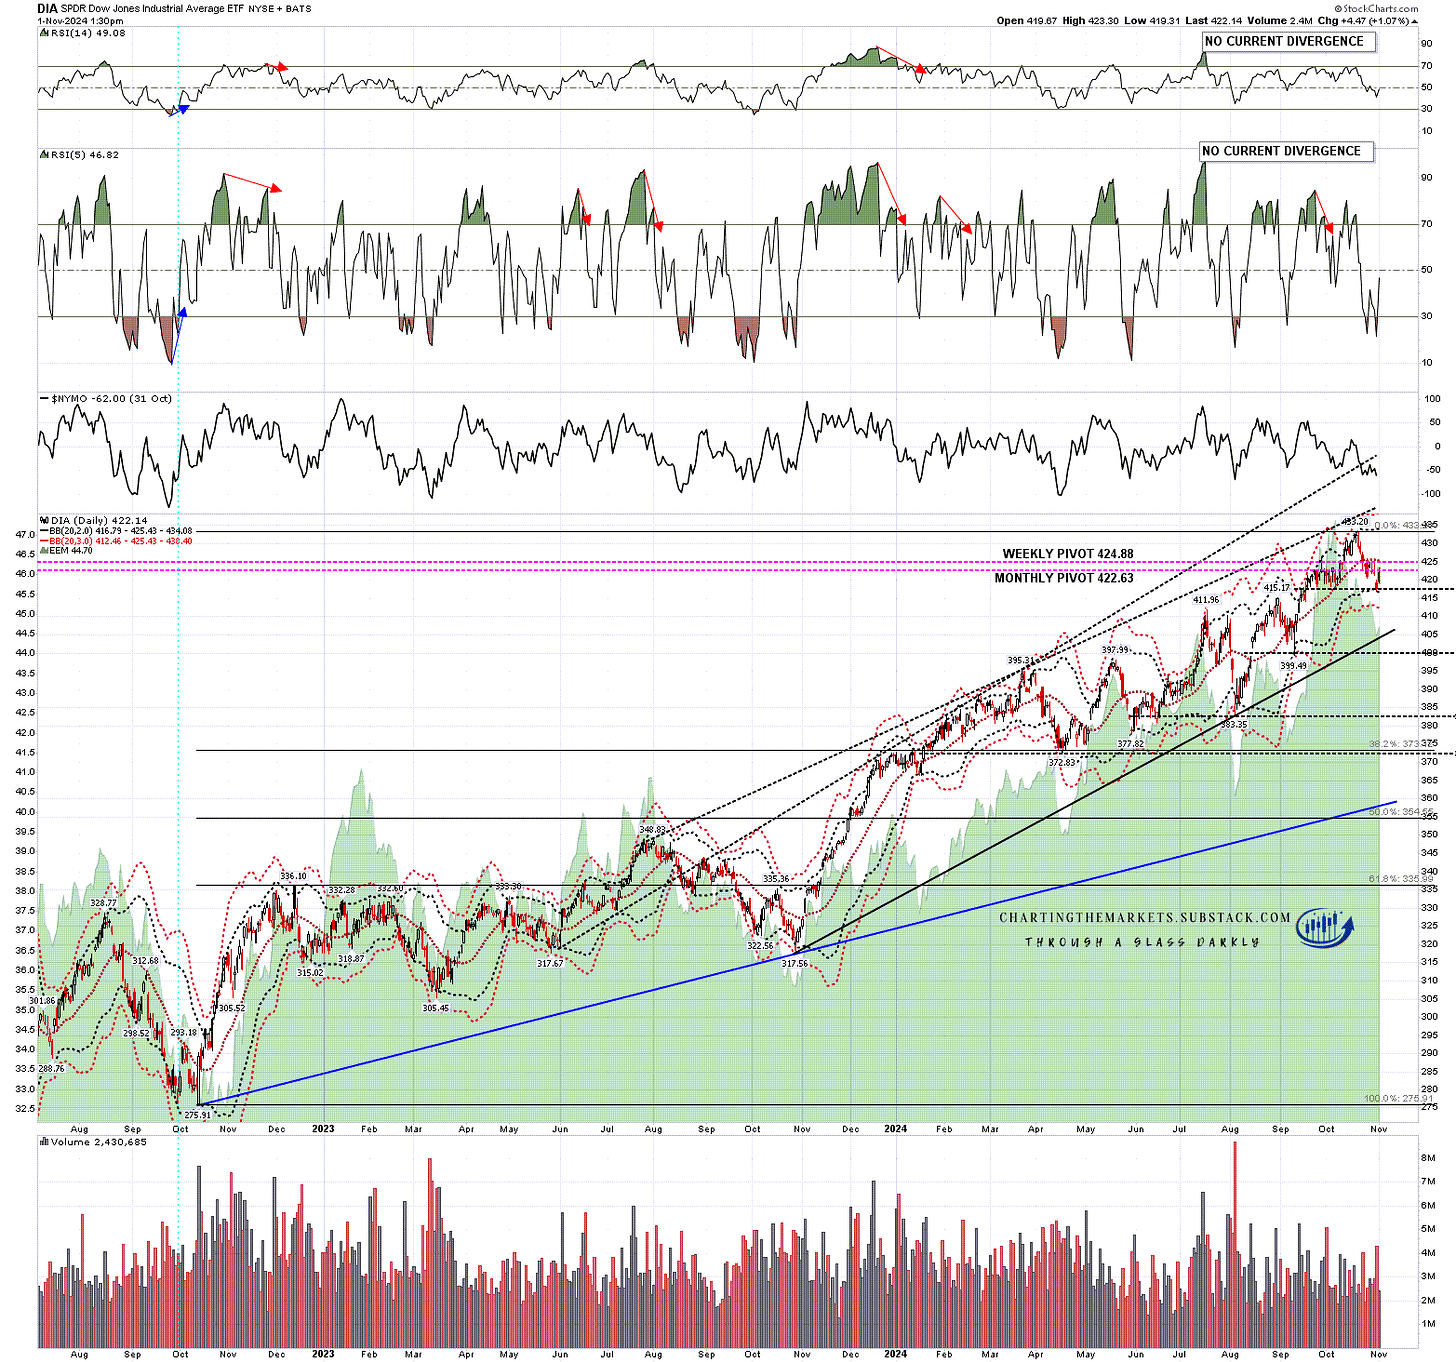
DIA broke back below the daily middle band at the close last week and has been below it all week. Again it touched the daily lower band at the low yesterday. As with SPX/SPY a possible H&S is forming, and the ideal right shoulder high would be in the 426 area. That is slightly above daily middle band resistance, currently at 425.43.

DIA daily chart:

IWM has been struggling to hold the daily middle band all this week until breaking down through it hard yesterday morning. As the bands are not as compressed on IWM as they are on the others, IWM failed to reach the daily lower band yesterday. Obvious resistance is at the daily middle band, currently at 220.98.
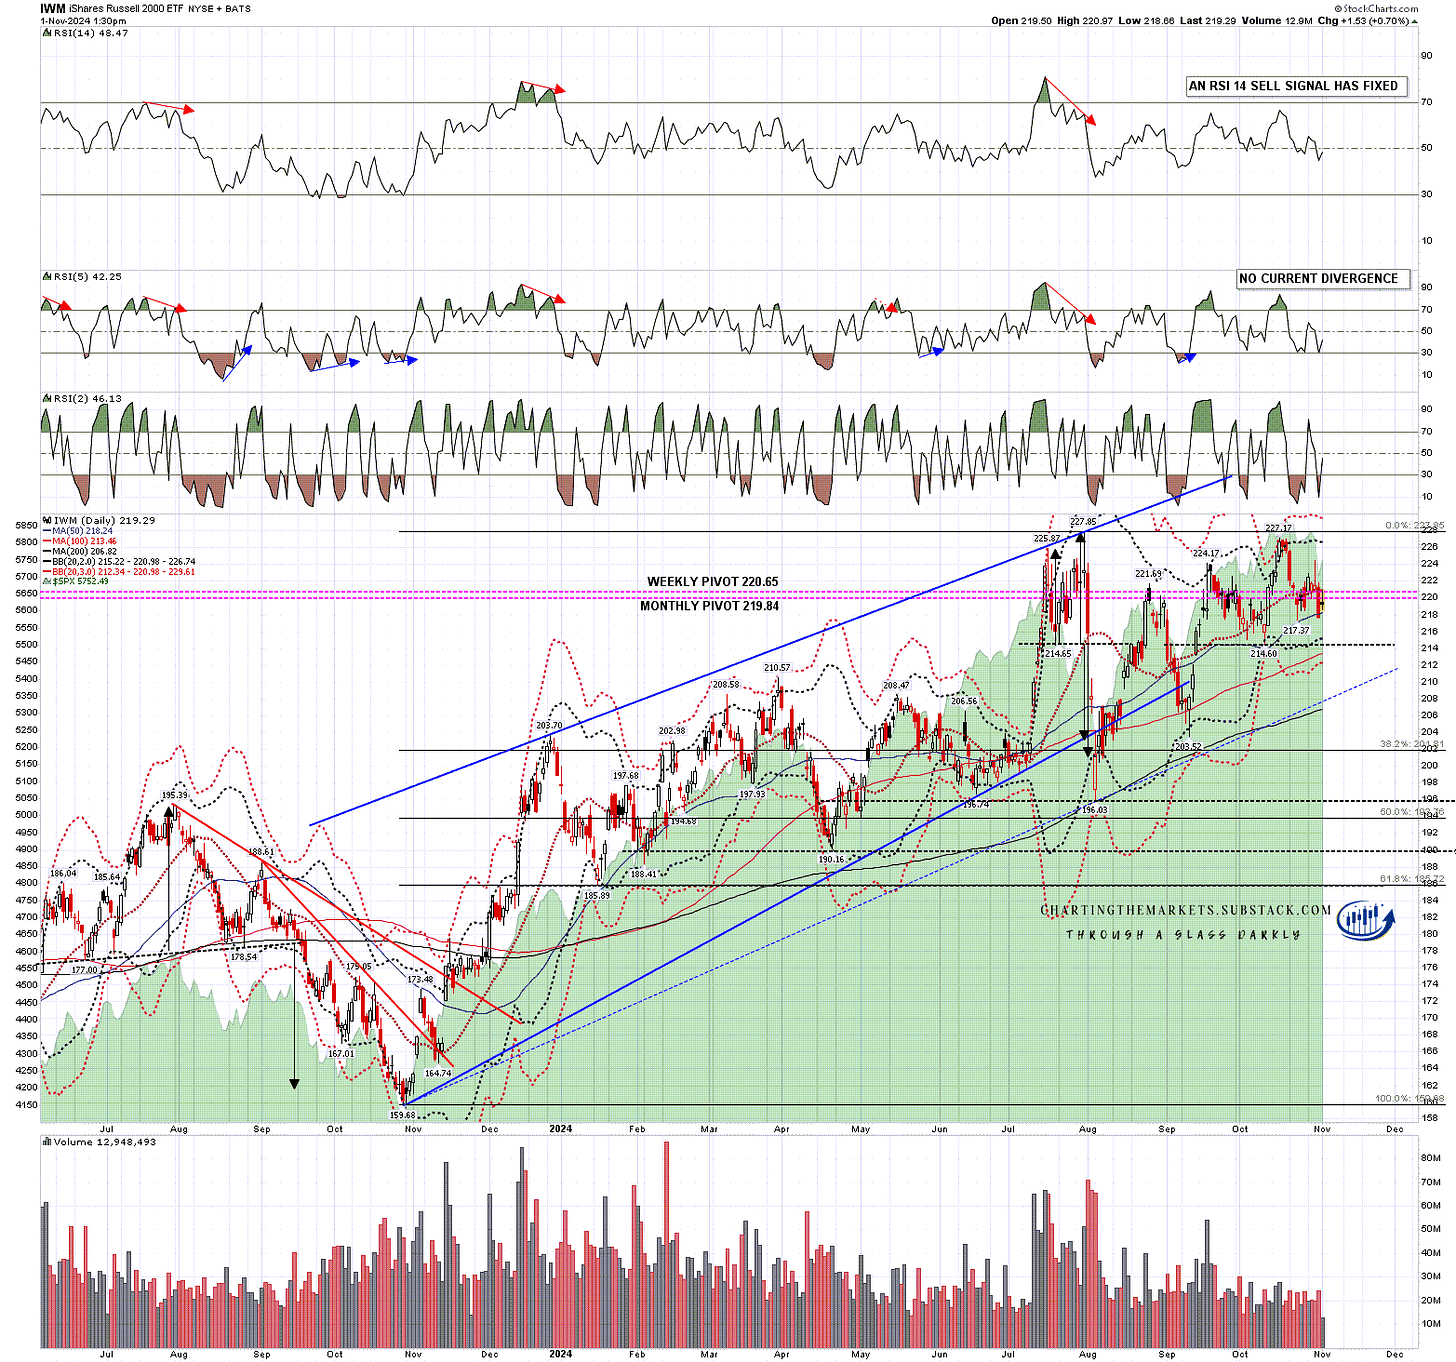
There is a fairly large possible double top formed on IWM and, on a sustained break below double top support at 214.60, the double top target range would be in the 202-205 area.

IWM daily chart:

Could this go considerably lower from here? Yes, though the seasonality isn’t supportive. I would note though that the daily bands are looking fairly pinched here and that as a result the lows yesterday, except on IWM, were not that far from the daily 3sd lower bands which tend to be very good support except in a major (and rare) decline generally seen with very bad news.

What this means is that I’d generally expect to see at least two or three days of consolidation under the daily middle bands to give time for the daily middle bands to turn down and the outer bands to expand before seeing a lot of follow through. On that basis there isn’t likely to be much further happening on the downside before Wednesday or Thursday next week and very possibly until the week after.

I’ll be doing a follow up post on Monday morning looking at all the topping setups formed or forming on these indices and we’ll see how that develops. Everyone have a great weekend. :-)

If you like my analysis and would like to see more, please take a free subscription at my chartingthemarkets substack, where I publish these posts first and do a short premarket review every morning.