It is the first day of the month today, and I’ve just used daily charts in the charts posted below, as these have all the new monthly pivots marked on them. I’ll also be posting the full list including all the futures I chart at my Substack at the weekend with all the new weekly pivots as well.
This is also really the first post of two. Today I’ll be looking at possible patterns forming and resistance levels, and on Monday morning I’ll be looking in detail at the possible topping patterns forming on the US equity indices in case we are going to be seeing significant further downside.
I’m still somewhat doubtful about seeing that. November is one of the most historically bullish months of the year and based on the daily closes in the last 68 years there are just five trading days in November that have closed green less than 50% of the time, and those five are all slightly north of 49%.
Have we seen big declines in Novembers in the past? Yes, and the last significantly red November was as recently as 2022, they’re just significantly rarer in November than in most other months of the year.
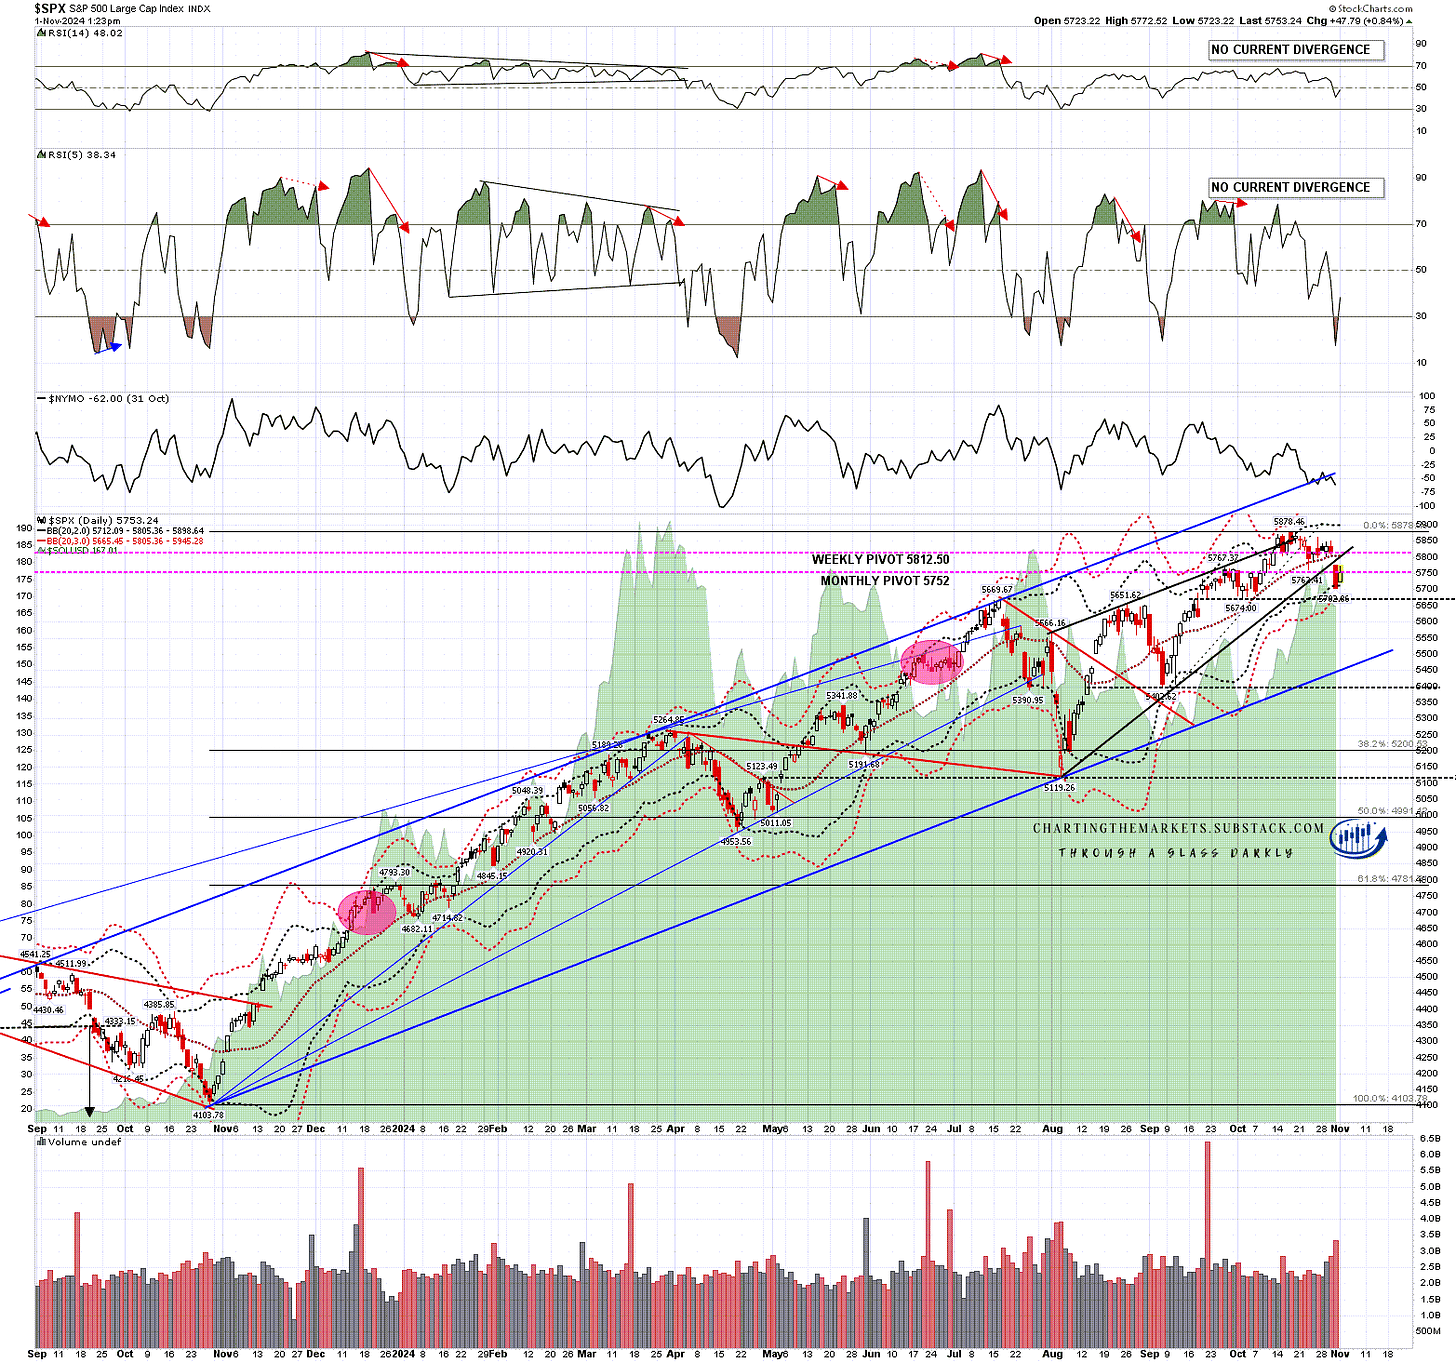
SPX gapped hard through the daily middle band and hit the daily lower band at the low. We’ve been seeing a relief rally today and the obvious areas to watch are the possible H&S right shoulder in the 5767 area, and broken support at the daily middle band, now in the 5805 area. A sustained break back over the daily middle band would suggest a retest of the all time high and very possible continuation higher.
SPX daily chart:
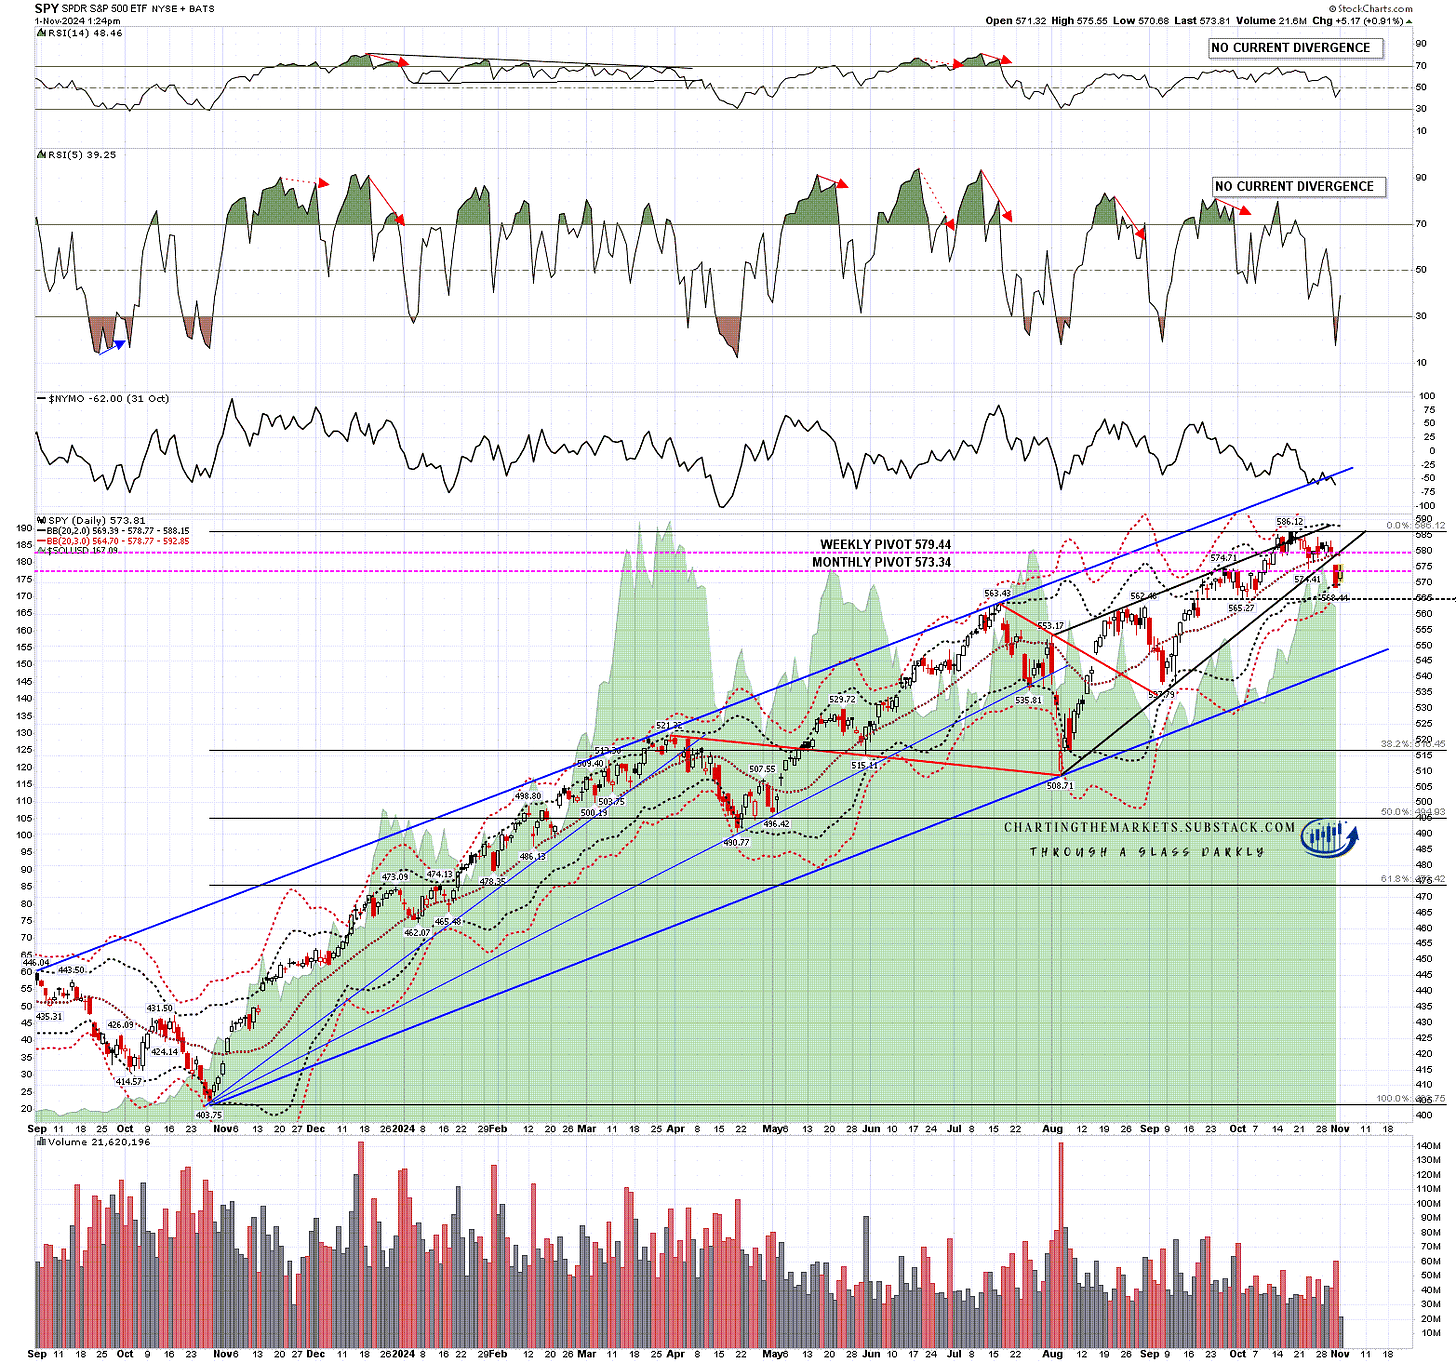
A similar picture on SPY of course, with the possible H&S right shoulder high in the 574/5 area and the daily middle band currently at 578.77.
SPY daily chart:
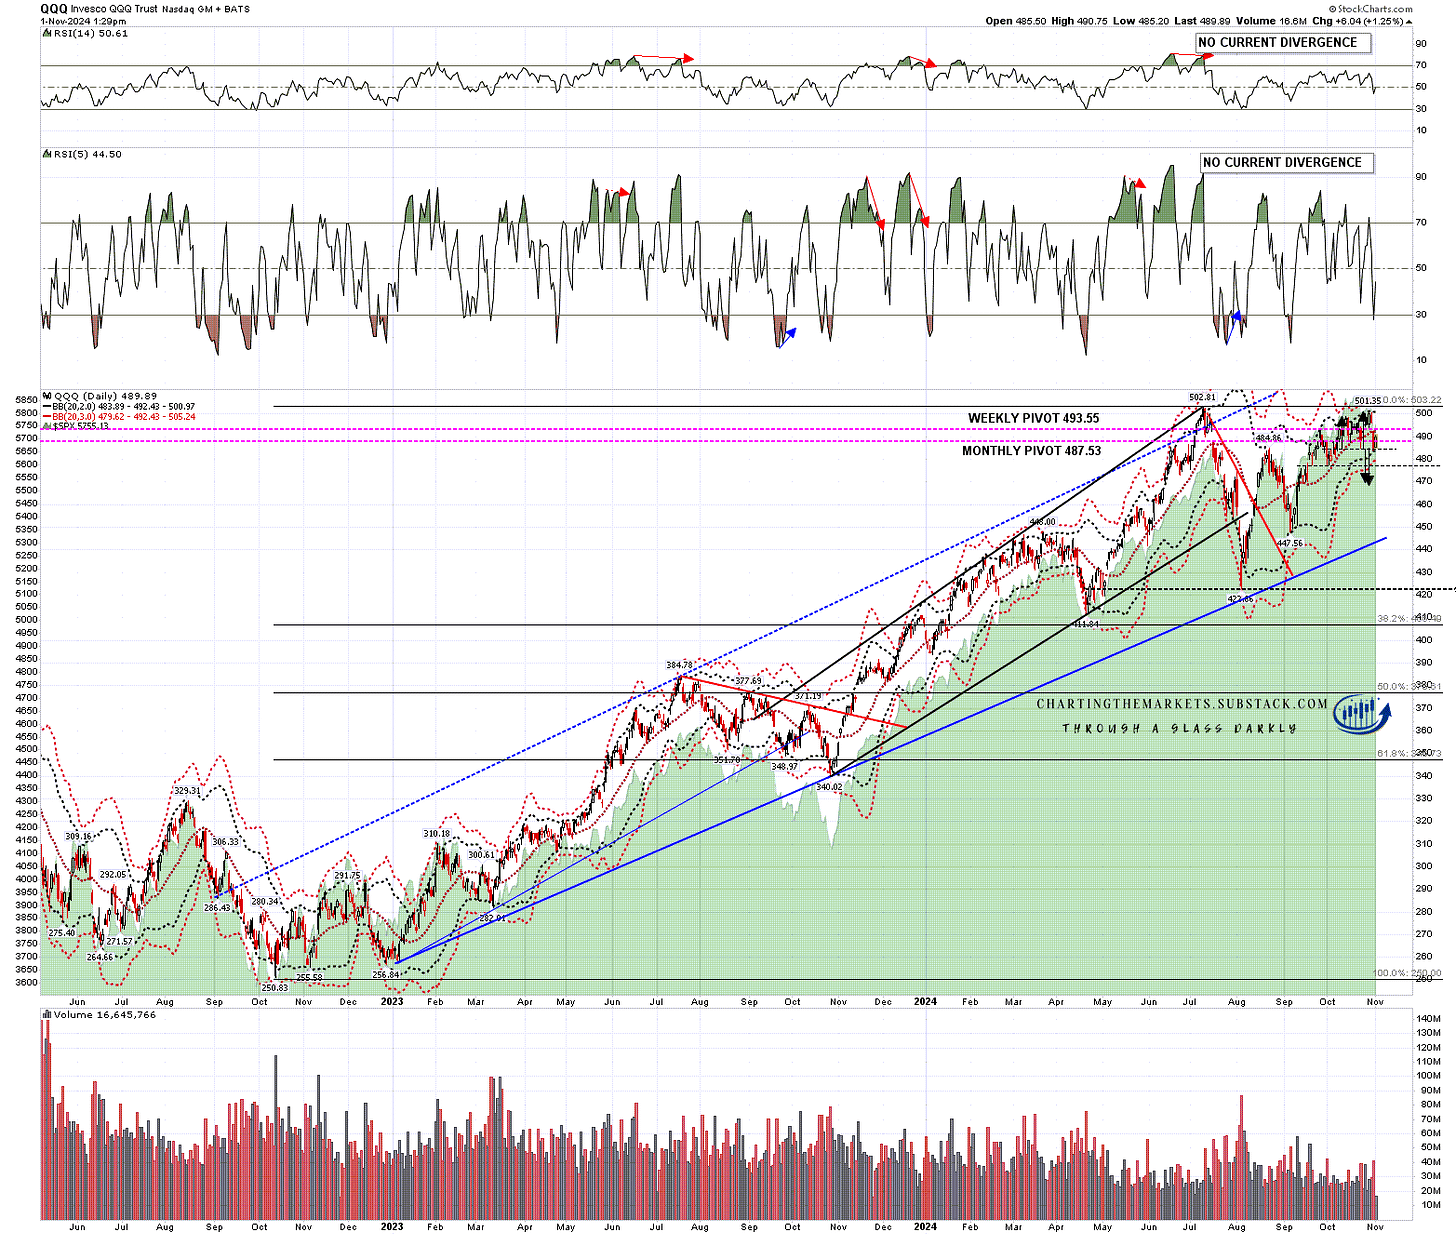
QQQ also gapped through support at the daily middle band and touched the daily lower band at the low. Main resistance is again at the daily middle band, currently at 492.43, and on the smaller picture the possible small double top that I mentioned earlier this week has broken down at the low yesterday with a target in the 470-2 area.
QQQ daily chart:
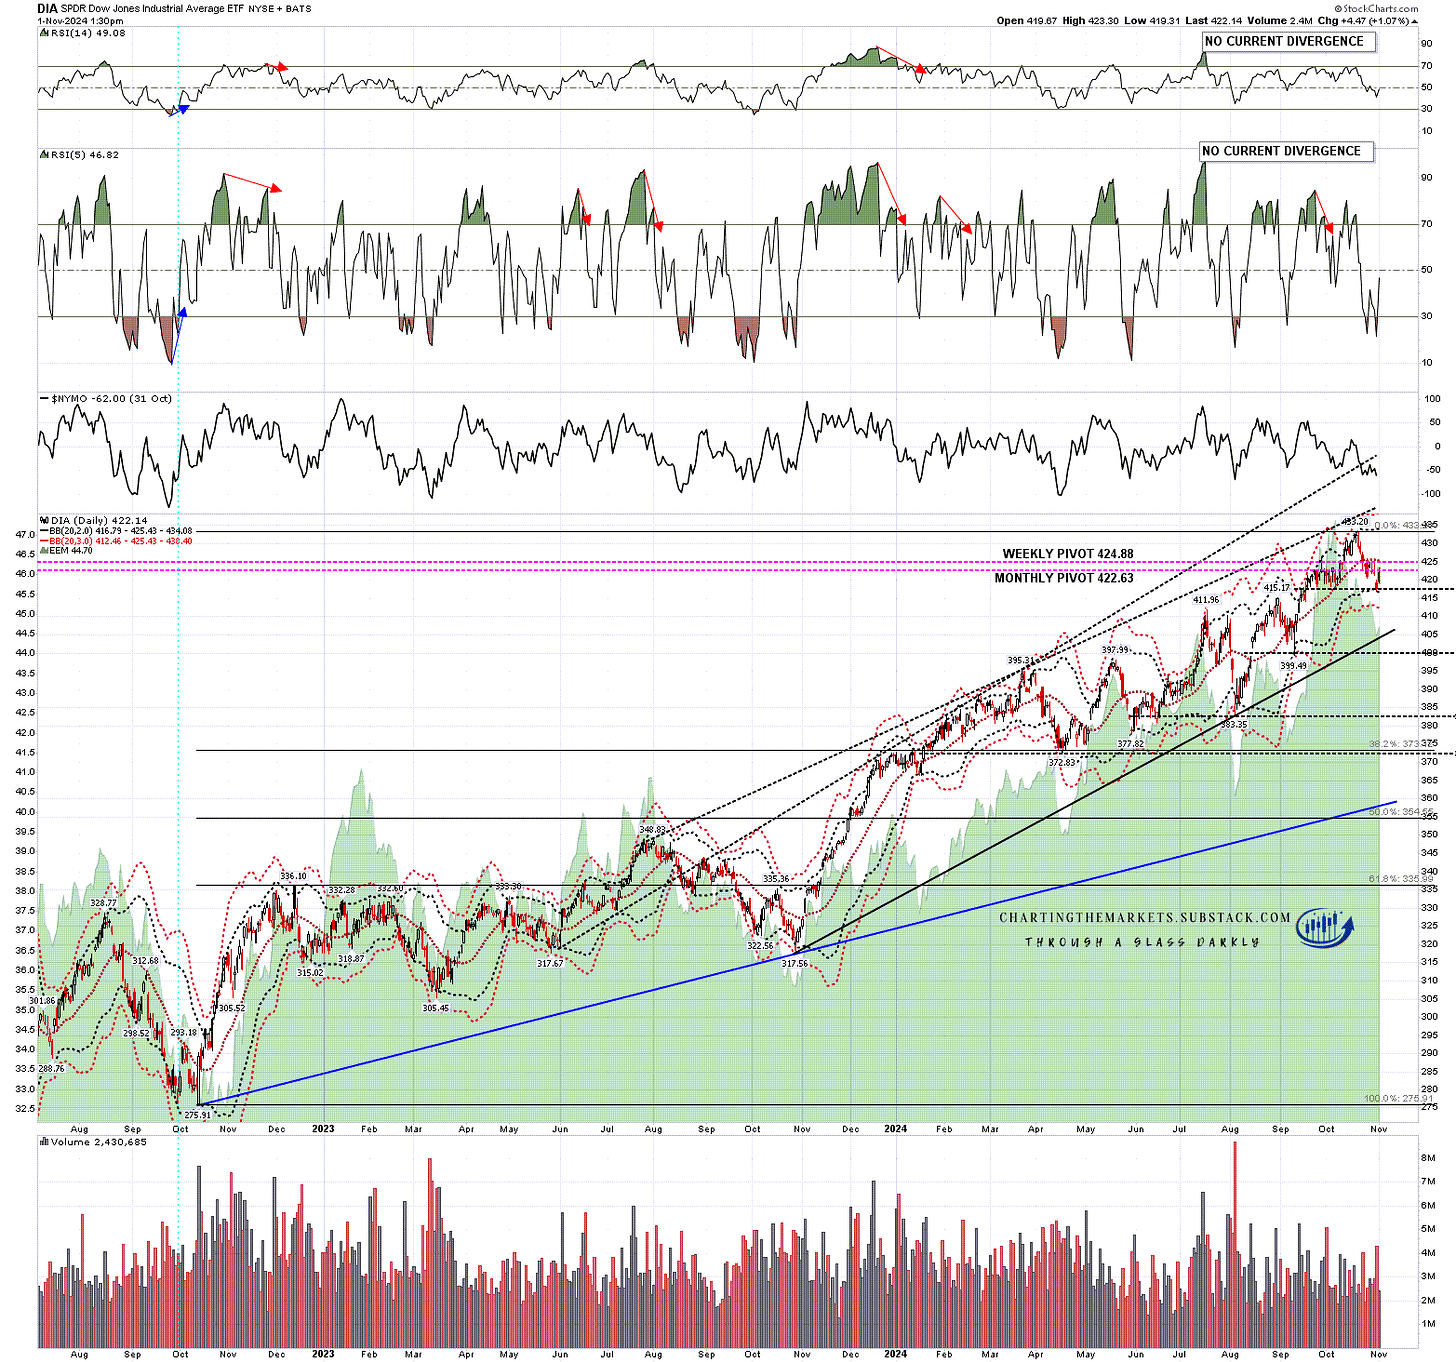
DIA broke back below the daily middle band at the close last week and has been below it all week. Again it touched the daily lower band at the low yesterday. As with SPX/SPY a possible H&S is forming, and the ideal right shoulder high would be in the 426 area. That is slightly above daily middle band resistance, currently at 425.43.
DIA daily chart:
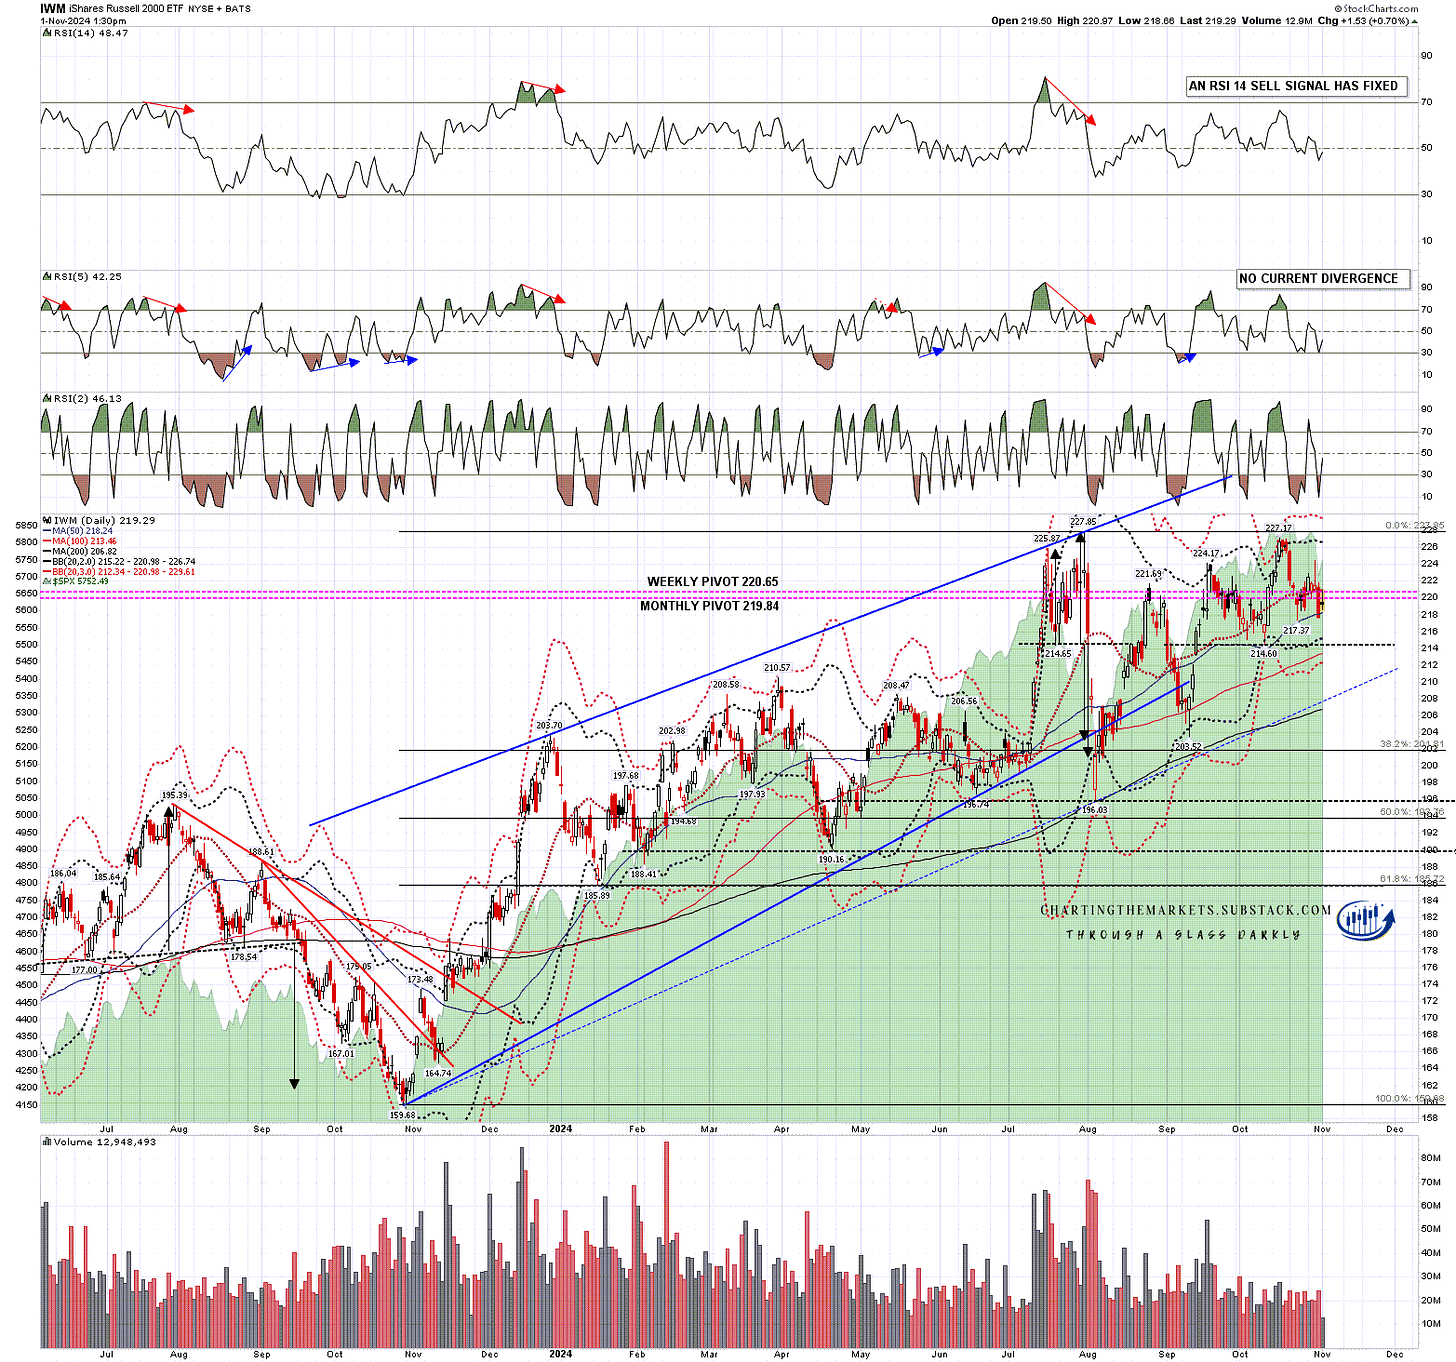
IWM has been struggling to hold the daily middle band all this week until breaking down through it hard yesterday morning. As the bands are not as compressed on IWM as they are on the others, IWM failed to reach the daily lower band yesterday. Obvious resistance is at the daily middle band, currently at 220.98.
There is a fairly large possible double top formed on IWM and, on a sustained break below double top support at 214.60, the double top target range would be in the 202-205 area.
IWM daily chart:
Could this go considerably lower from here? Yes, though the seasonality isn’t supportive. I would note though that the daily bands are looking fairly pinched here and that as a result the lows yesterday, except on IWM, were not that far from the daily 3sd lower bands which tend to be very good support except in a major (and rare) decline generally seen with very bad news.
What this means is that I’d generally expect to see at least two or three days of consolidation under the daily middle bands to give time for the daily middle bands to turn down and the outer bands to expand before seeing a lot of follow through. On that basis there isn’t likely to be much further happening on the downside before Wednesday or Thursday next week and very possibly until the week after.
I’ll be doing a follow up post on Monday morning looking at all the topping setups formed or forming on these indices and we’ll see how that develops. Everyone have a great weekend. :-)
If you like my analysis and would like to see more, please take a free subscription at my chartingthemarkets substack, where I publish these posts first and do a short premarket review every morning.

No comments:
Post a Comment