It’s election day today and that is one of the two big news events this week that we are aware of, the other being the Fed decision on interest rates. There is a possible setup here for a substantial decline and also for a high retest and when that news is in we may well be see one or the other.
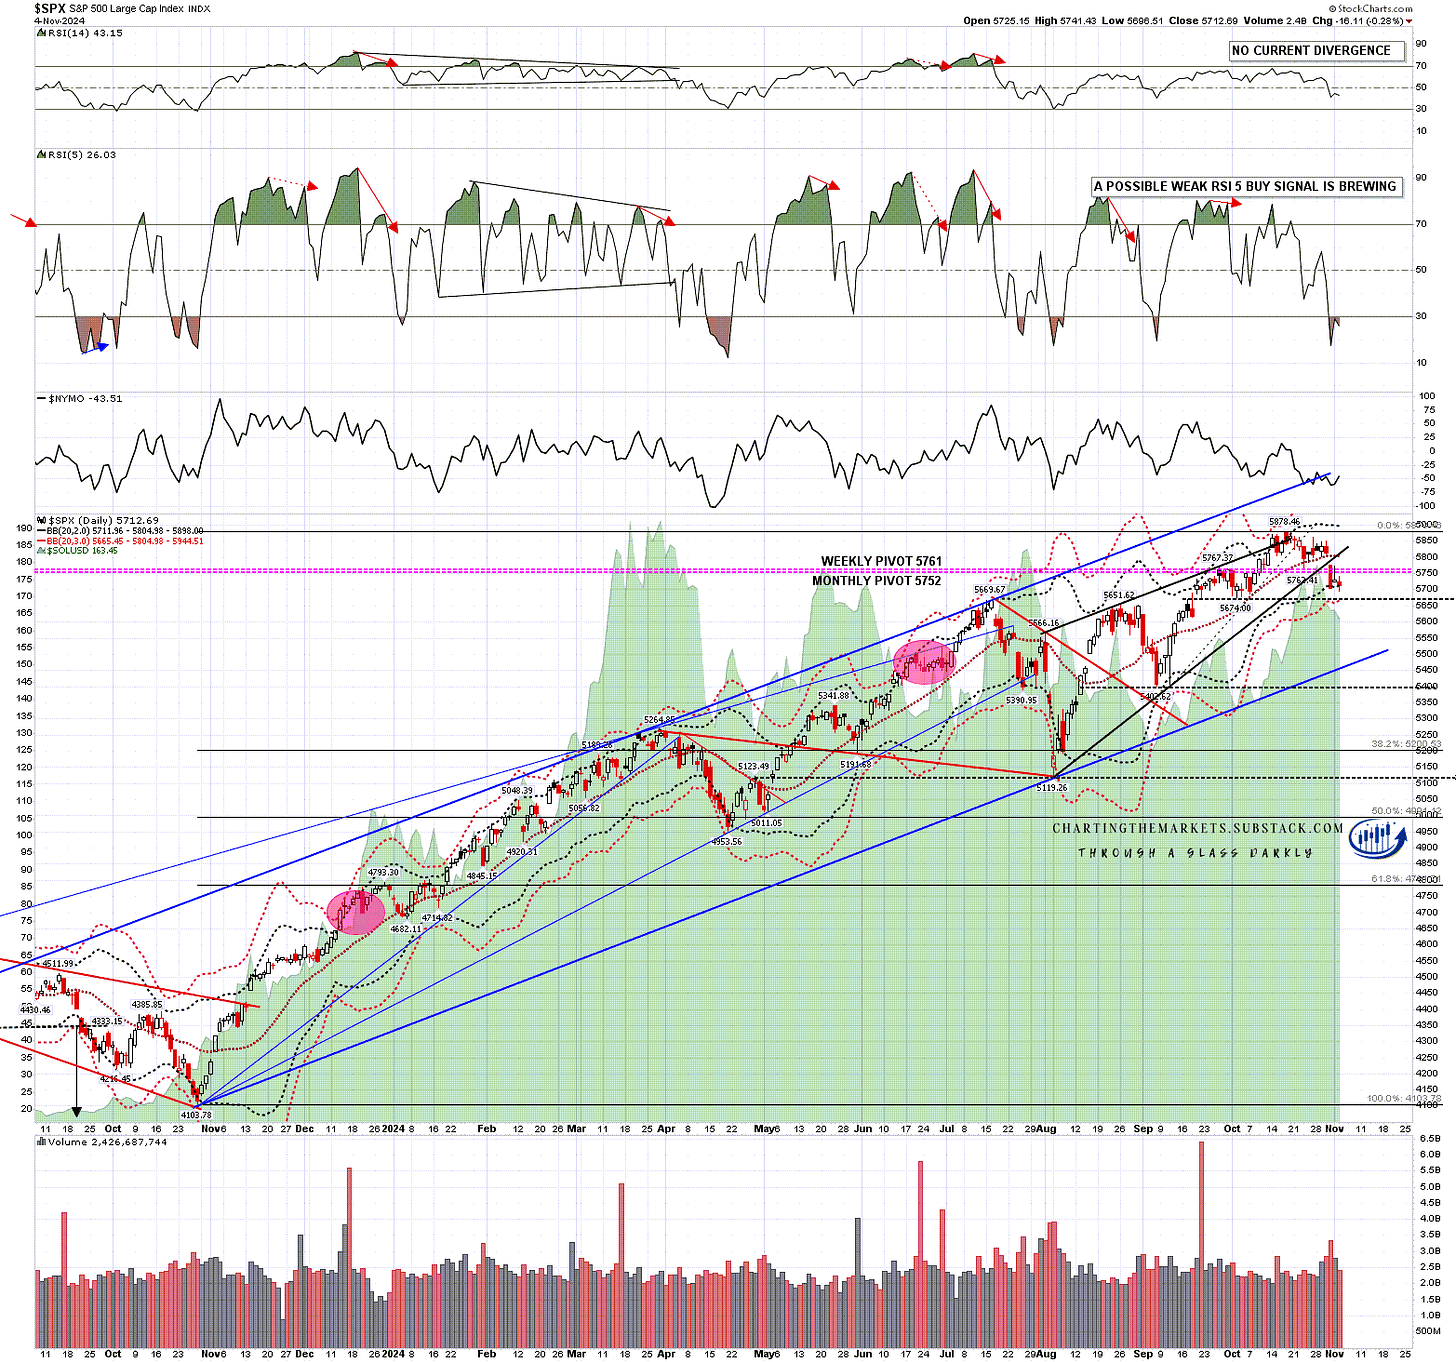
In terms of the high retest, the retest of the low yesterday set a possible daily RSI 5 buy signal brewing on SPX. If that fixes that could support a high retest from here.
SPX daily BBs chart:
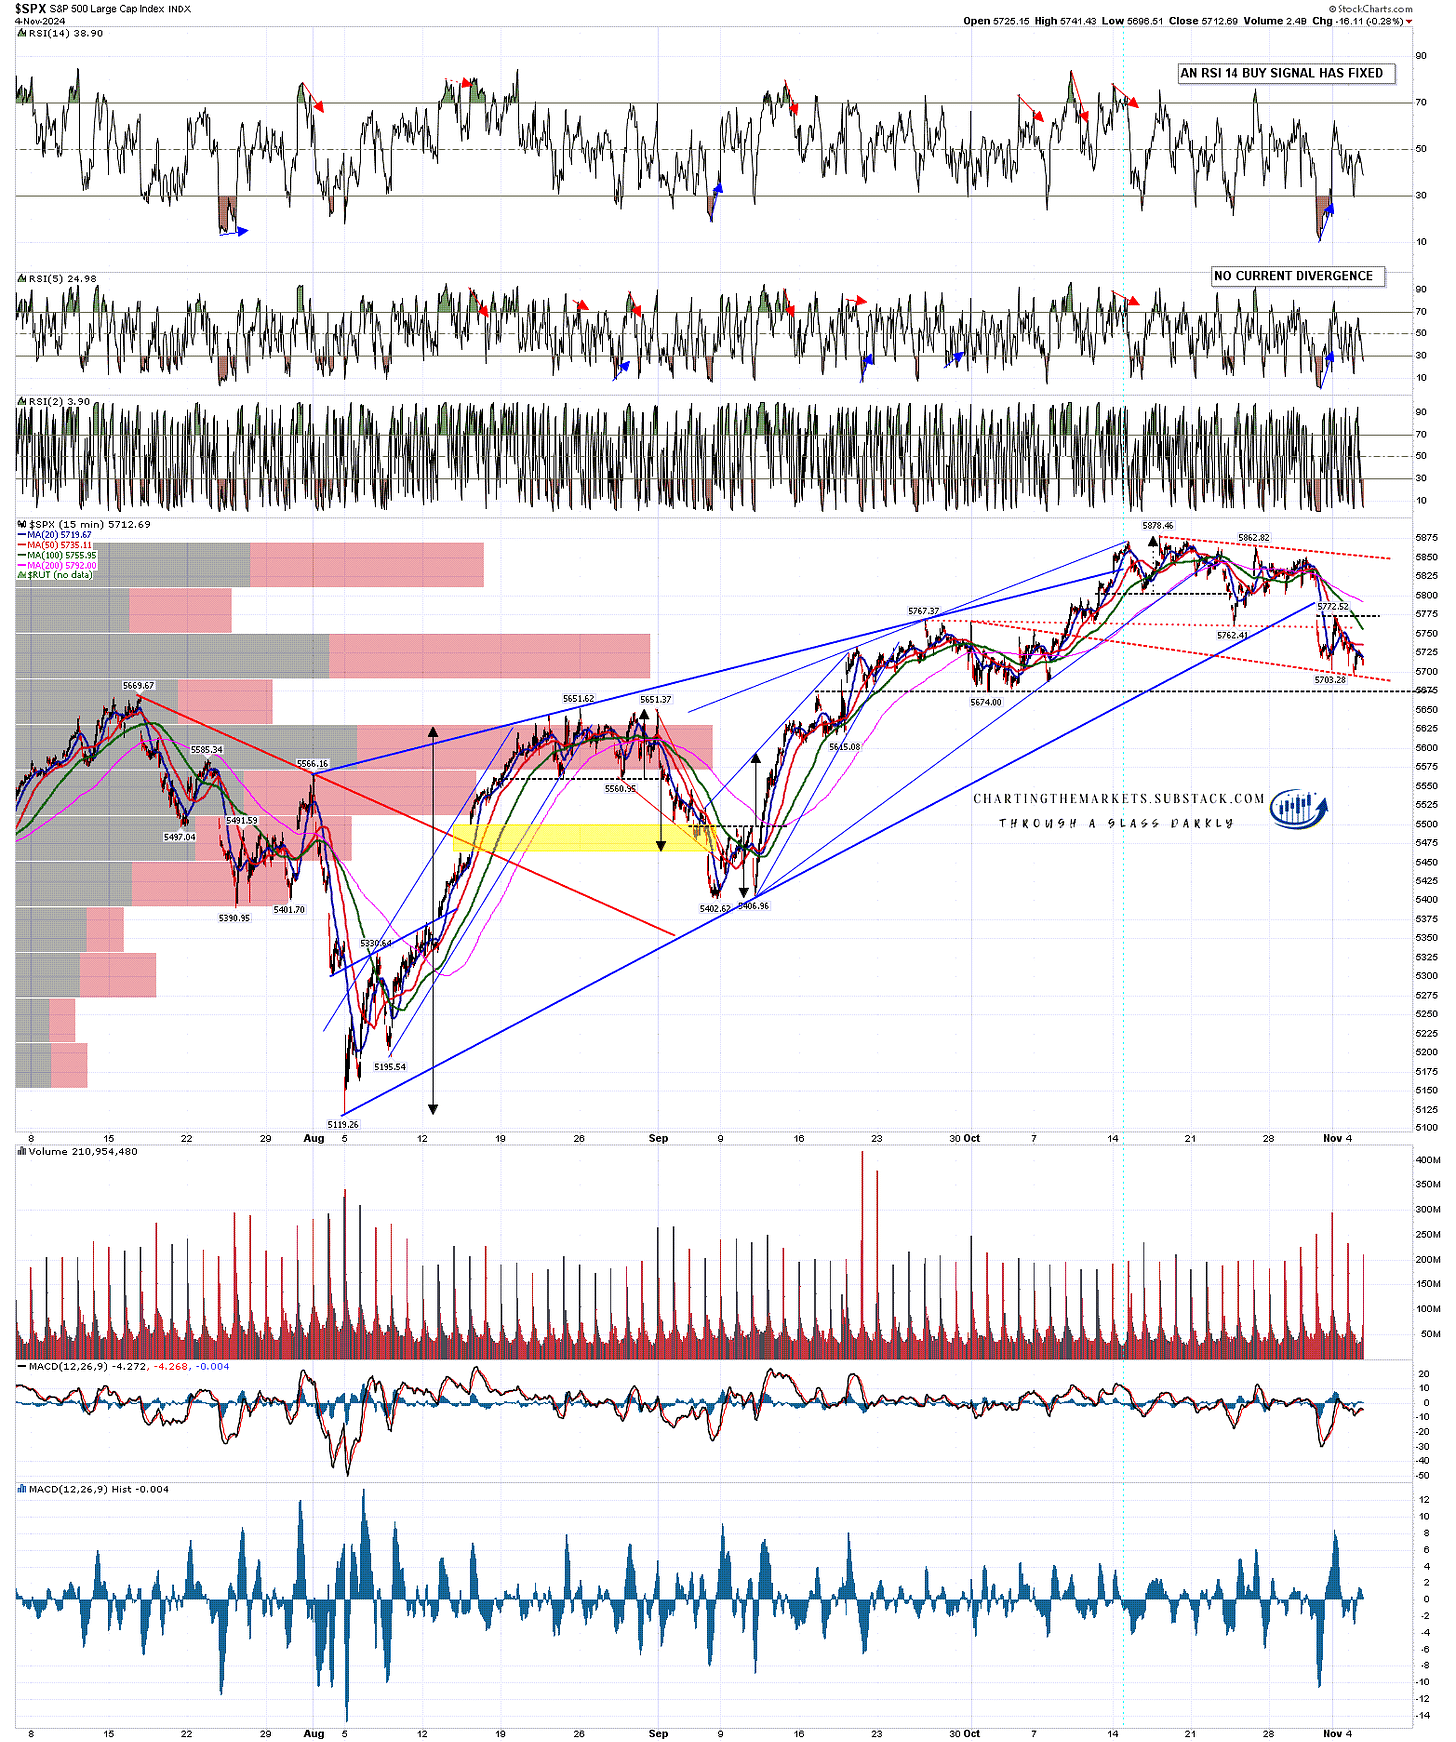
On the 15min chart there may still be an H&S forming as I was looking at last week.
On the bull side though, there is also a decent looking bull flag pattern forming here that retested flag support at the low yesterday. That could be setting up a high retest.
There is also a small double bottom in place on SPX that on a sustained break over 5772.5 would look for the 5845 area. That would take SPX back to the bull flag resistance trendline, currently in the 5850 area.
SPX 15min chart:
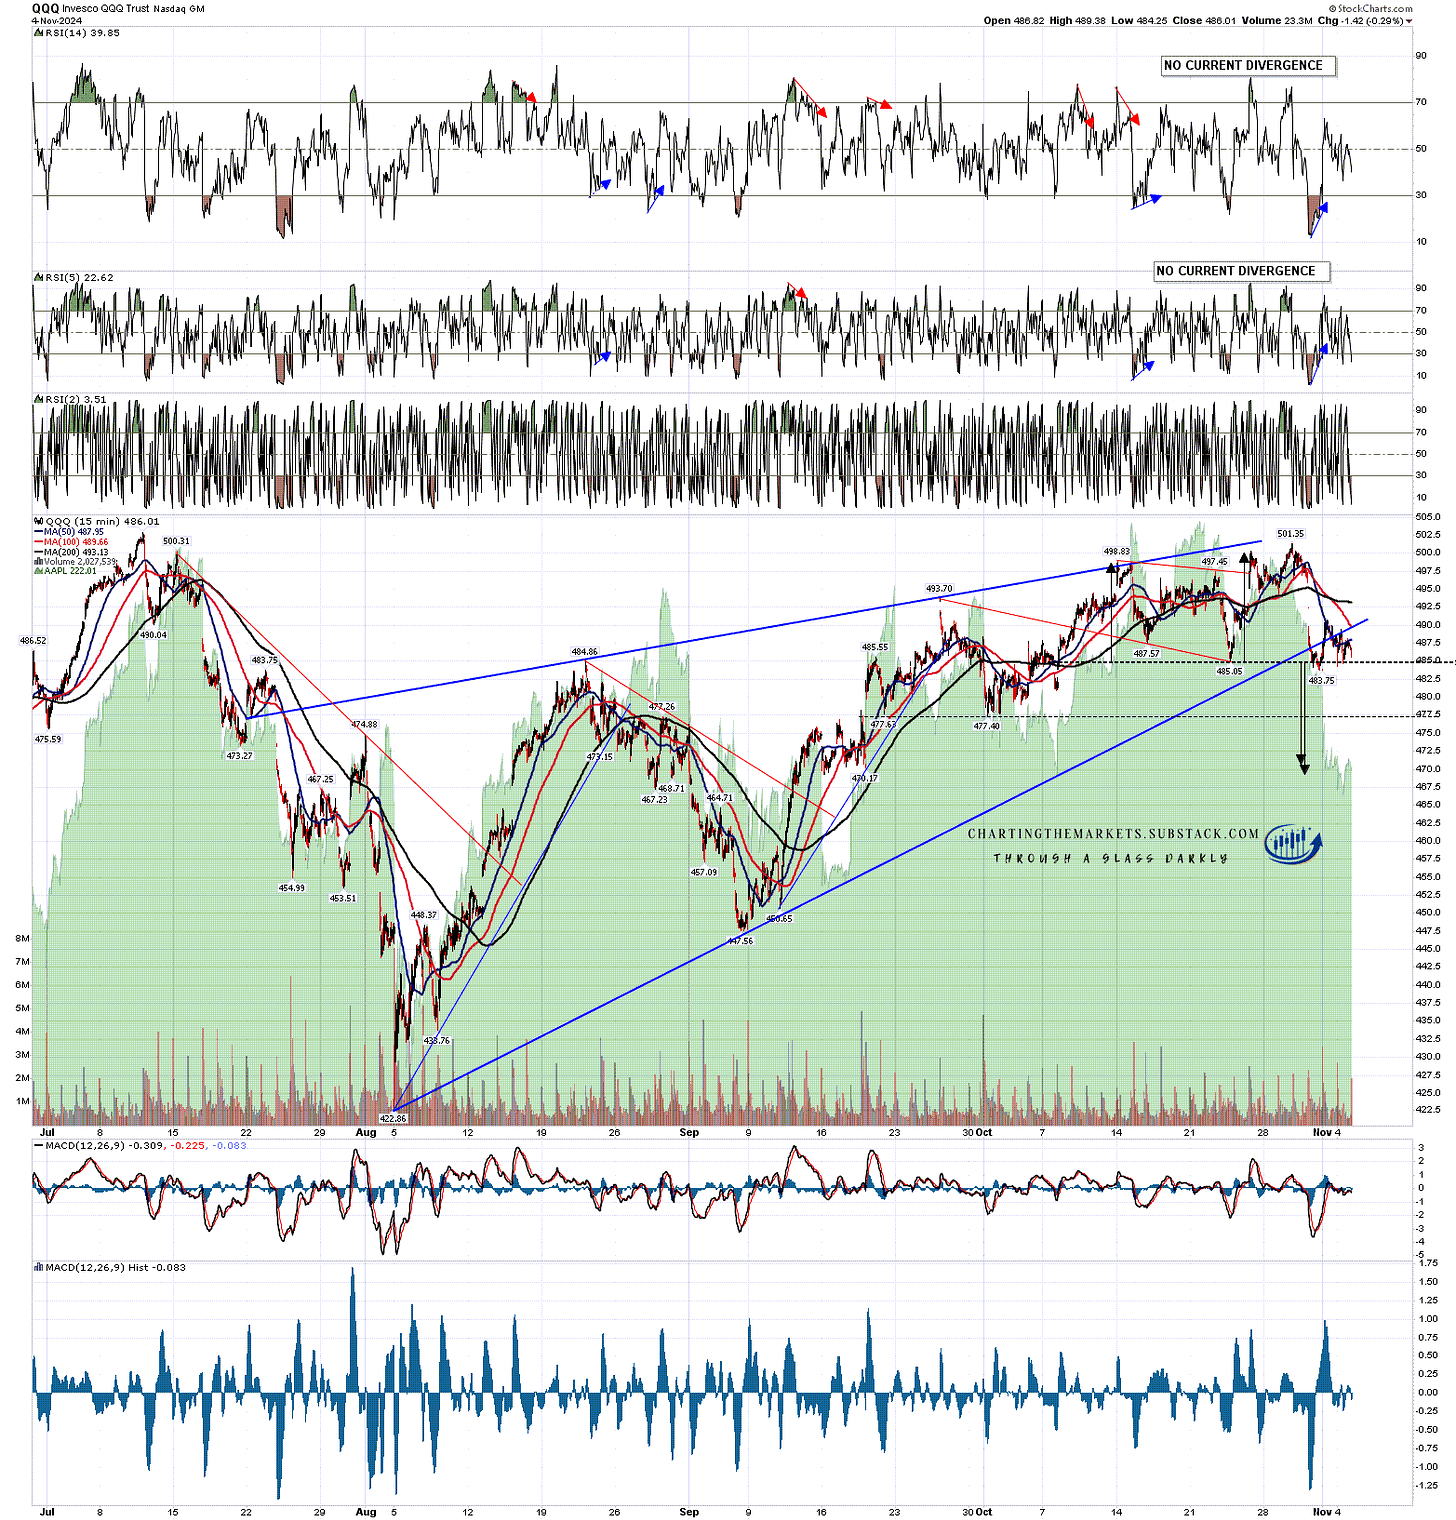
On the Qs a modest double top has broken down with a target in the 469.5 to 471 area. That may well deliver but, if it doesn’t, a rejection back up would look for a retest of the high at 501.35.
QQQ 15min chart:
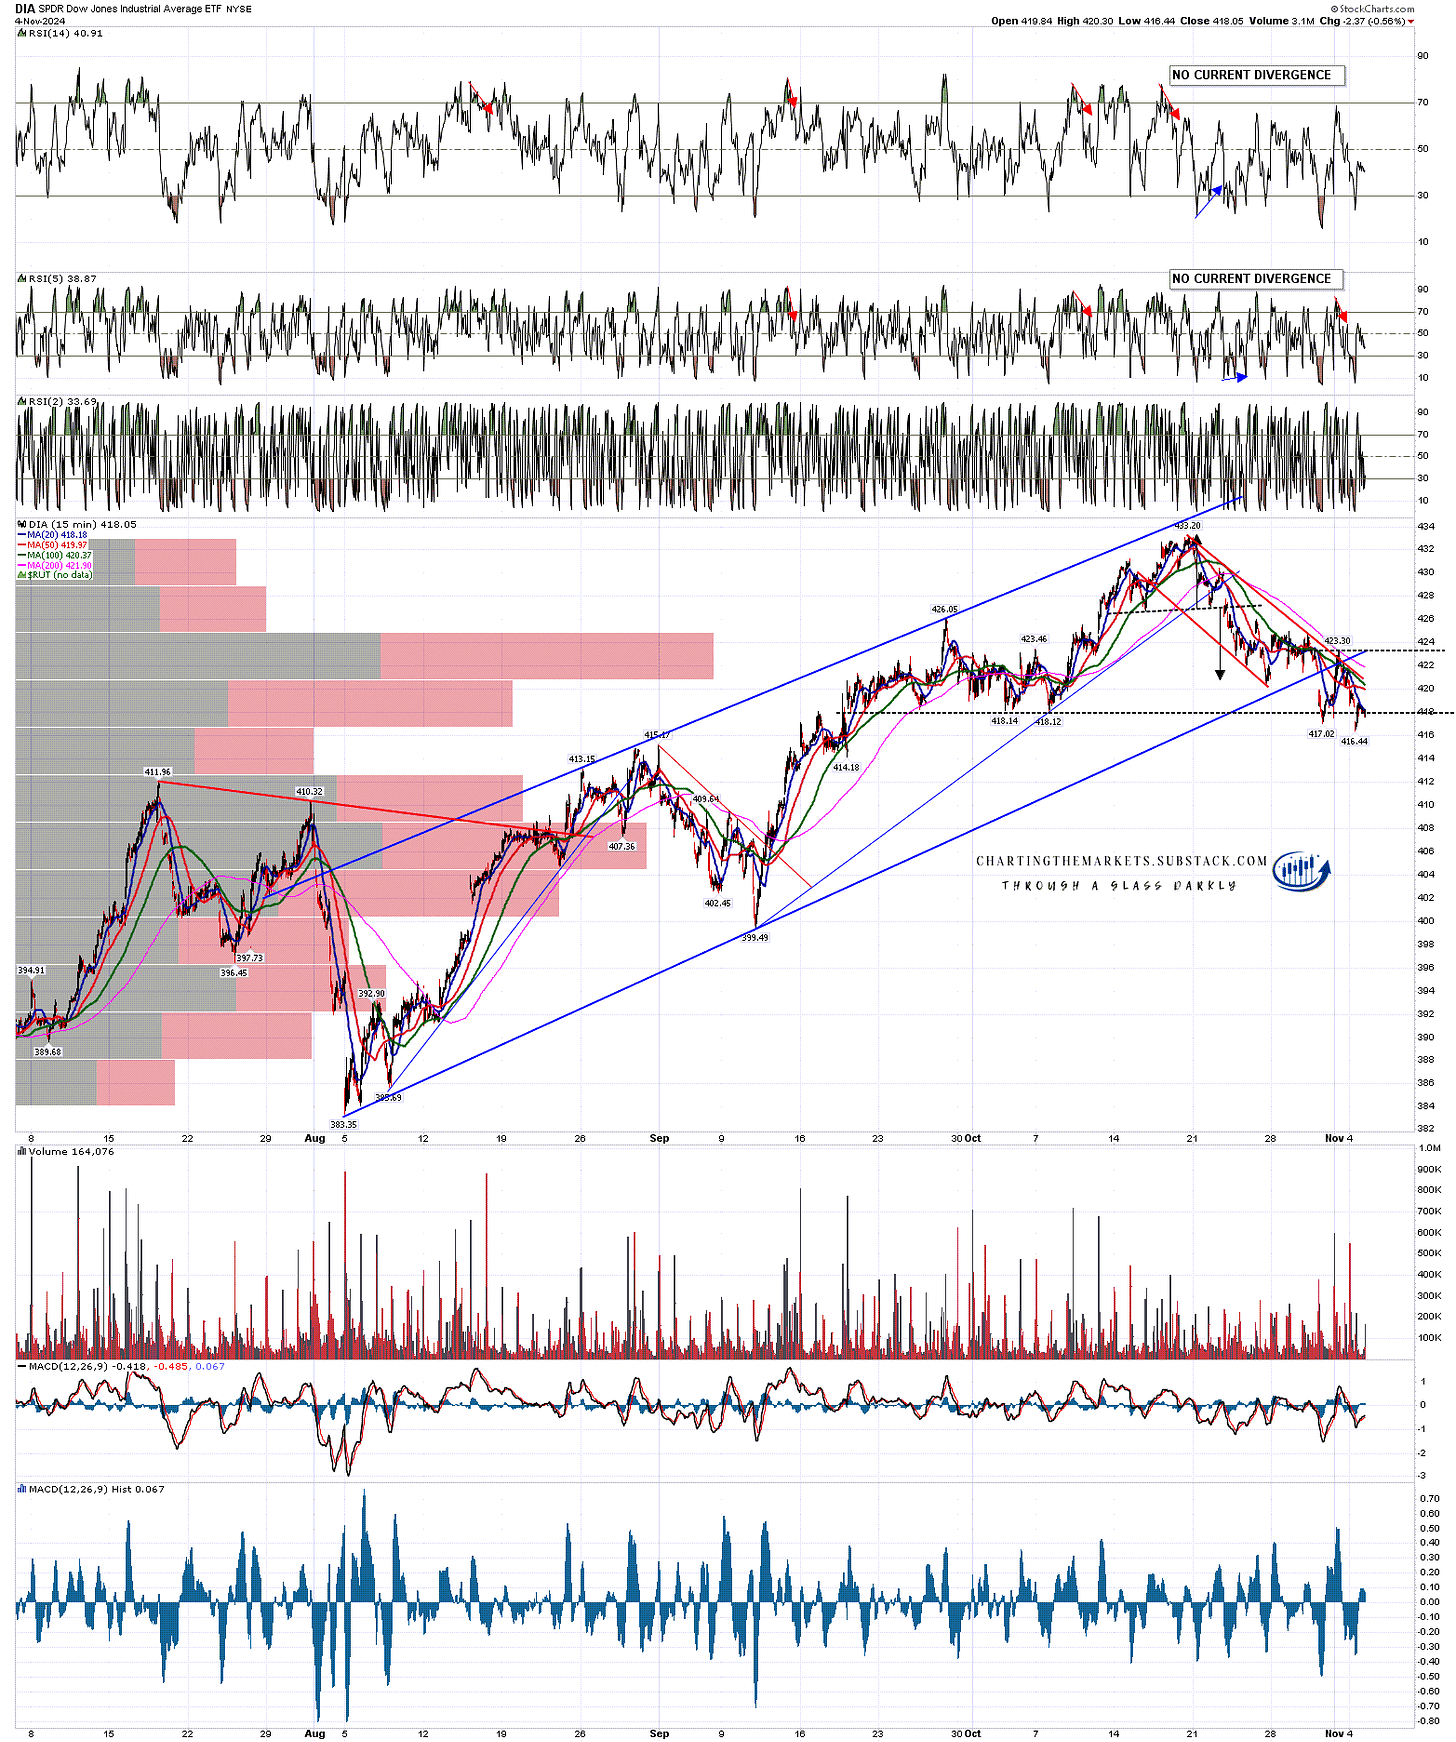
On DIA an H&S may be forming and could have already formed and broken down, though the pattern would look very light on the right shoulder. A possible small double bottom has also formed though that on a sustained break over 423.30 would look for the 429.60 to 430.2 area. Not a full high retest but getting close.
DIA 15min chart:
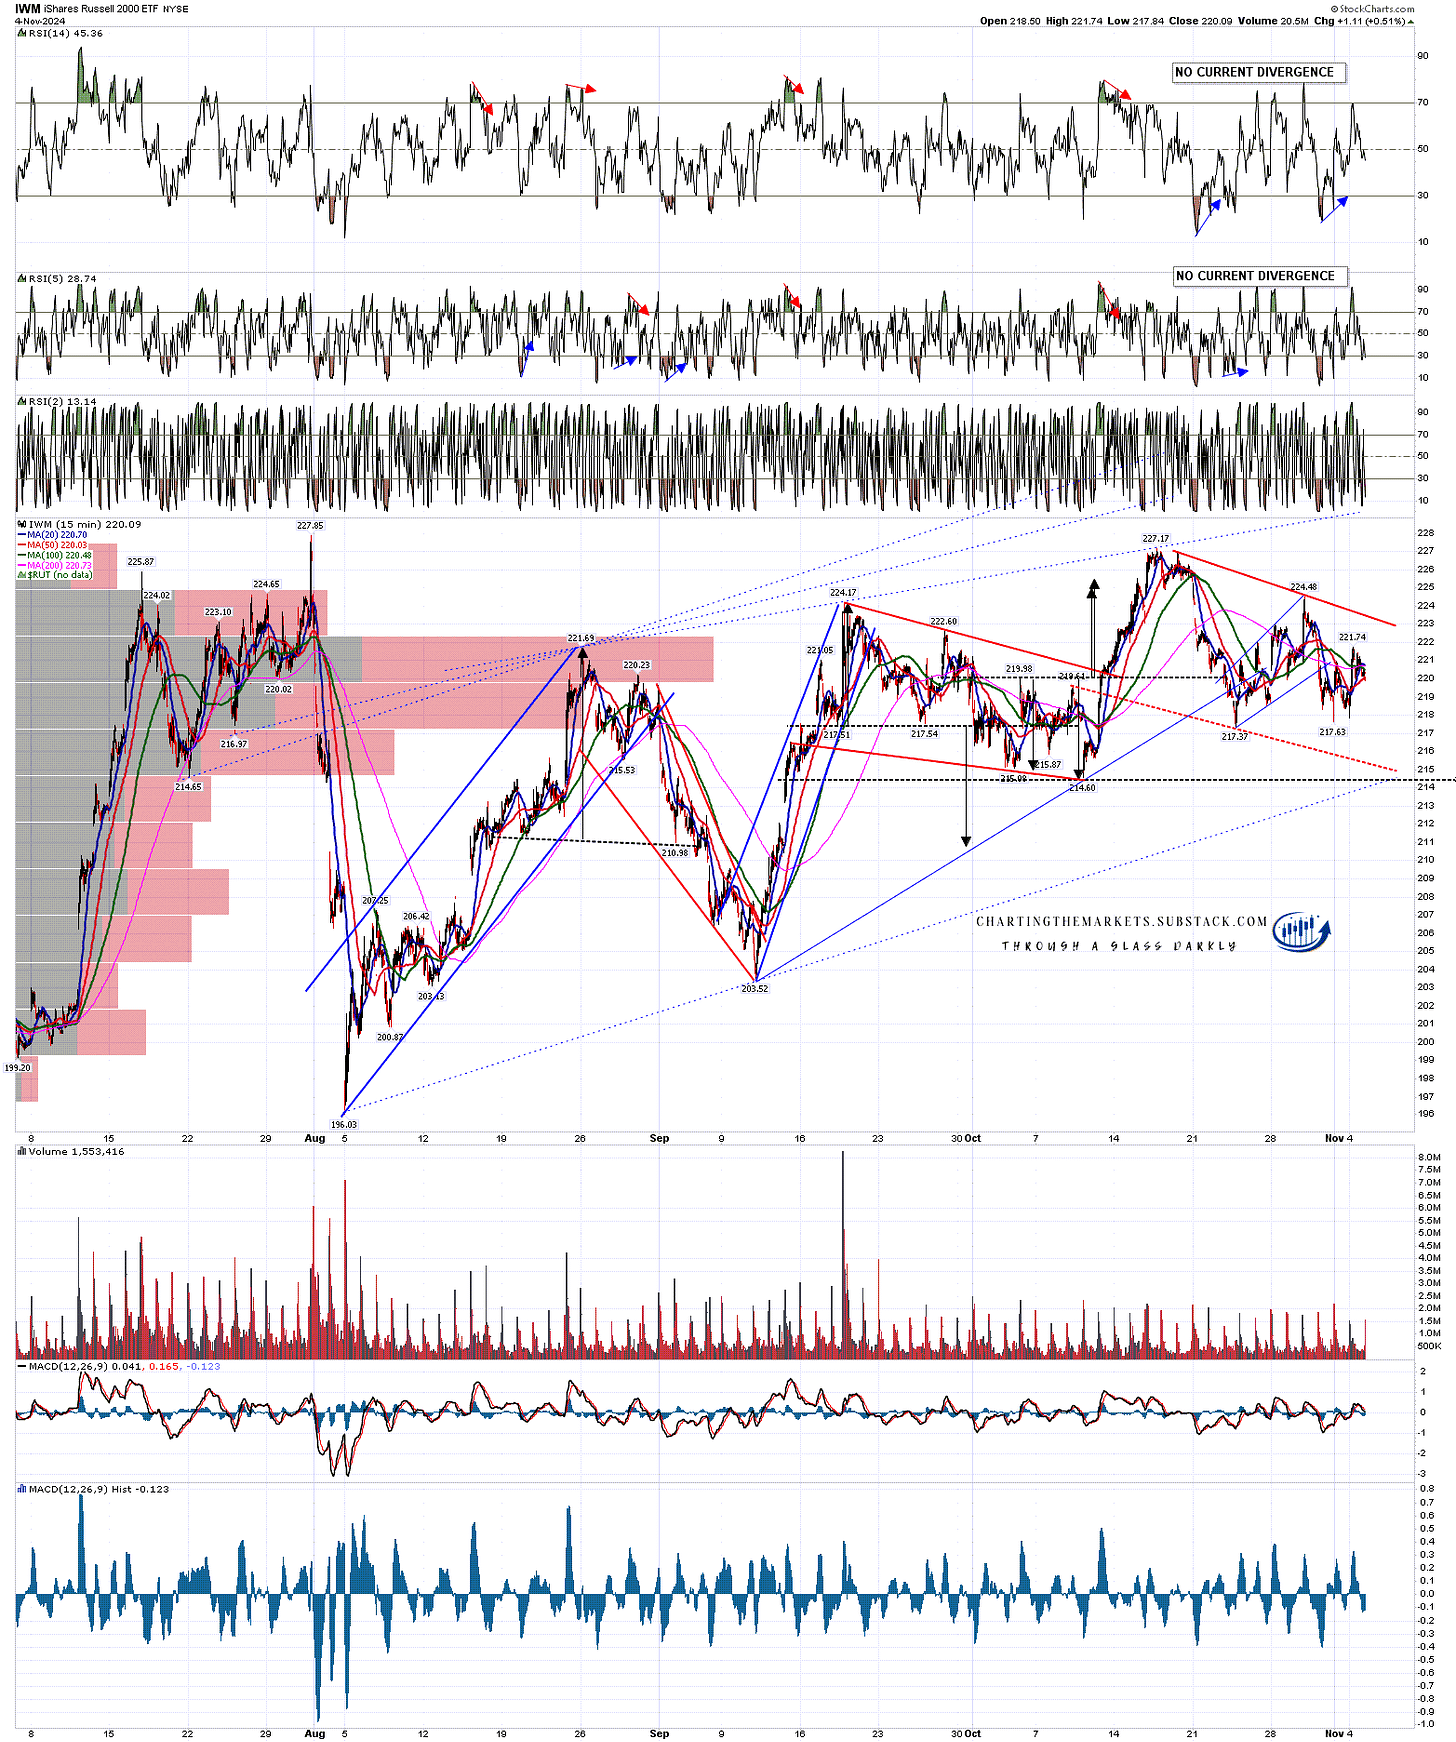
Not much happening on IWM here, though there is still a possible large double top in place that on a sustained break below 214.60 would look for the 201-5 area.
IWM 15min chart:
Hard to say which way the election goes today, or to predict what impact a victory by either side would have on markets. Equally hard to call the Fed decision this week, though I’m leaning towards a 0.25% cut. We’ll see.
If the news doesn’t tank the markets though, the seasonally obvious direction is still up.
If you like my analysis and would like to see more, please take a free subscription at my chartingthemarkets substack, where I publish these posts first and do a short premarket review every morning.

No comments:
Post a Comment