
In my last post on Thursday 5th March I was looking at the possible topping setups on the US indices in the light of the war on Iran that started on Saturday February 28th.
That war is ongoing and while the US is now extending feelers about a ceasefire to the Iranian side, those have so far been rejected. That may be because the initial attacks on Iran were launched while the last peace talks were still ongoing, or it could be that Iran’s new Supreme Leader is still a bit annoyed about his parents, wife, and one of his children being killed in those attacks, but ultimately the problem here is that while one side unilaterally can start a war by attacking, one side unilaterally can only end a war by surrendering. Any other outcome requires at least some cooperation between the warring sides.
Iran has stated that it is settling in for an extended asymmetric war of attrition, and has stated a target for oil prices at $200 per barrel, with the aim of causing an economic crisis in the rest of the world. That’s actually not an unreasonable target, as adjusted for inflation that would be a bit lower than the current all time high at 147.27 made in 2008.
The Strait of Hormuz has been closed since the start of this war and Iran is laying mines in the narrow path that ships must follow to go through the Strait. There is no obvious current reason to think that this crisis is close to an end.
So why have we seen a big rally on equities this week? Well I was talking about this on my ‘The Bigger Picture’ video on Sunday night and noting that the Sunday open was well below the 3sd daily lower band on all four of the US equity indices I follow. I’m talking about this from about three minutes into the video and noting that a punch below the daily 3sd lower band is generally a point where I would be looking for a strong rally unless the news is really dire (Lehman as an example). What we have seen so far this week is that rally.
Rallies like this are often just a dead cat bounce before continuation lower and there’s not much reason to think at the time of writing that this is anything else.
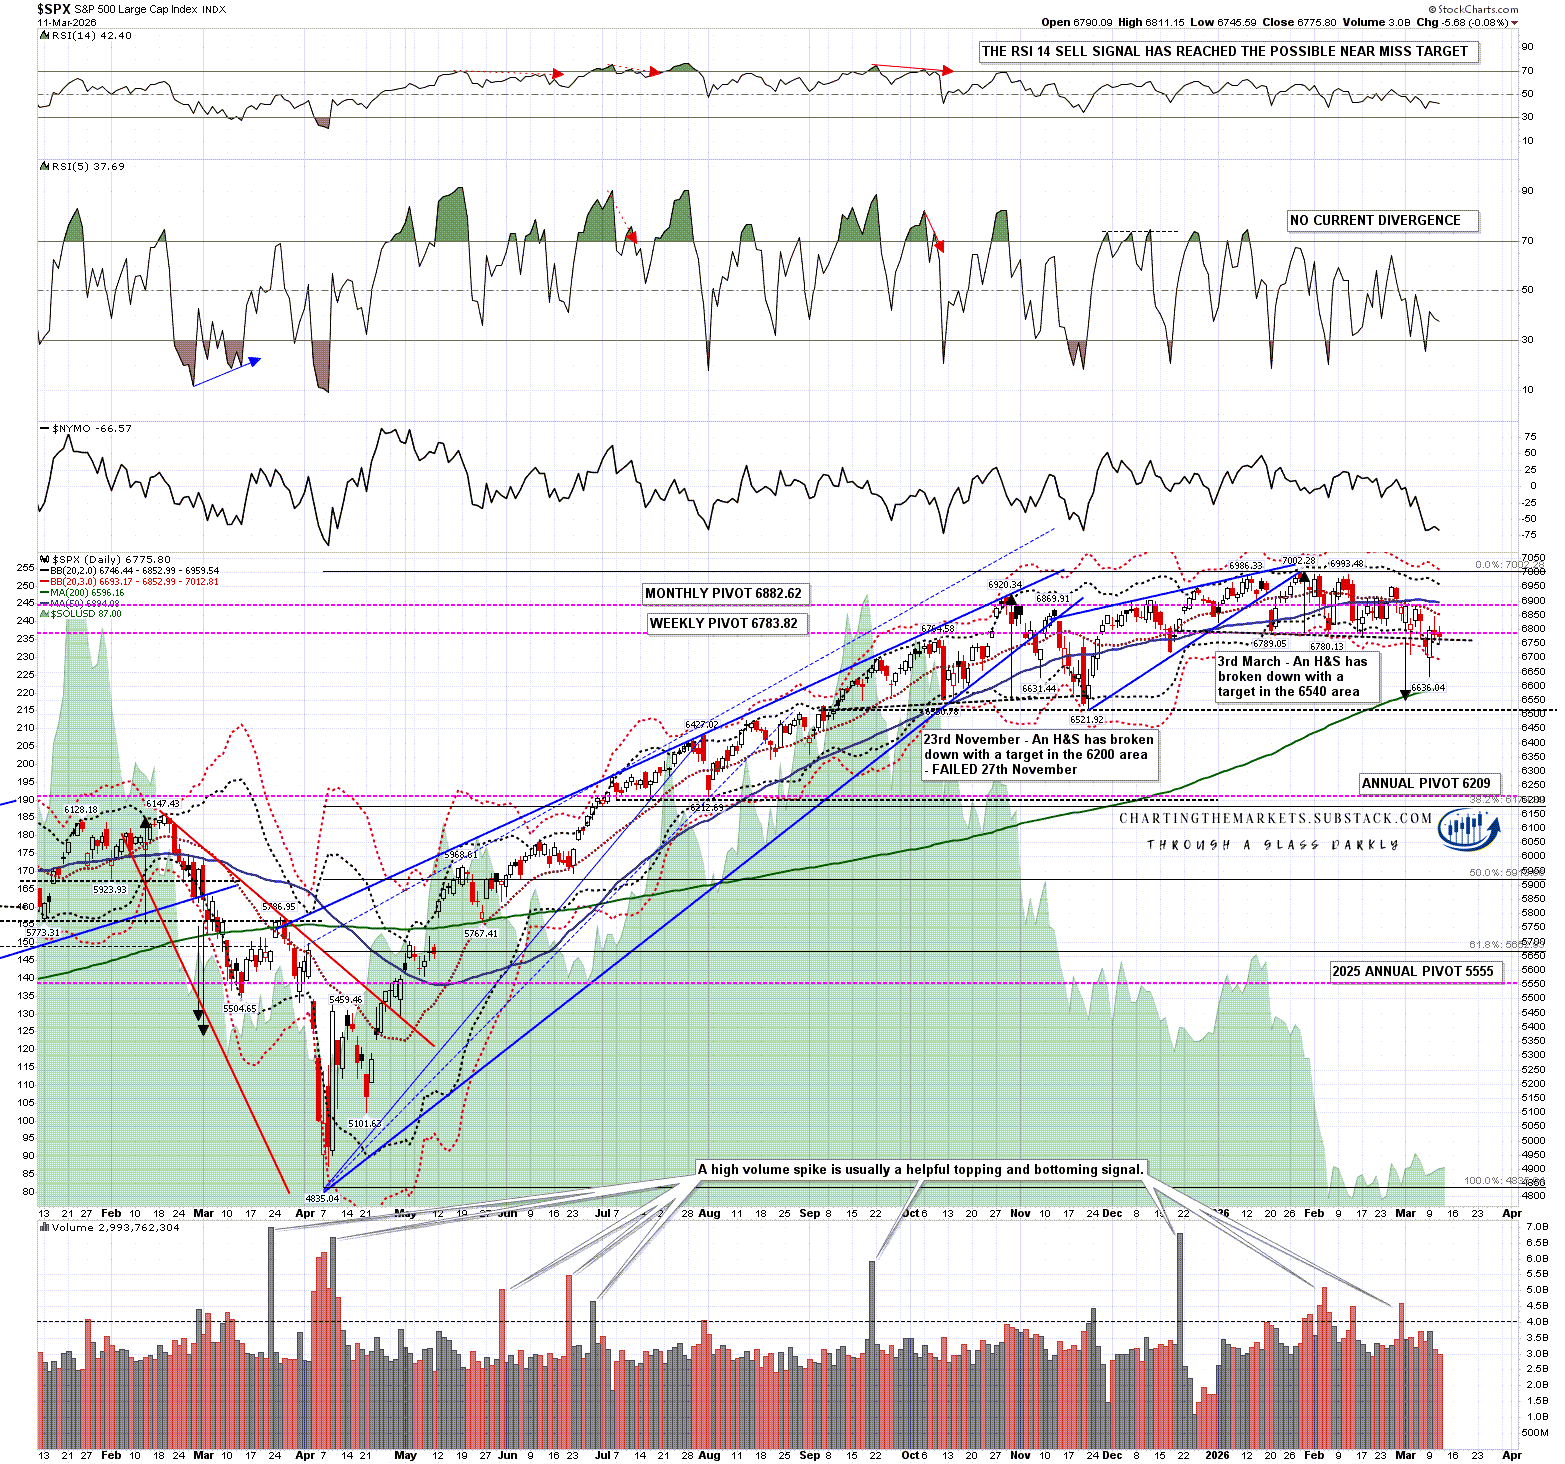
Moving on to the charts, on the SPX daily chart the obvious oversold rally target would be the daily middle band and that has already been tested with a near miss on Tuesday.
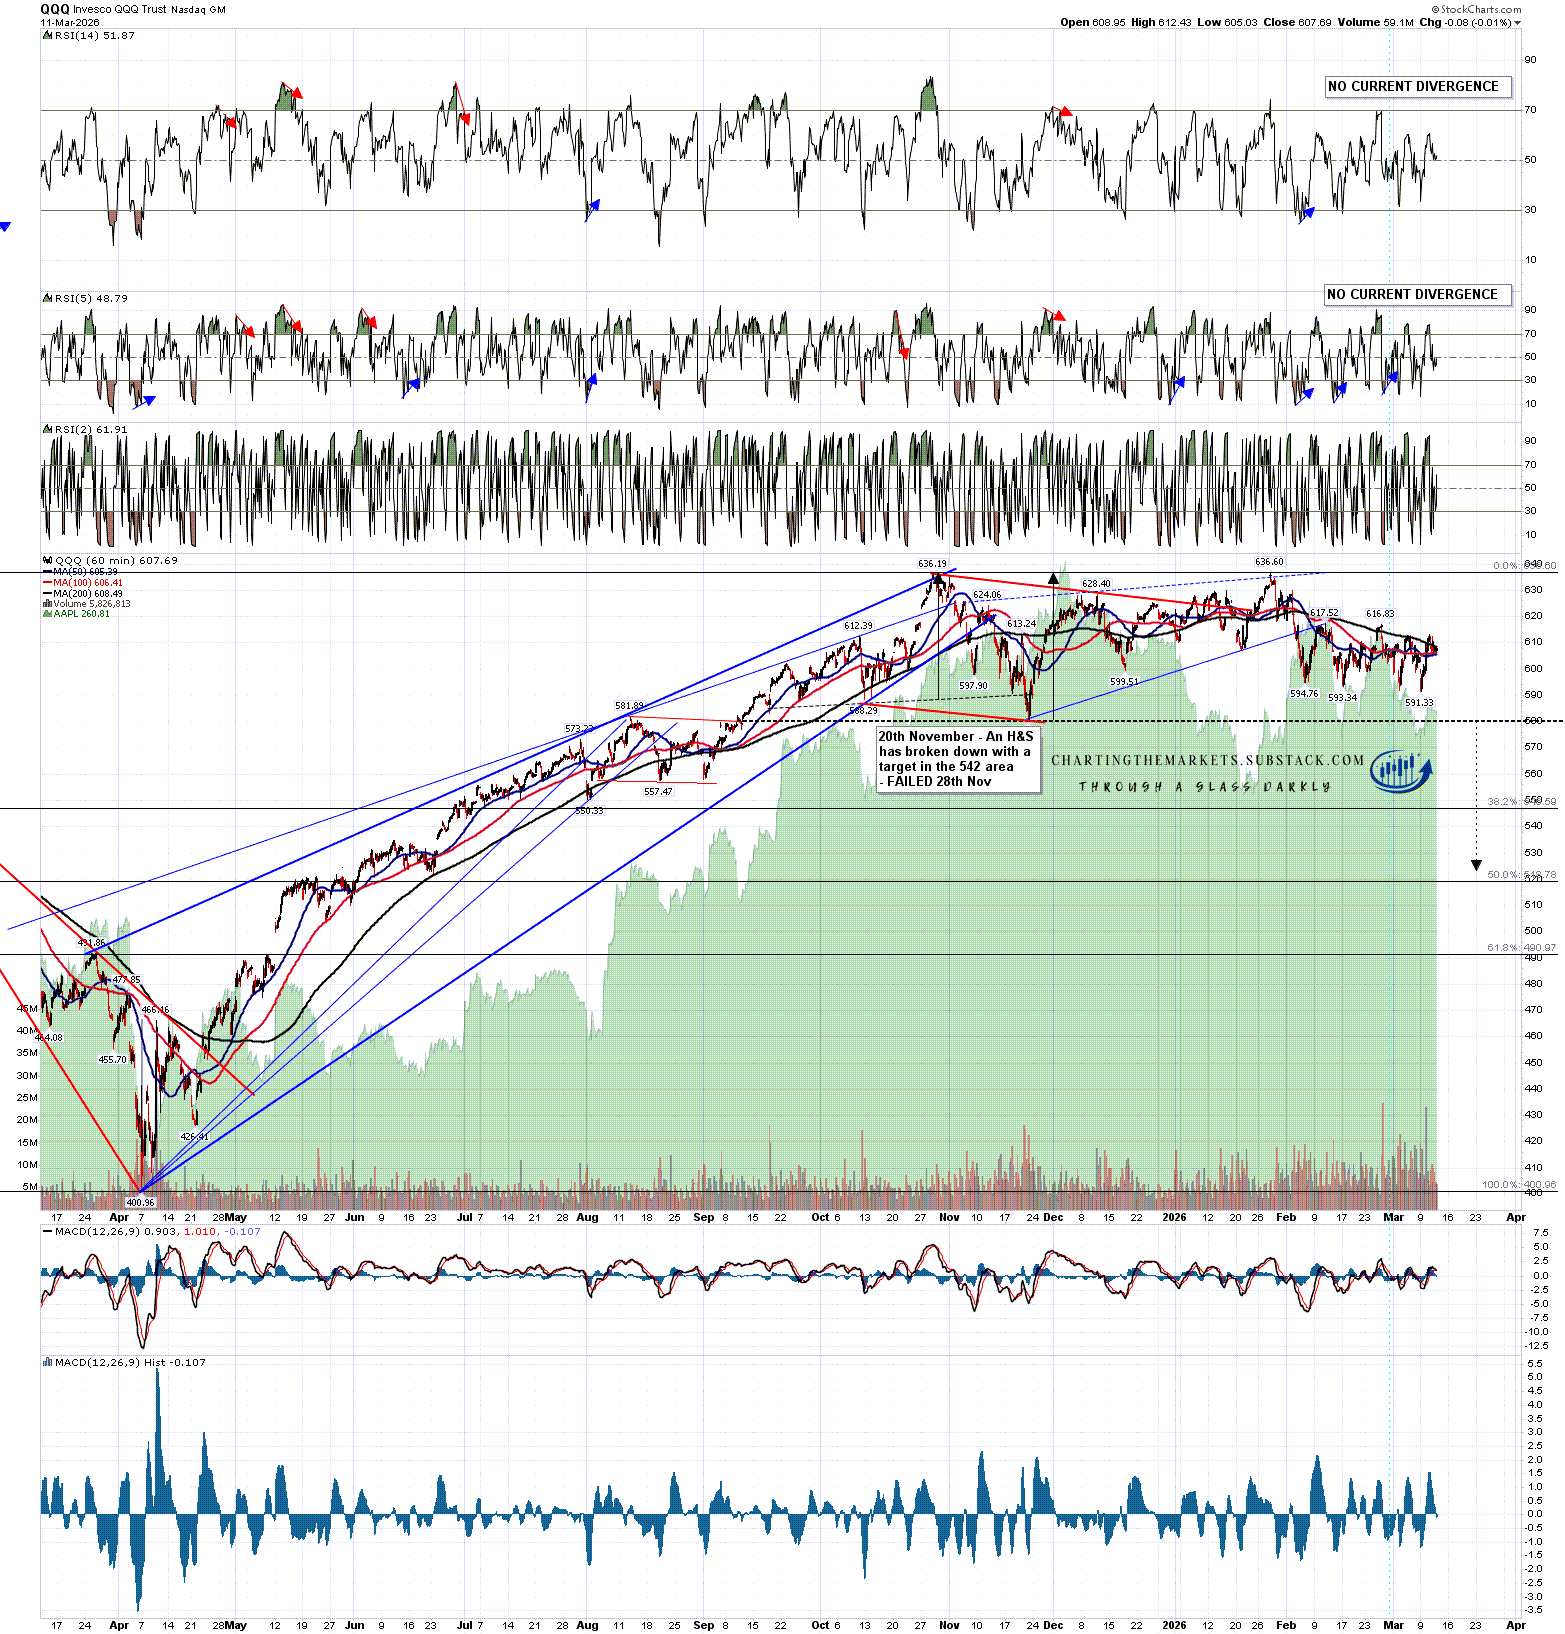
The obvious resistance on the QQQ daily chart is the 50dma, which has also been tested. DIA and IWM are both lagging the others so far and have not rallied much above their 2sd lower bands.
SPX daily chart:
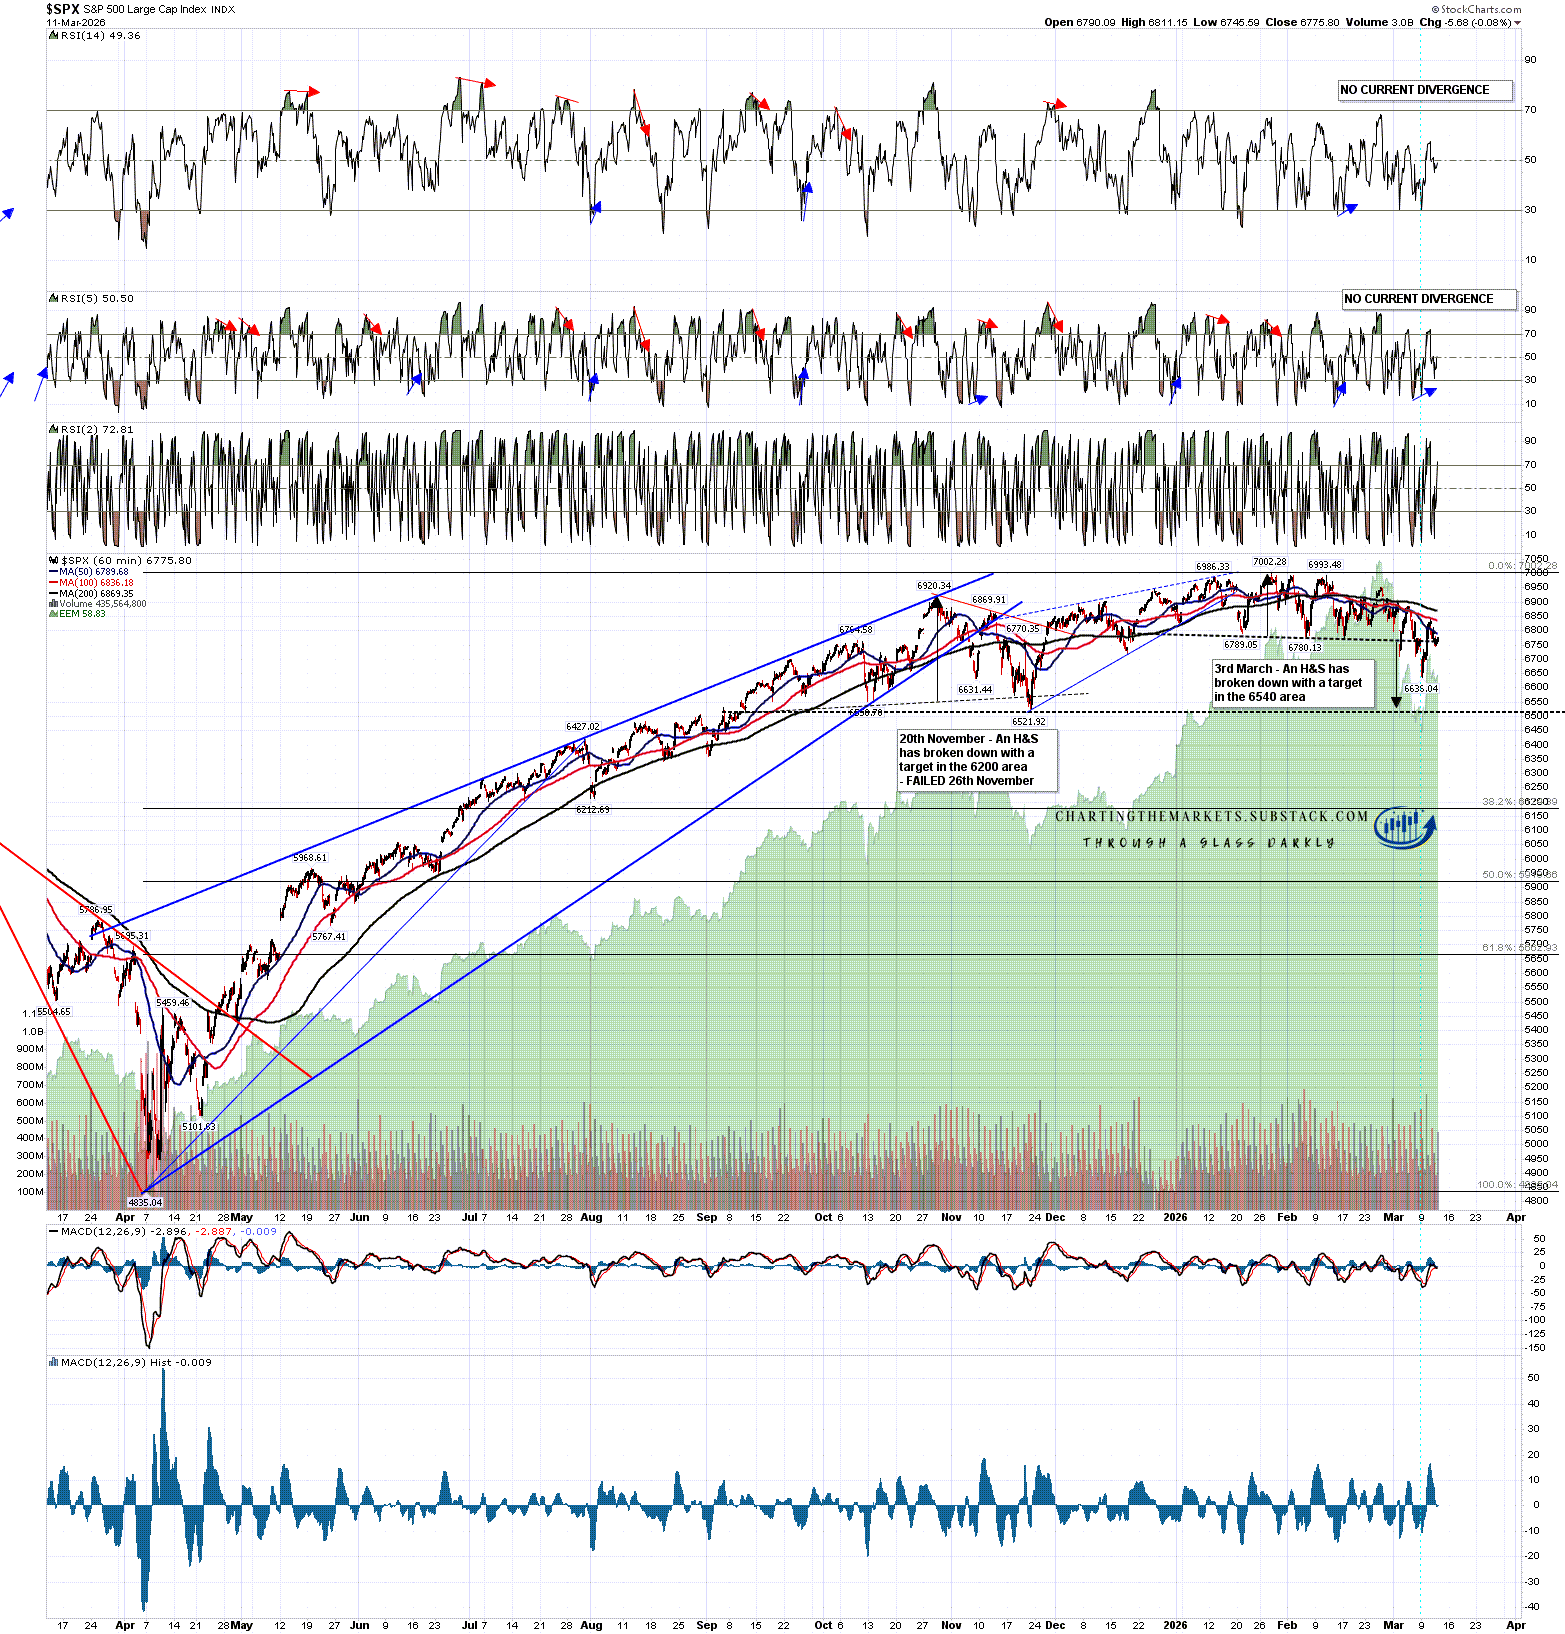
On the SPX hourly chart an H&S has broken down with a target in the 6540 area and has rallied back above the neckline but there’s nothing suggesting so far that this H&S will fail to reach target, which is close to a big support area and possible larger H&S neckline in the 6522 area.
SPX 60min chart:
On QQQ there is no equivalent current topping pattern that has broken down but there is of course a large possible double top pattern that on a sustained break below 580 would look for a target in the 523-4 area, close to a 50% retracement of the rising wedge from the April 2025 low.
QQQ 60min chart:
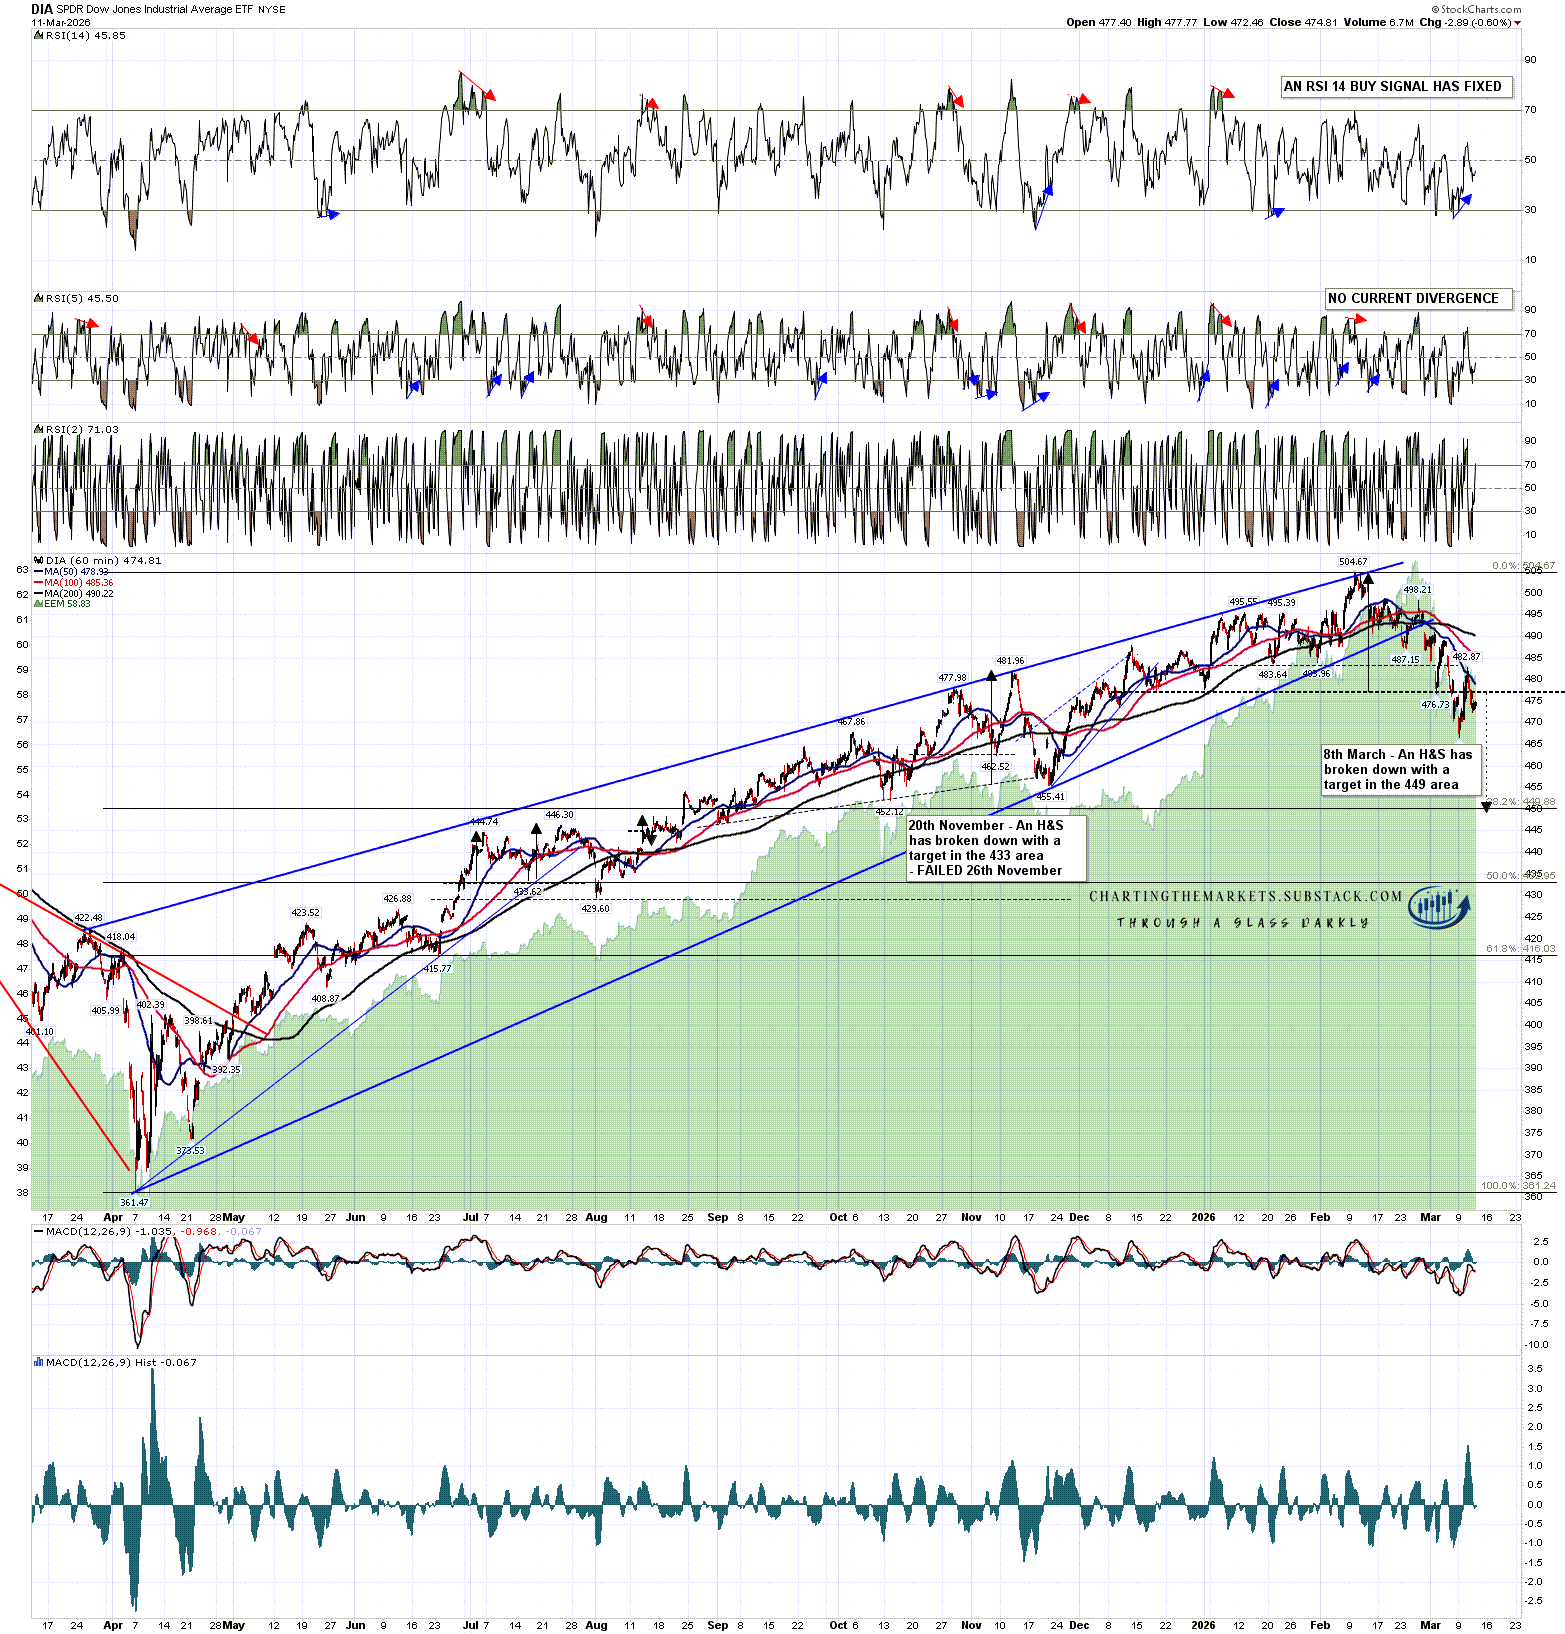
On DIA an H&S has broken down with a target in the 449-50 area, close to a 38.2% retracement of the rising wedge from the April 2025 low.
DIA 60min chart:
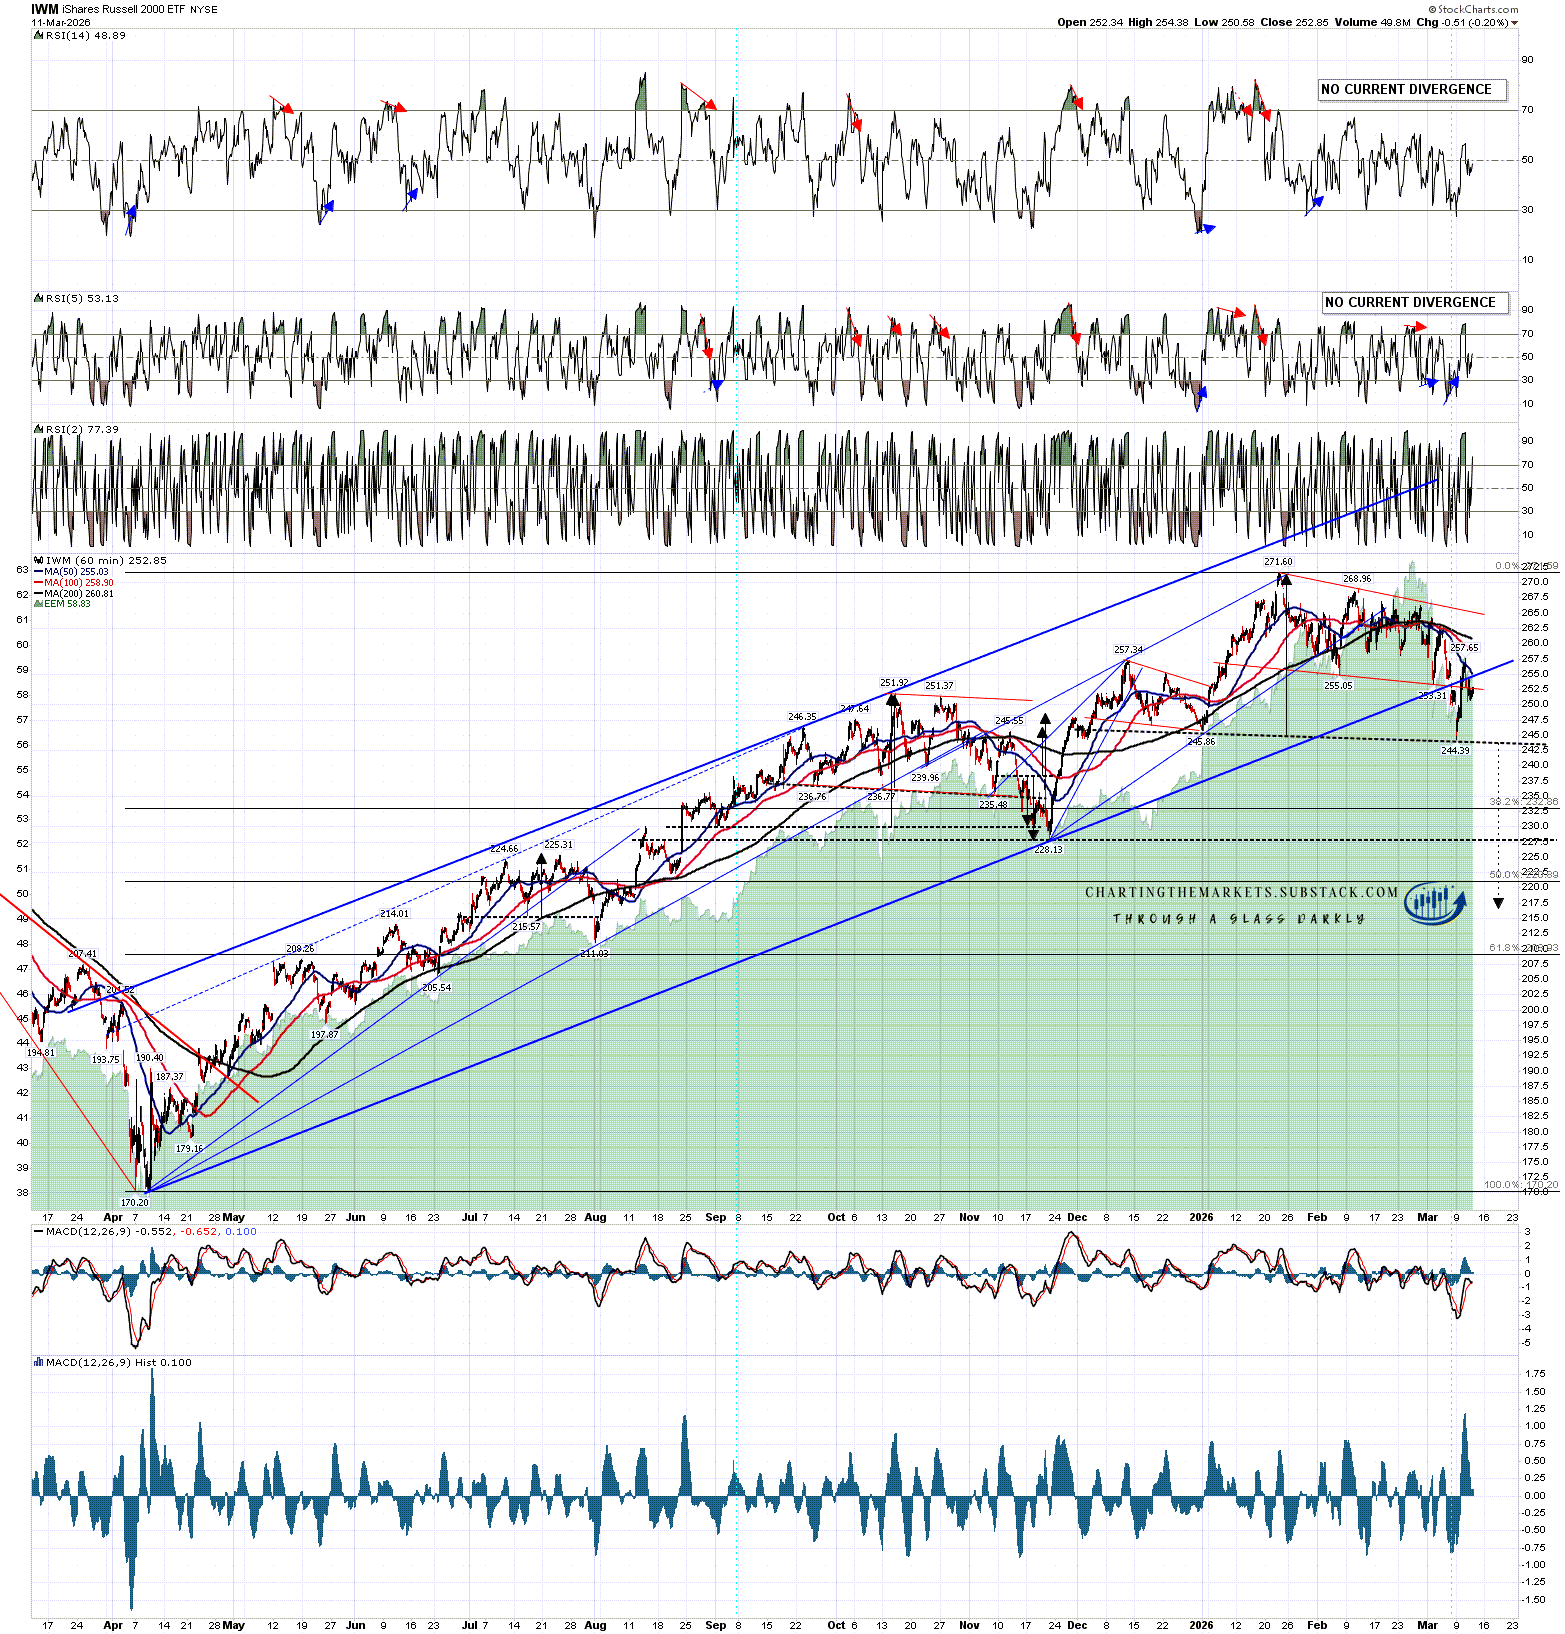
I had a very careful look at IWM and discovered that the initial rising wedge from the April 2025 low evolved into a high quality rising channel which broke down this week.
The bull flag that had been forming from the January high also broke down, but this rally has been too strong for that to be a decent topping pattern. Instead a possible H&S right shoulder has been forming this week and on a sustained break down below the H&S neckline currently in the 243.5 area would look for a target in the 216.5 area, slightly below the 50% retracement of the rising channel from the April 2025 low.
IWM 60min chart:
Obviously this is a high news environment but this Iran crisis may well be running on for a while and could get a lot worse. The US and Israel started this war without any input from Iran but to end it they will need Iran’s agreement. As with dancing the Tango, making peace is something that requires some cooperation and there is currently little indication that Iran is prepared to cooperate.
I wrote a post last week about the setups on oil and am planning to publish a follow-up to that later today, so look out for that if you’re interested in where oil might go if this war doesn’t end soon.
If you like my analysis and would like to see more, please take a free subscription at my chartingthemarkets substack, where I publish these posts first. I also do a premarket video every day on equity indices, bonds, currencies, energies, precious commodities and other commodities at 8.45am EST, but only for paying subscribers. Other places to find me are my page on the platform previously known as twitter, and my YouTube channel.
No comments:
Post a Comment