In my last post on Tuesday I was looking at a possible retracement that we then saw play out into a low on Wednesday afternoon.
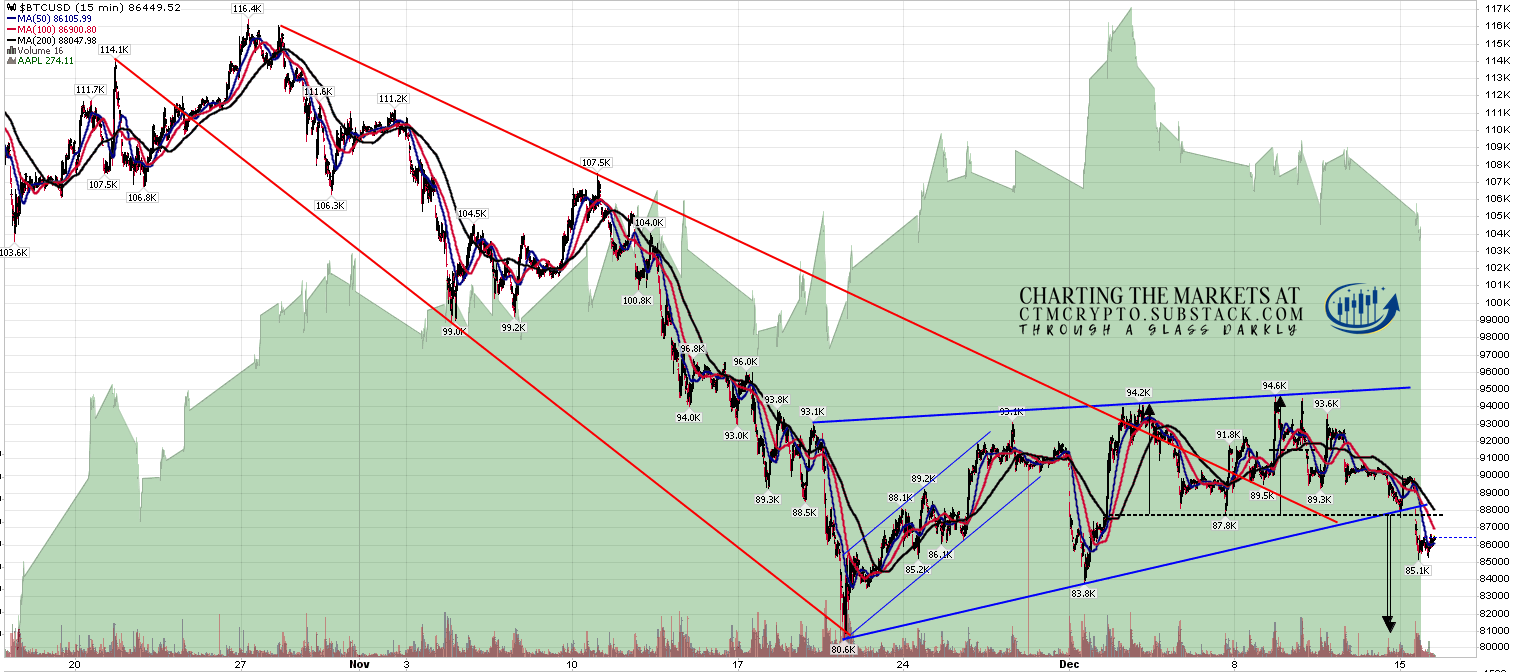
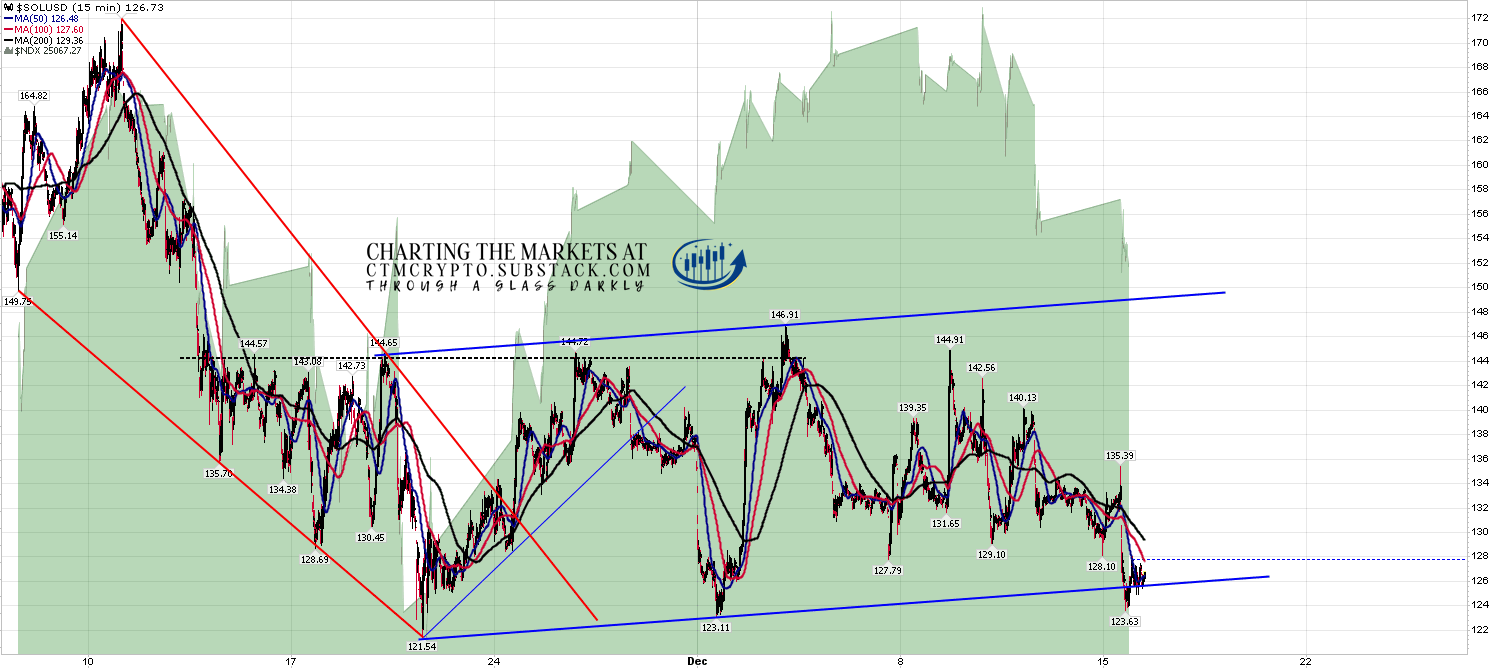
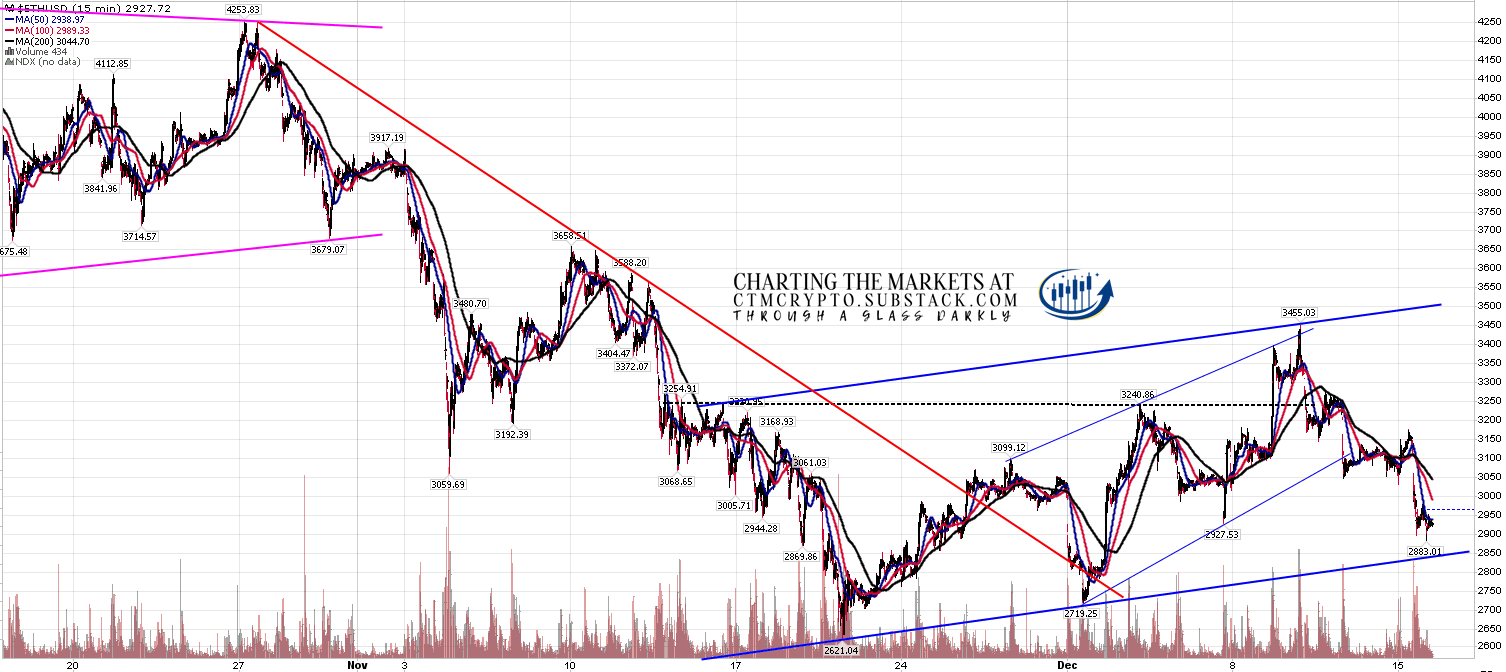
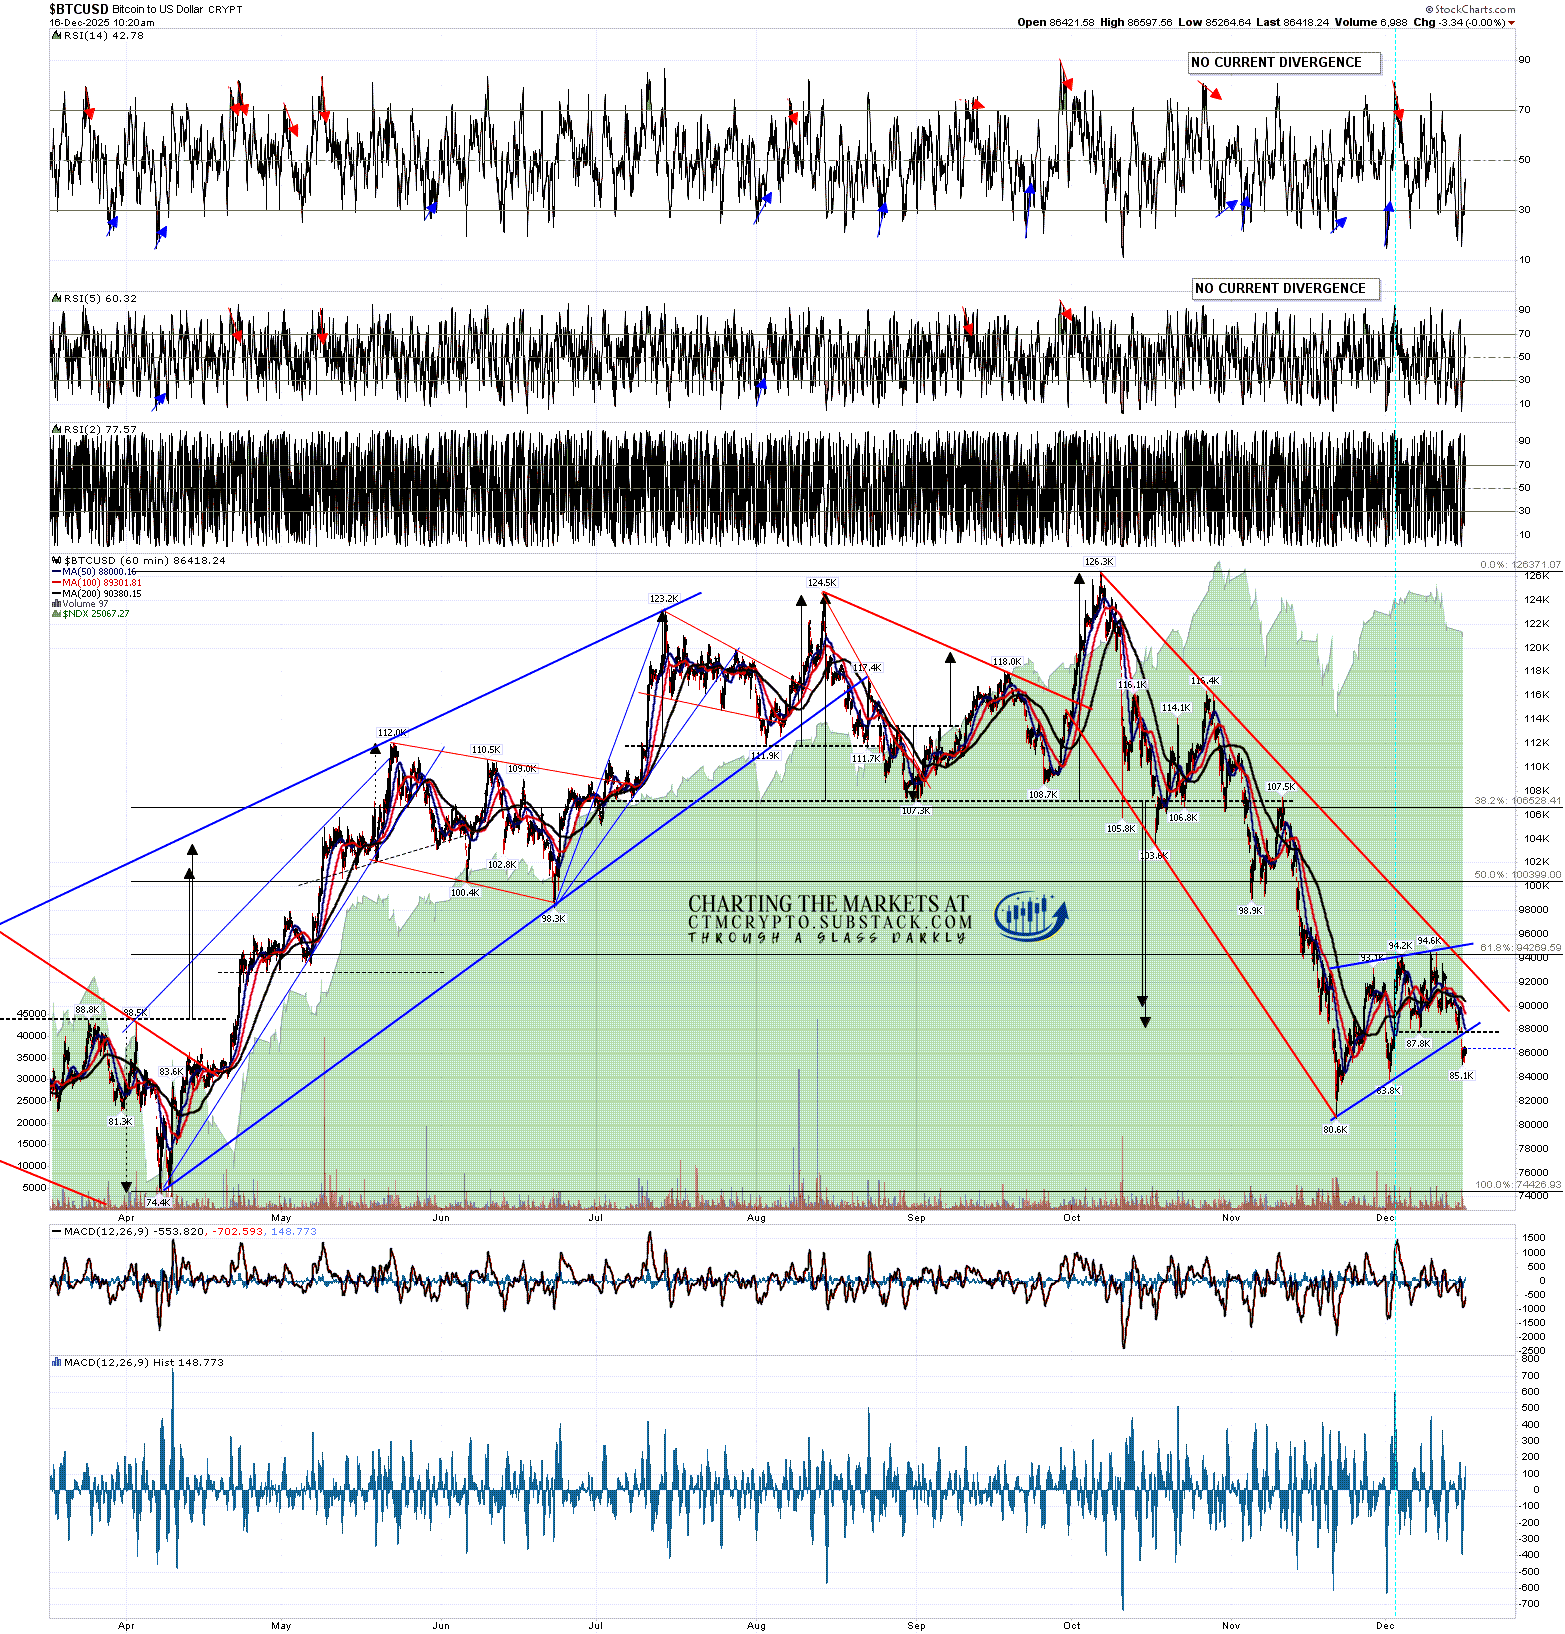
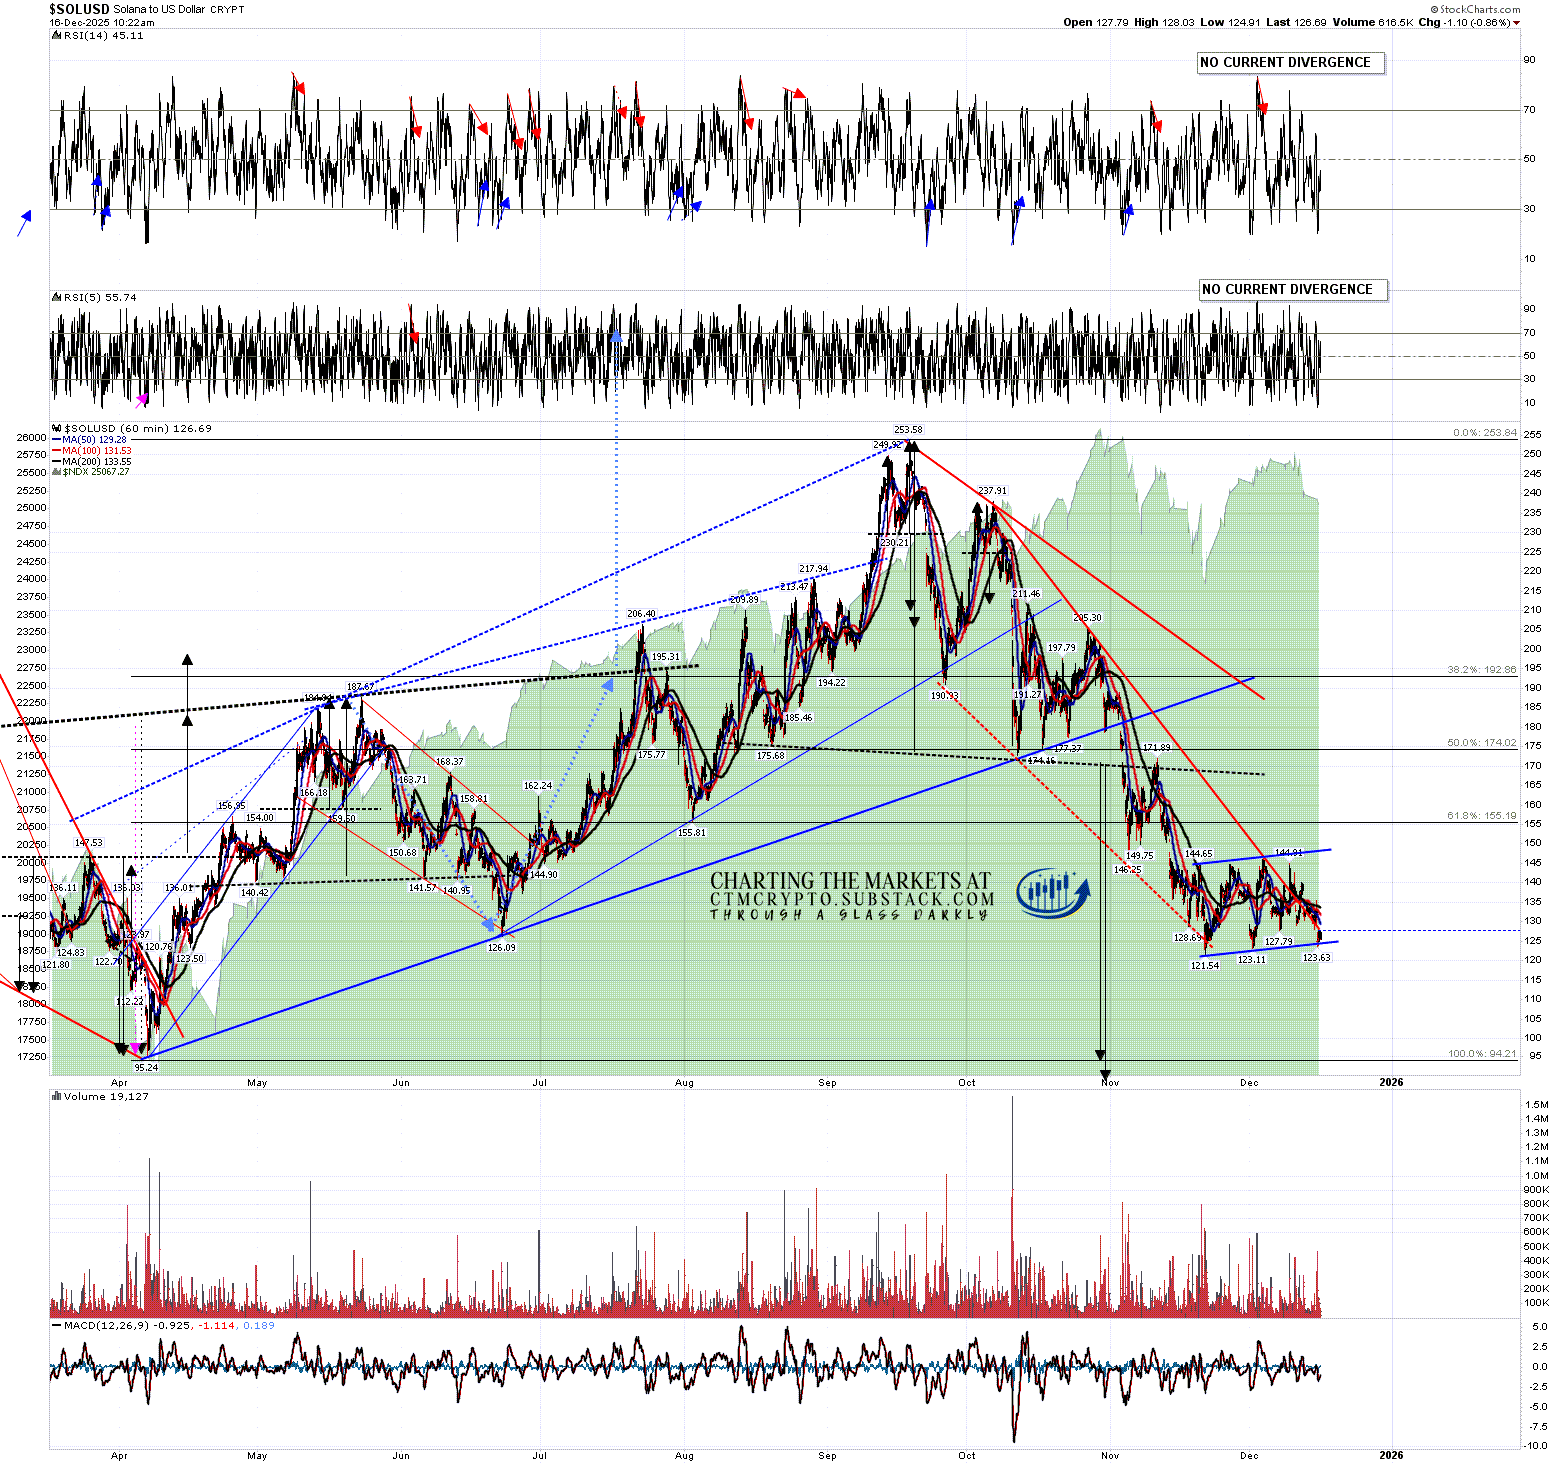
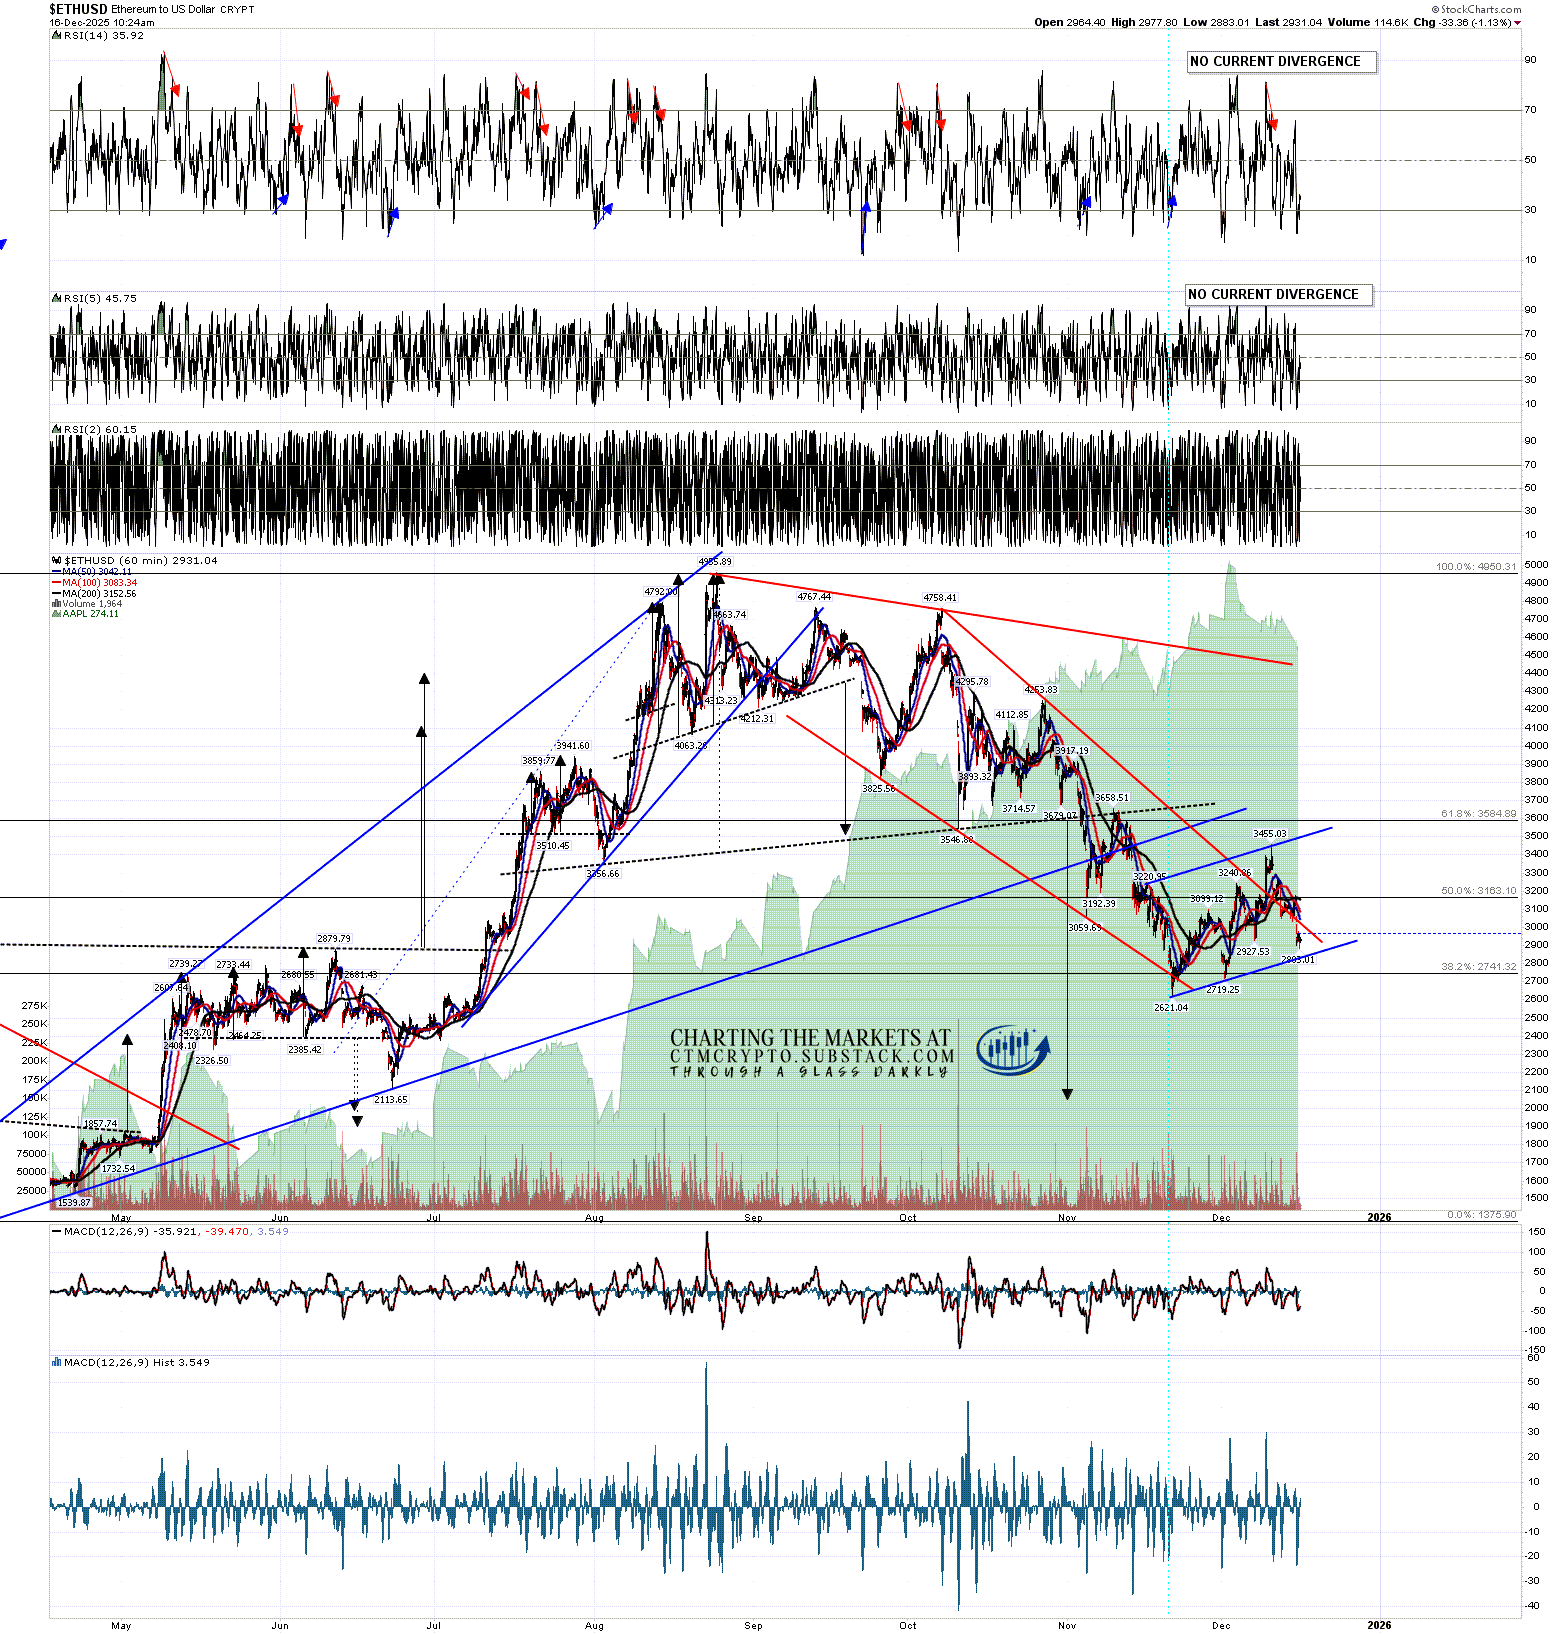
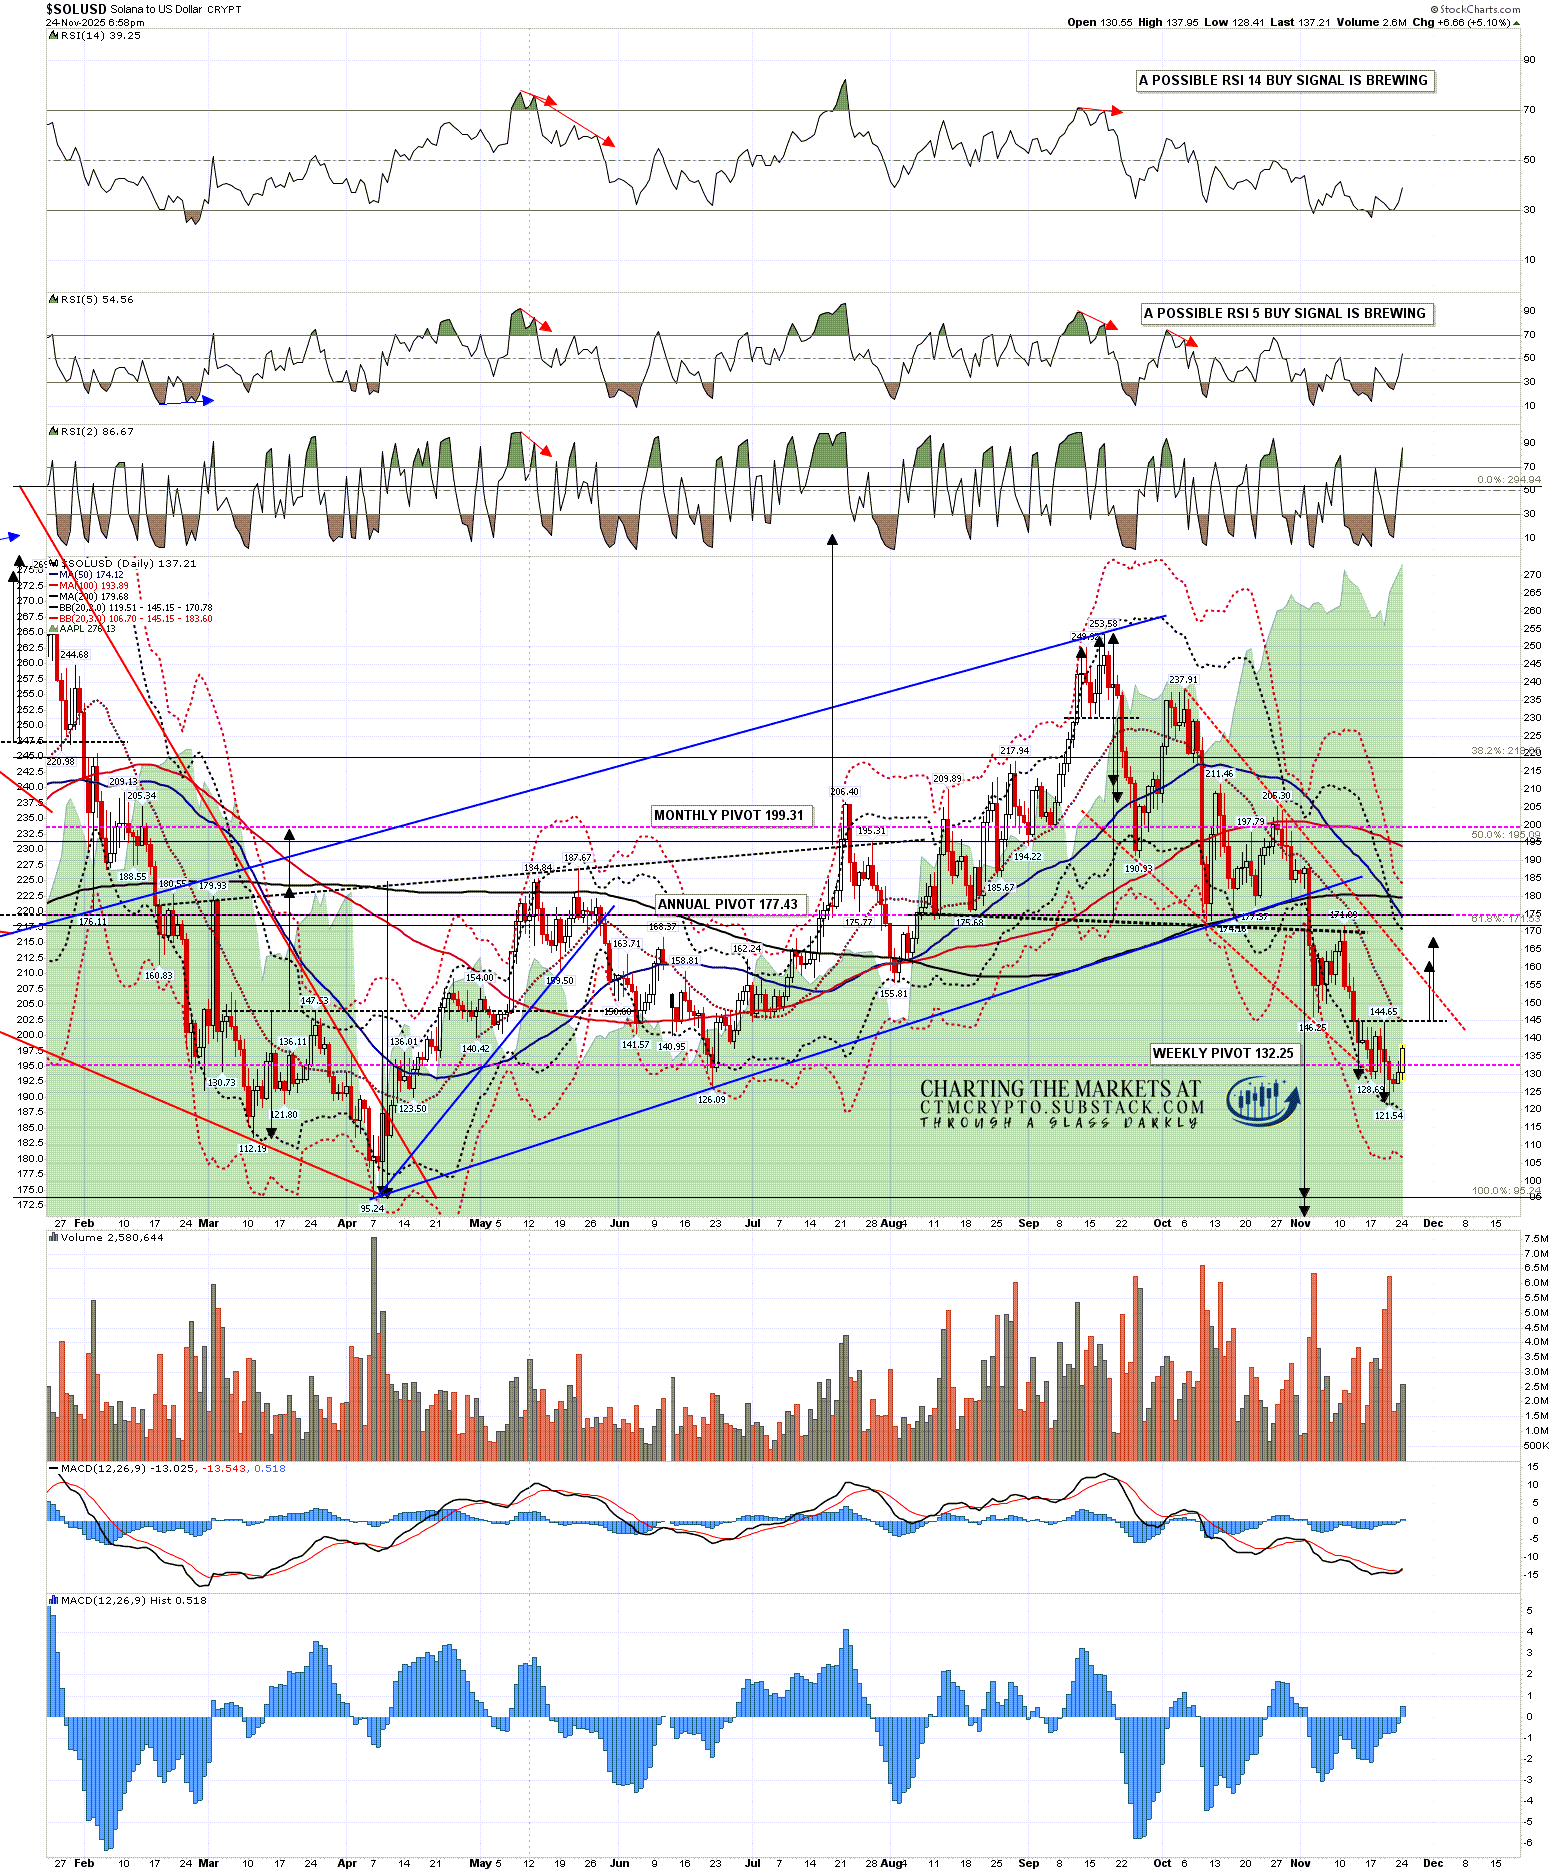
Ideally I’d have liked to see the retracement go a little lower, at the least until the bear flags on Bitcoin, Solana and Ethereum all made their targets, but as it happened they all broke down but only Solana made the target at the retest of the prior low. That leaves unfinished business below that I expect to be revisited, most likely after next week.
The Santa rally this year has so far been spiky and uncertain, with Tech trailing rather than leading the pack, but for the next week at least the historical stats are impressively bullish.
The historical stats for SPX into the next week are as follows:
Today - 61.9% bullish
Monday 22nd Dec - 66.7% bullish
Tuesday 23rd Dec - 66.7% bullish
Wednesday 24th Dec - Half Day - 57.1% bullish
Thursday 25th Dec - CLOSED
Friday 26th Dec - 71.4% bullish
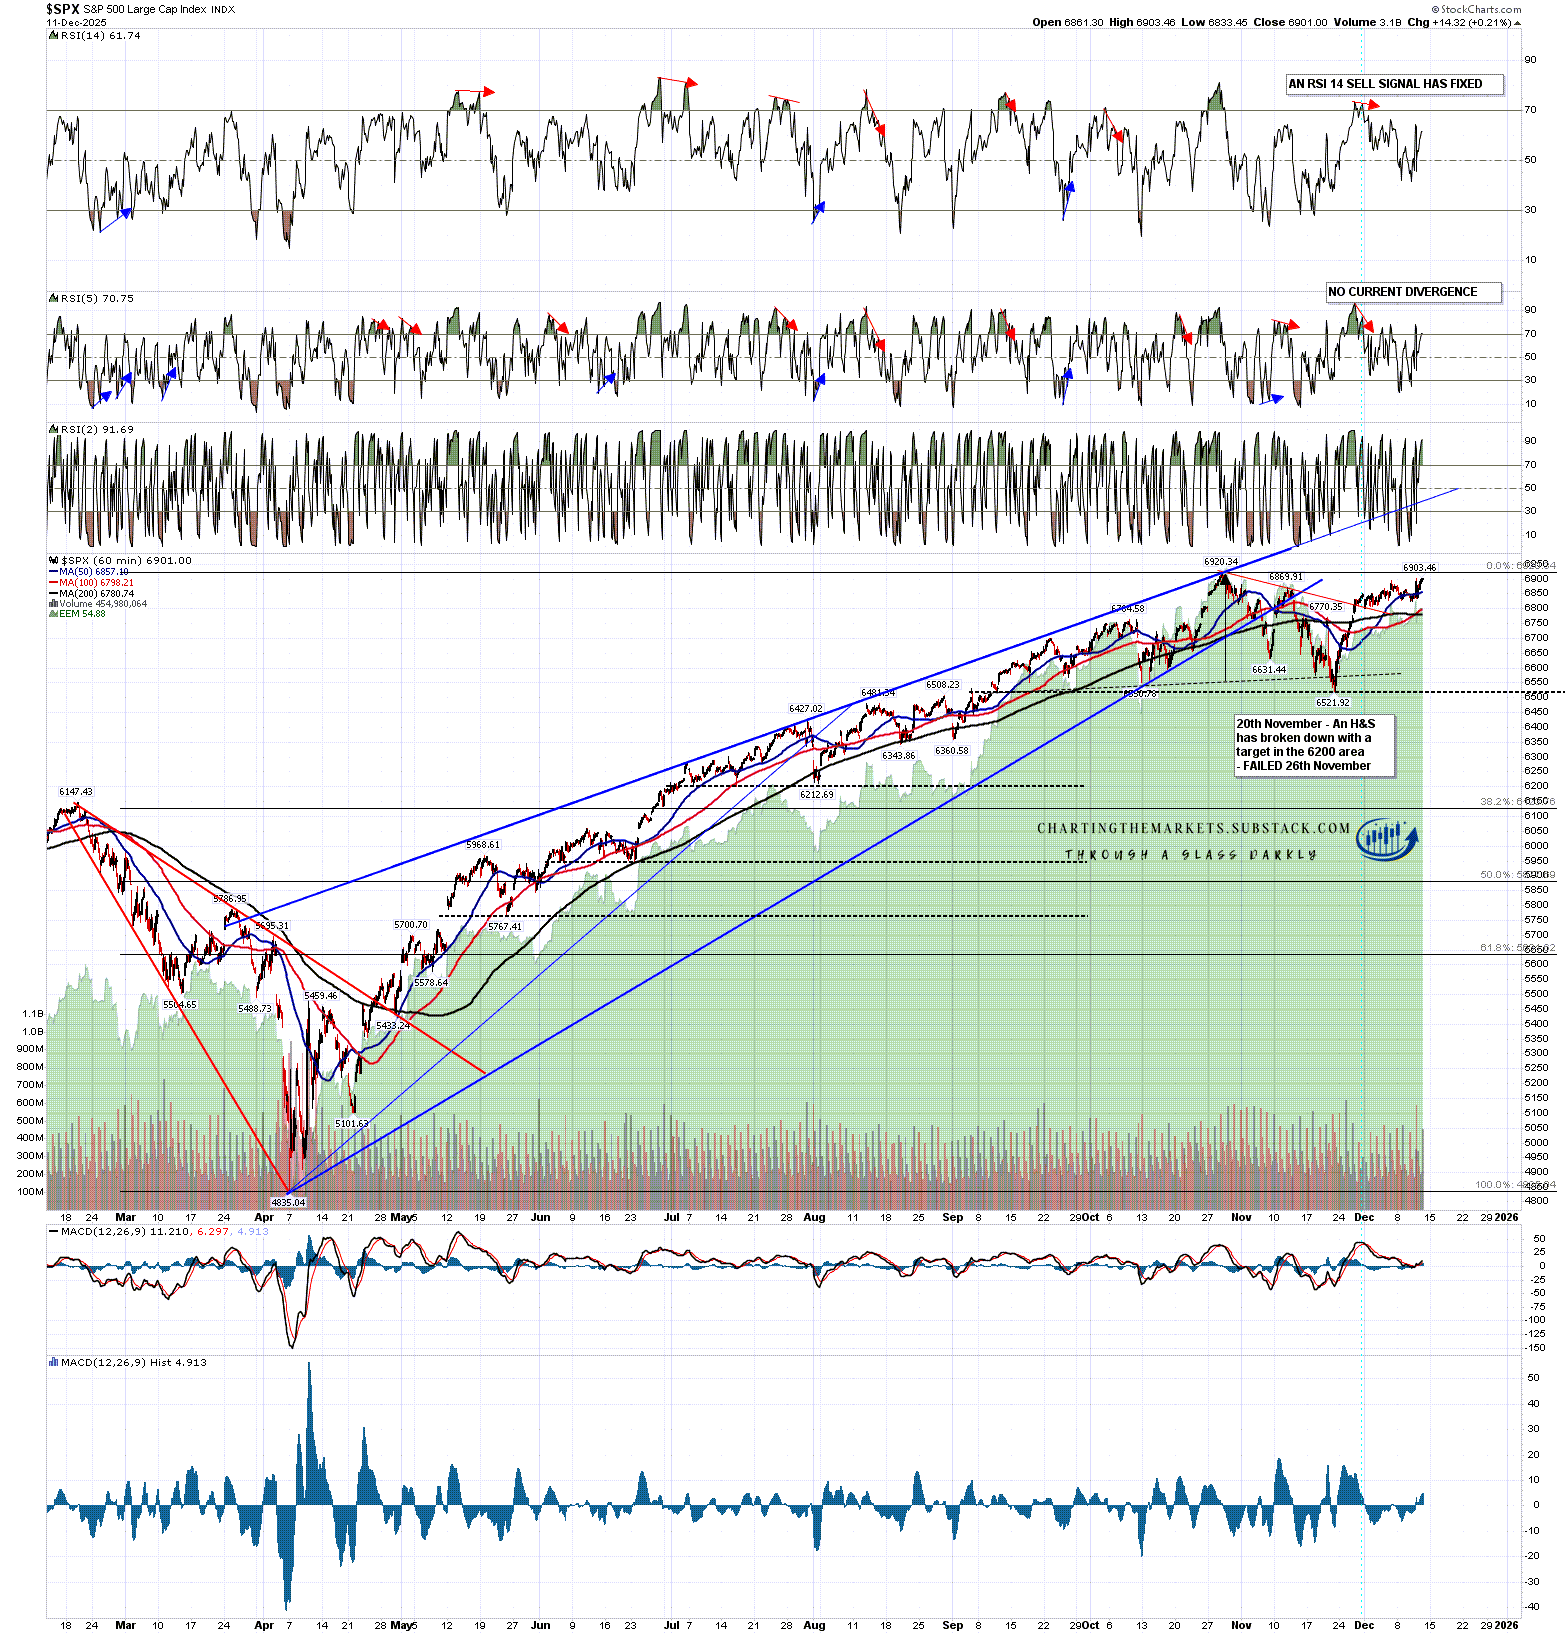
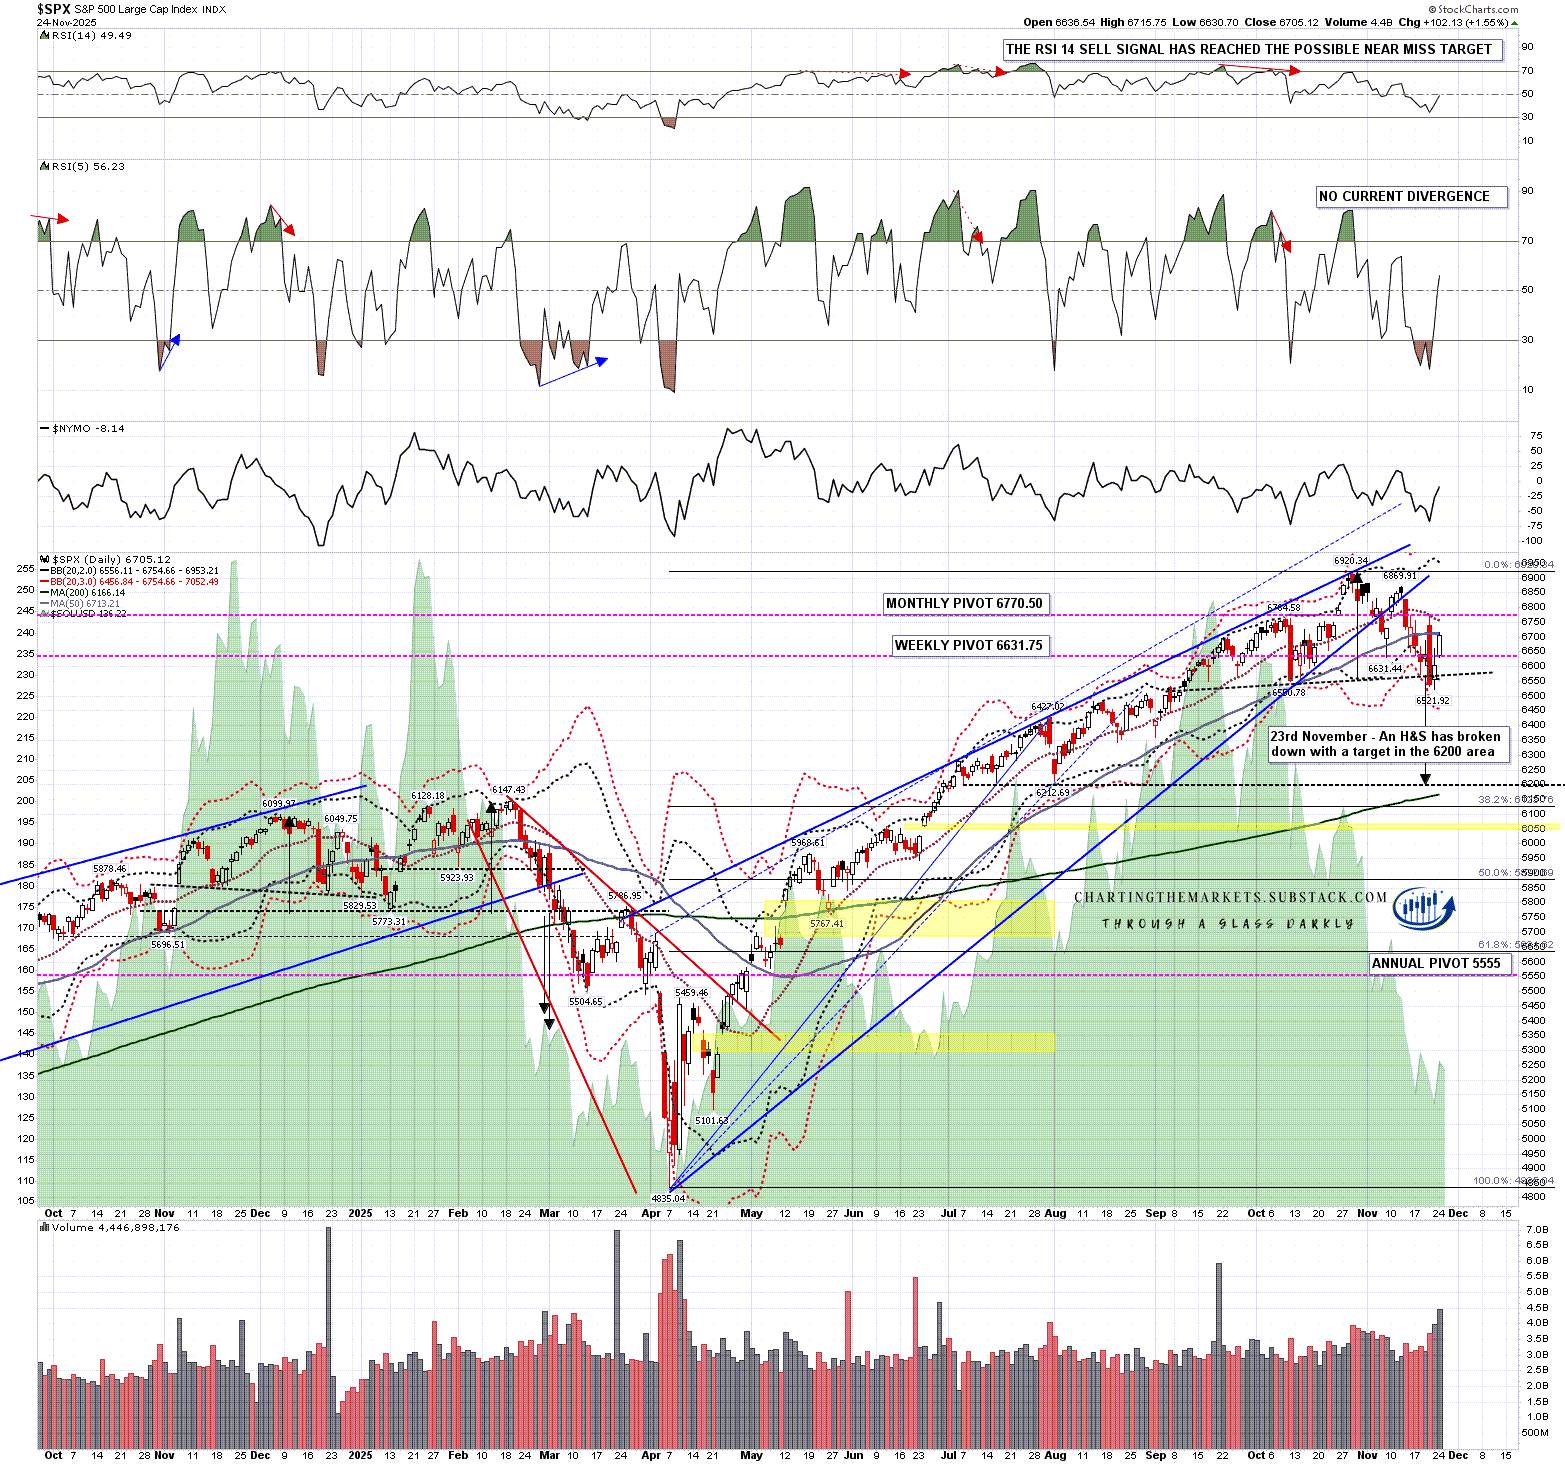
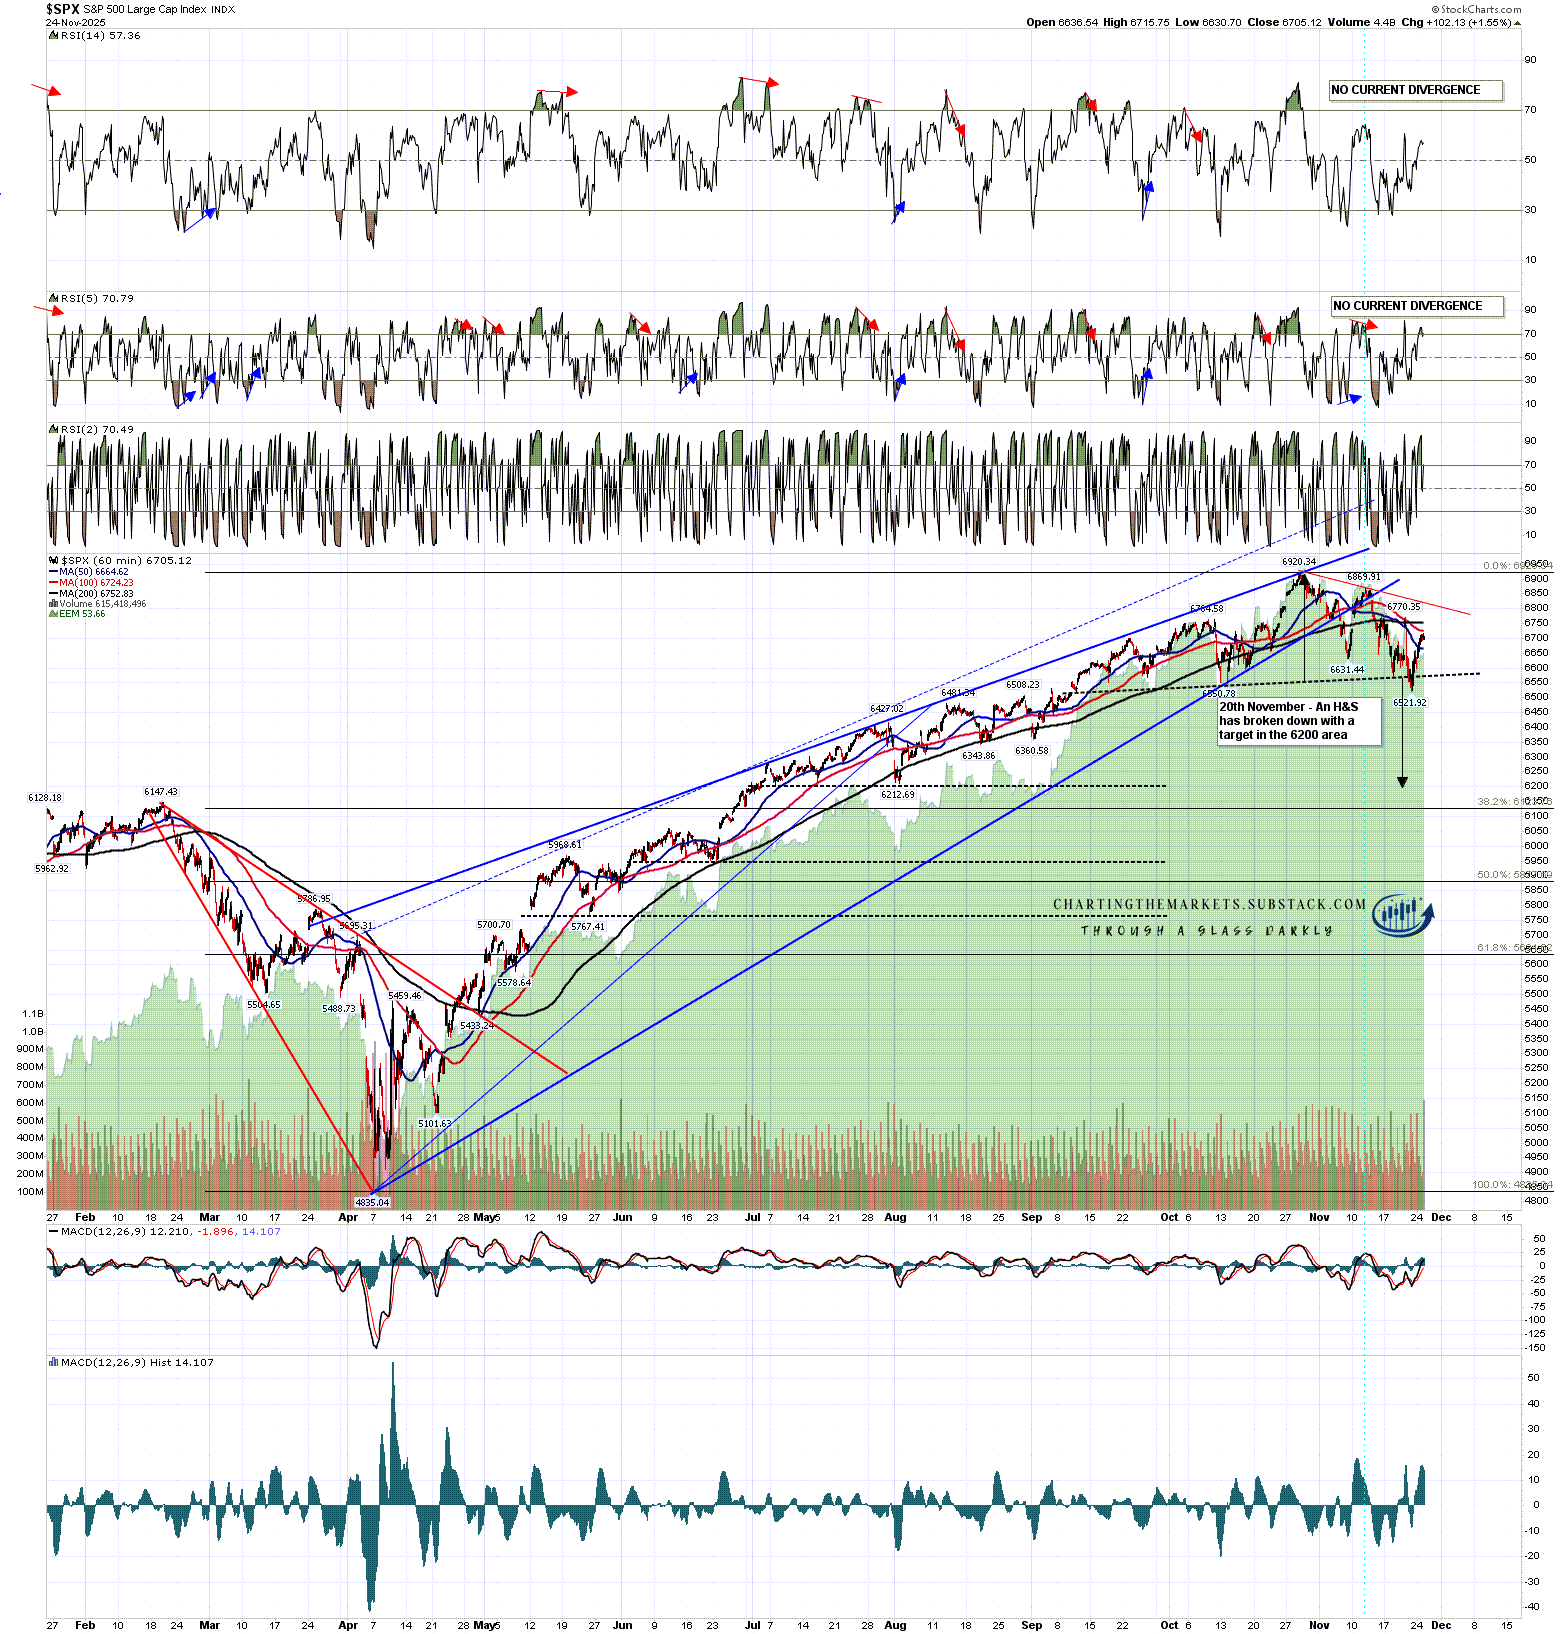
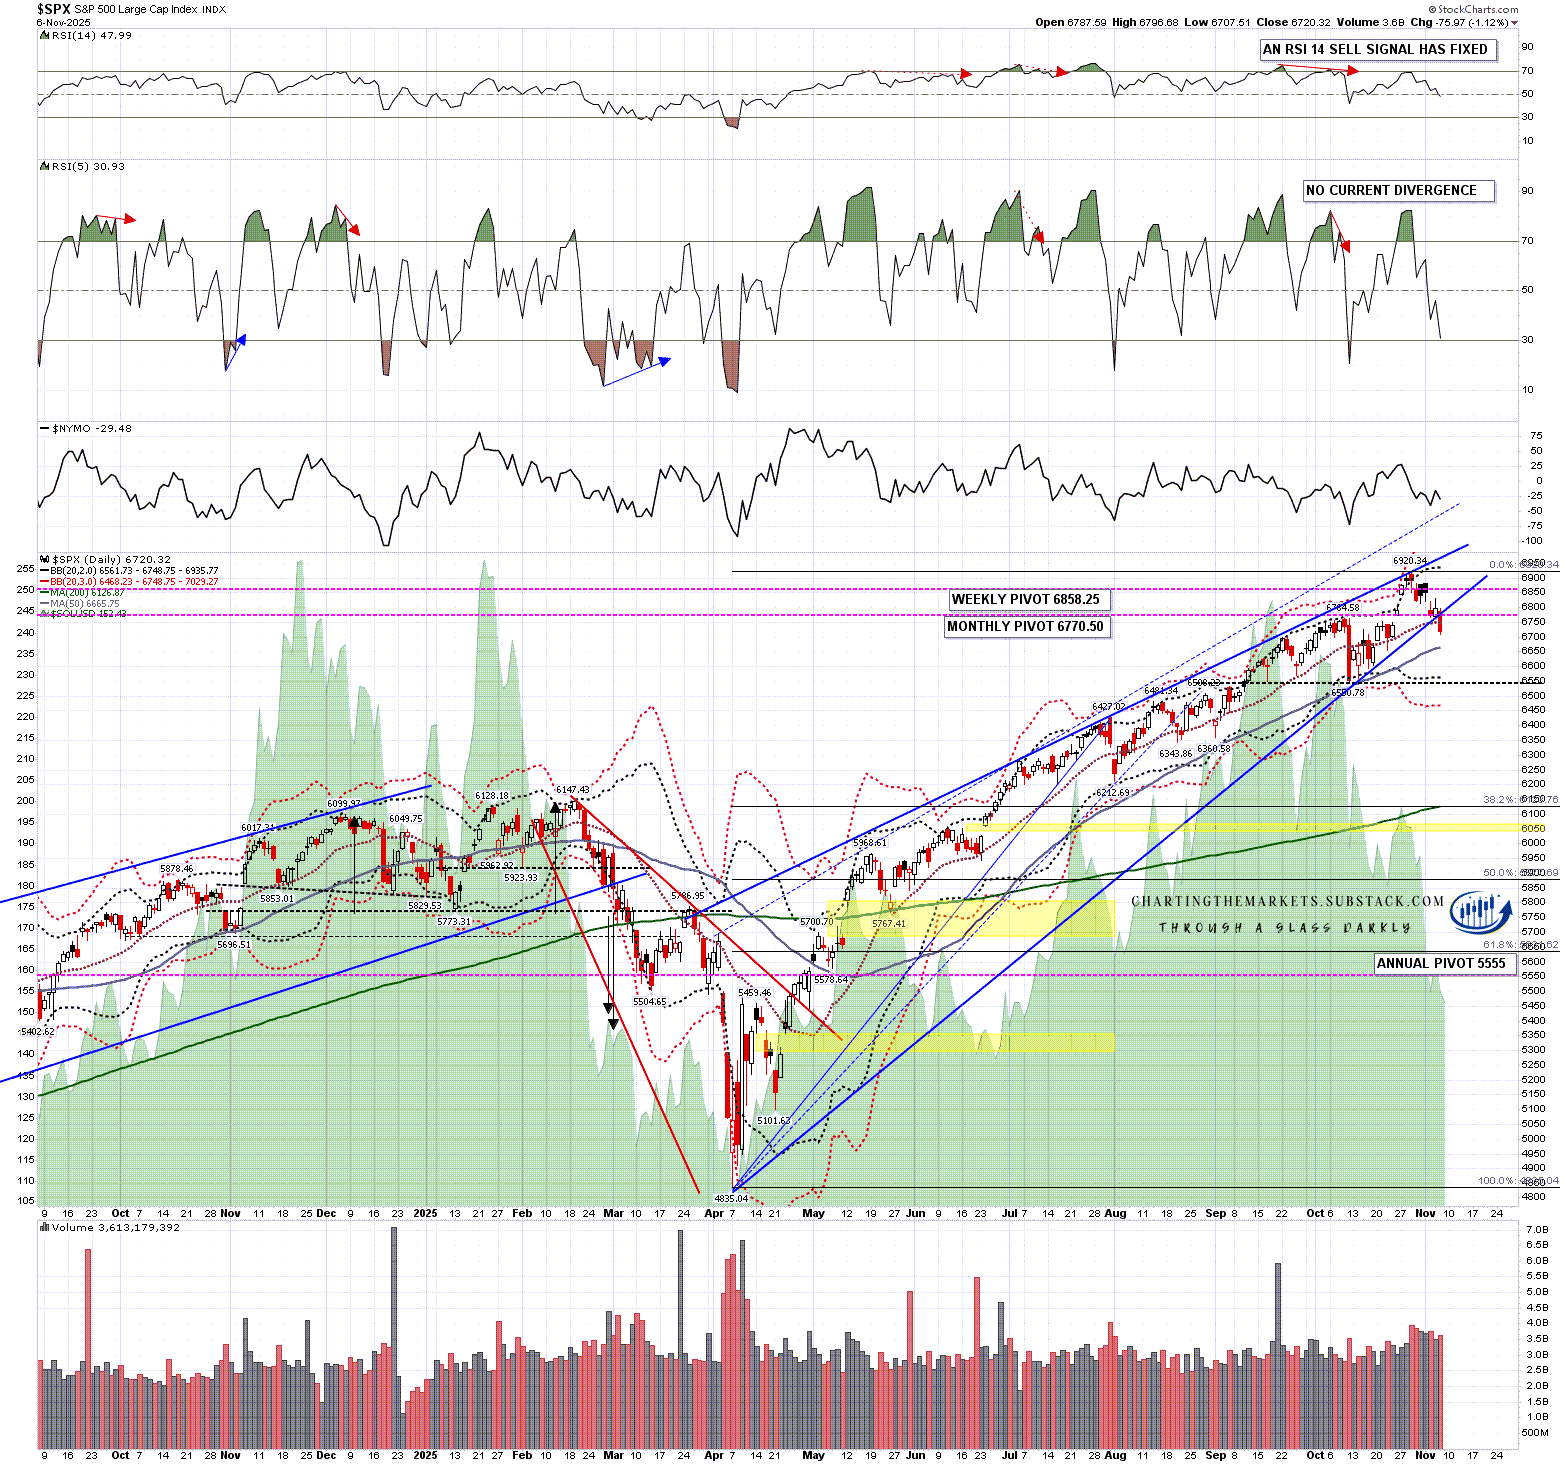
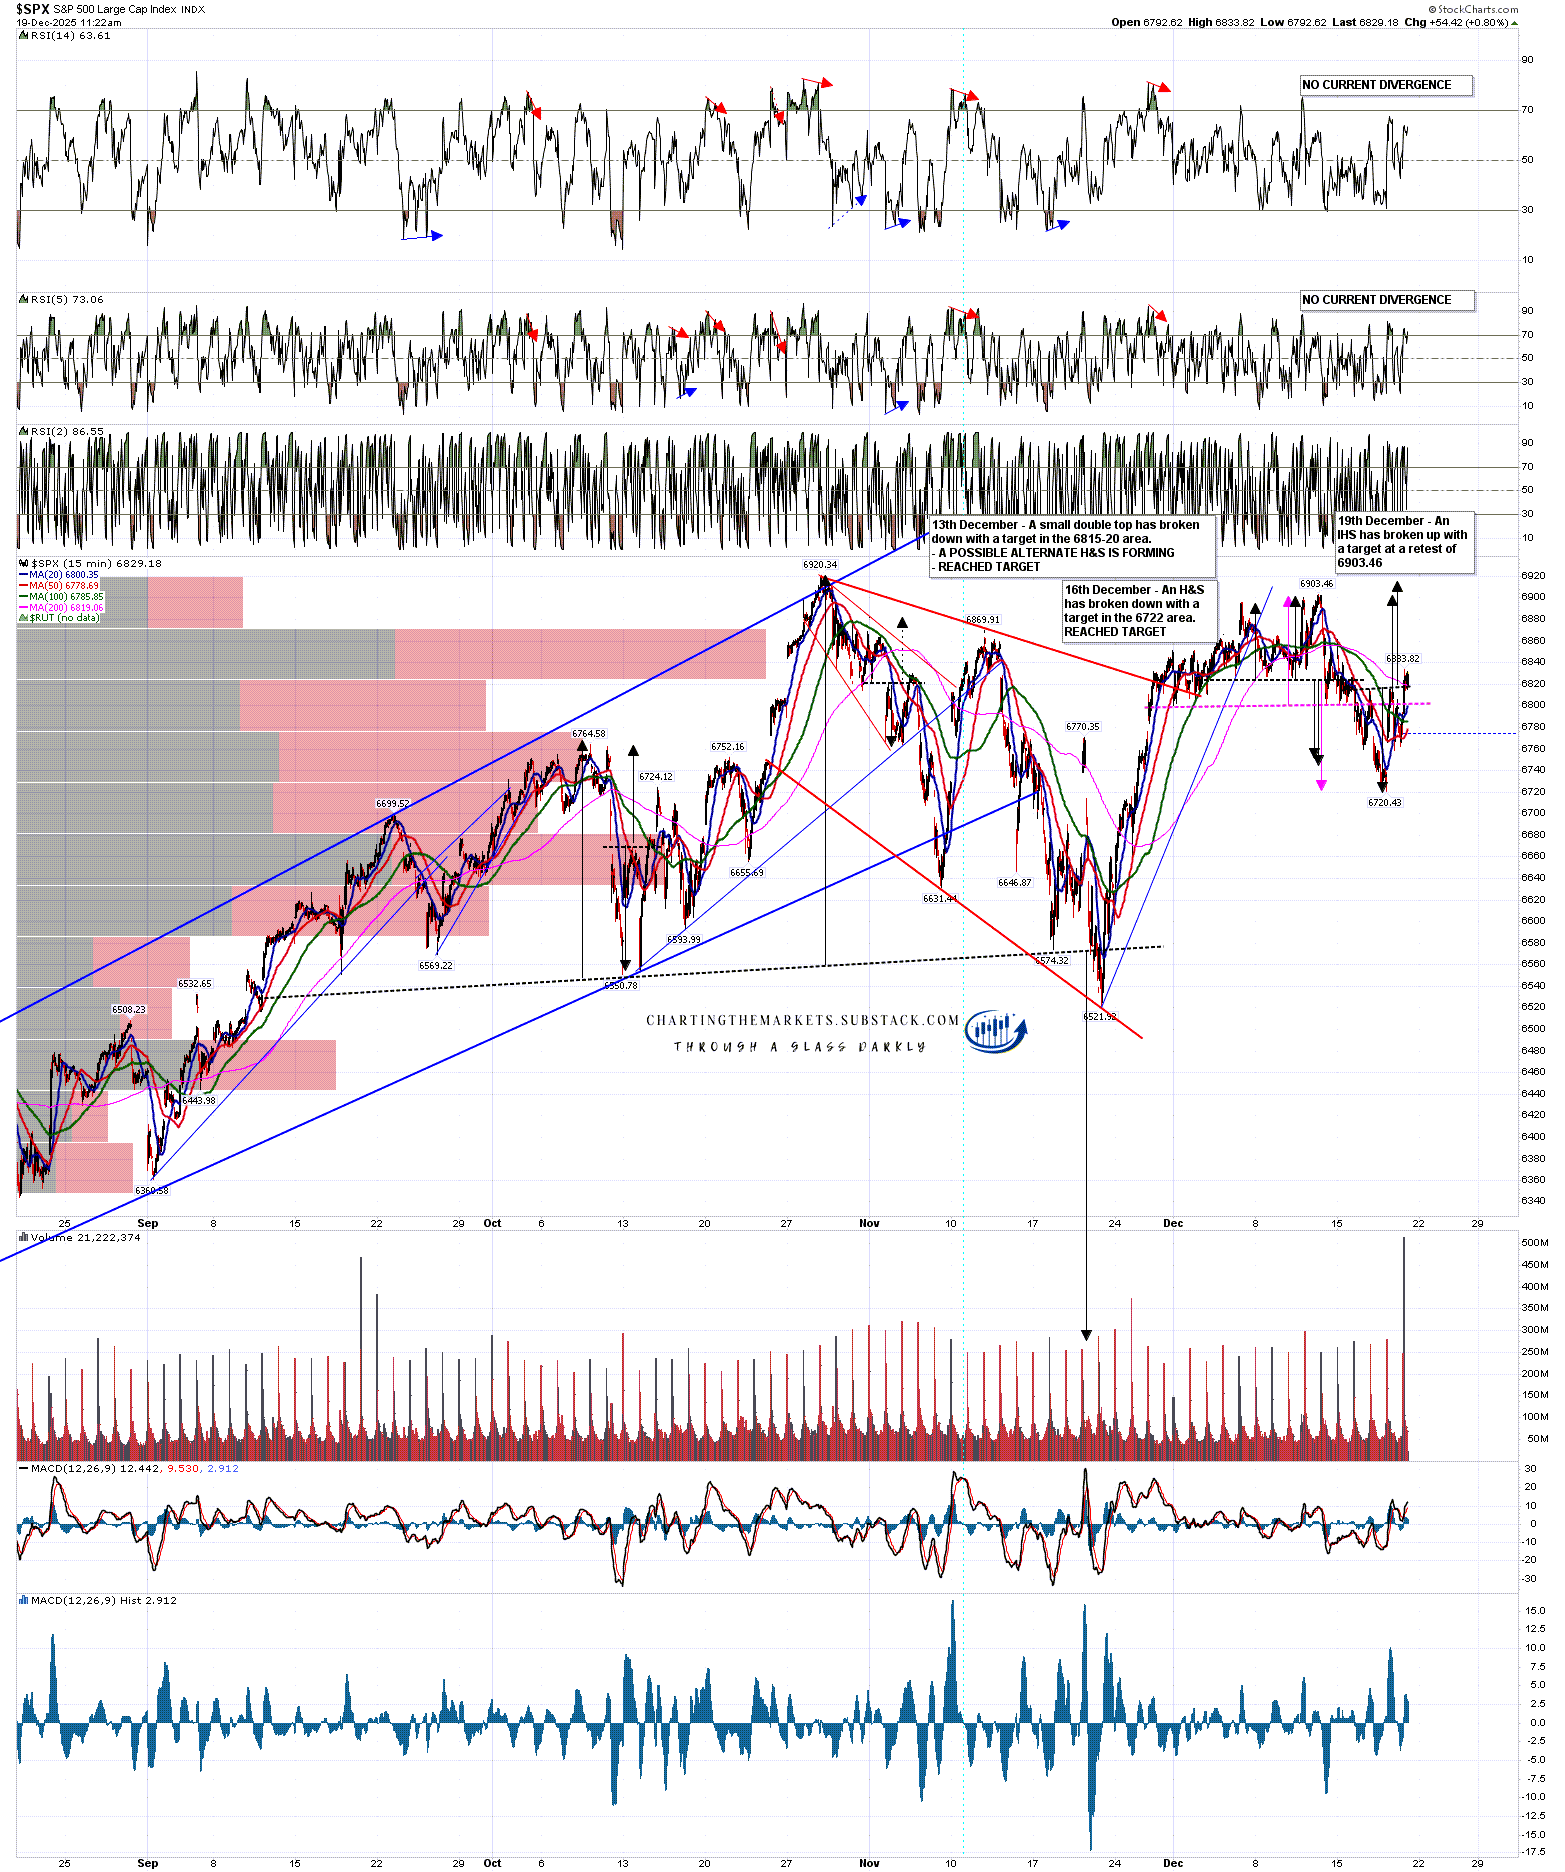
Looking at the setups on the shorter term charts on SPX, QQQ, DIA and IWM, the setup is clearest on SPX and I’ve marked that up in detail for everyone to look at.
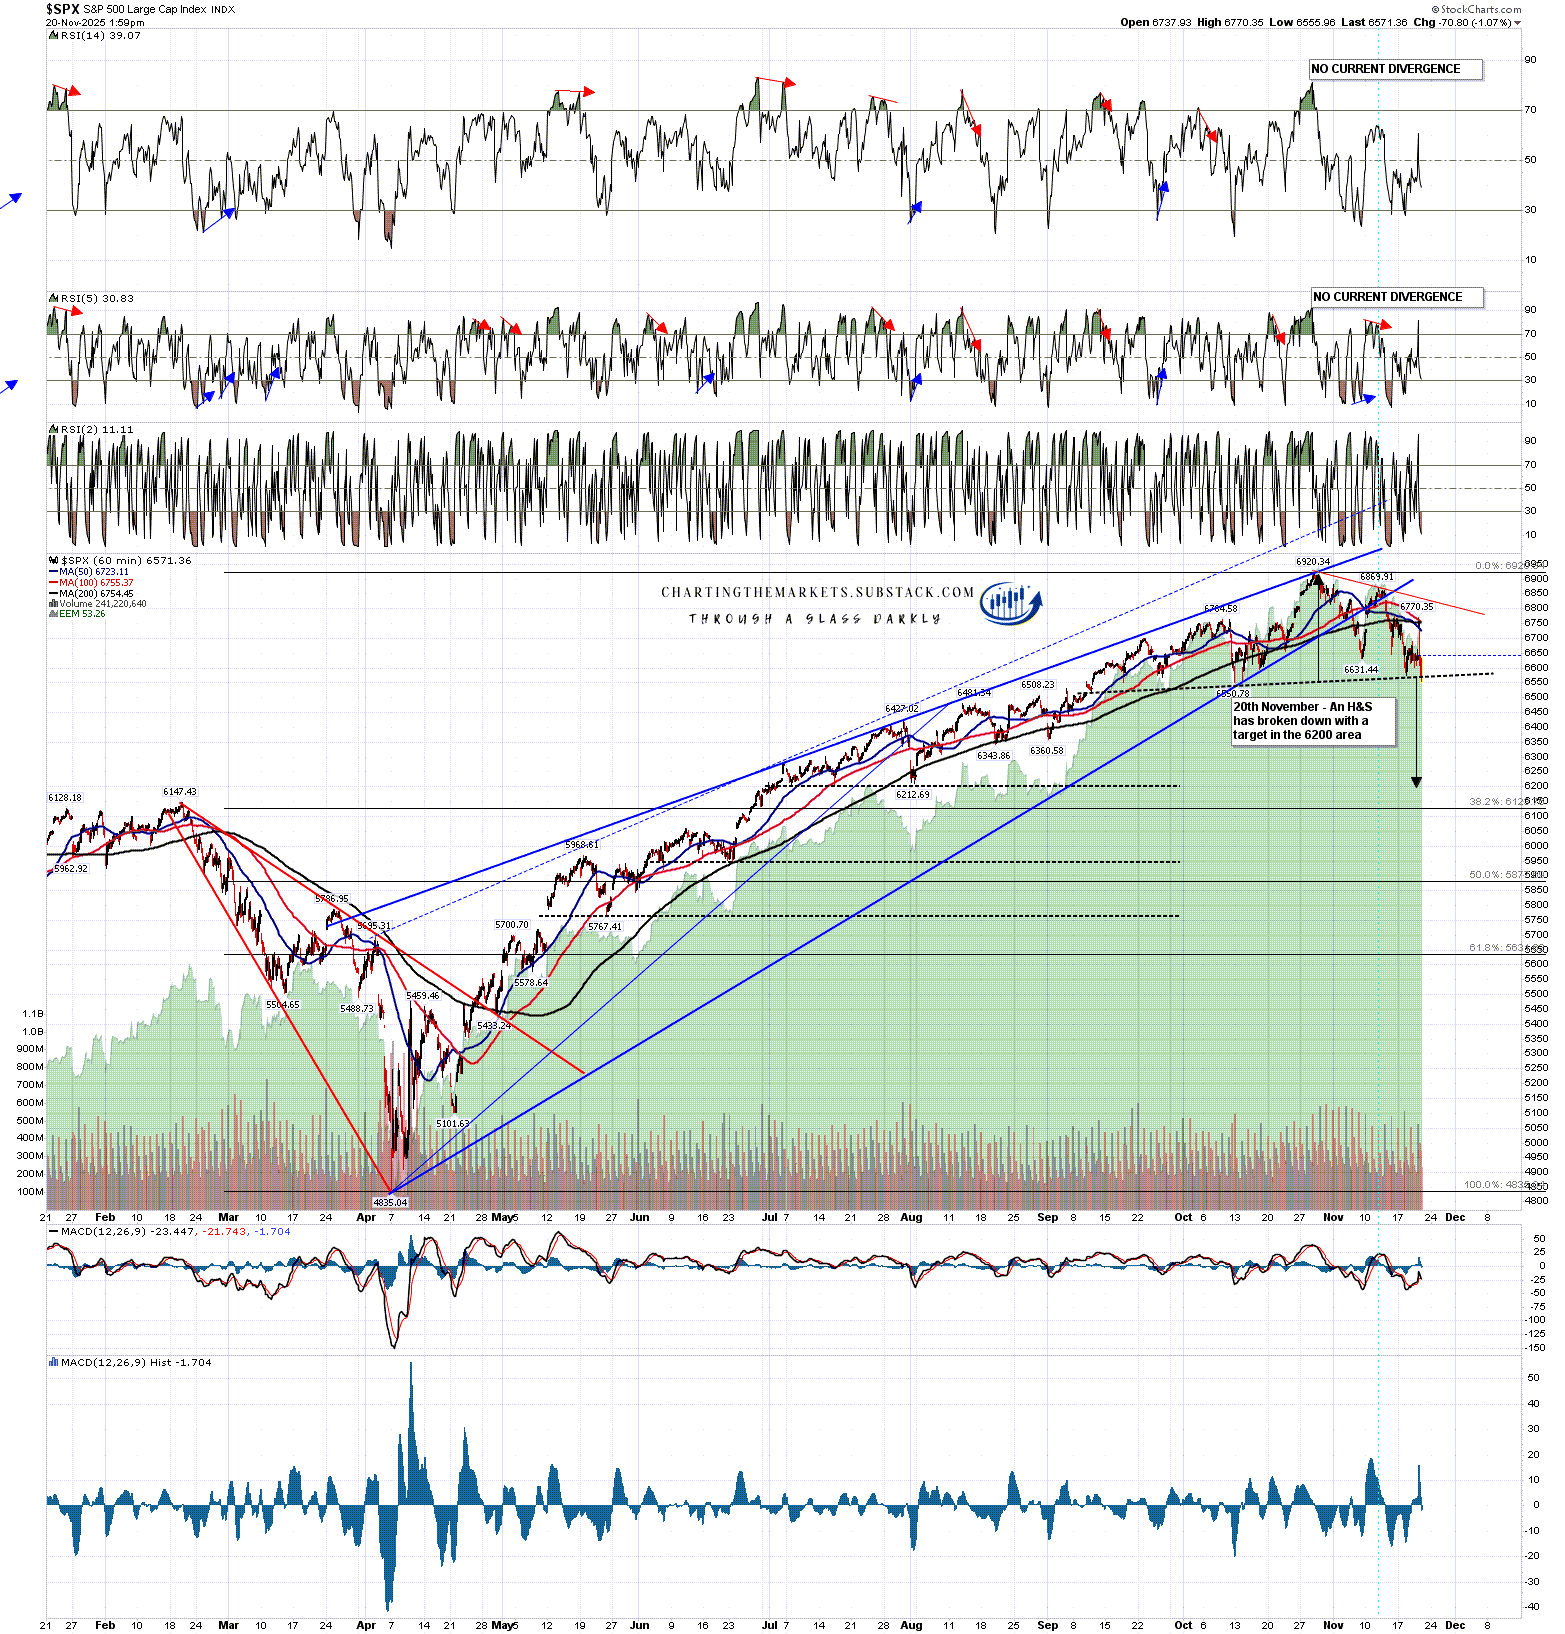
From the December high at 6903.46 a small double top formed and reached target in the 6815-20 area. As that was playing out a larger H&S formed and broke down with a target in the 6722 area and that reached target at the low on Wednesday.
From Wednesday’s low and IHS has formed and broken up with a target at a retest of 6903.46, completing a round-trip retracement sequence. I’m not seeing anything at the time of writing to suggest this IHS won’t reach target.
SPX 15min chart:
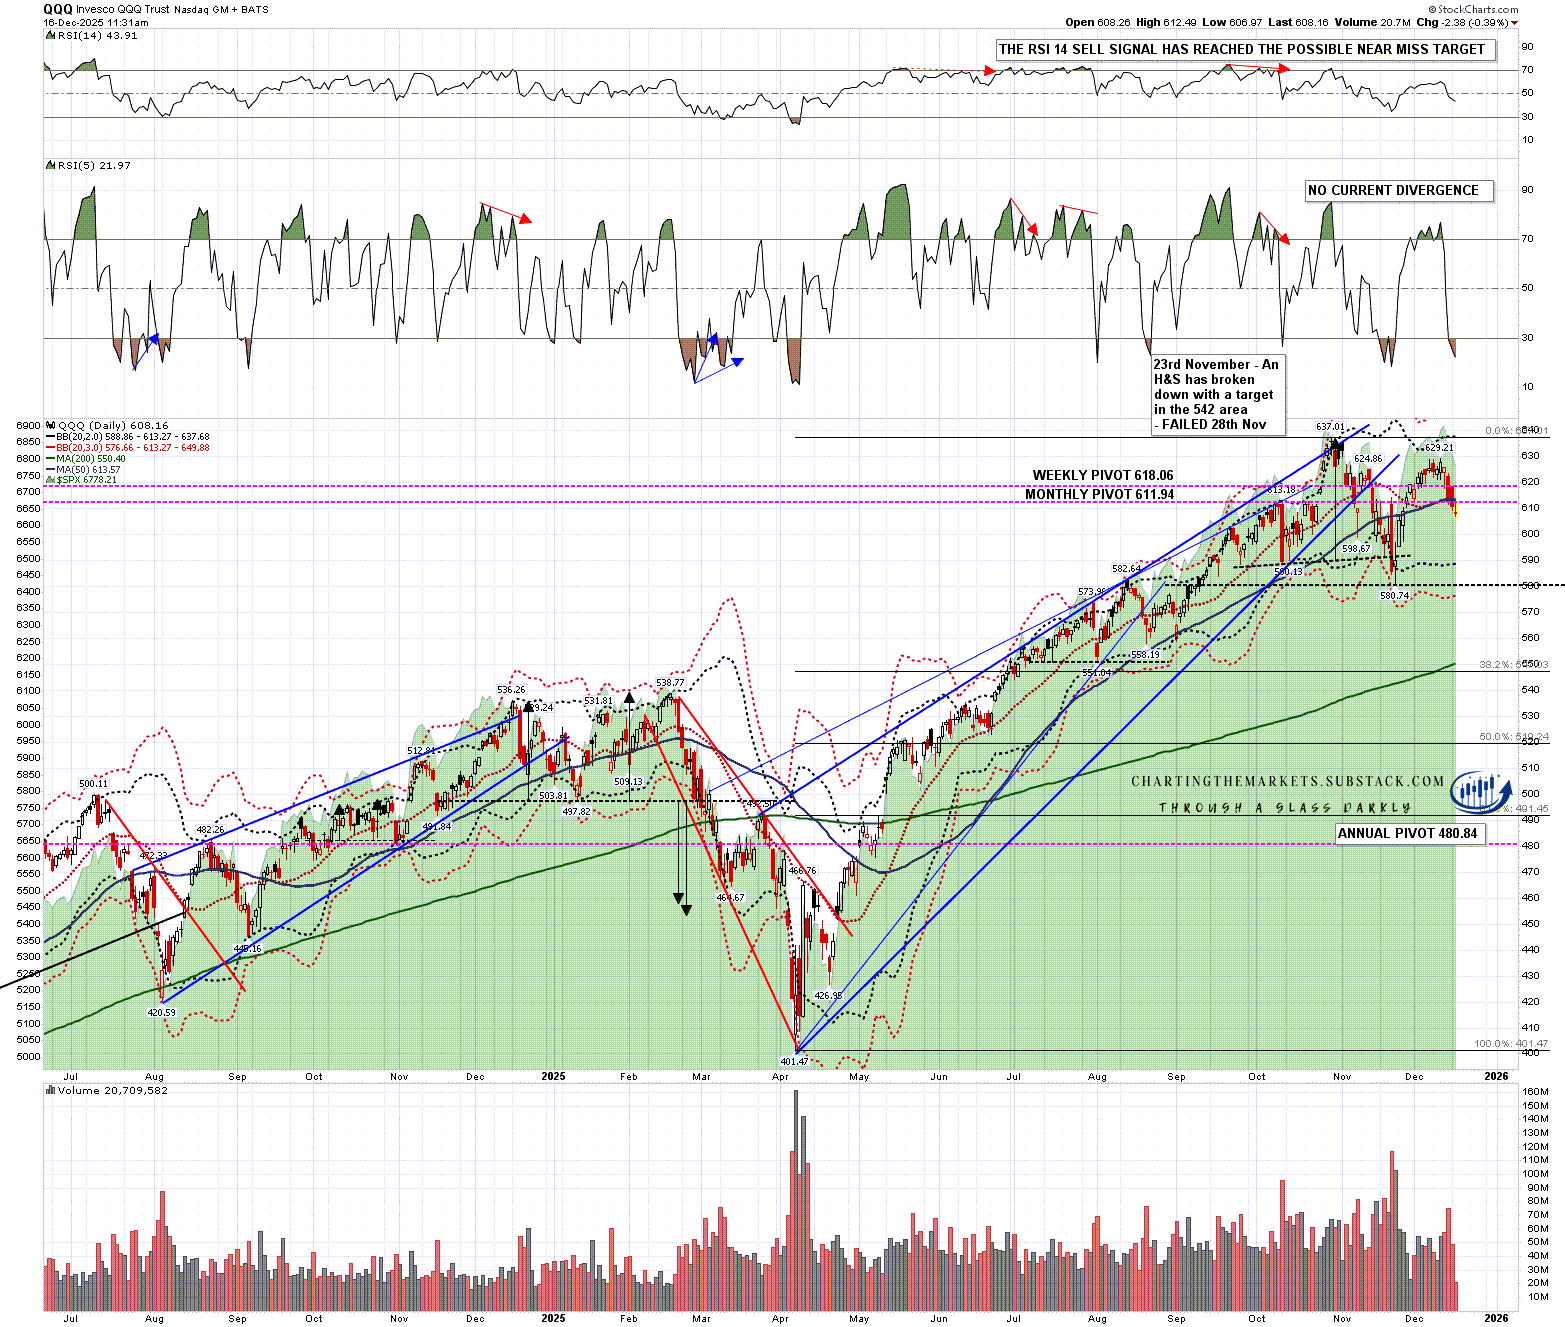
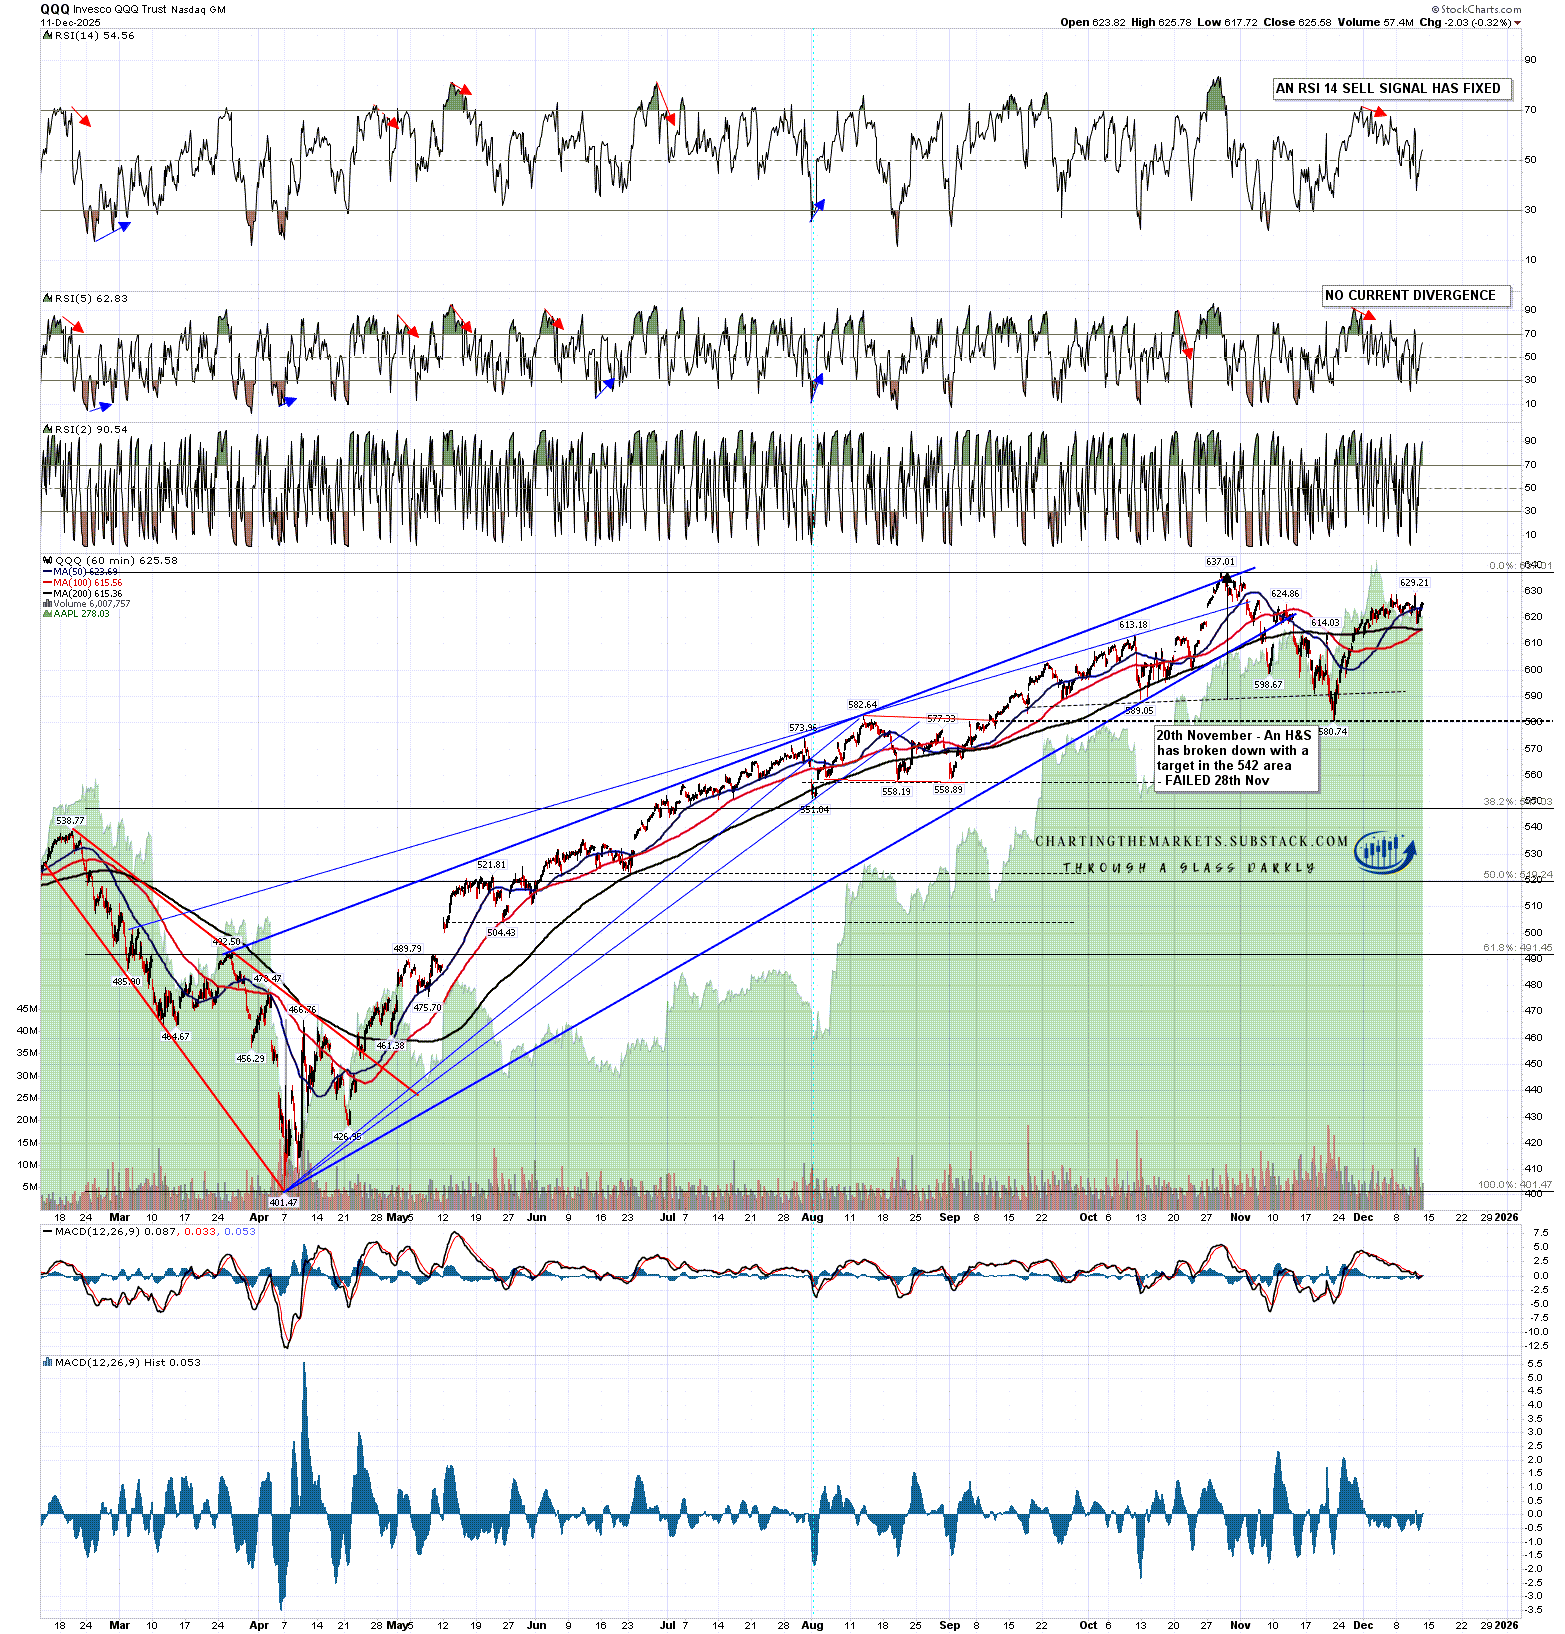
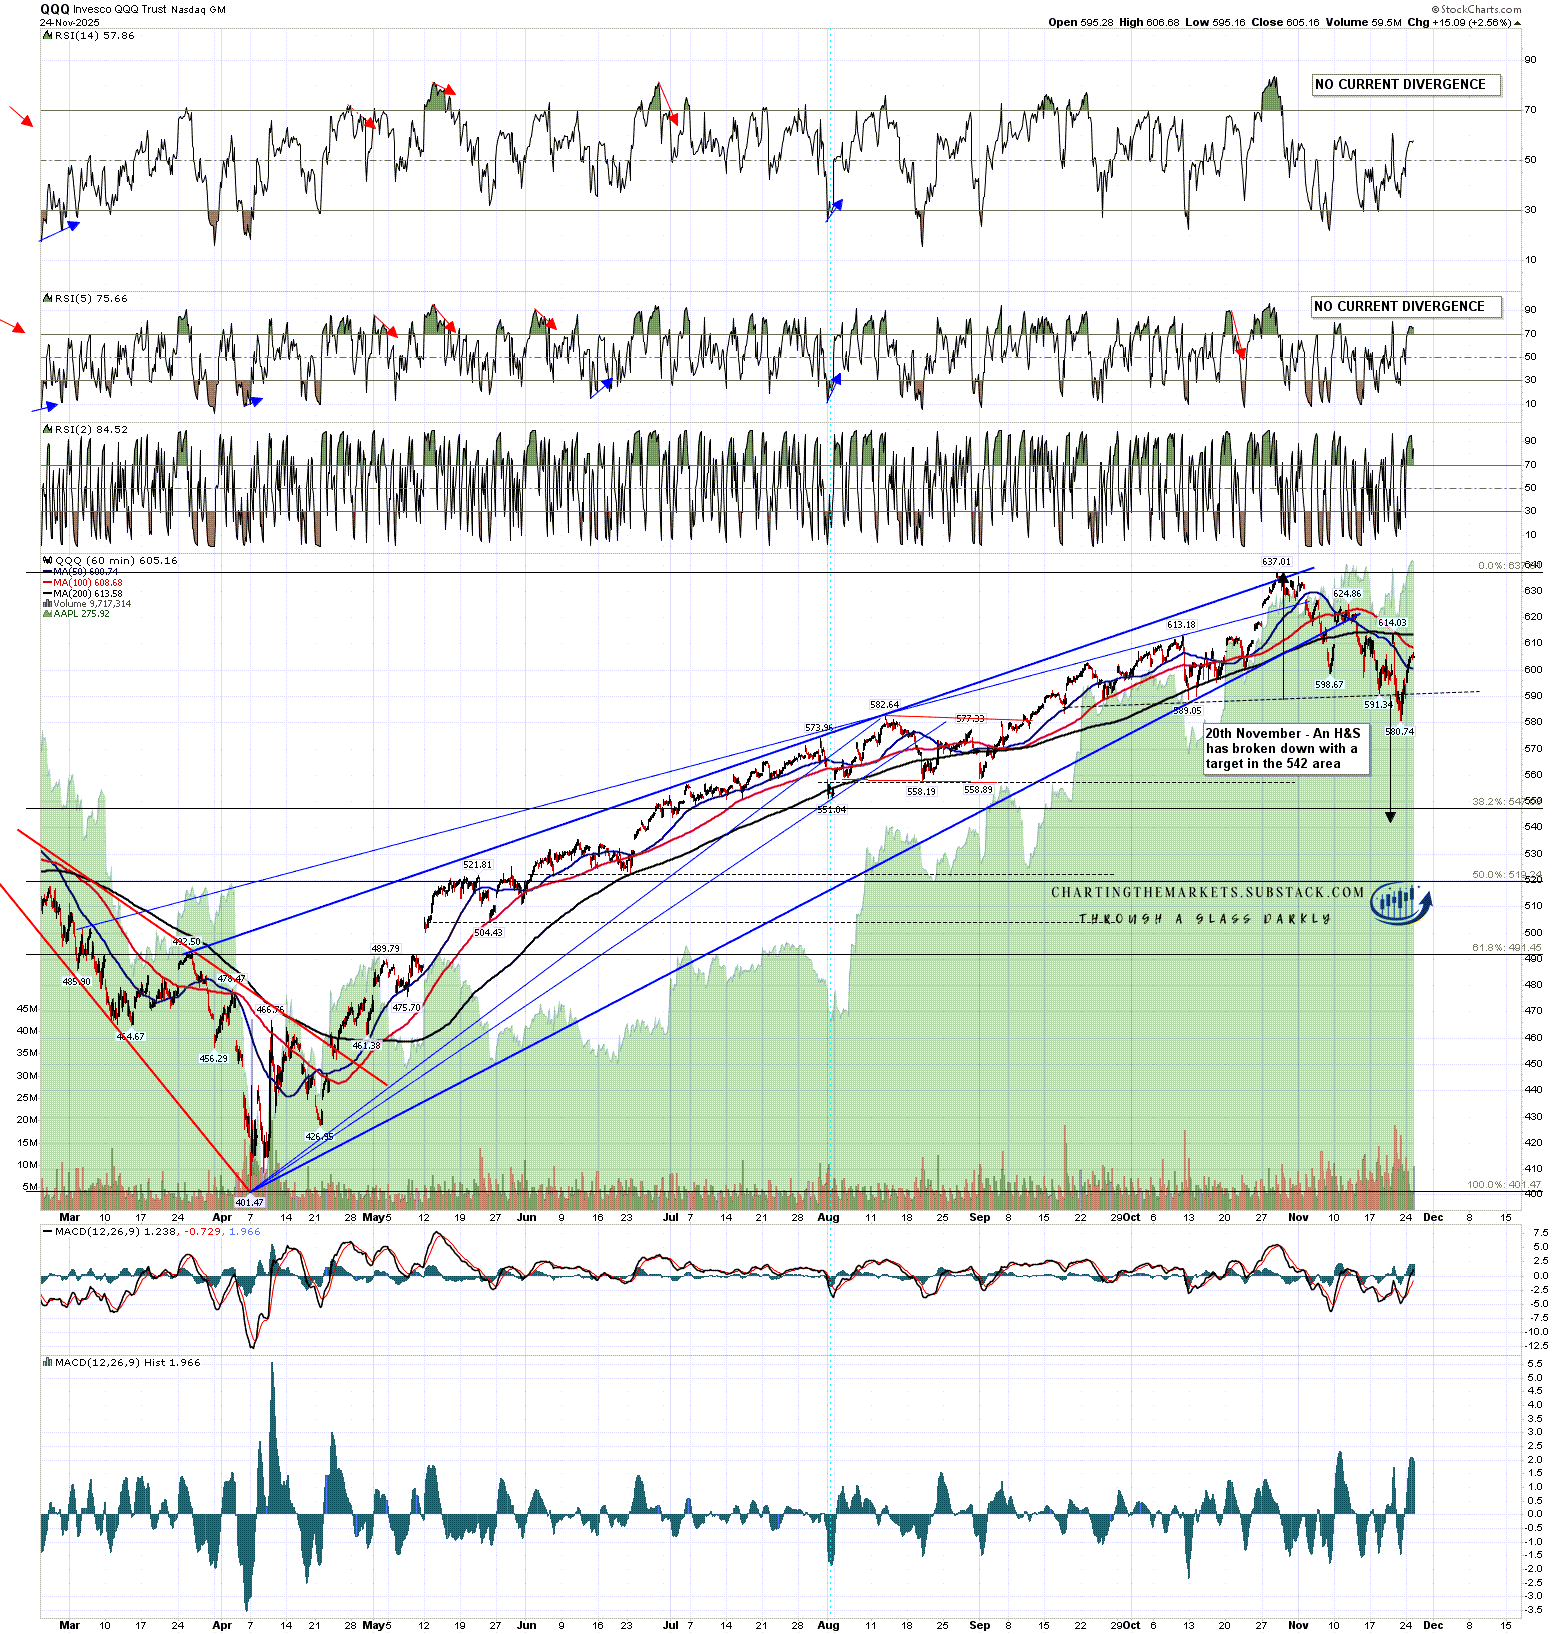
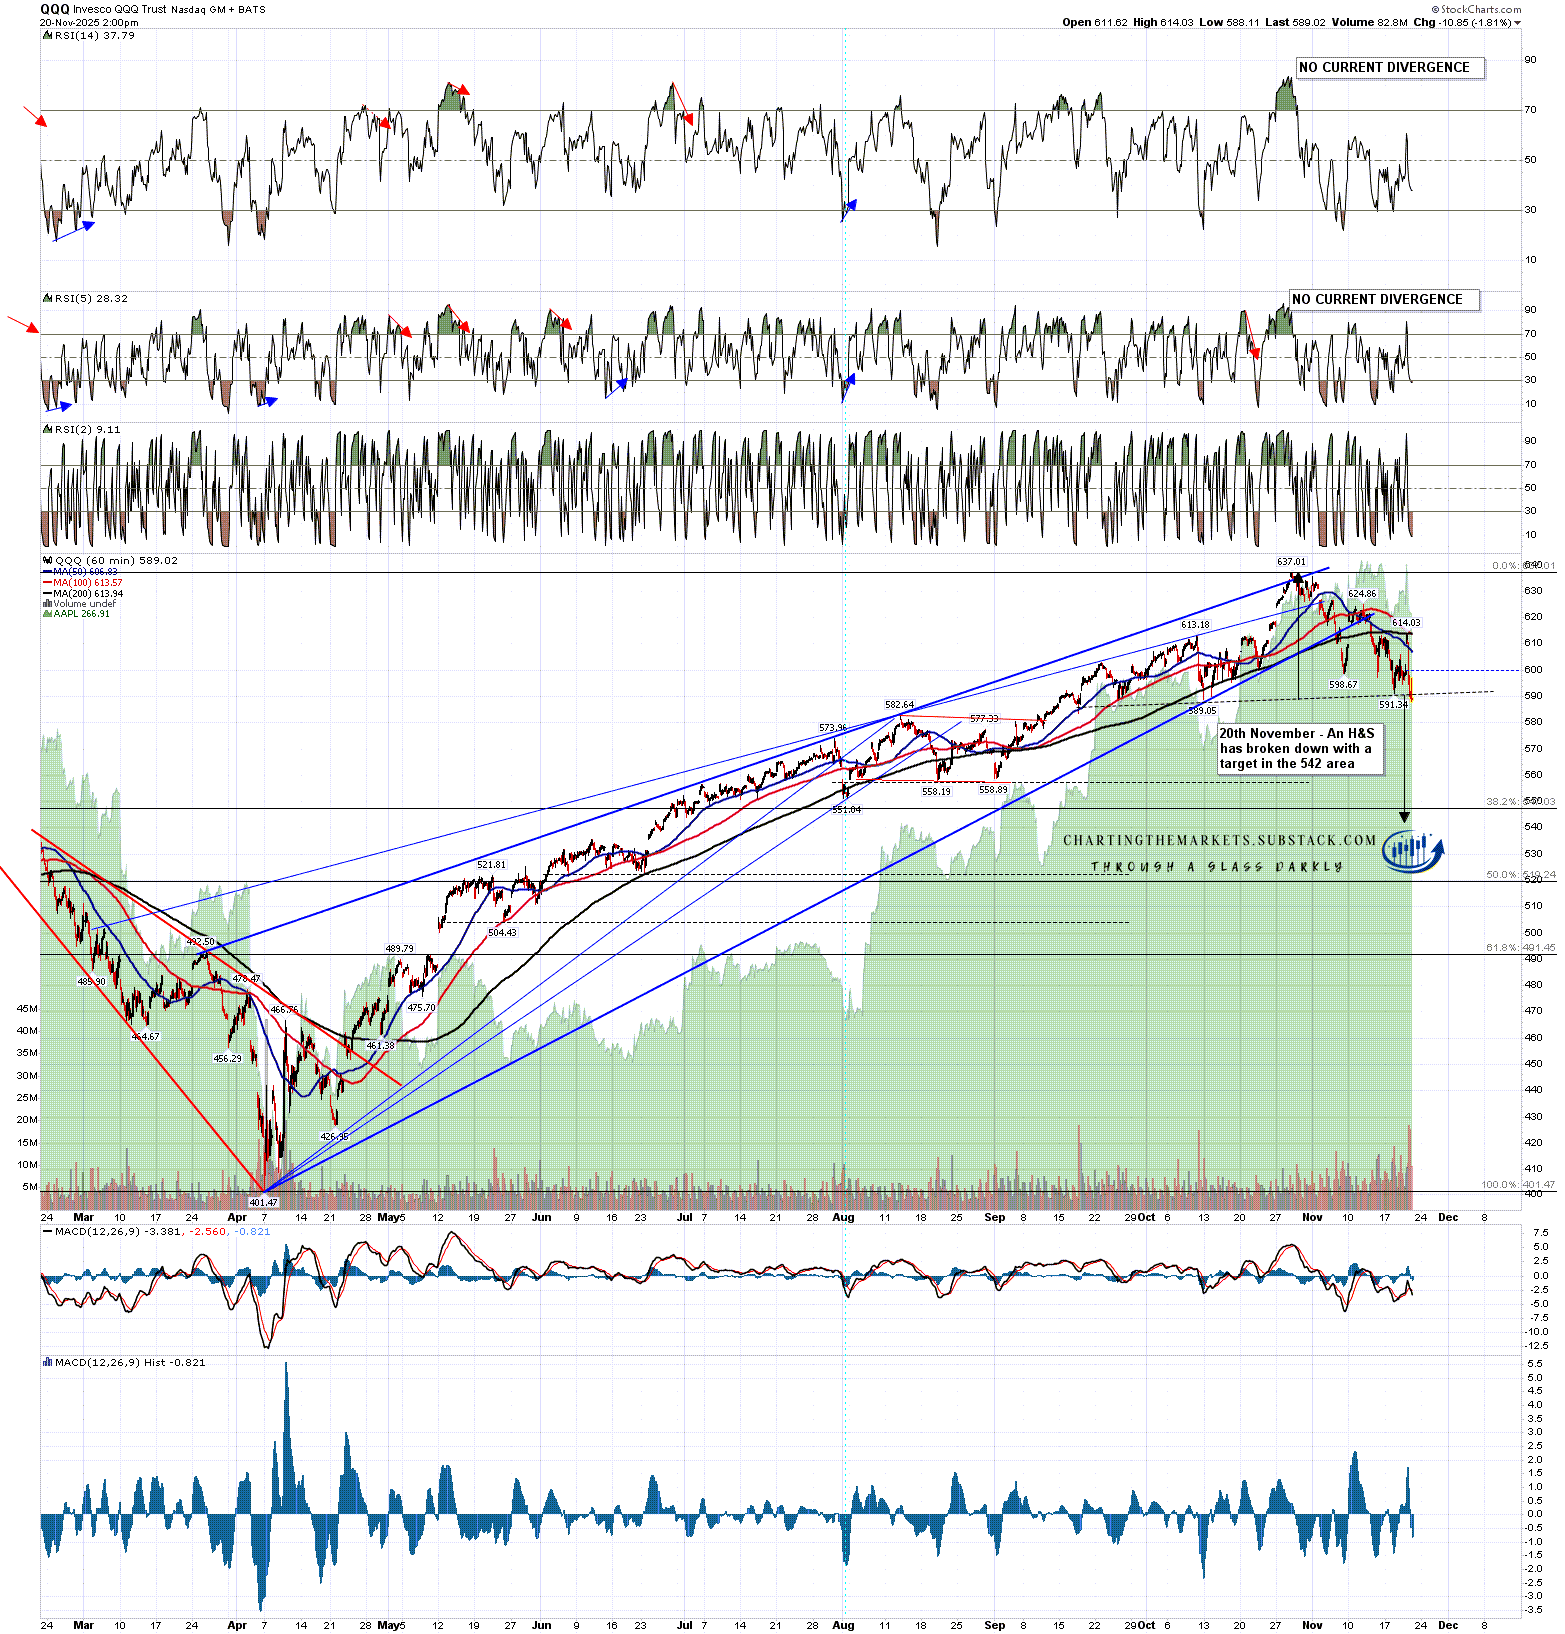
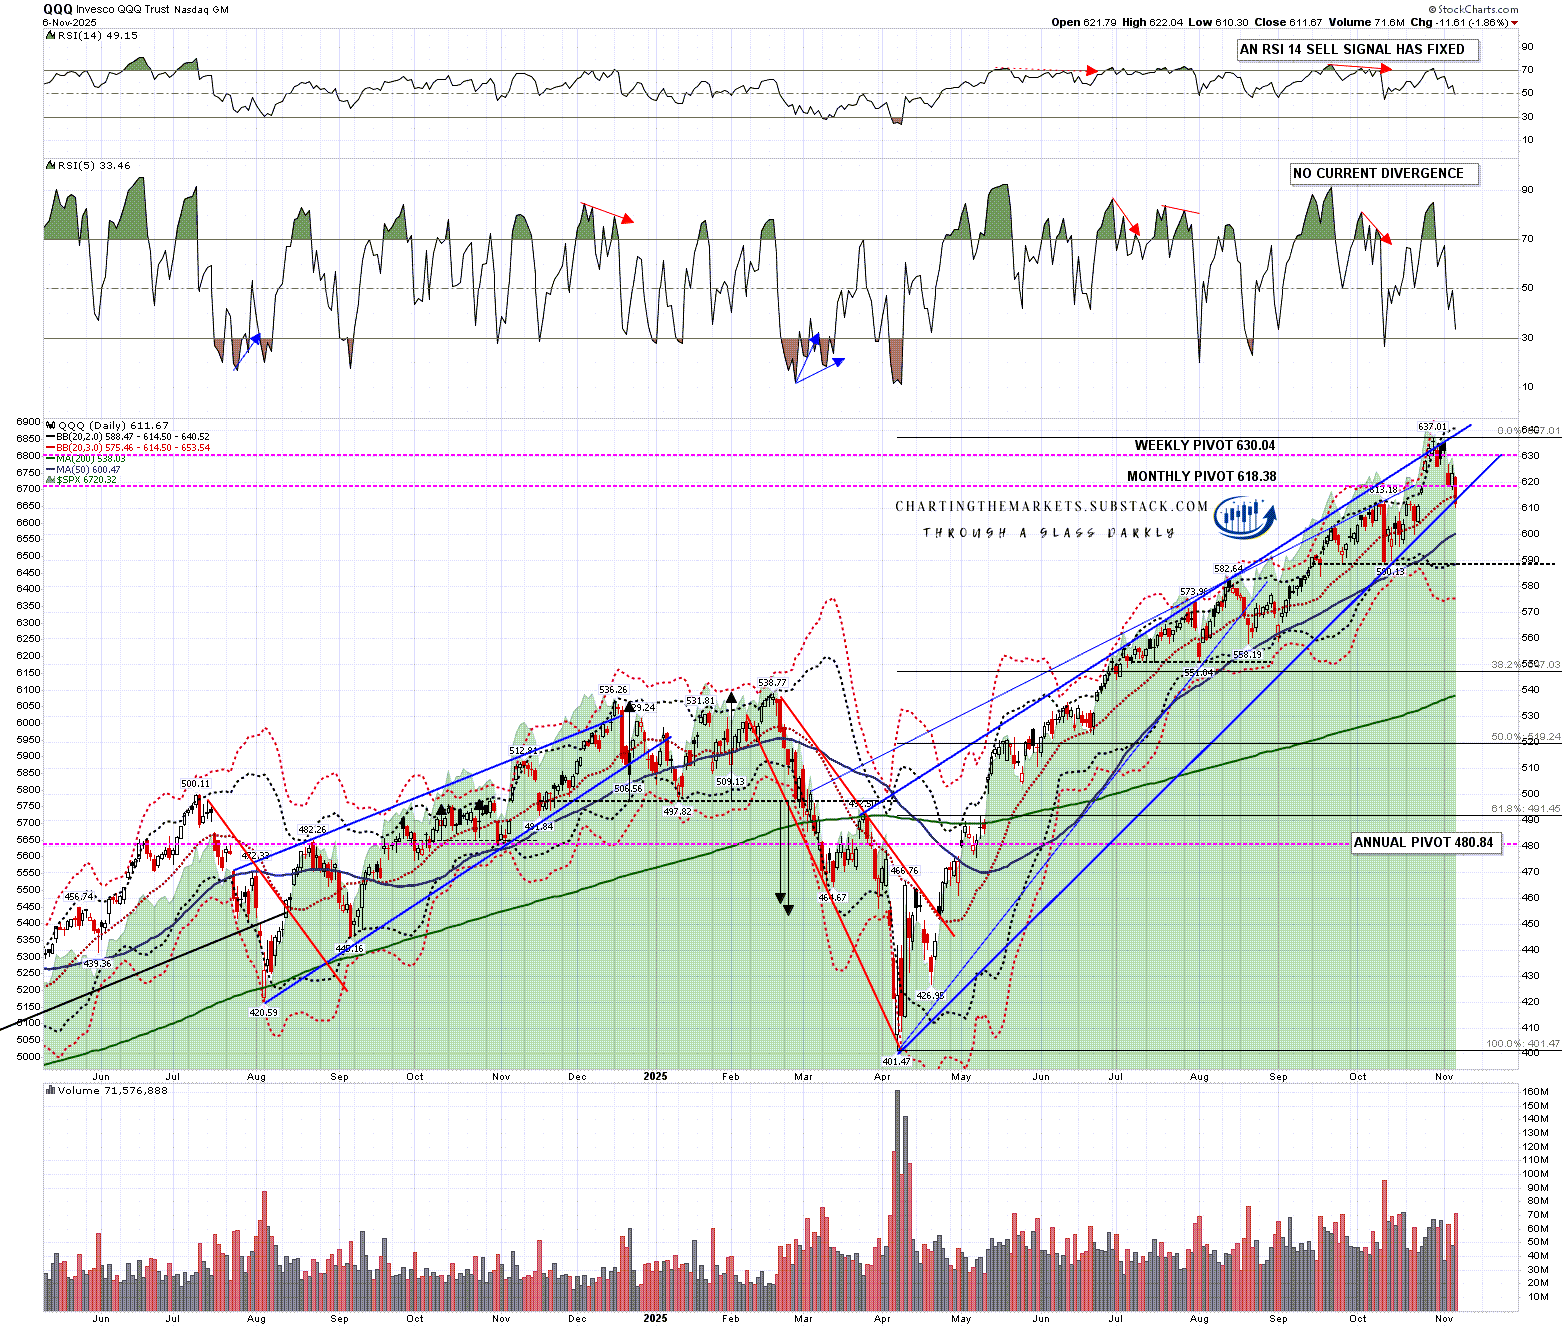
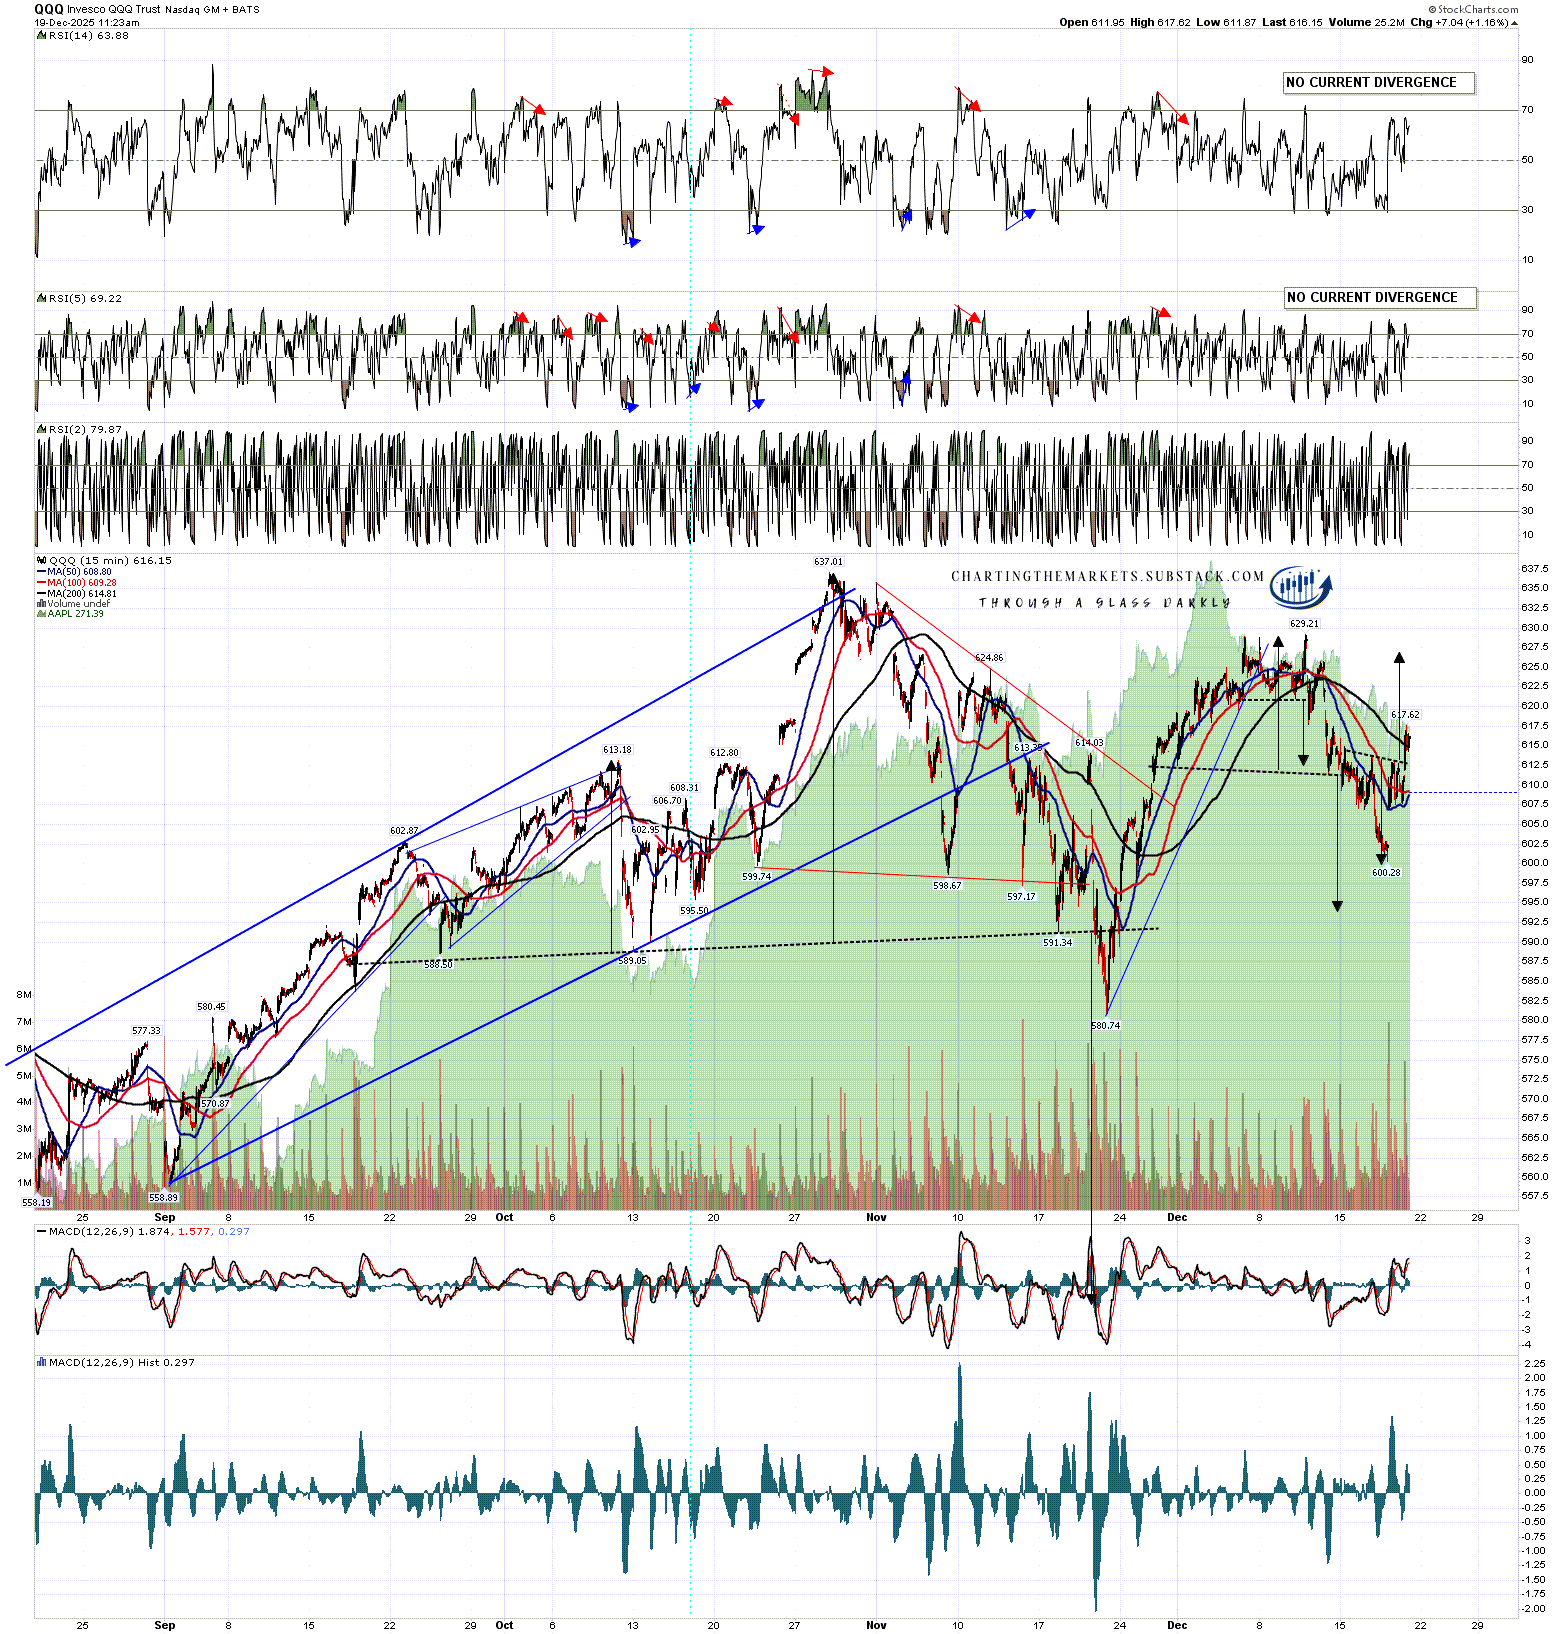
On QQQ the sequence was similar, with the initial double top that reached target, but a larger H&S that failed on a break over the right shoulder high this morning, and an IHS that has formed and broken up with a target in the 627.50 area, close to the December high at 629.21.
I mention regularly that when H&S patterns fail, they often fail after an H&S pattern has formed in the opposite direction and this is a good example of that.
QQQ 15min chart:
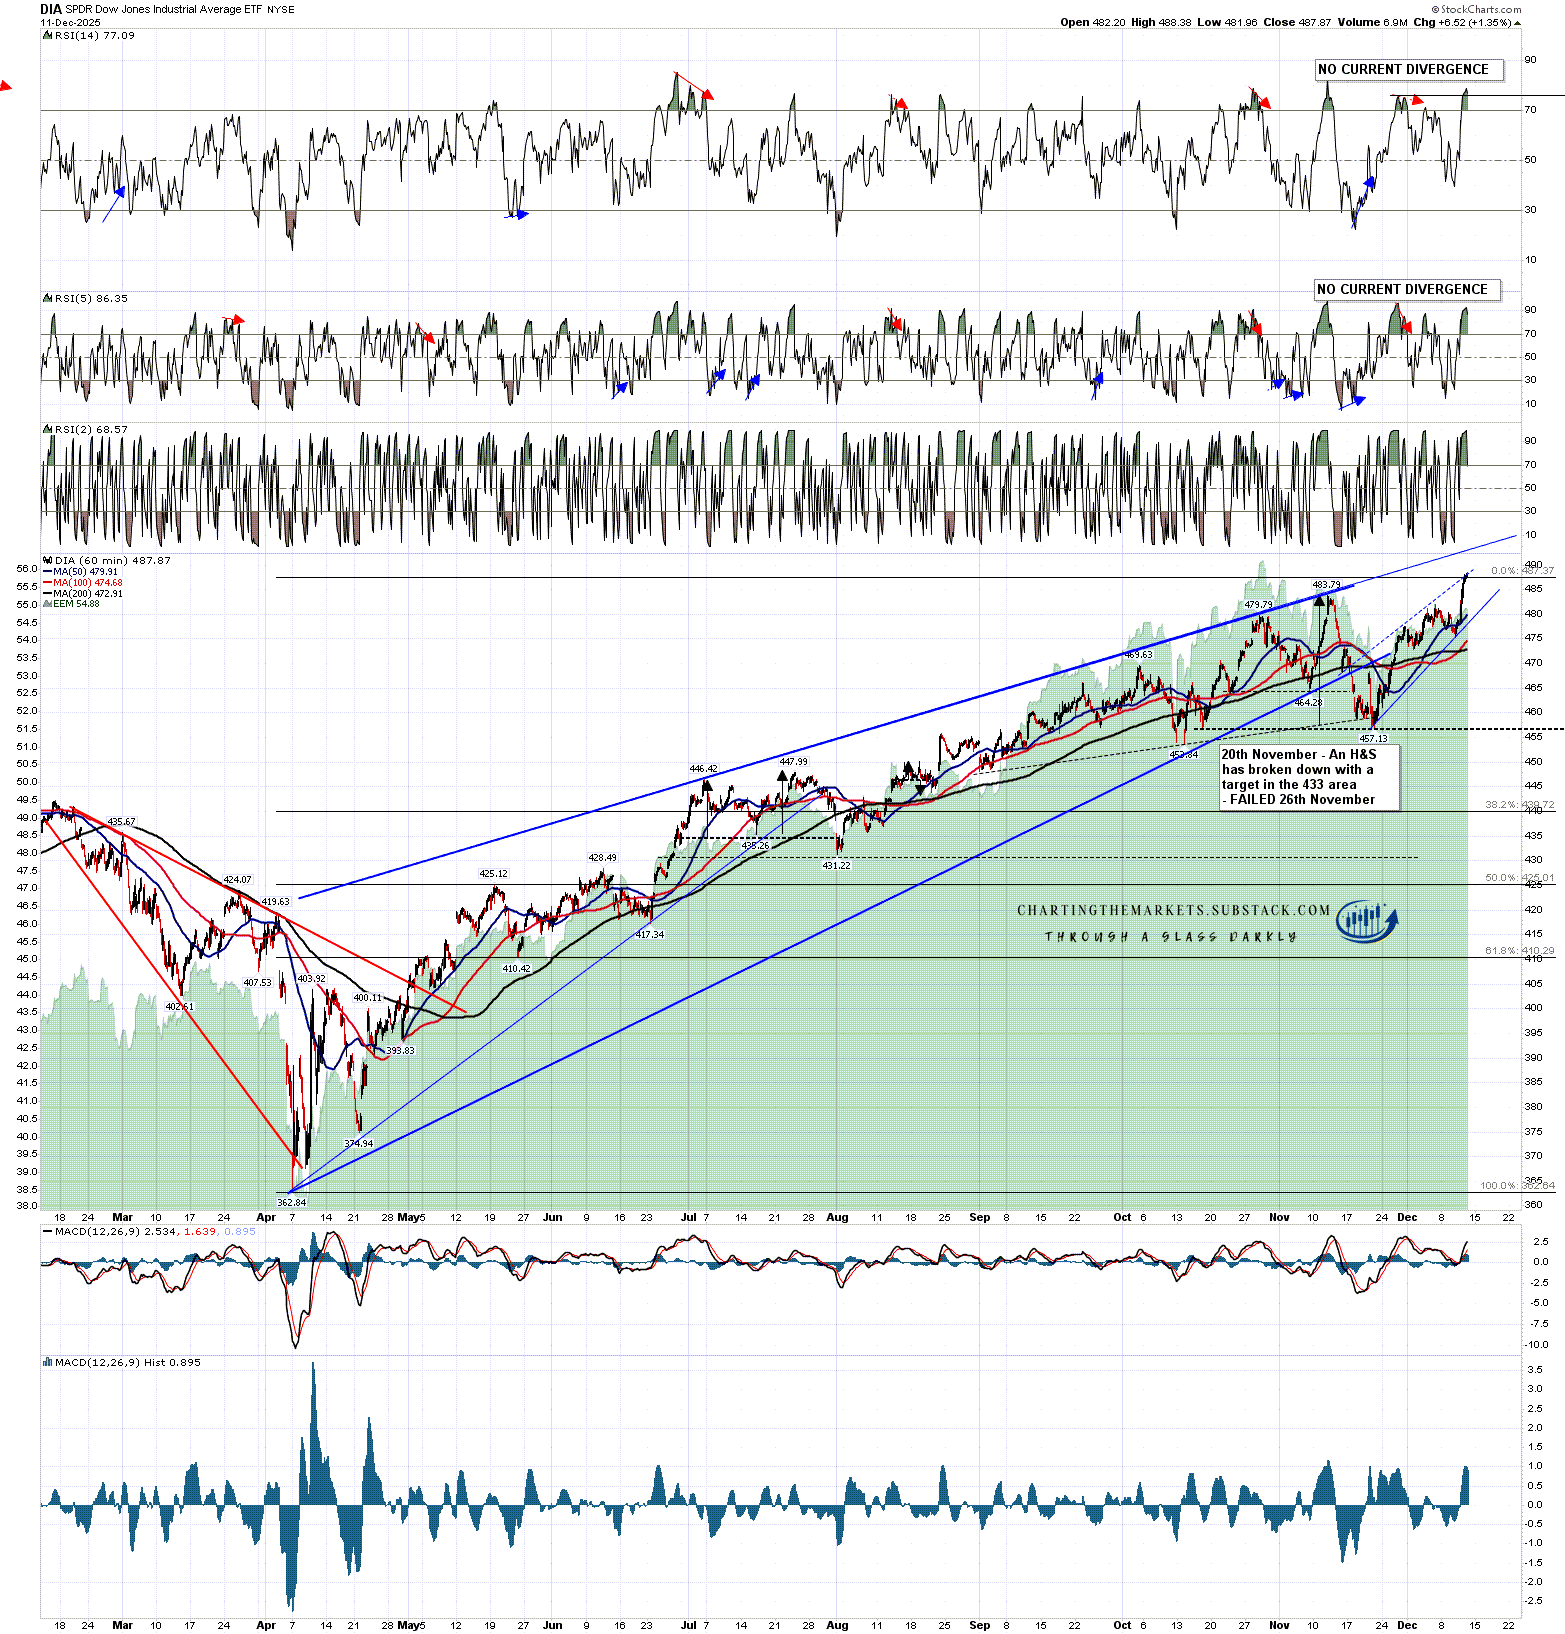
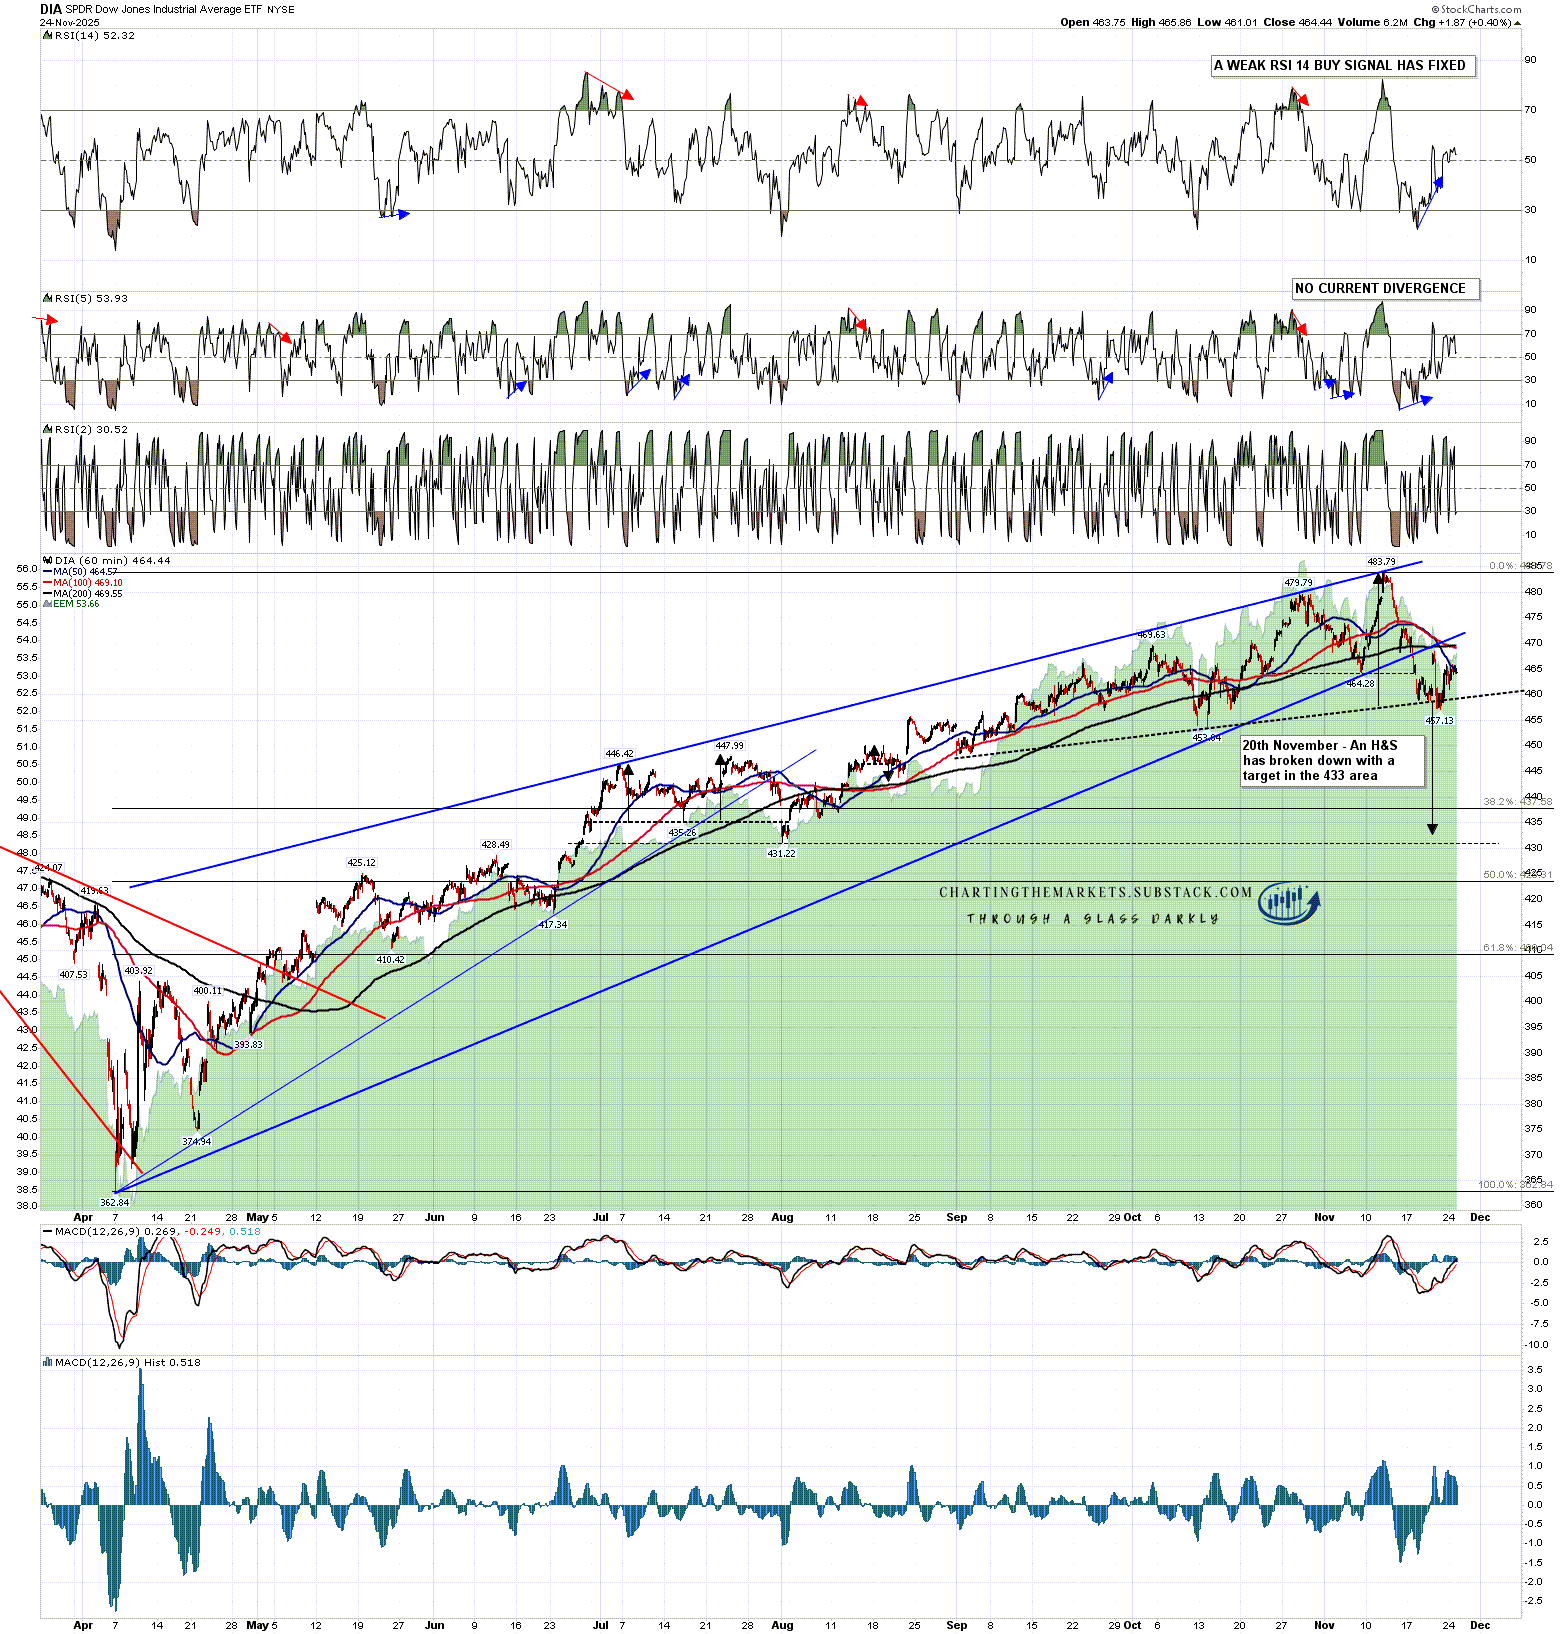
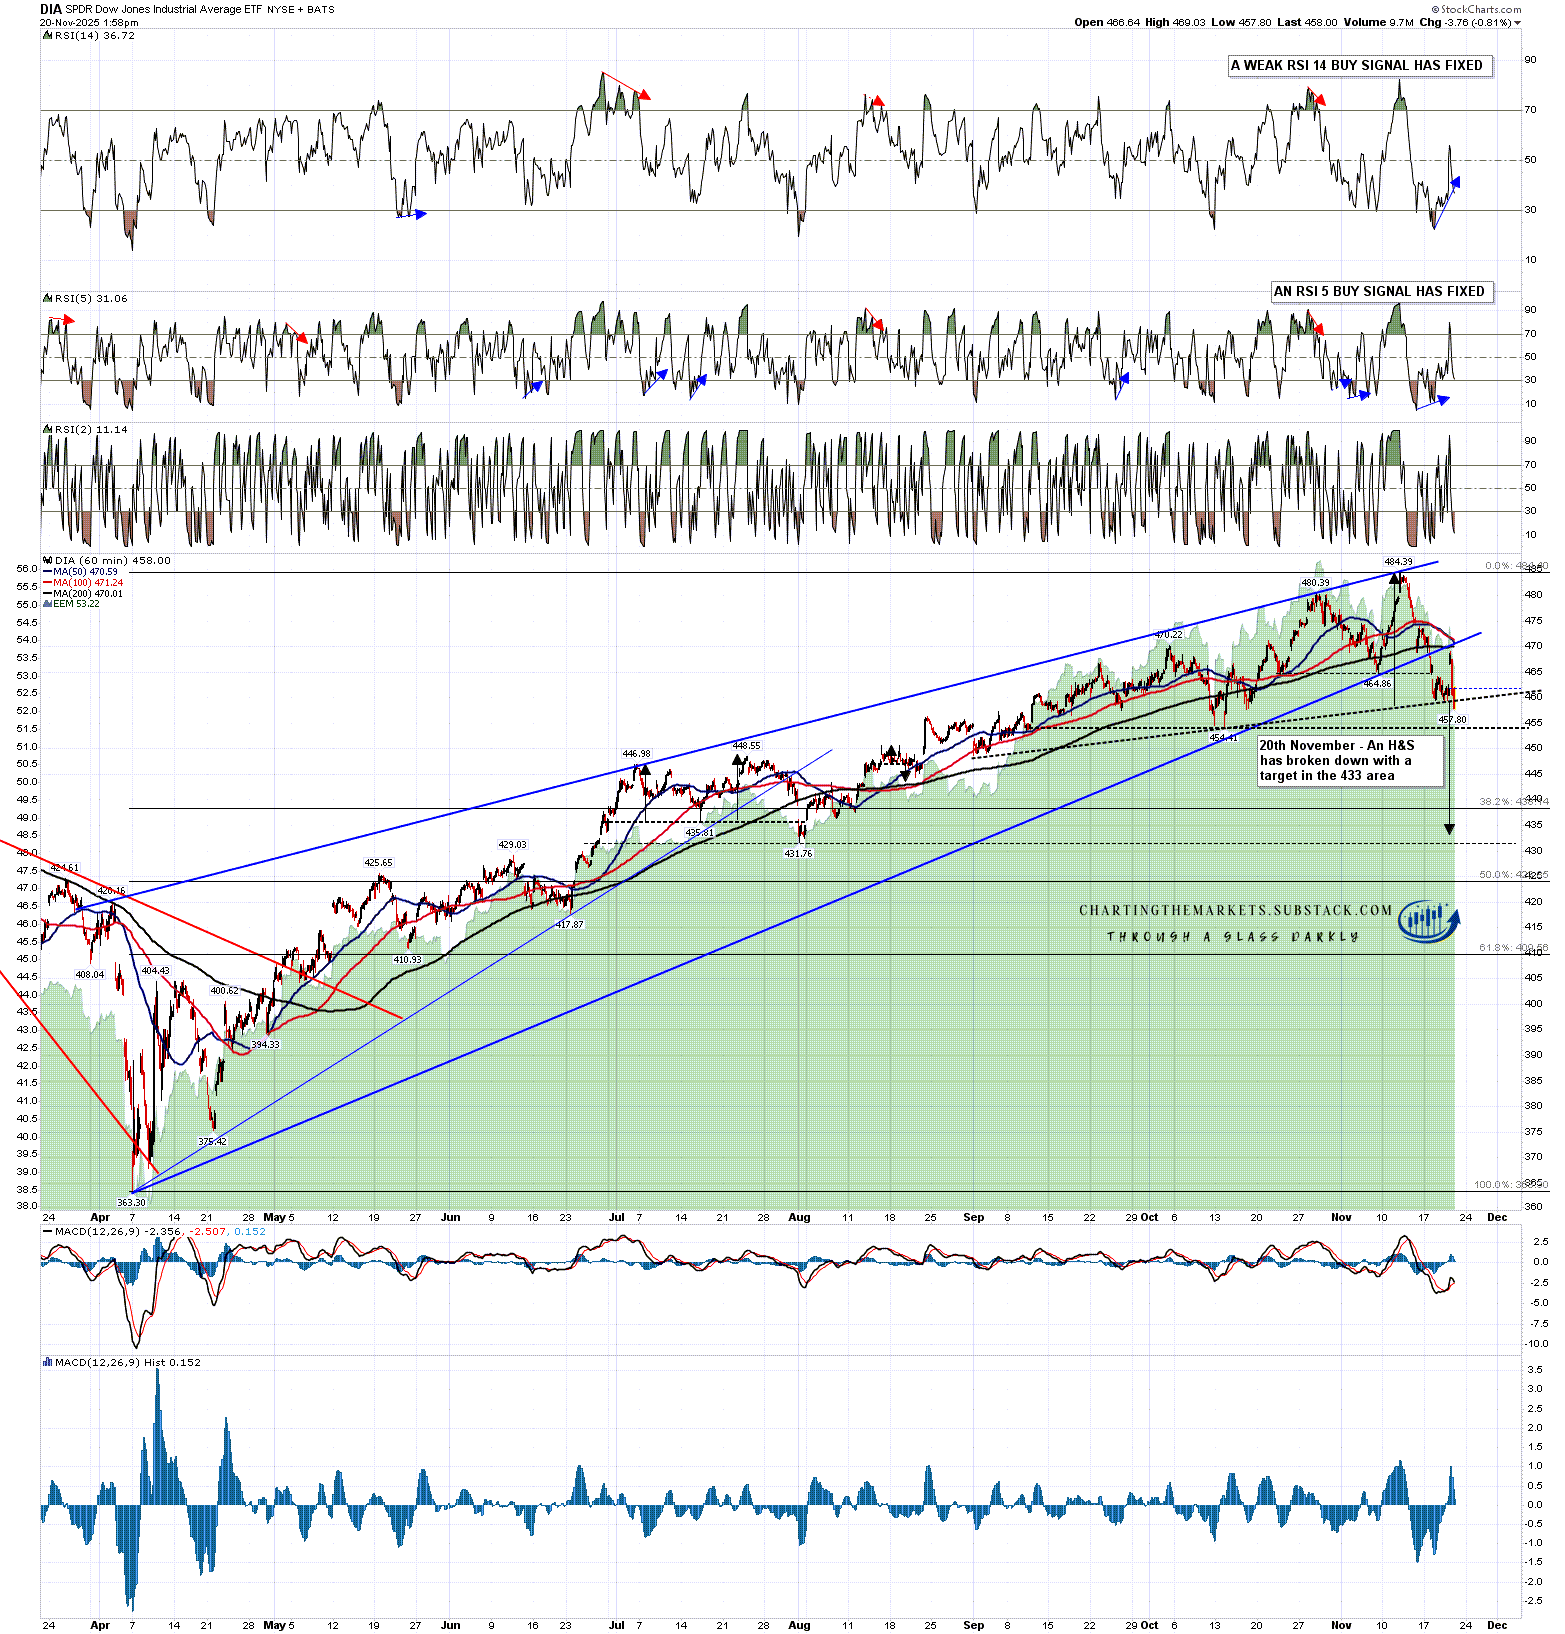
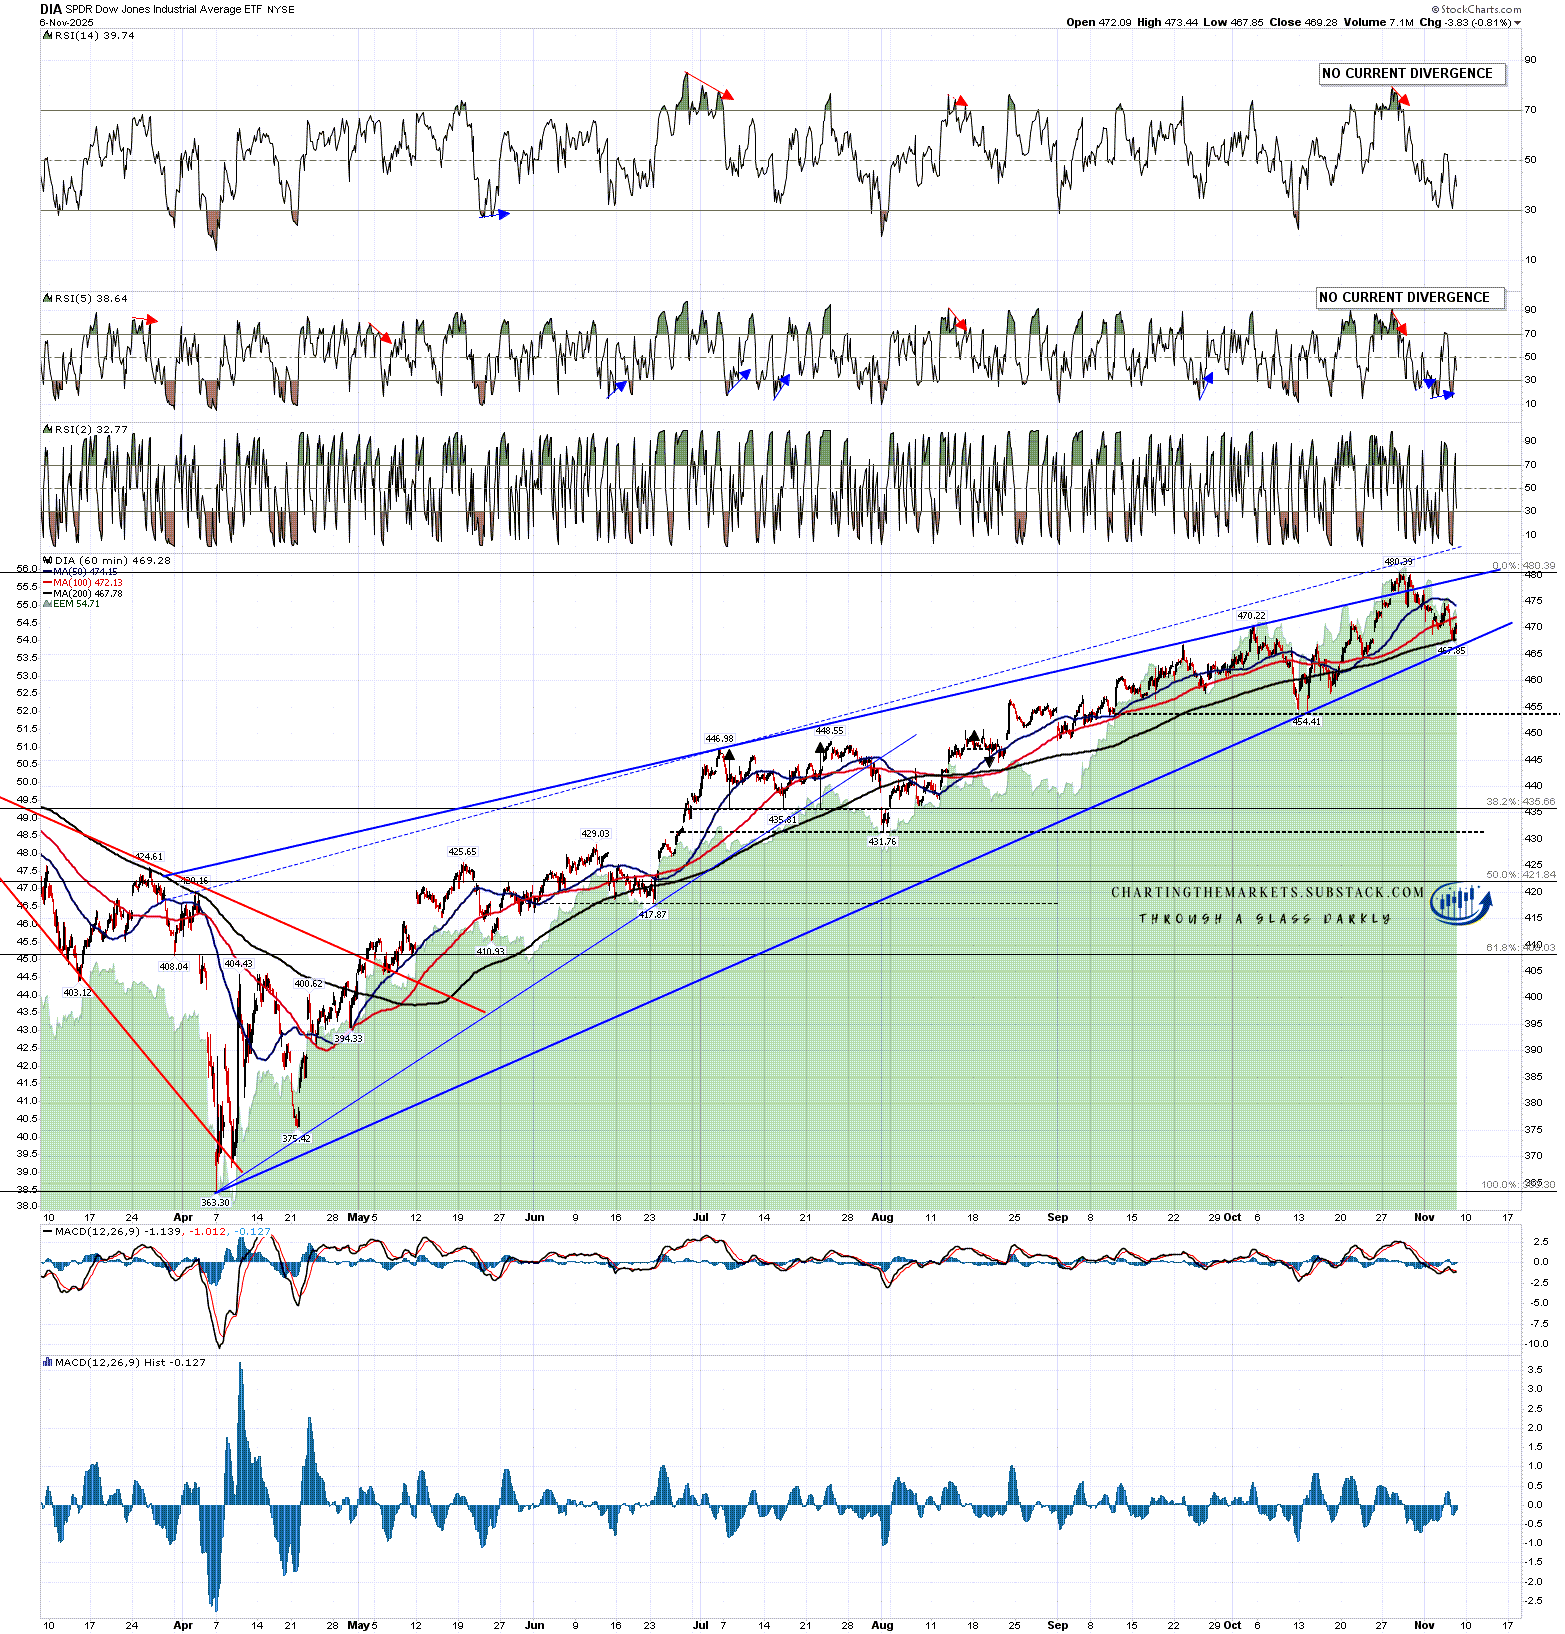
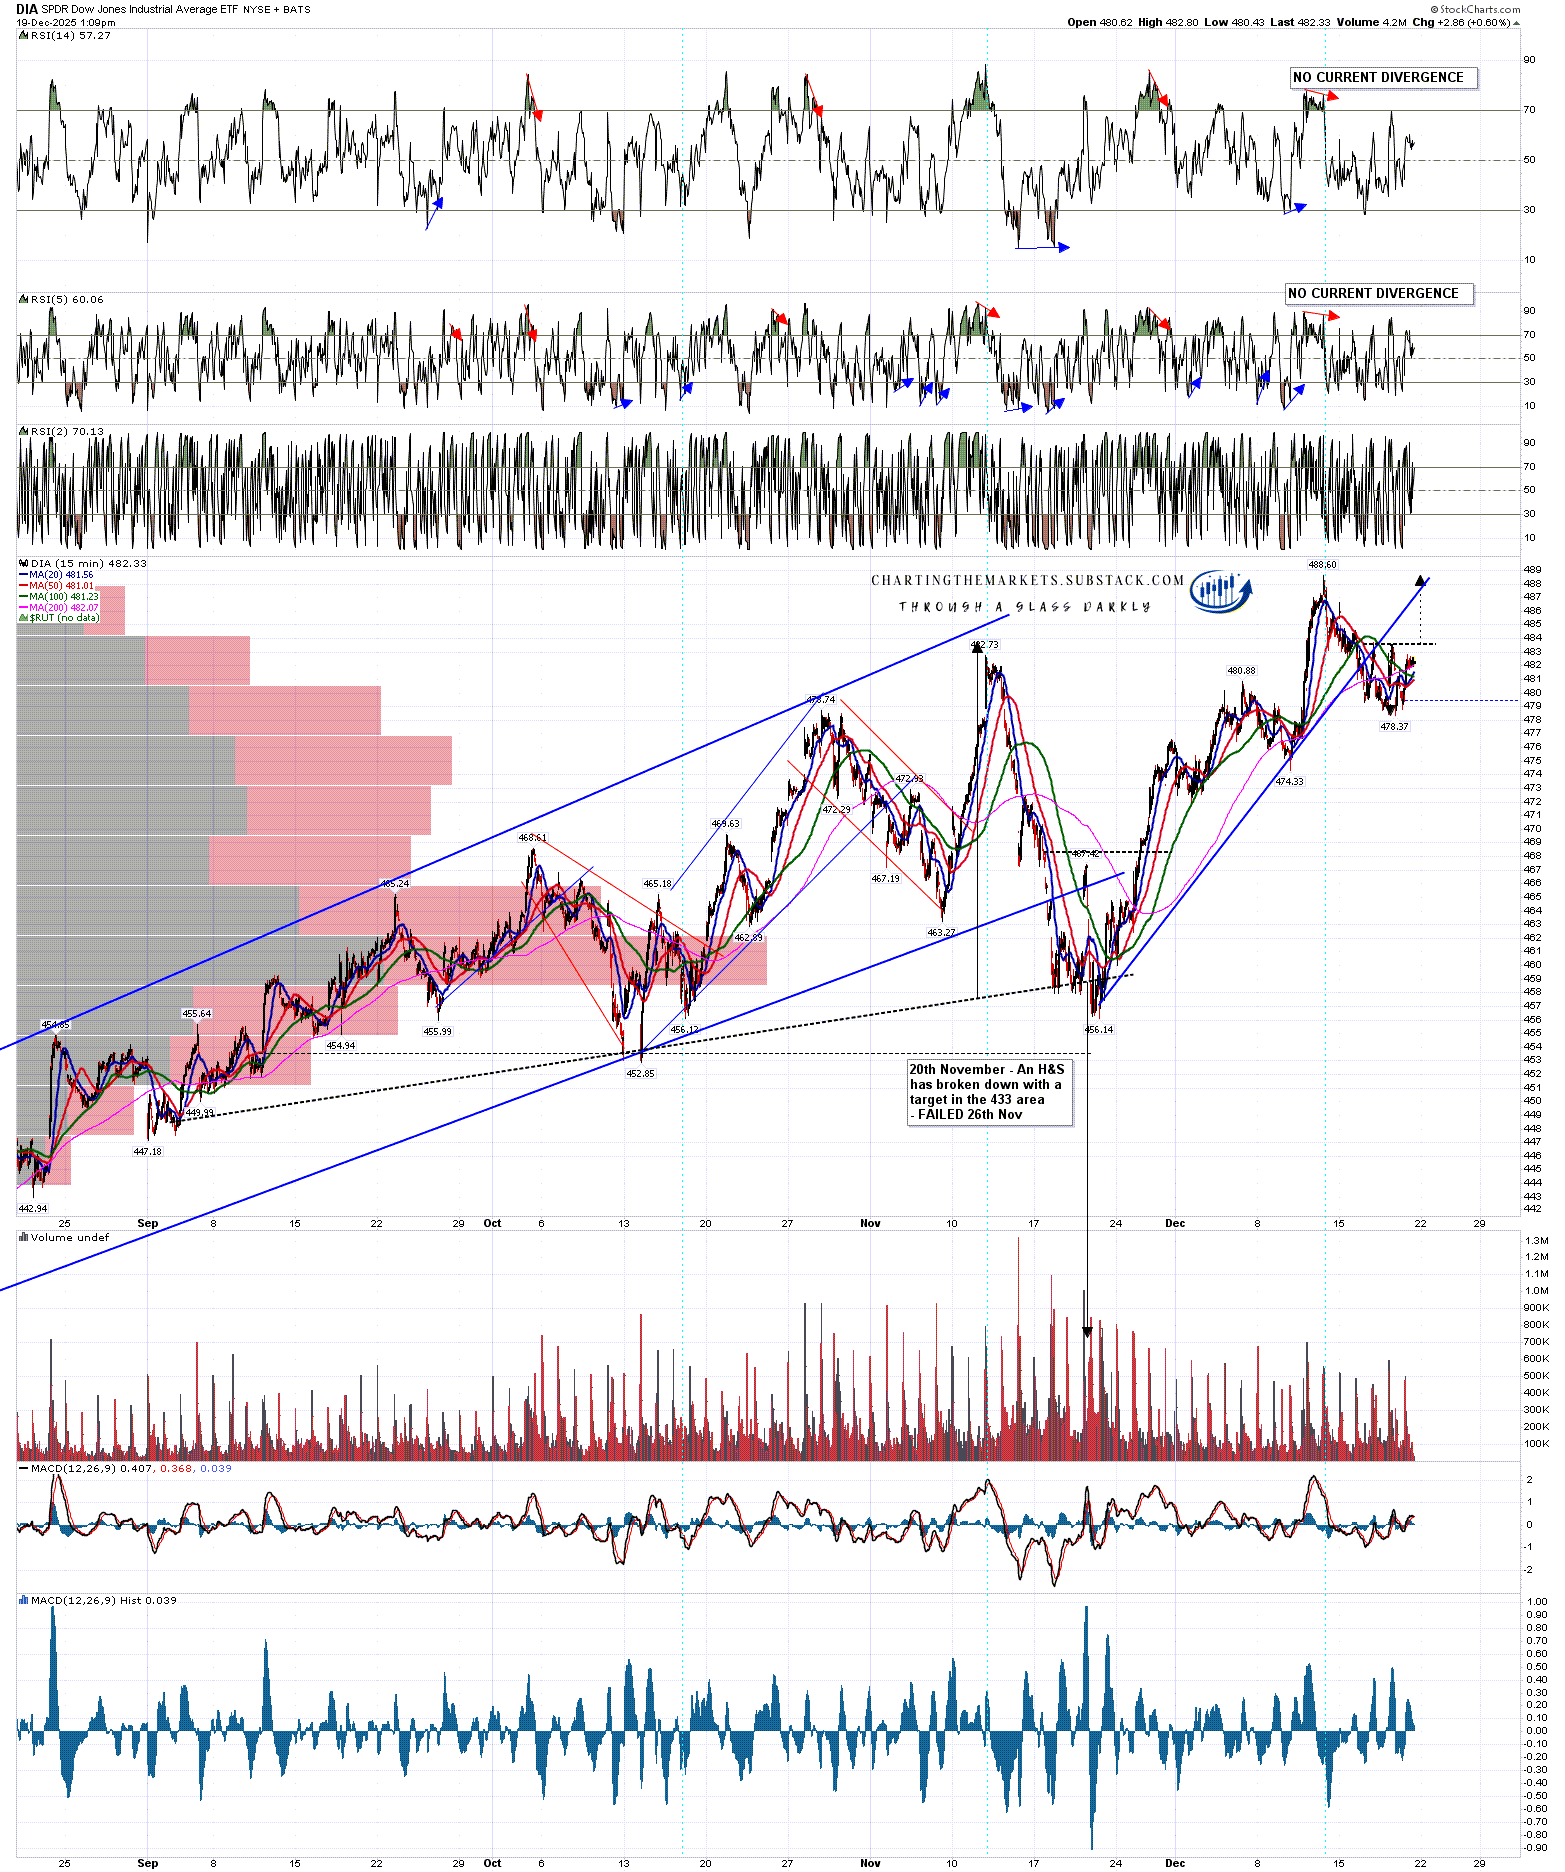
There was no topping pattern on DIA, which retraced the least, but there is a very nice double bottom setup from the low, which on a sustained break back up over 483.578 would look for a target very close to a retest of the December high at 488.60.
DIA 15min chart:
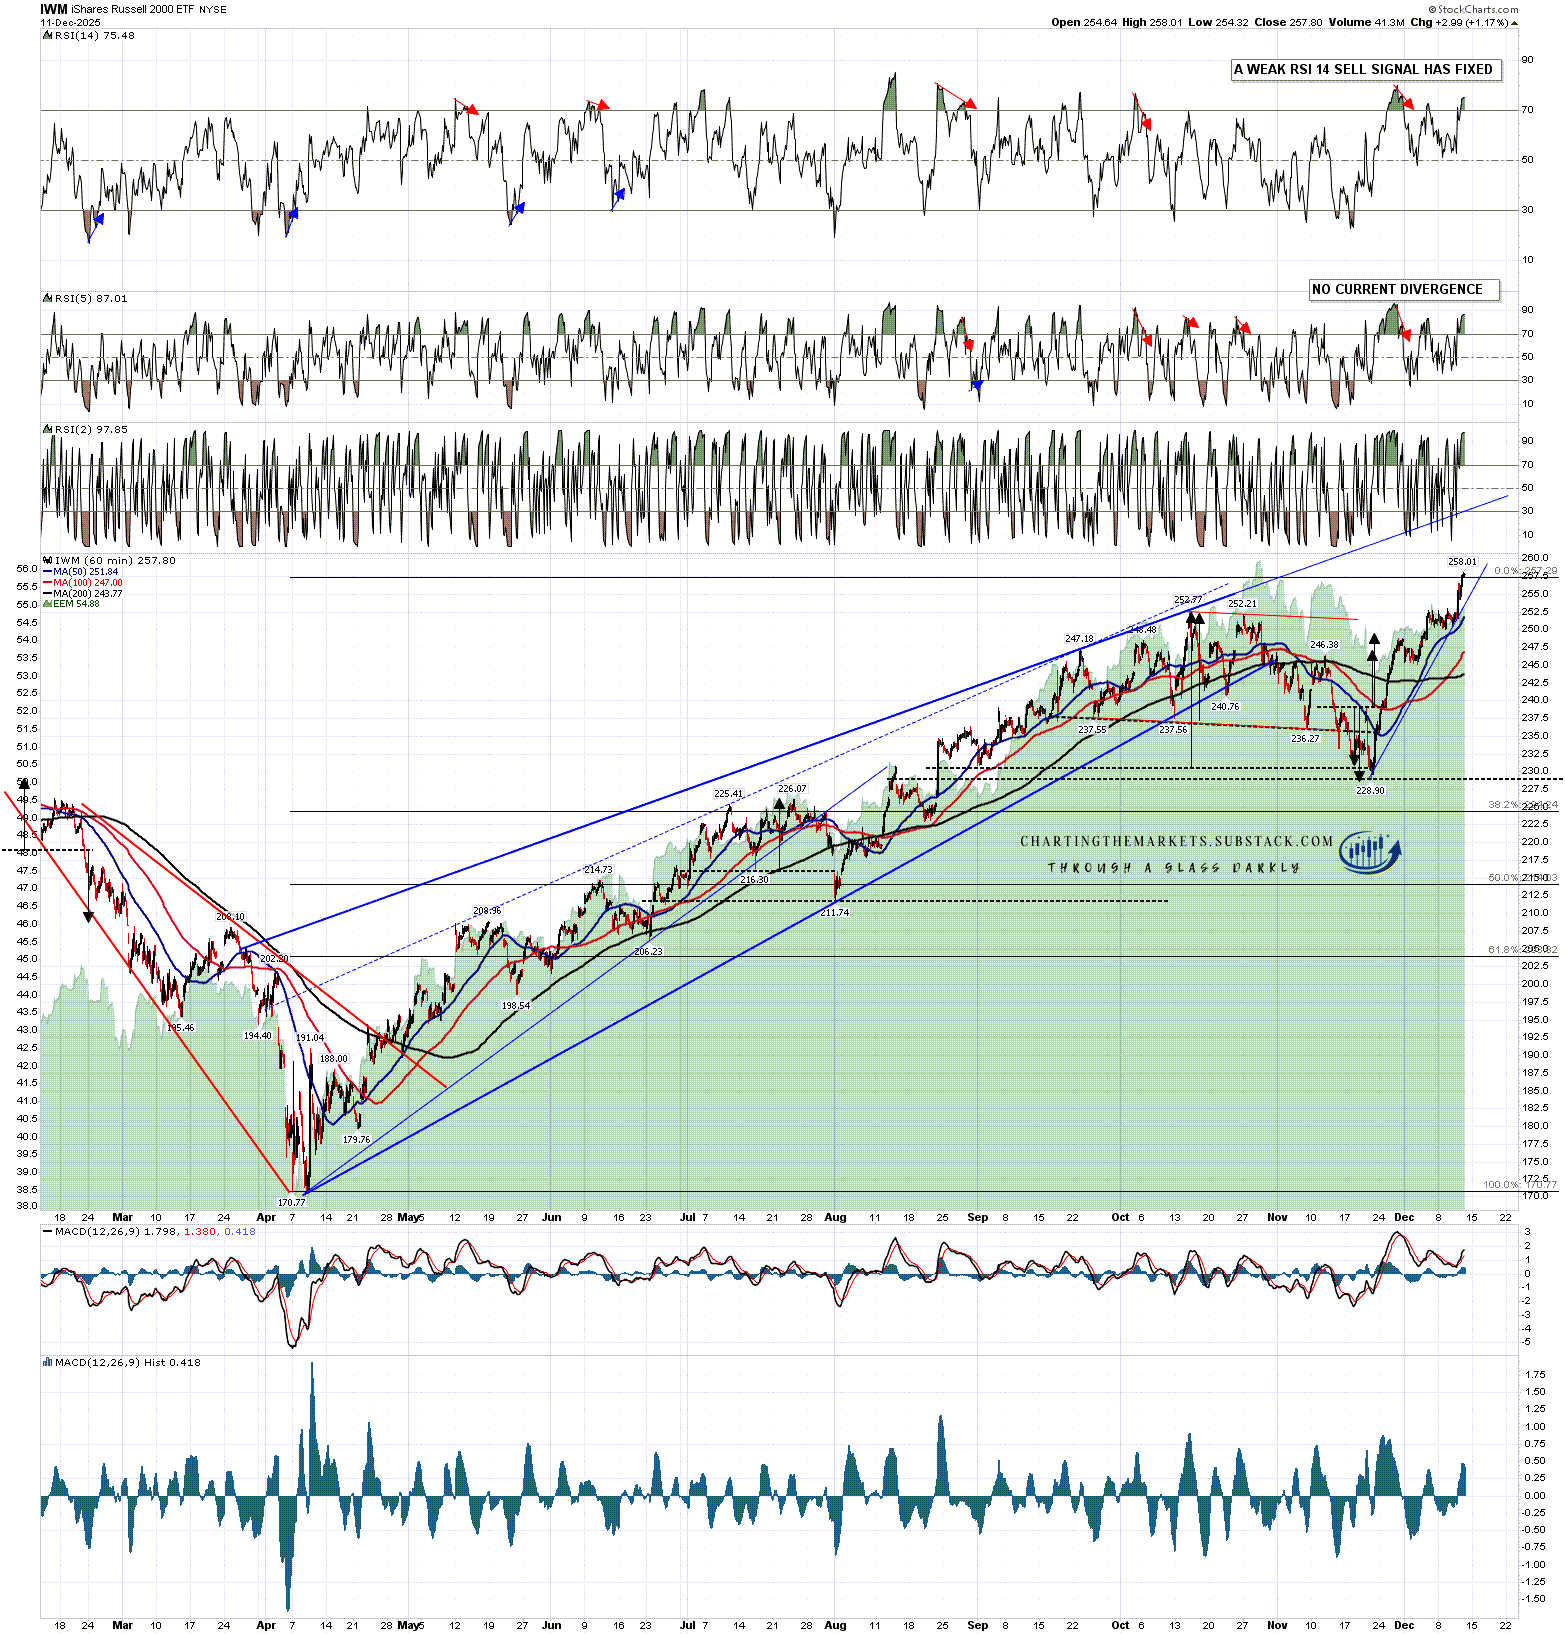
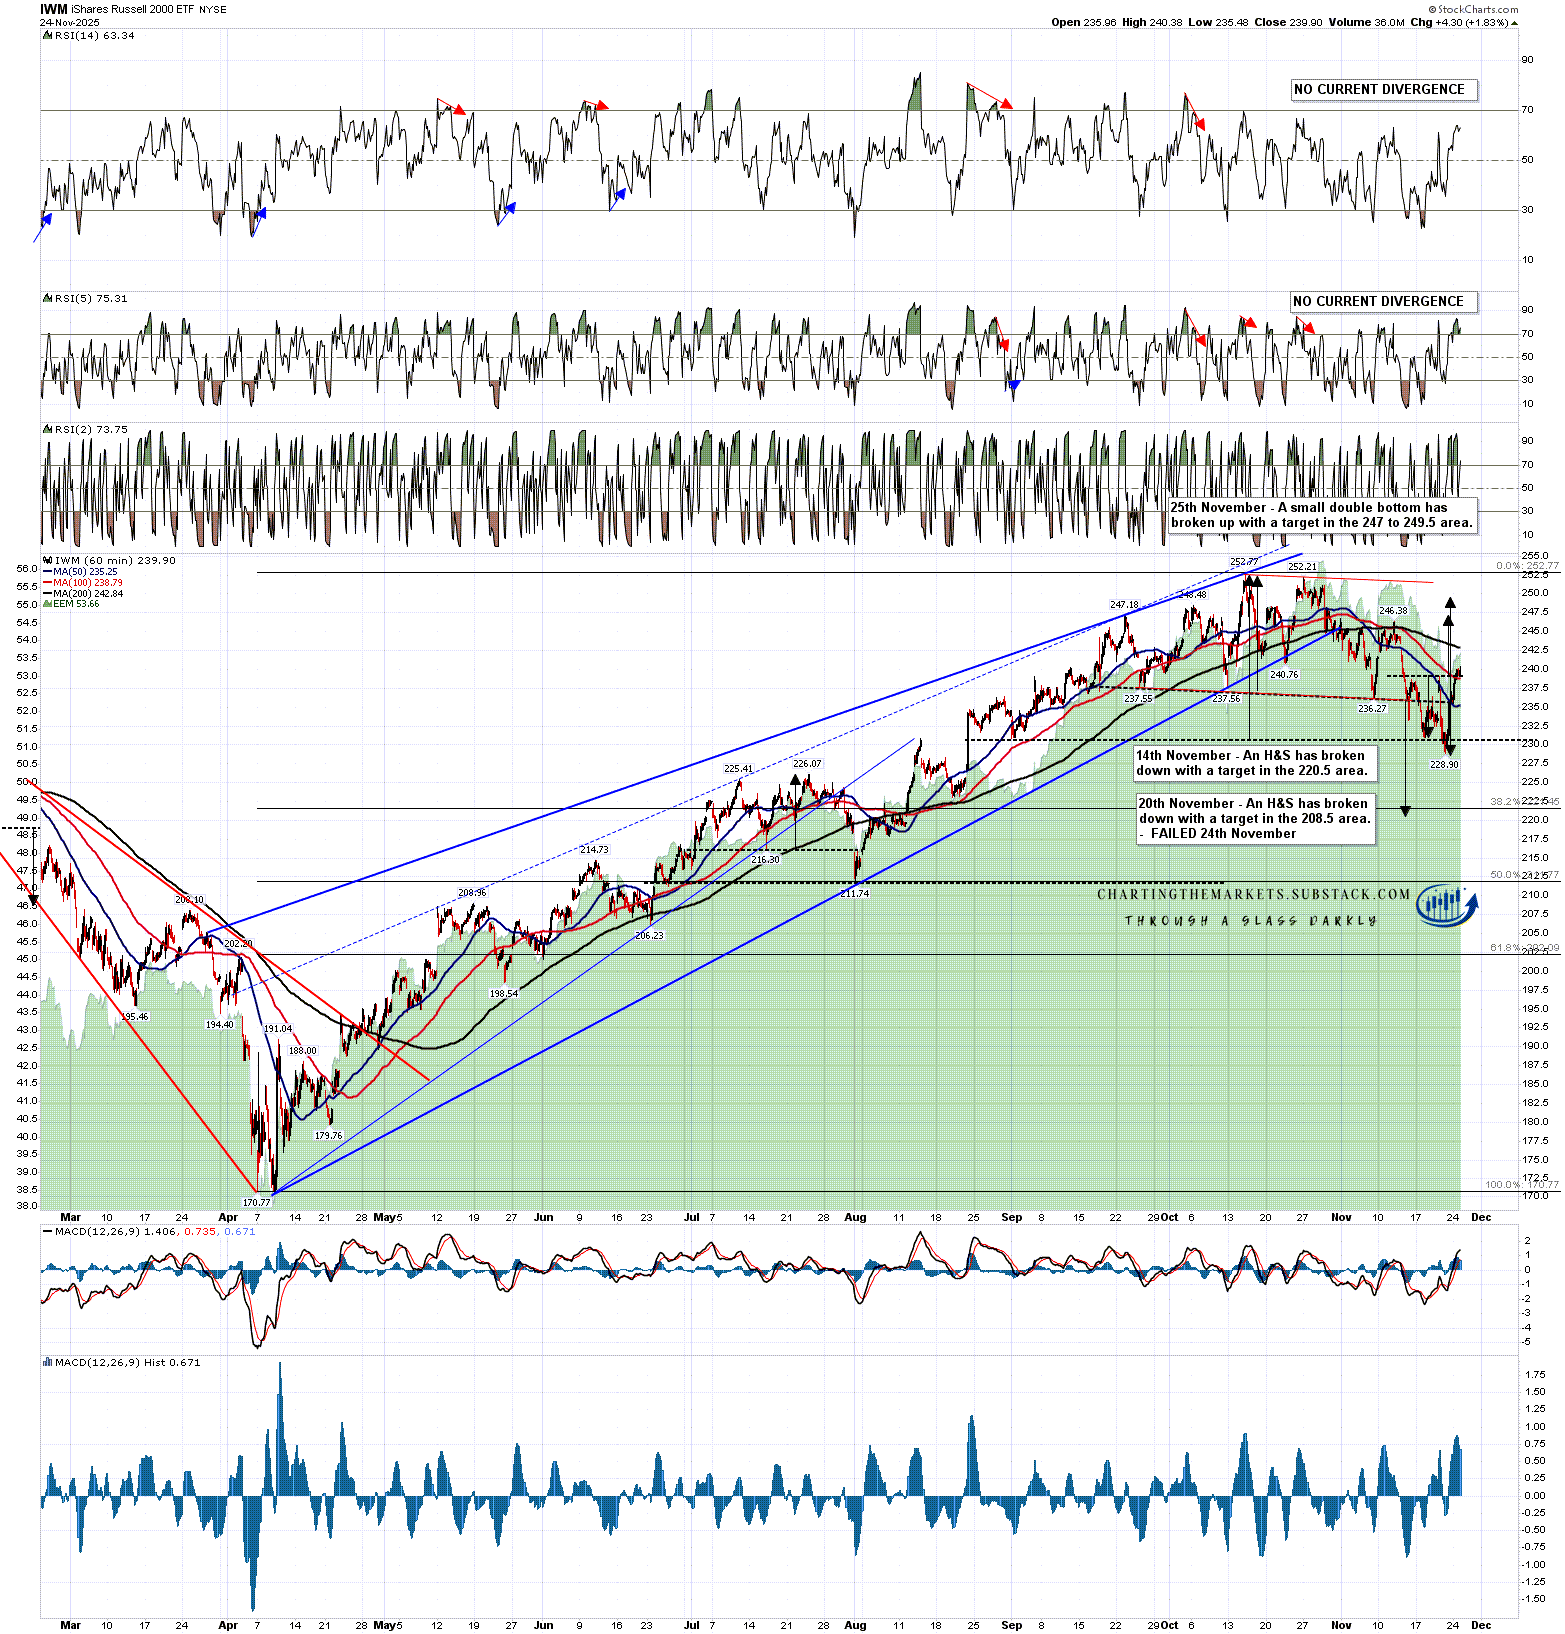
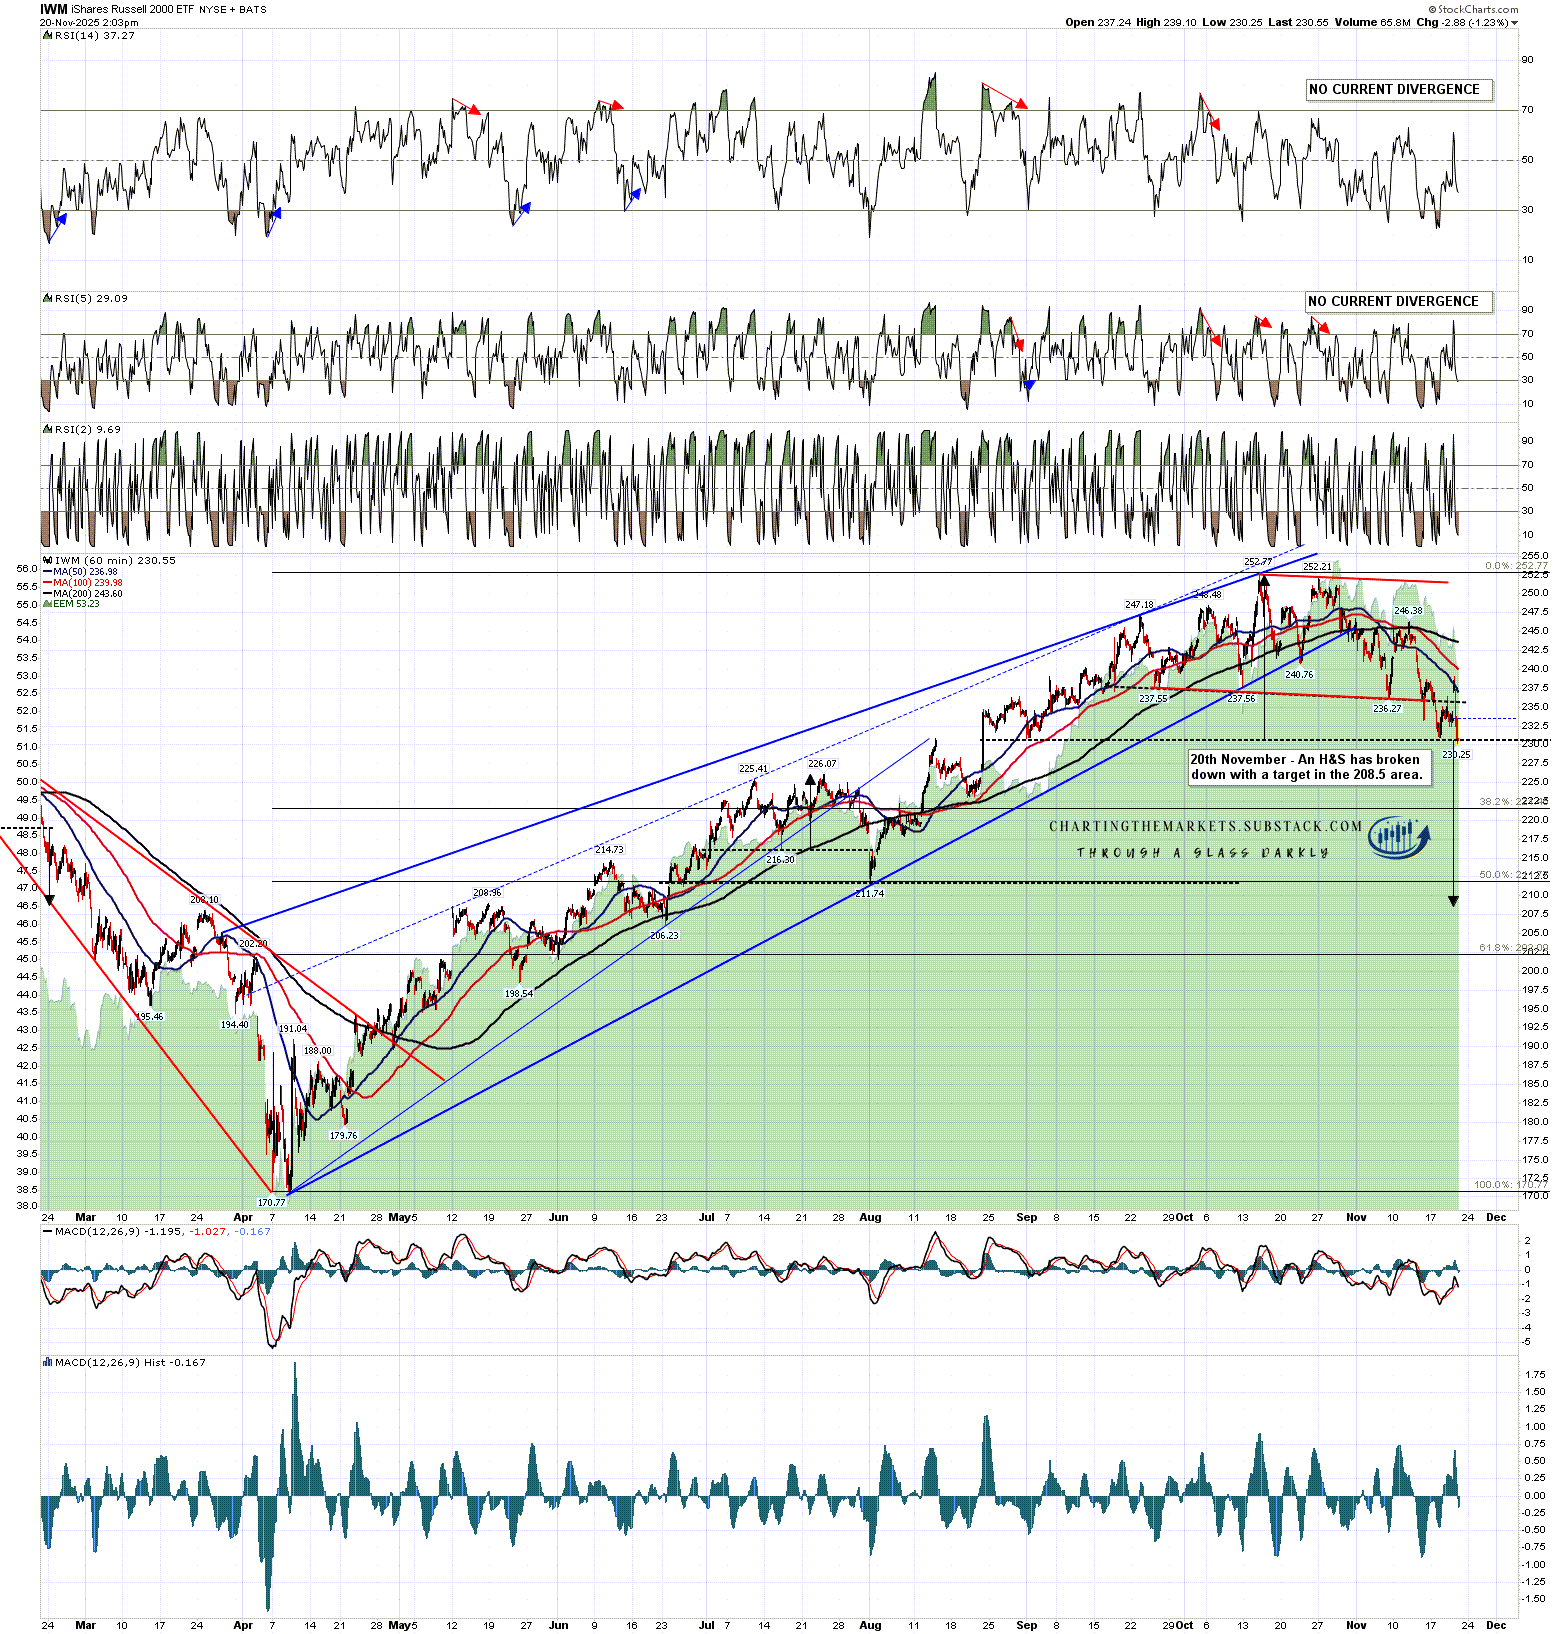
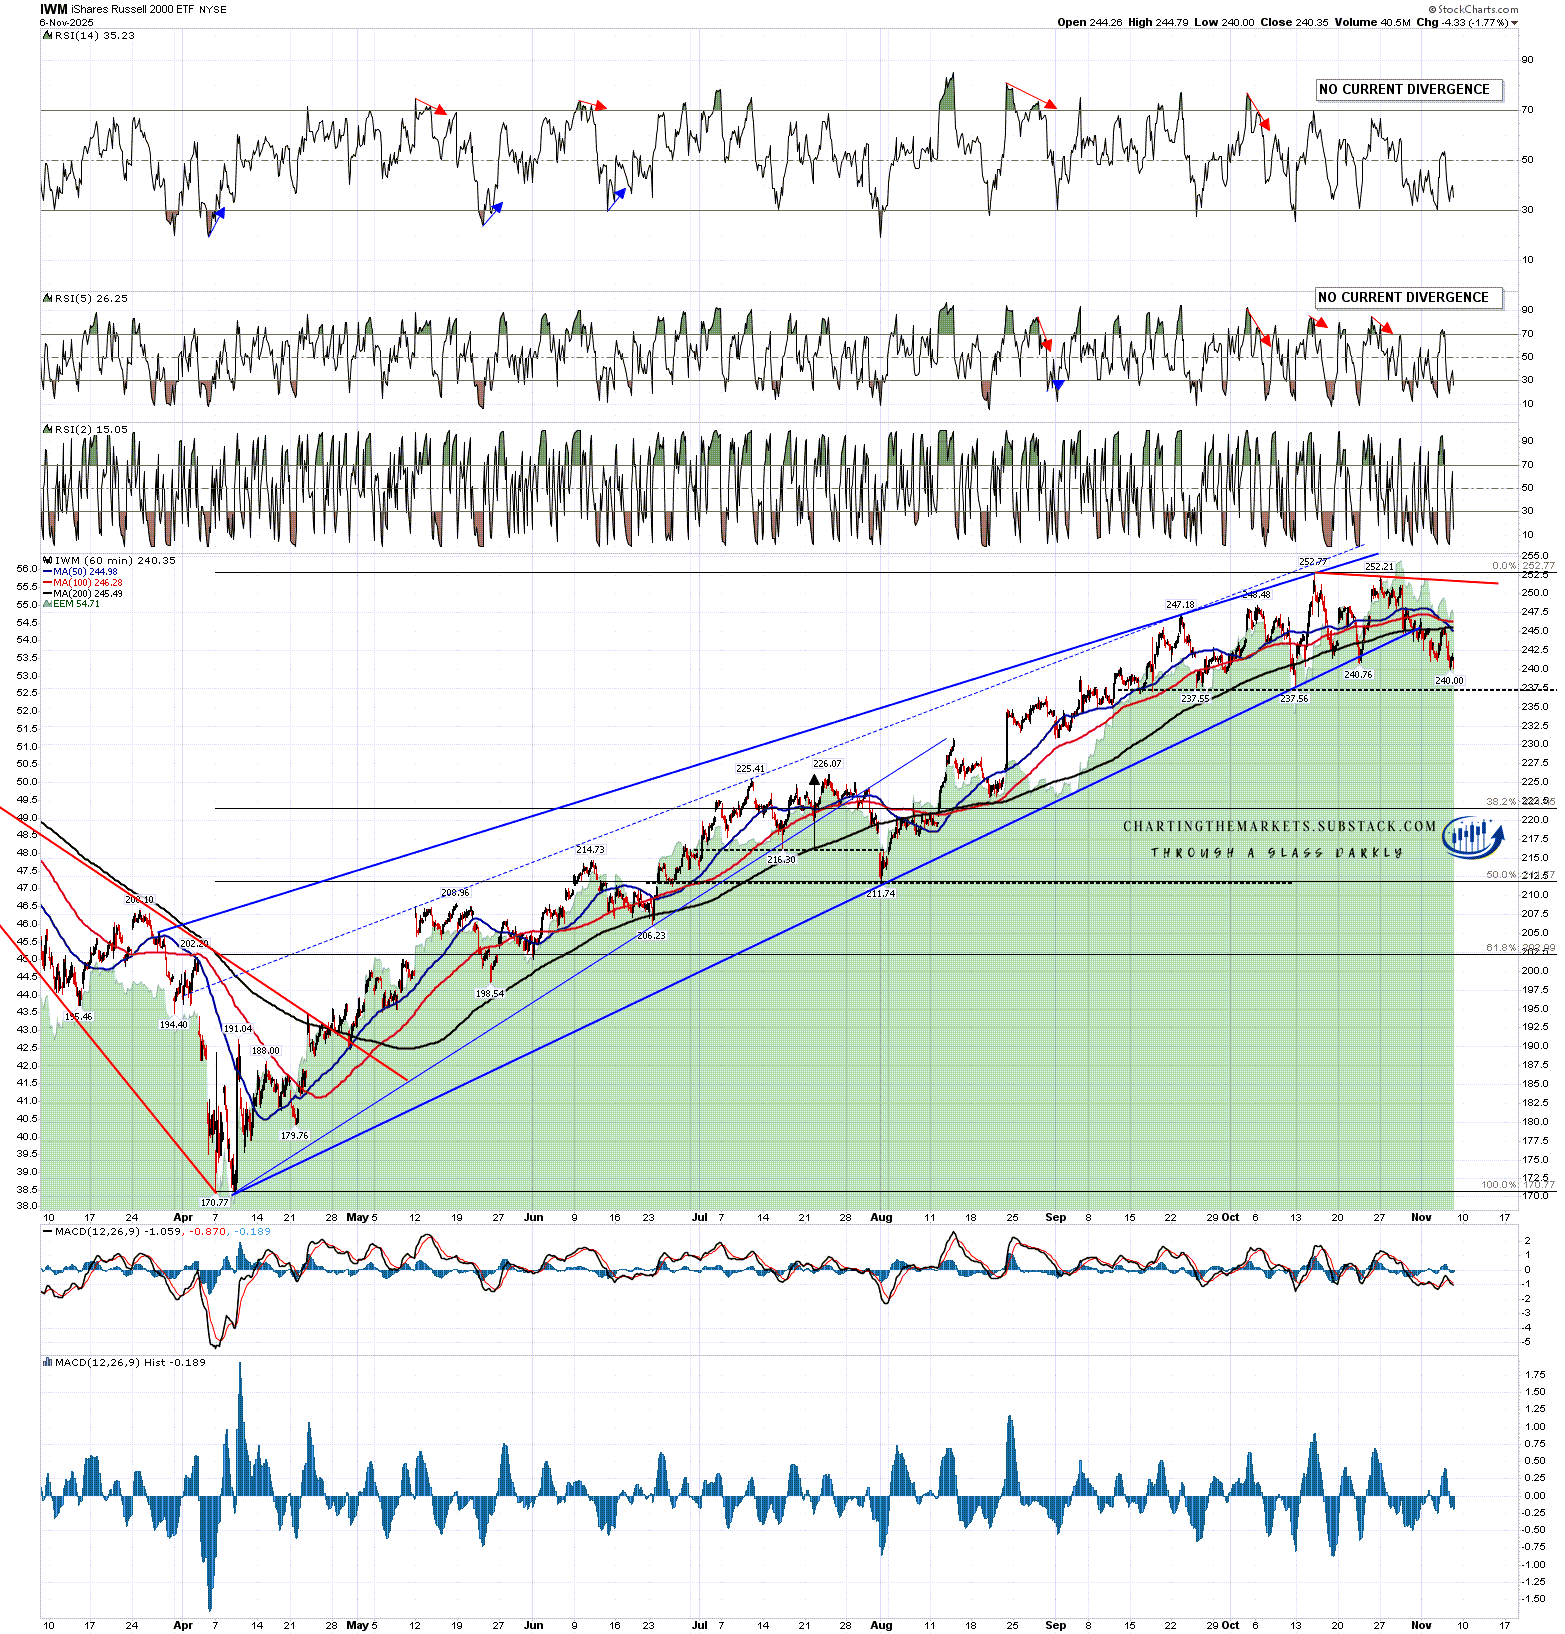
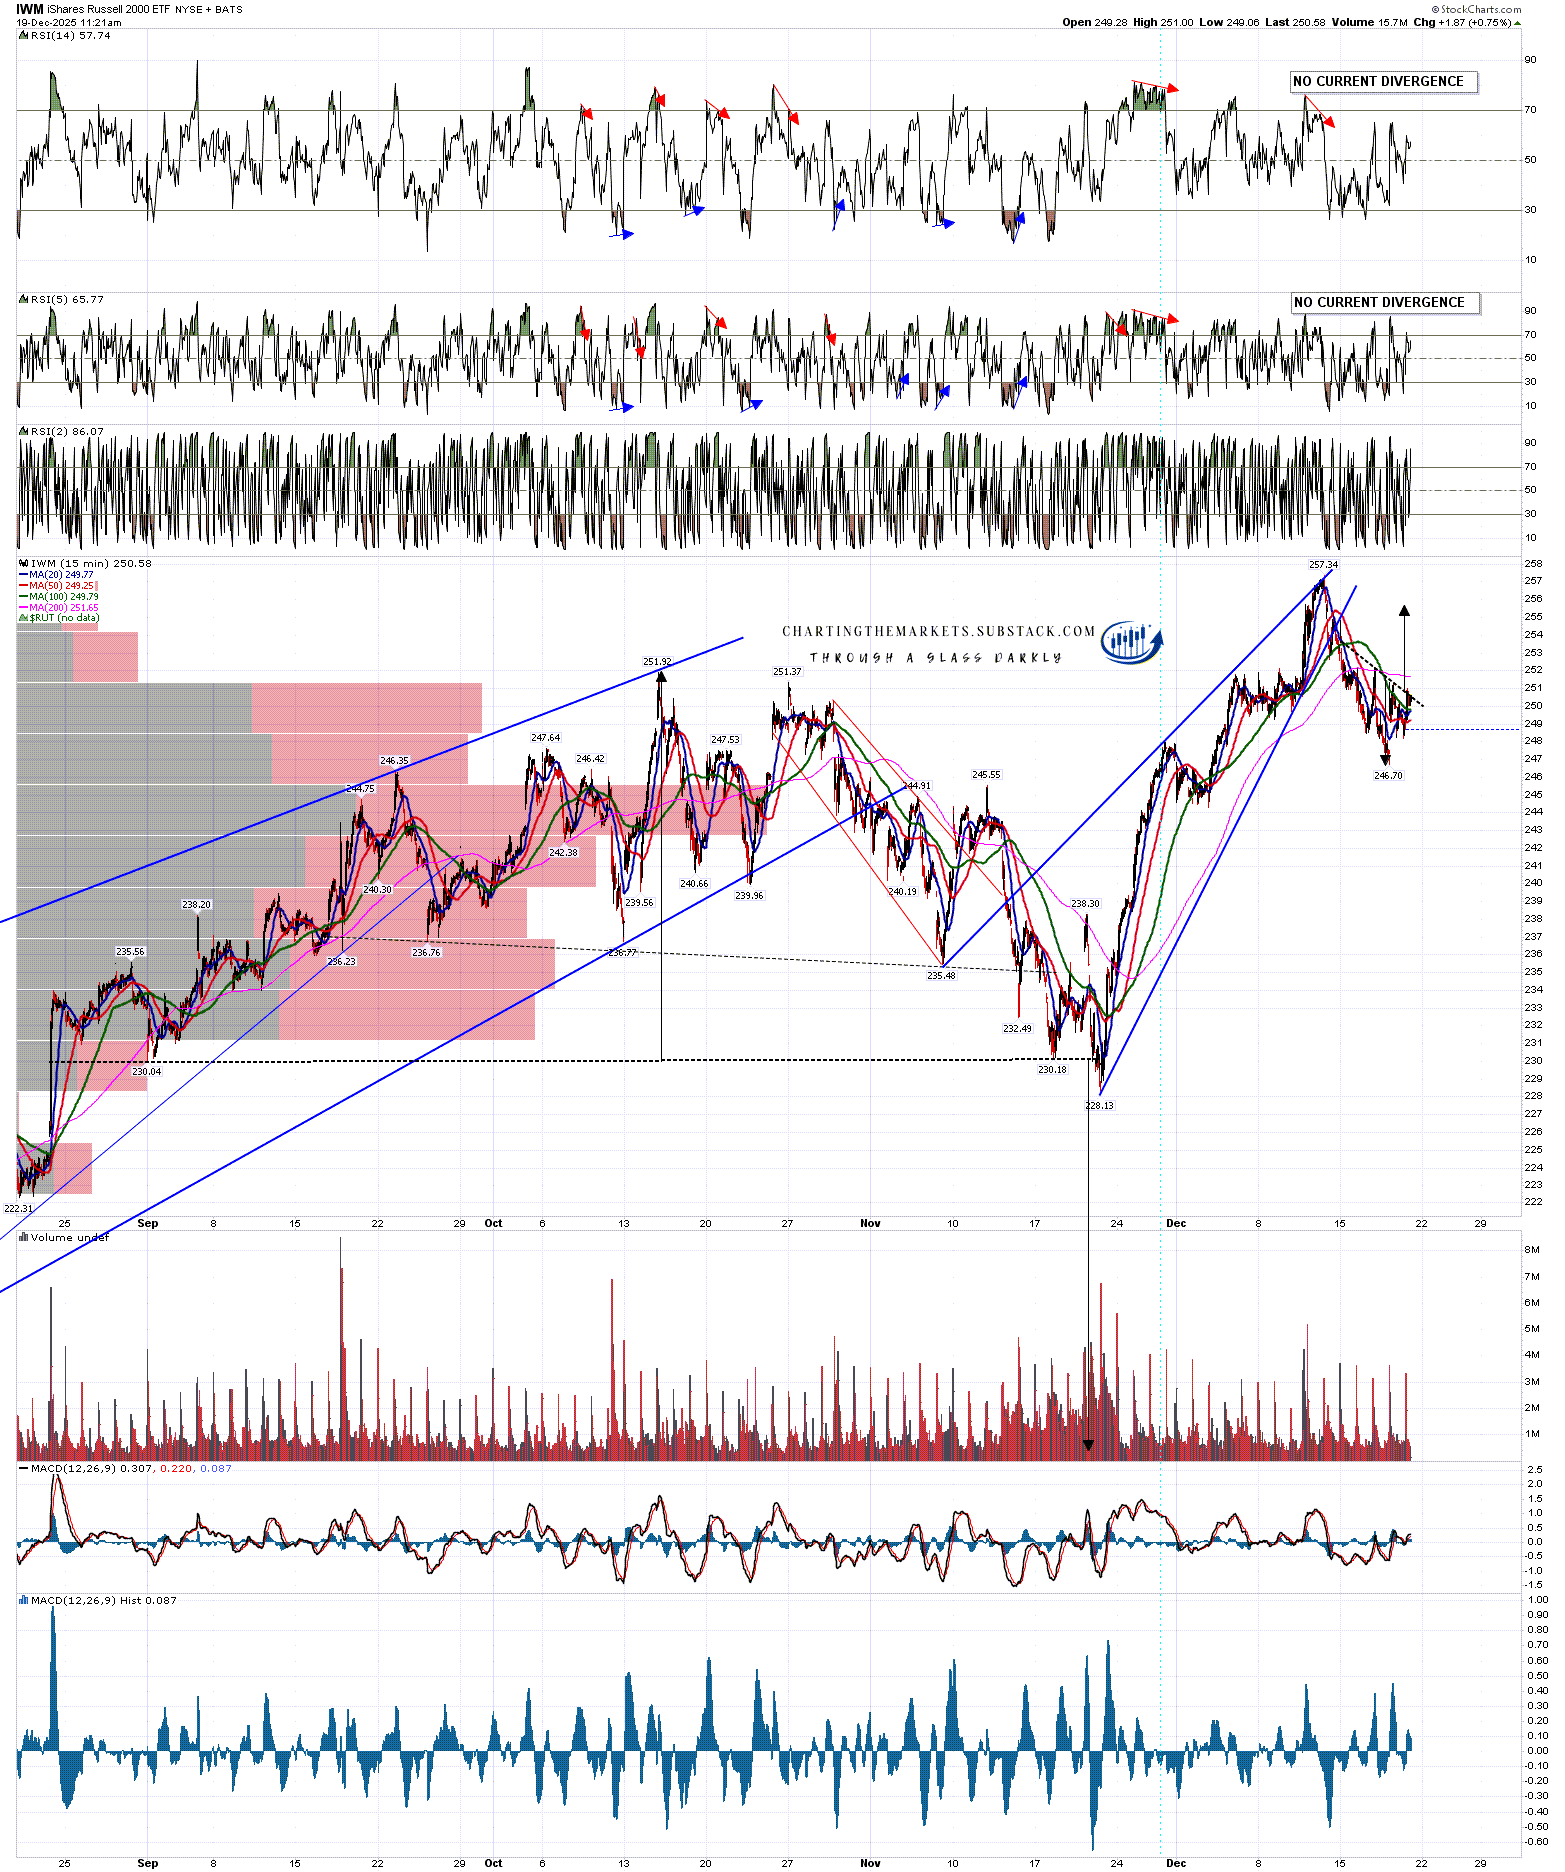
On IWM there was a small IHS on IWM, not marked up but shown on the RTY_F chart I posted on Tuesday. That made target and a sharply downsloping (but decent quality) IHS has formed from the lows and broken up with a target in the 255.75 area, close to the December high at 257.34.
IWM 15min chart:
Could all these reversal patterns fail? Possibly, but the strong historical stats into a holiday week generally strongly favor the bulls. Most likely all these patterns make target and we see SPX and QQQ have a serious try at resolving unfinished business above by making new all time highs.
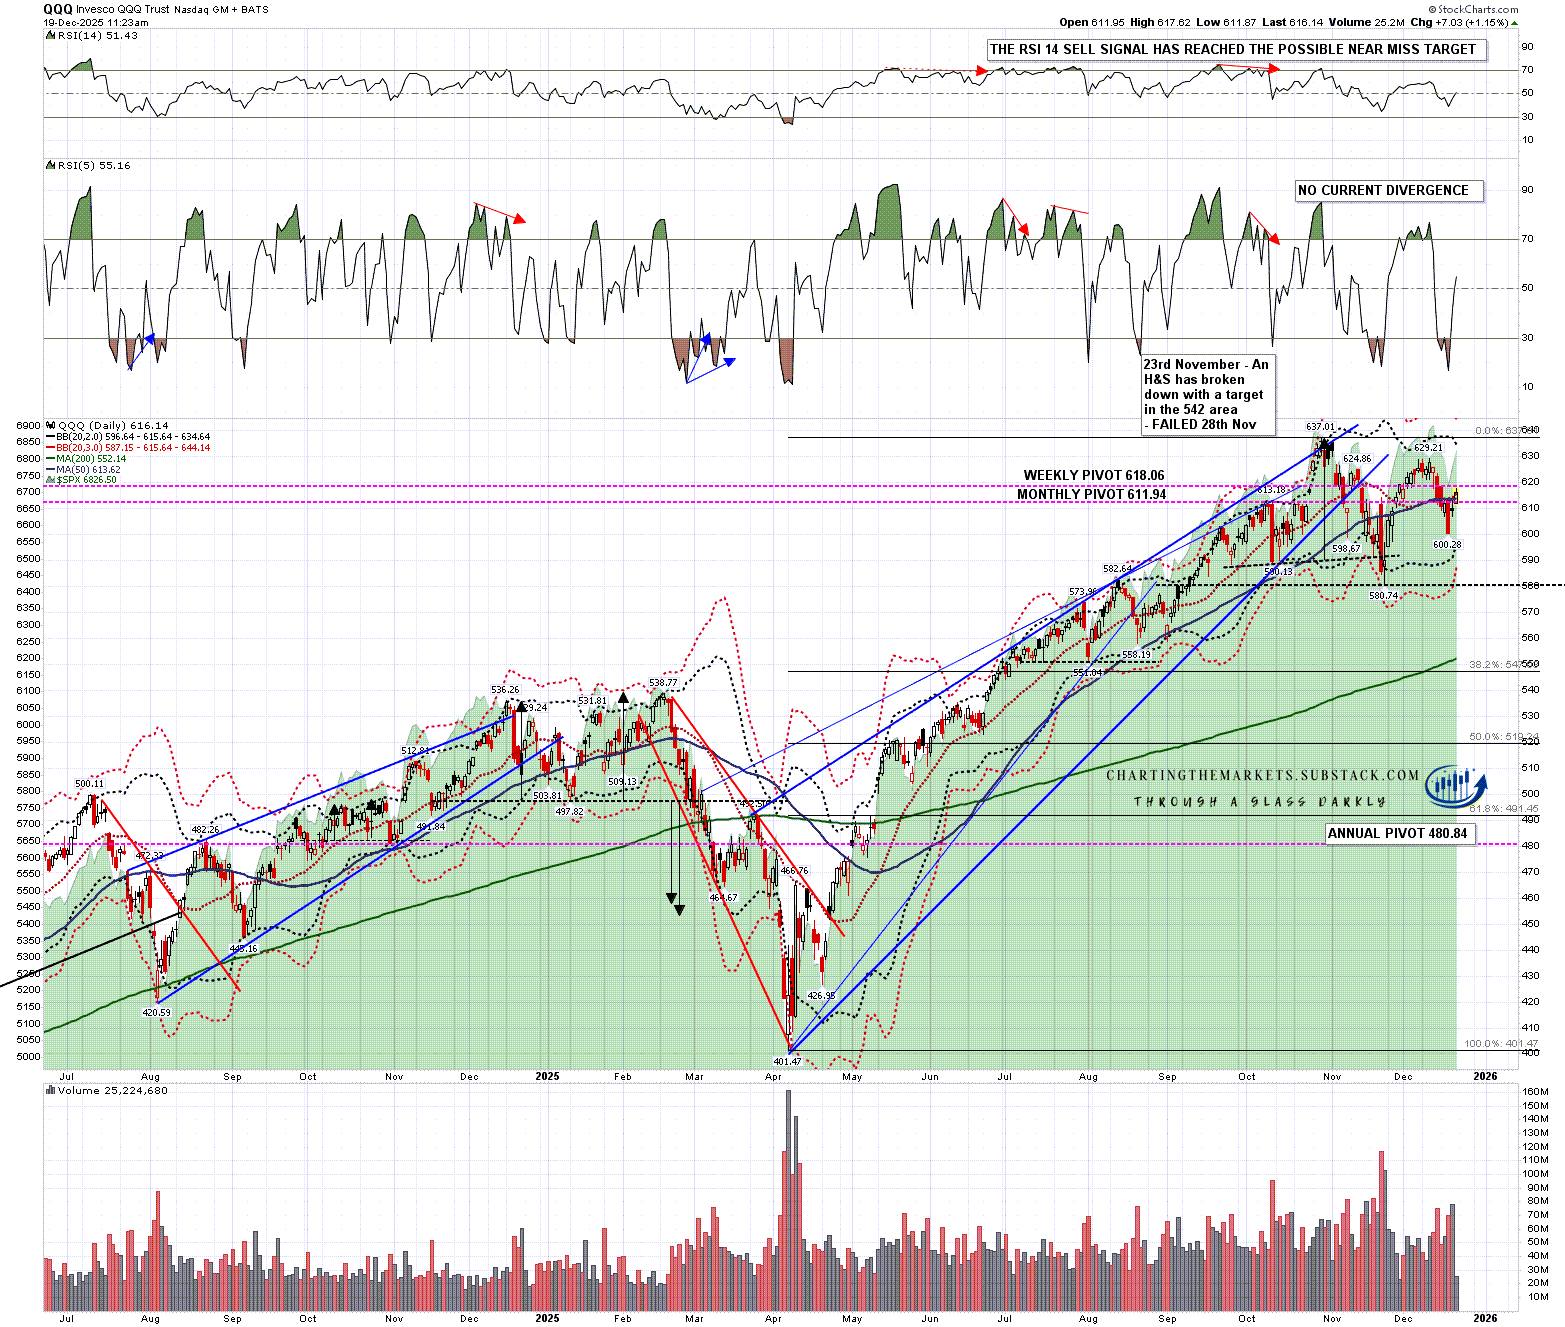
SPX and QQQ both broke below their daily middle bands during this retracement and both are trying to break back above them today. Bulls ideally need to break back above both at today’s close and deliver confirming second breaks above on Monday to deliver unambiguous bullish breaks higher.
On SPX (not shown below) the daily middle band is currently at 6810.44 and on QQQ it is at 615.69.
QQQ daily chart:
On the bigger picture I’m leaning towards a possibly sizable top forming here and most likely at least a bearish January. The inflation numbers yesterday morning lean bullish short term but are very concerning longer term as they appear to have been calculated in a way that was potentially politically motivated, to show an number that was unrealistically low.
I’ll be reading more about that at the weekend but it does already seem clear that in the absence of housing costs data for October (due to the government shutdown) a decision was made to use an estimated housing inflation number at zero, which was not an estimate based on any previous numbers this year. There also seems to have been a strange decision connected to the way that Black Friday sale prices were included.
This isn’t an immediate issue but there is a very serious concern that as the administration has already taken direct control of government statistics, and is moving toward direct control of the Fed from May 2026, that published economic statistics and federal reserve policy may become increasingly detached from economic reality. That of course might well seriously undermine confidence in US treasury and stock markets. I’ll be writing more about this over the holidays.
In the meantime I’m leaning strongly bullish into the end of Xmas week and the setups I have shown today should take these indices at least back into retests of the December highs and very possibly into new all time highs across the board. Everyone have a great weekend :-)
If you like my analysis and would like to see more, please take a free subscription at my chartingthemarkets substack, where I publish these posts first. I also do a premarket video every day on equity indices, bonds, currencies, energies, precious commodities and other commodities at 8.45am EST, but only for paying subscribers. Other places to find me are my page on the platform previously known as twitter, and my YouTube channel.