
In my posts on 20th October, 24th October, and 28th October I was looking at the rising wedges on SPX, QQQ, DIA and IWM from the April lows and weighing the odds of these breaking down into a substantial retracement in the near future.
I was saying that these are all good quality mature patterns that I would normally expect to break down, but was concerned that we might instead see the start of a larger break up into December.
In my post on 7th November I was noting that all those wedges had broken down and gave some downside target areas that I was looking at initially.
In my last post on 20th November I was reviewing the bearish setups after all those initial target areas had been reached and looking at the larger H&S patterns that had since formed and were starting to break down.
I mentioned at the end of the post that a problem for bears might be that the historical stats all leaned bullish from last Friday through Wednesday. Thursday is the Thanksgiving holiday of course and Friday is a half trading day so in effect this whole but short holiday week leans bullish.
In my premarket video for subscribers on Friday morning I was calling a likely rally and looking at weak hourly buy signals fixed or brewing across the board on ES, NQ, RTY and YM.
Since Friday morning we have been seeing a strong rally and obviously the historical stats still lean bullish today or tomorrow, so the question is whether this rally could be strong enough to derail the bear setup and trigger a likely retest of all time highs on SPX, QQQ, DIA and IWM.
SPX has rallied back to the 50dma yesterday and, as ever, the key resistance level that I’m watching is the daily middle band, which closed yesterday at 6754.66. I’m also watching the daily middle band on QQQ (not shown below) which closed yesterday at 614.19. A confirmed break over either or both of these key resistance levels would likely deliver all time high retests across the board.
SPX daily chart:
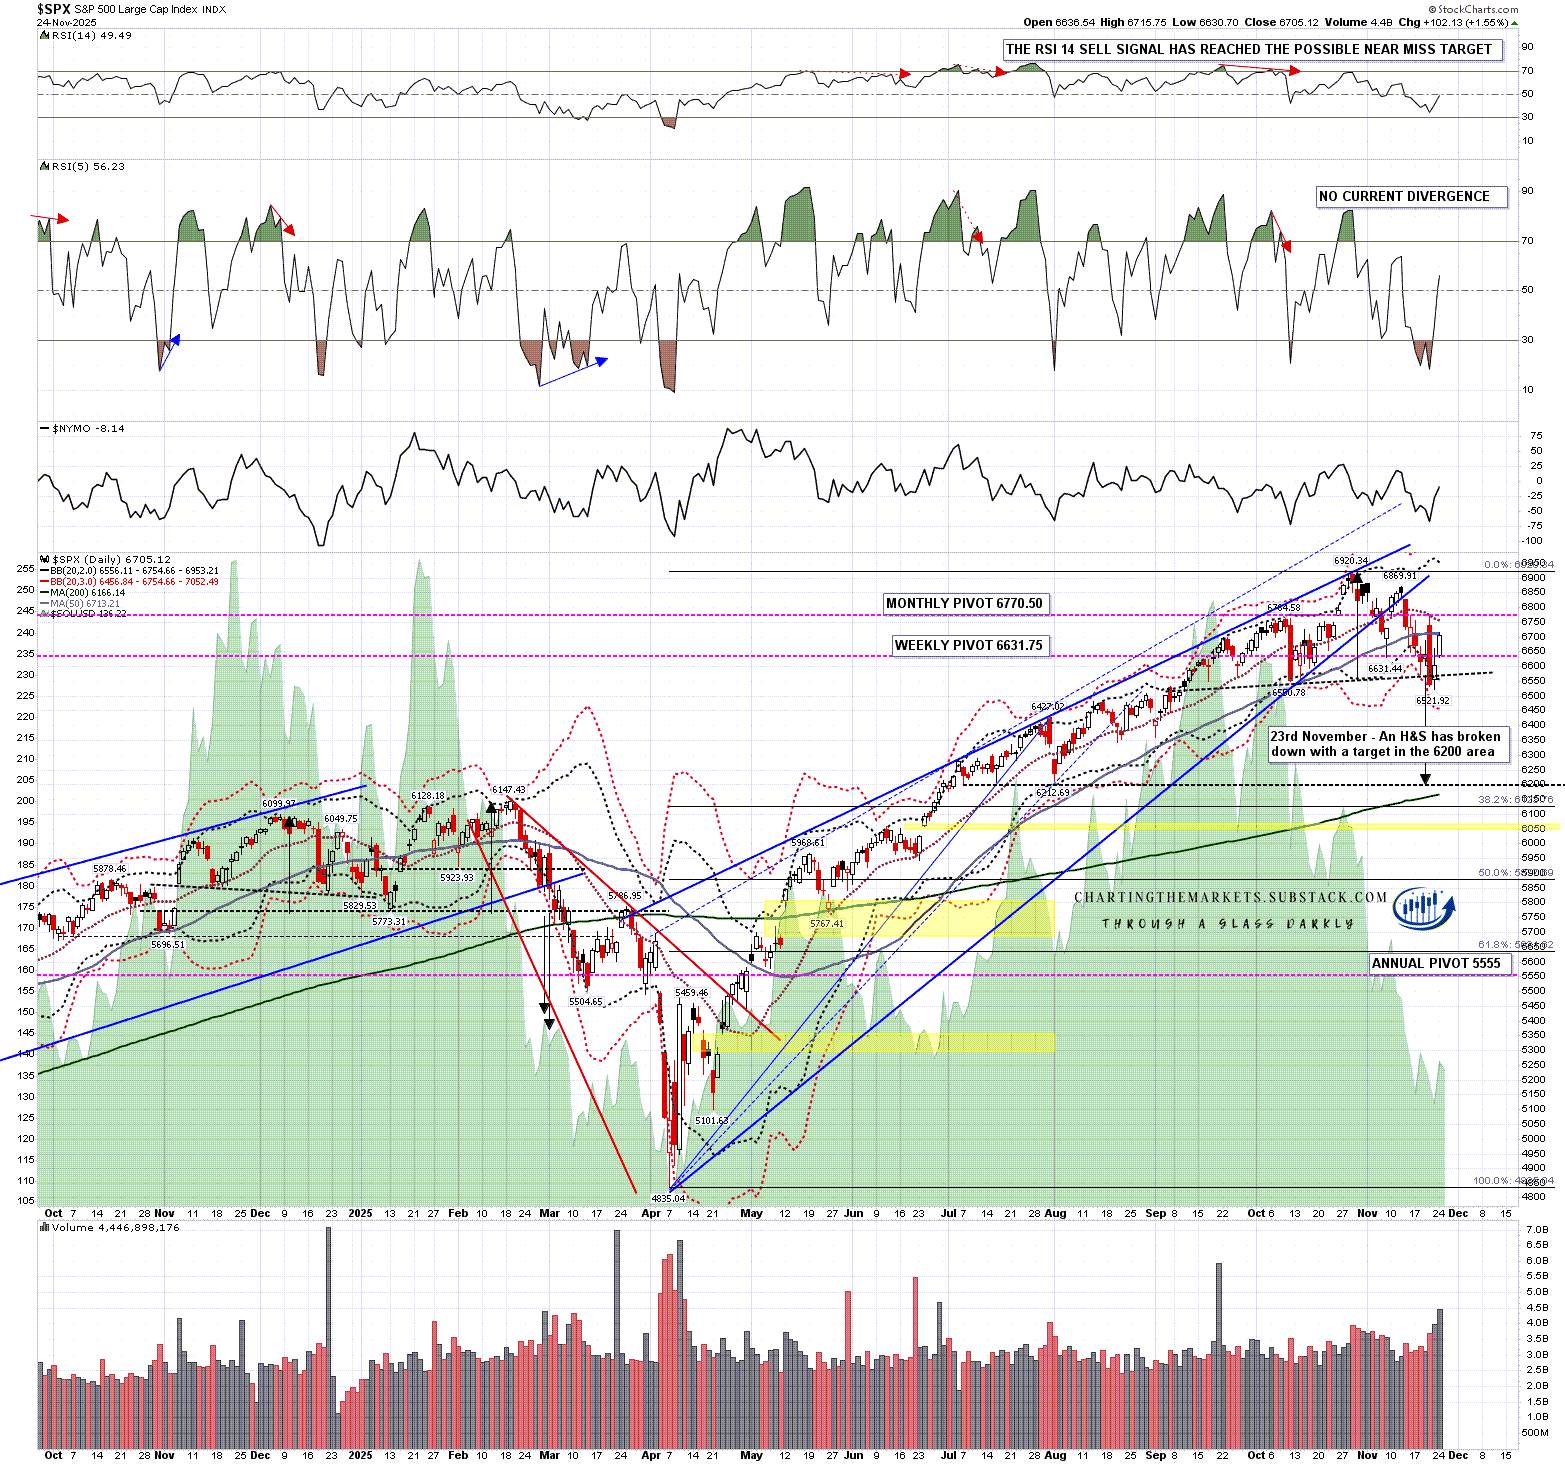
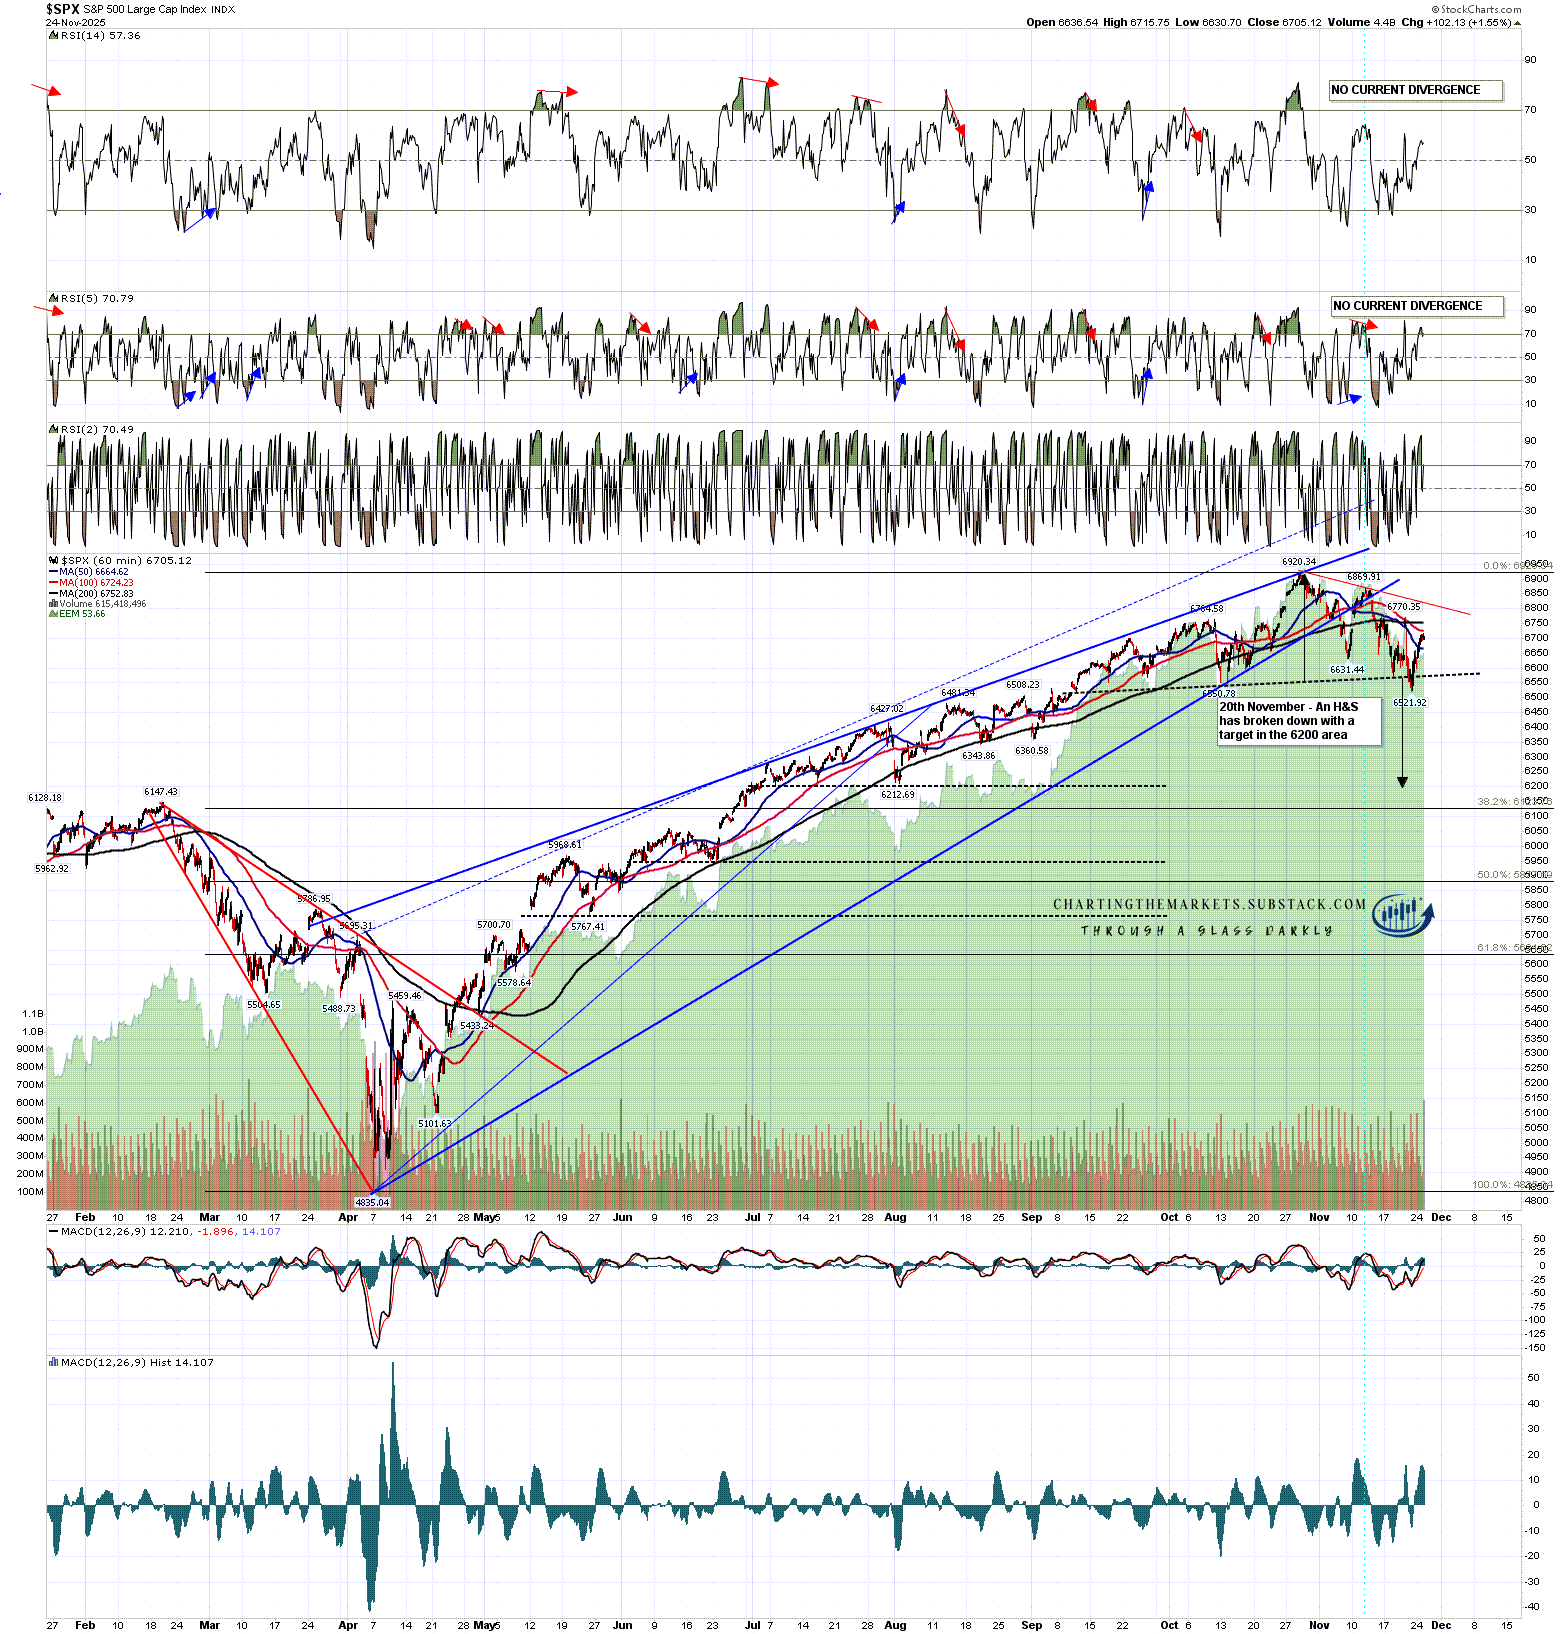
On the SPX hourly chart an H&S broke down last Thursday with a target in the 6200 area. That H&S would be invalidated on as break over the H&S right shoulder high at 6770.35, slightly over the daily middle band.
SPX 60min chart:
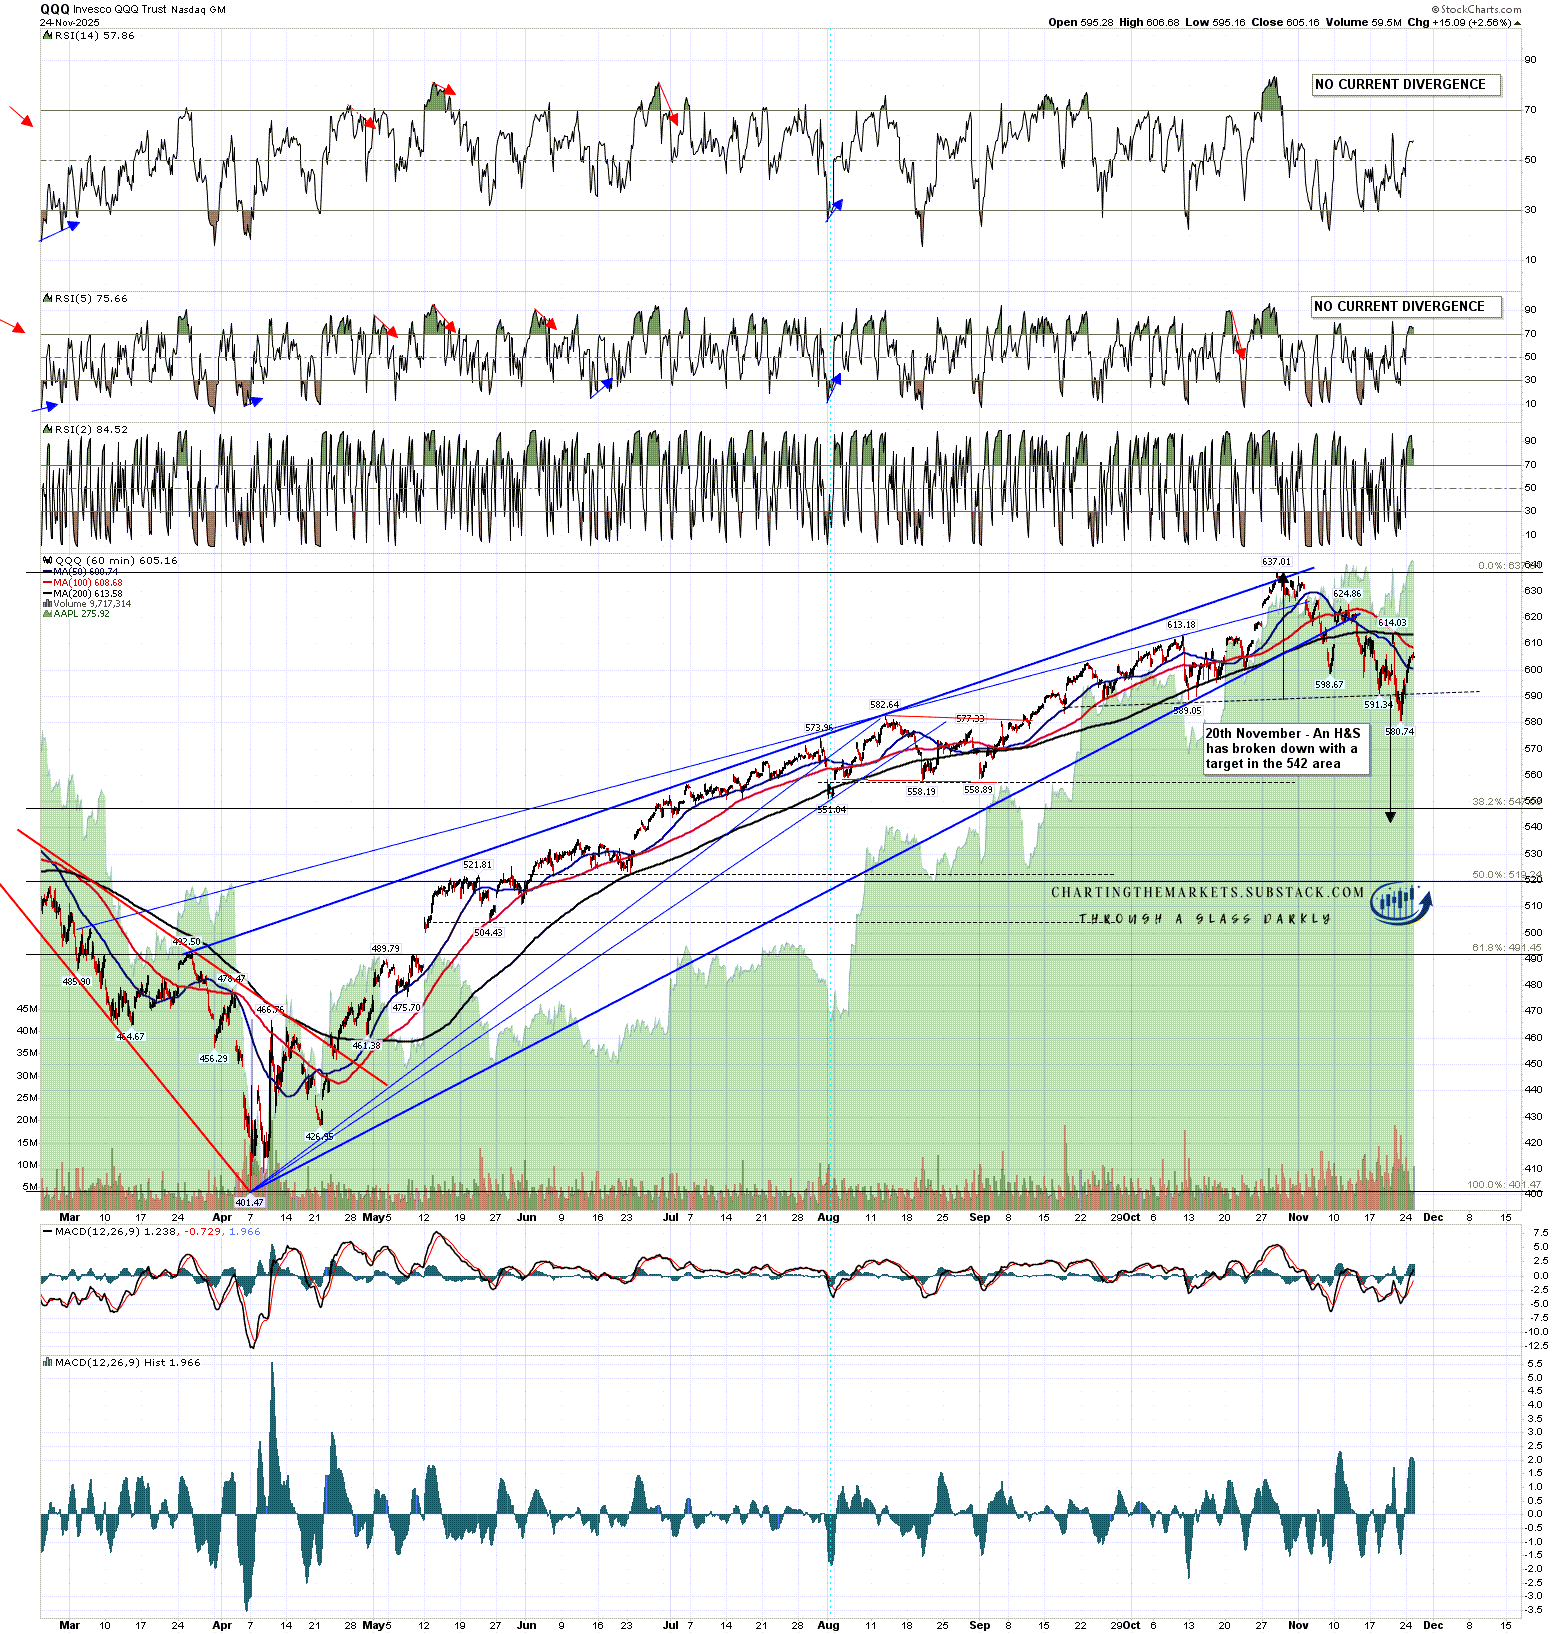
On the QQQ hourly chart an H&S broke down last Thursday with a target in the 542 area. That H&S would be invalidated on as break over the H&S right shoulder high at 614.03, slightly below the daily middle band.
QQQ 60min chart:
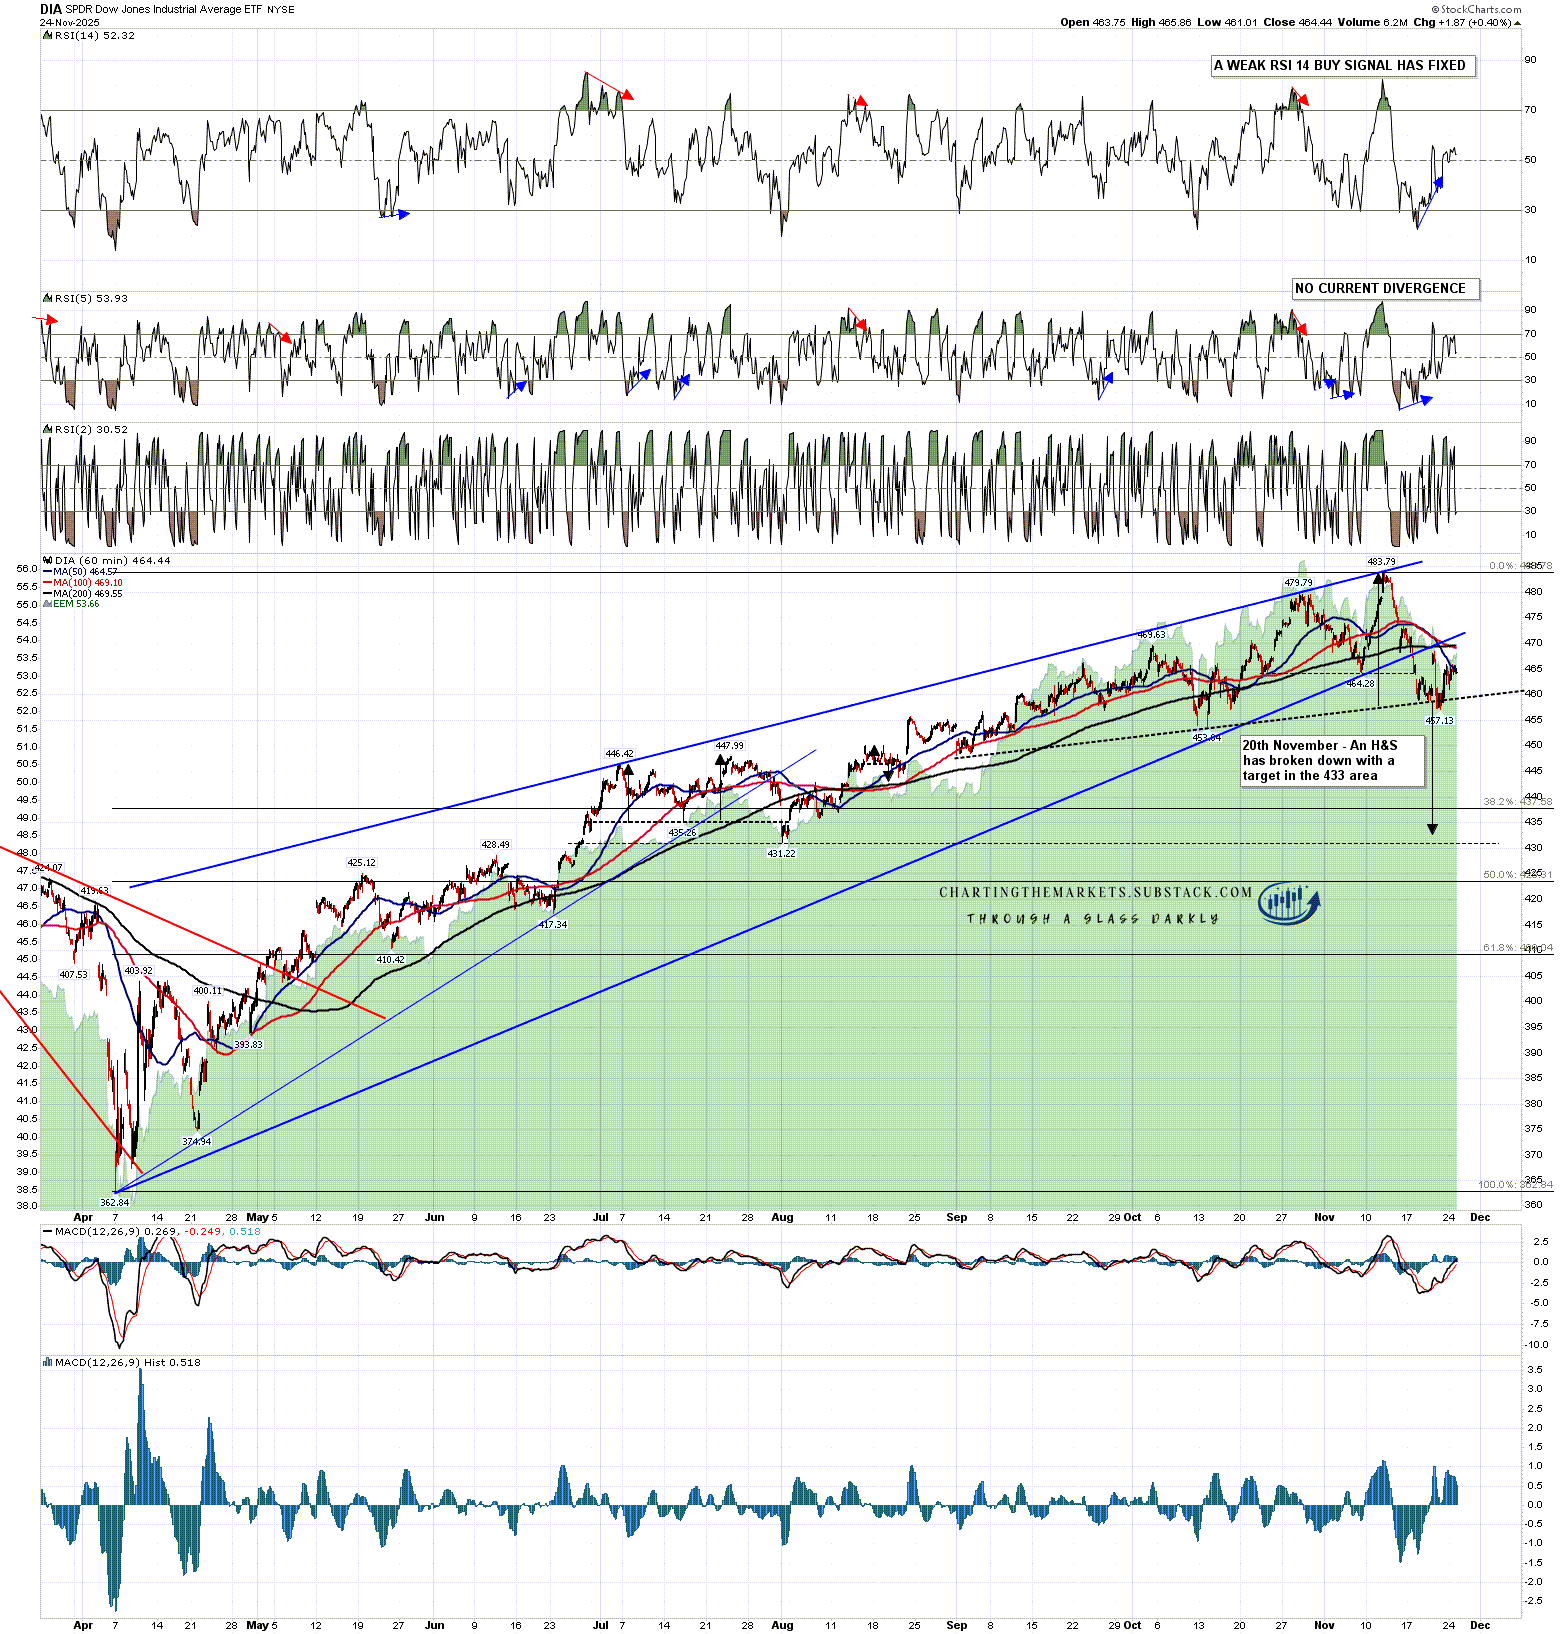
On the DIA hourly chart an H&S broke down last Thursday with a target in the 433 area. That H&S would be invalidated on a break over the H&S right shoulder high at 468.44. However if this this H&S fails the right shoulder on an alternate and perhaps better H&S may be forming, so I wouldn’t see this as a major failure.
DIA 60min chart:
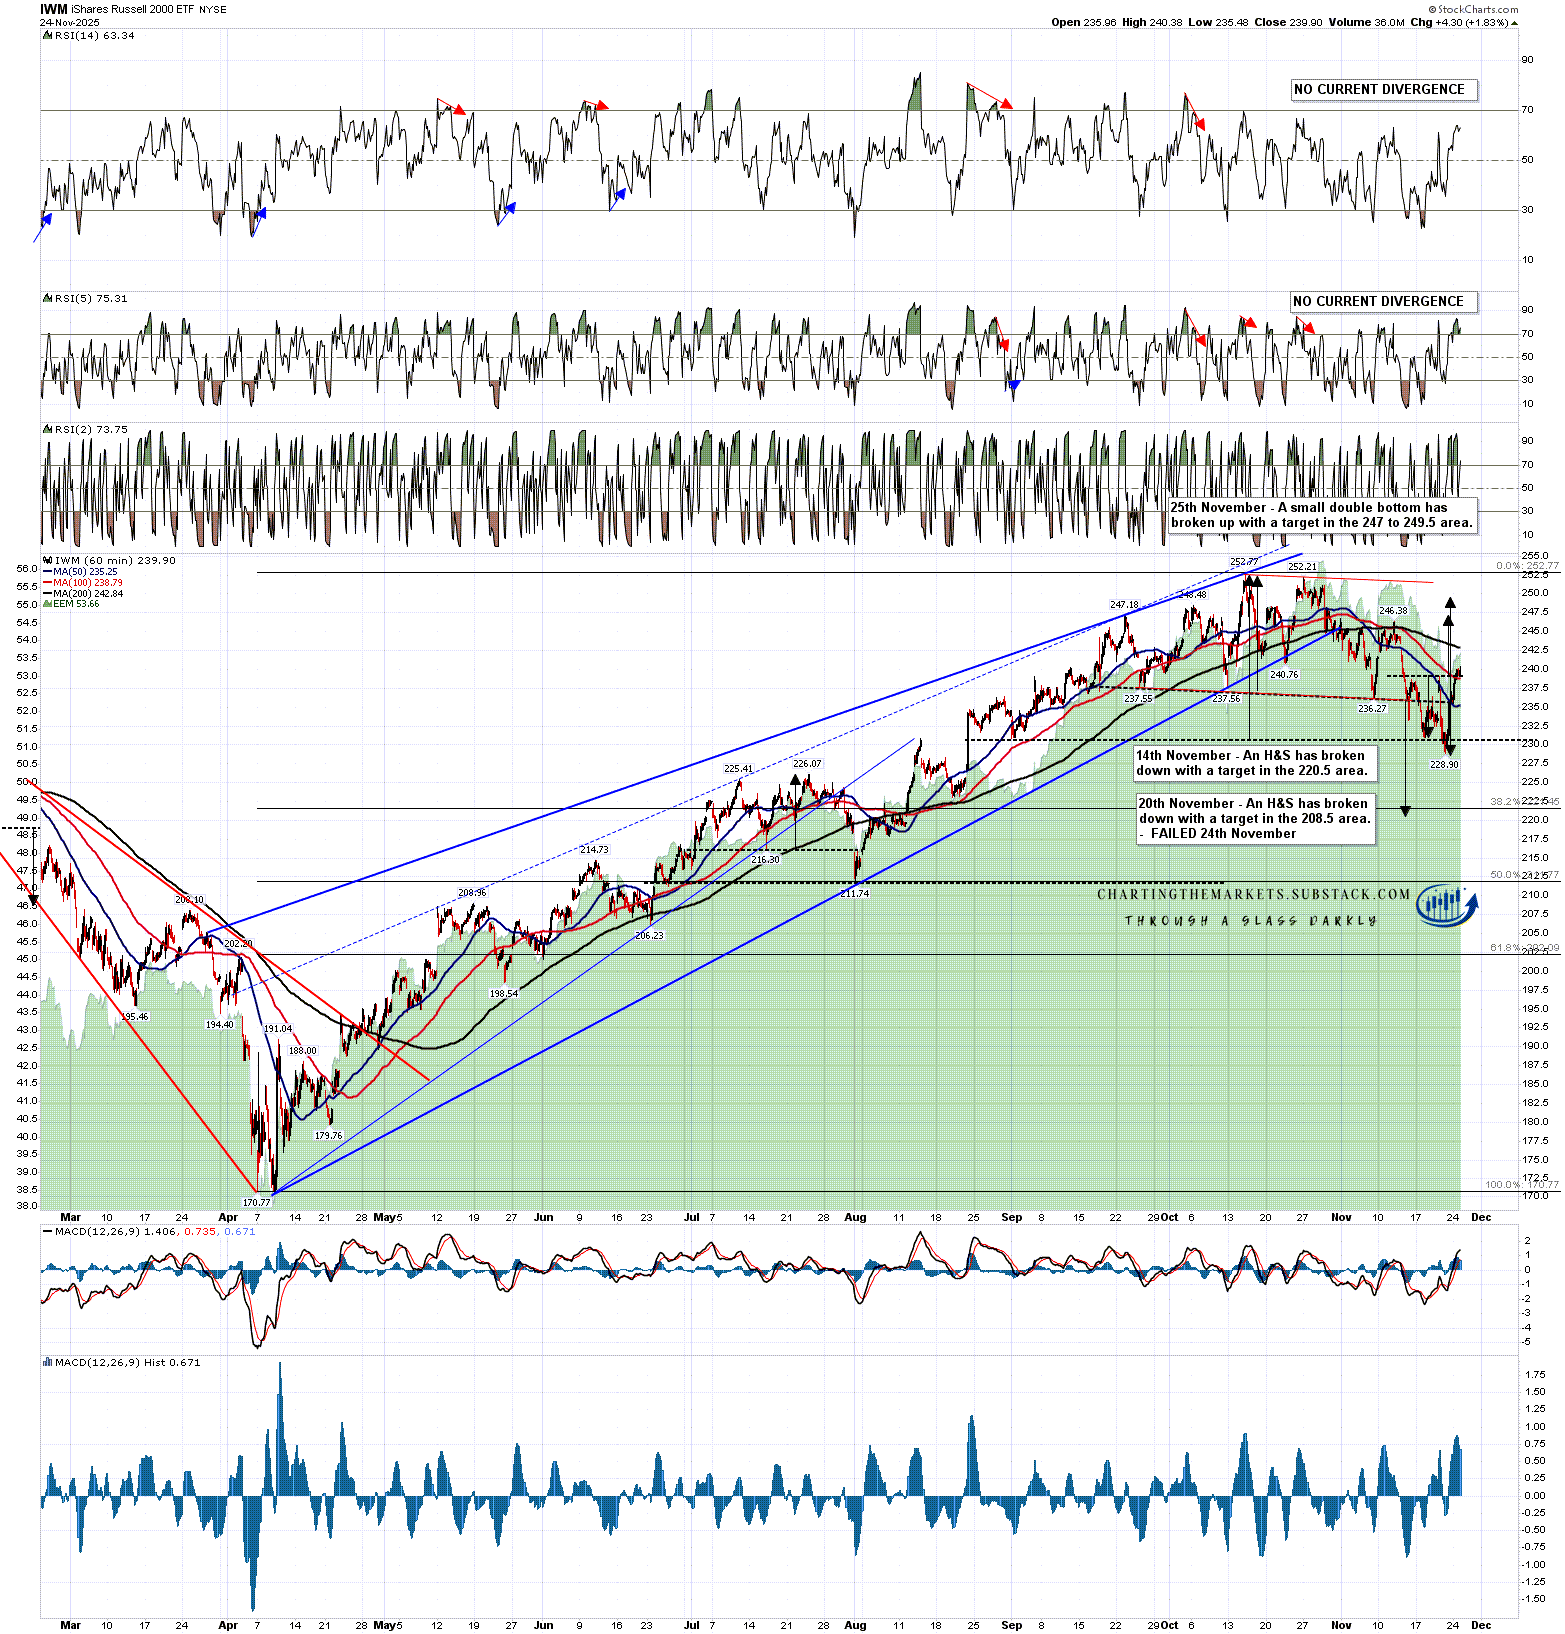
On the IWM hourly chart an H&S broke down last Thursday with a target in the 208.50 area. That H&S was invalidated on the break over the H&S right shoulder high at 239.10. However an earlier high quality H&S has previously broken down with a target in the 220.5 area and that H&S is still valid, so again, not a major failure yet.
IWM 60min chart:
The bottom line here is that SPX and QQQ need to hold their daily middle bands as resistance. If they do, the downside scenario still looks good and I’ll be leaning towards more downside. If SPX and/or QQQ break back over their daily middle bands and the H&S patterns on these fail I’d be looking for all time high retests across the board in a likely rally through Xmas.
If we do see more downside, I’d be expecting that to happen in the first two weeks of December.
If you don’t hear from me beforehand have a great Thanksgiving. :-)
If you like my analysis and would like to see more, please take a free subscription at my chartingthemarkets substack, where I publish these posts first. I also do a premarket video every day on equity indices, bonds, currencies, energies, precious commodities and other commodities at 8.45am EST, but only for paying subscribers. Other places to find me are my page on the platform previously known as twitter, and my YouTube channel.
No comments:
Post a Comment