
In my posts on 20th October, 24th October, and 28th October I was looking at the rising wedges on SPX, QQQ, DIA and IWM from the April lows and weighing the odds of these breaking down into a substantial retracement in the near future.
I was saying that these are all good quality mature patterns that I would normally expect to break down, but was concerned that we might instead see the start of a larger break up into December.
In my last post on 7th November I was noting that all those wedges had broken down and gave some downside target areas that I was looking at initially.
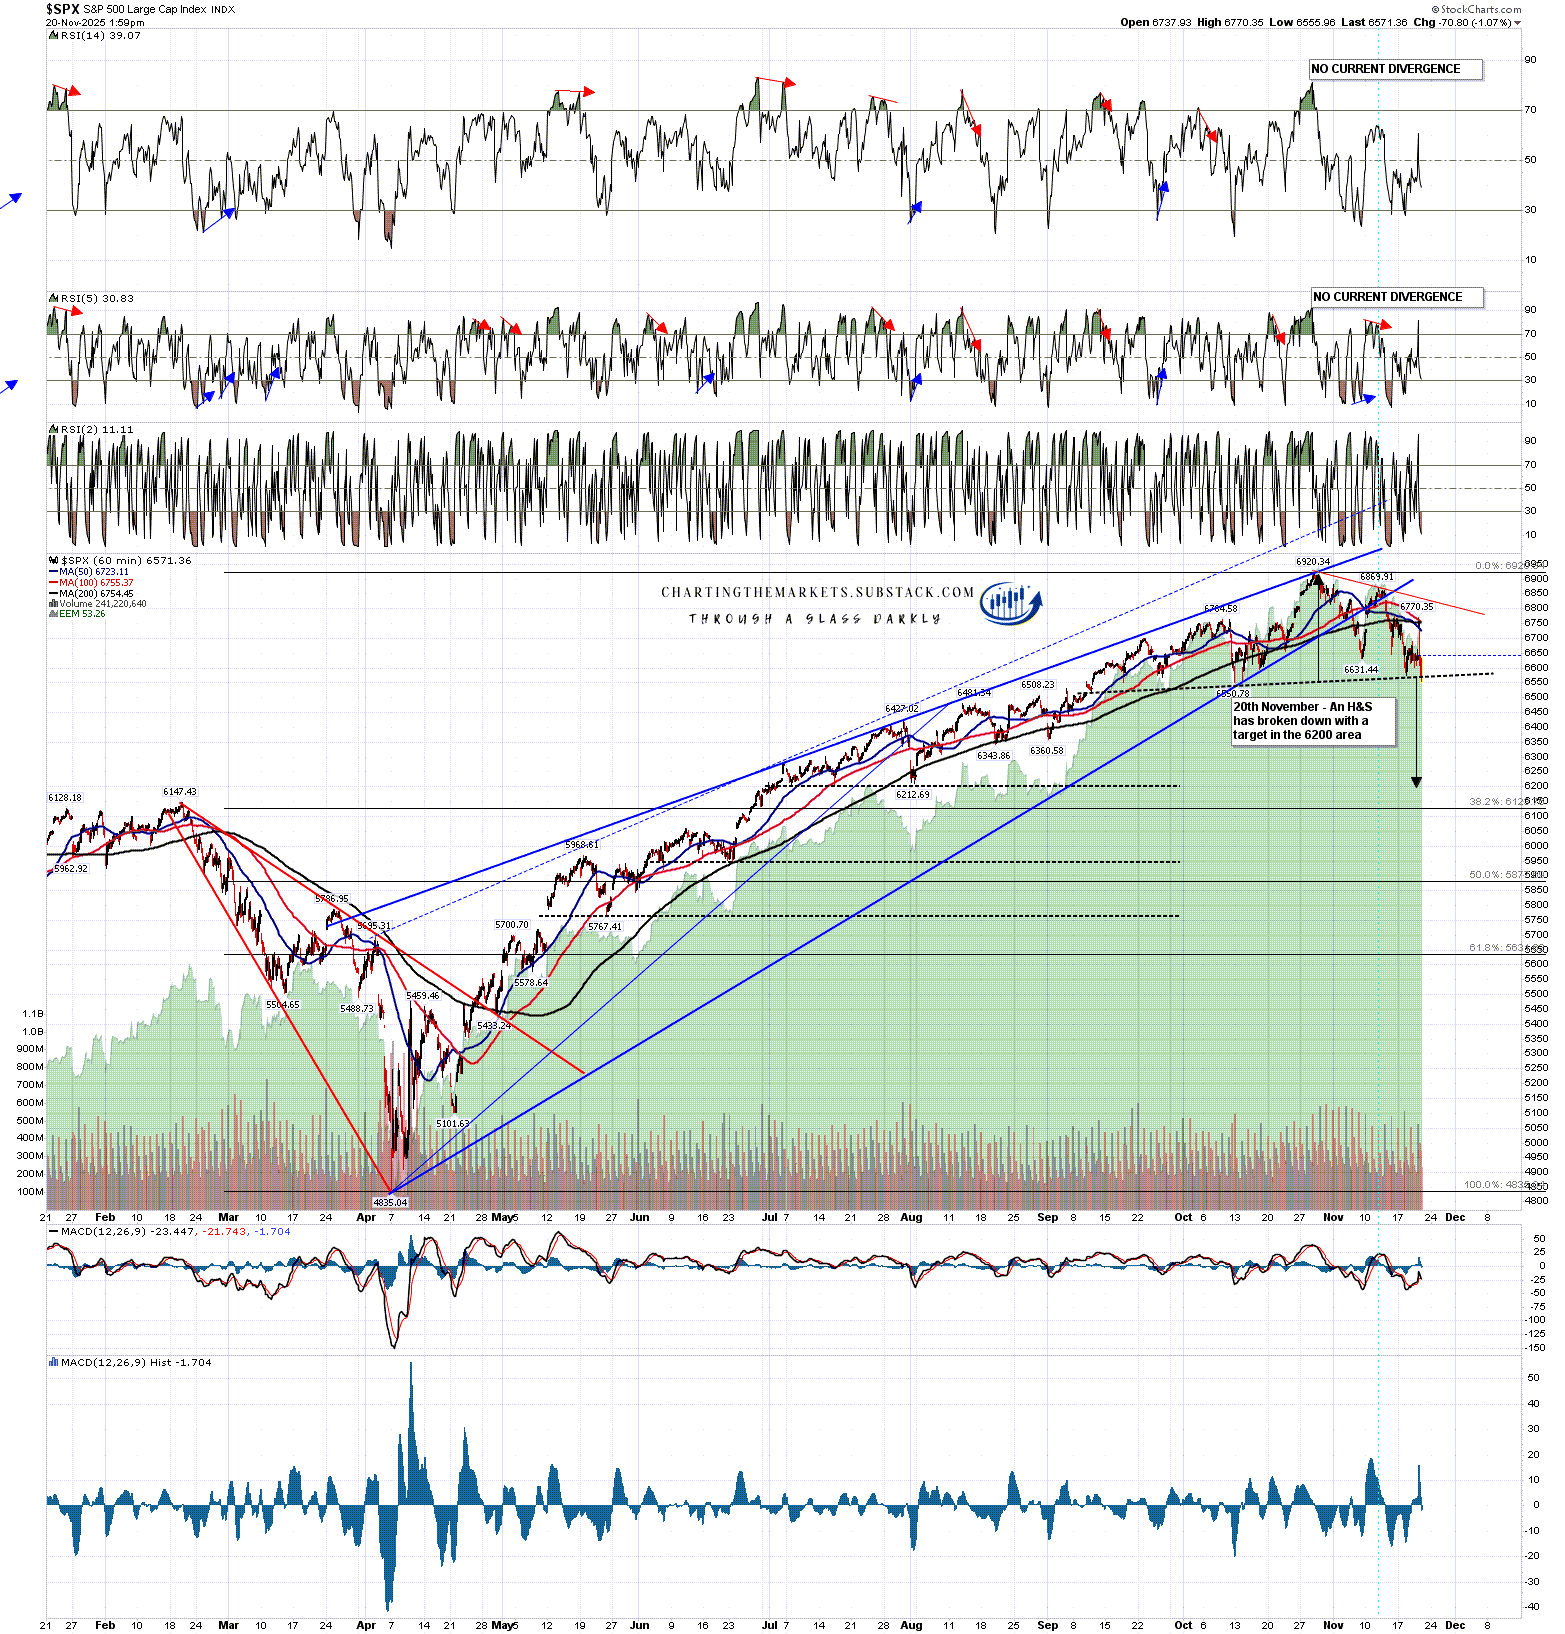
On SPX I was looking at the 6675 area, and on a break below, the possible H&S neckline at 6555.
The 6555 target area was hit yesterday, and the wild rally from the low yesterday and then full reversal back into lower lows today set up the H&S right shoulder, which has now broken down with a target in the 6200 area.
SPX 60min chart:
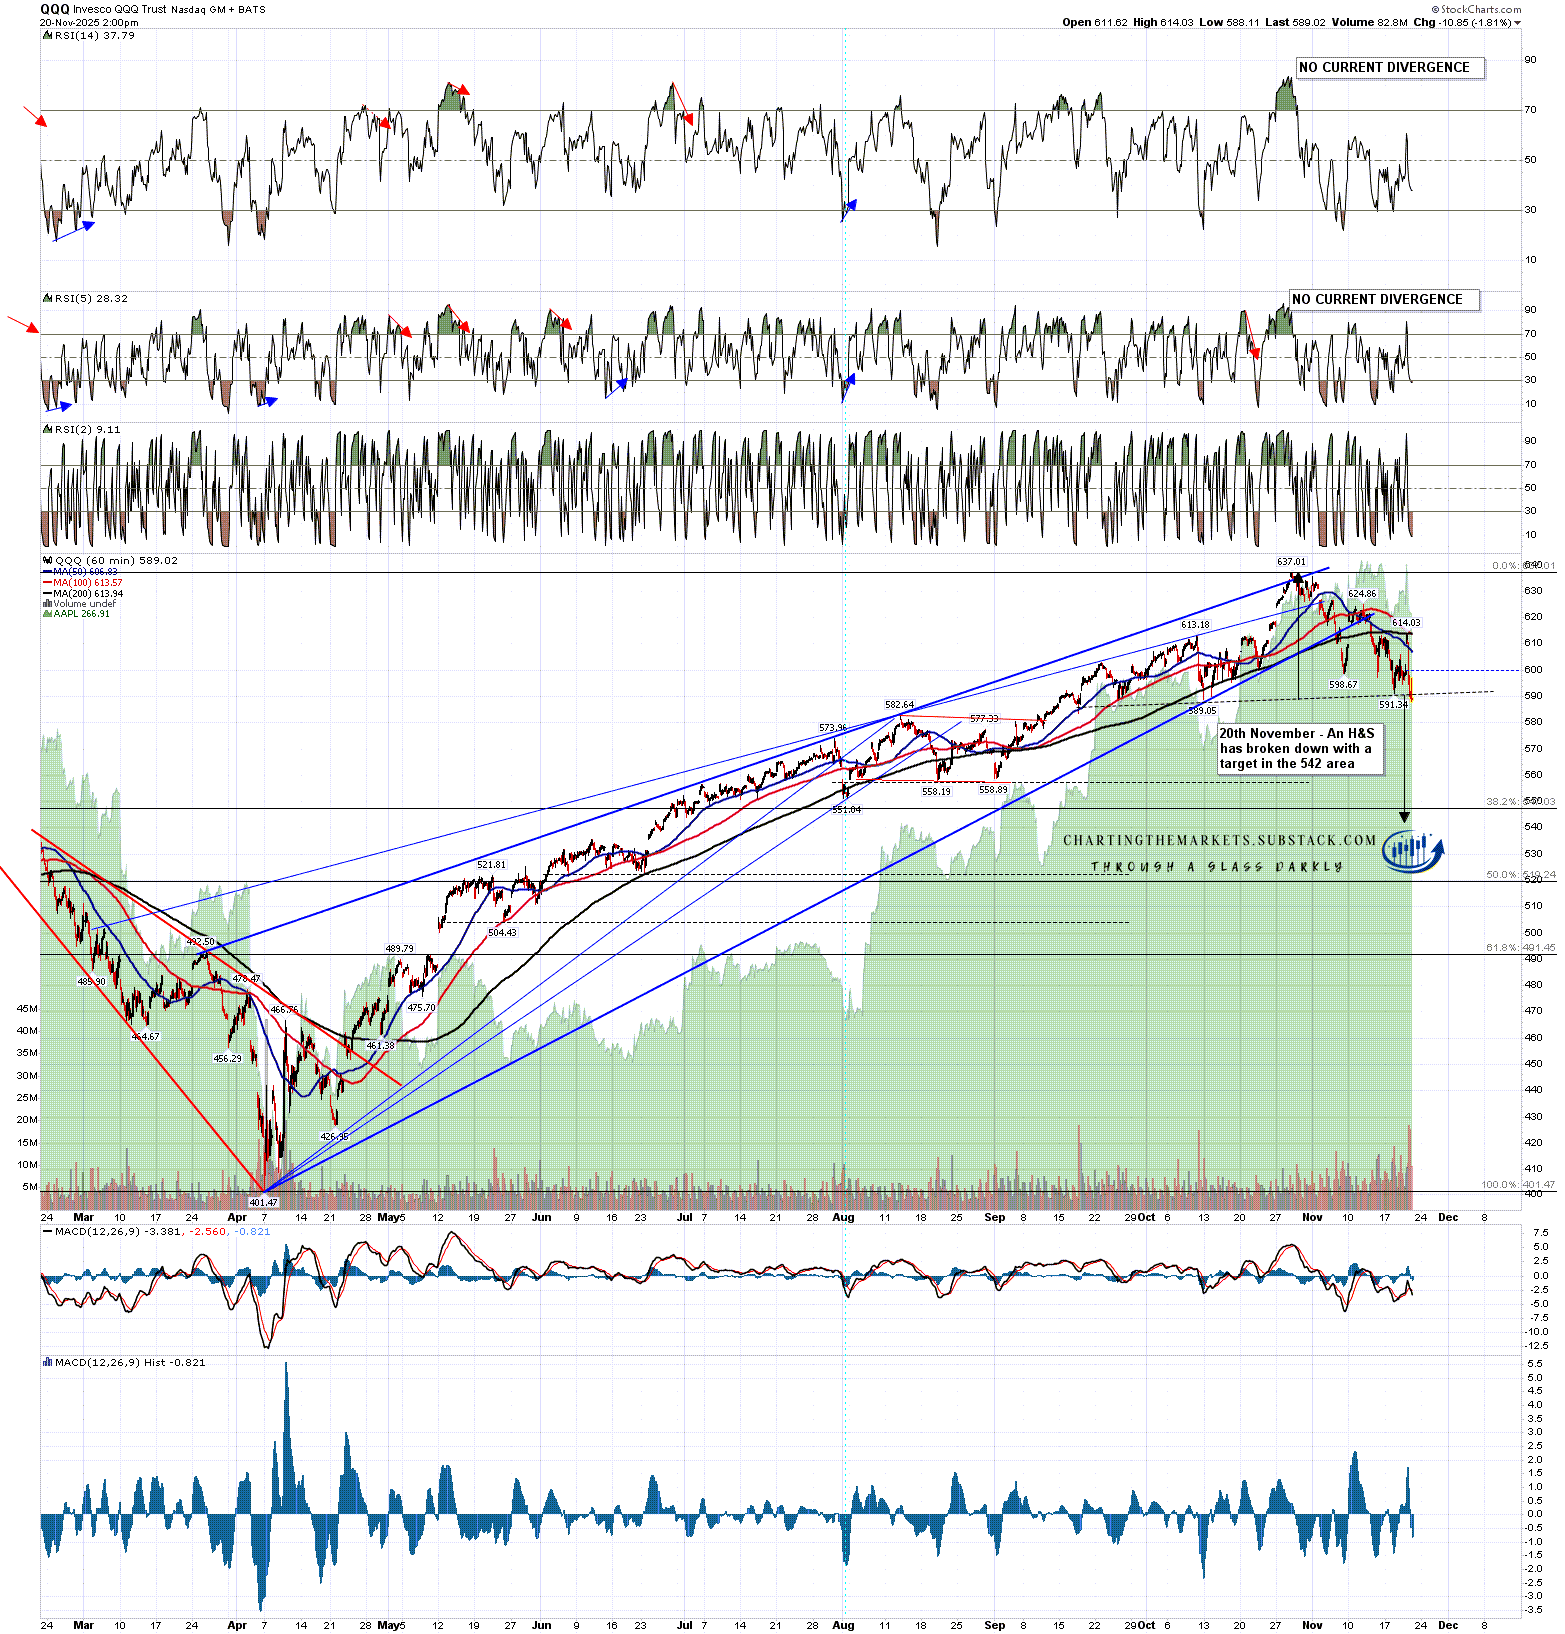
On QQQ I was looking at the retest of the October low and possible H&S neckline at 589.05.
The 589.05 target area was hit yesterday, and the wild rally from the low yesterday and then full reversal back into lower lows today set up the H&S right shoulder, which has now broken down with a target in the 542 area.
QQQ 60min chart:
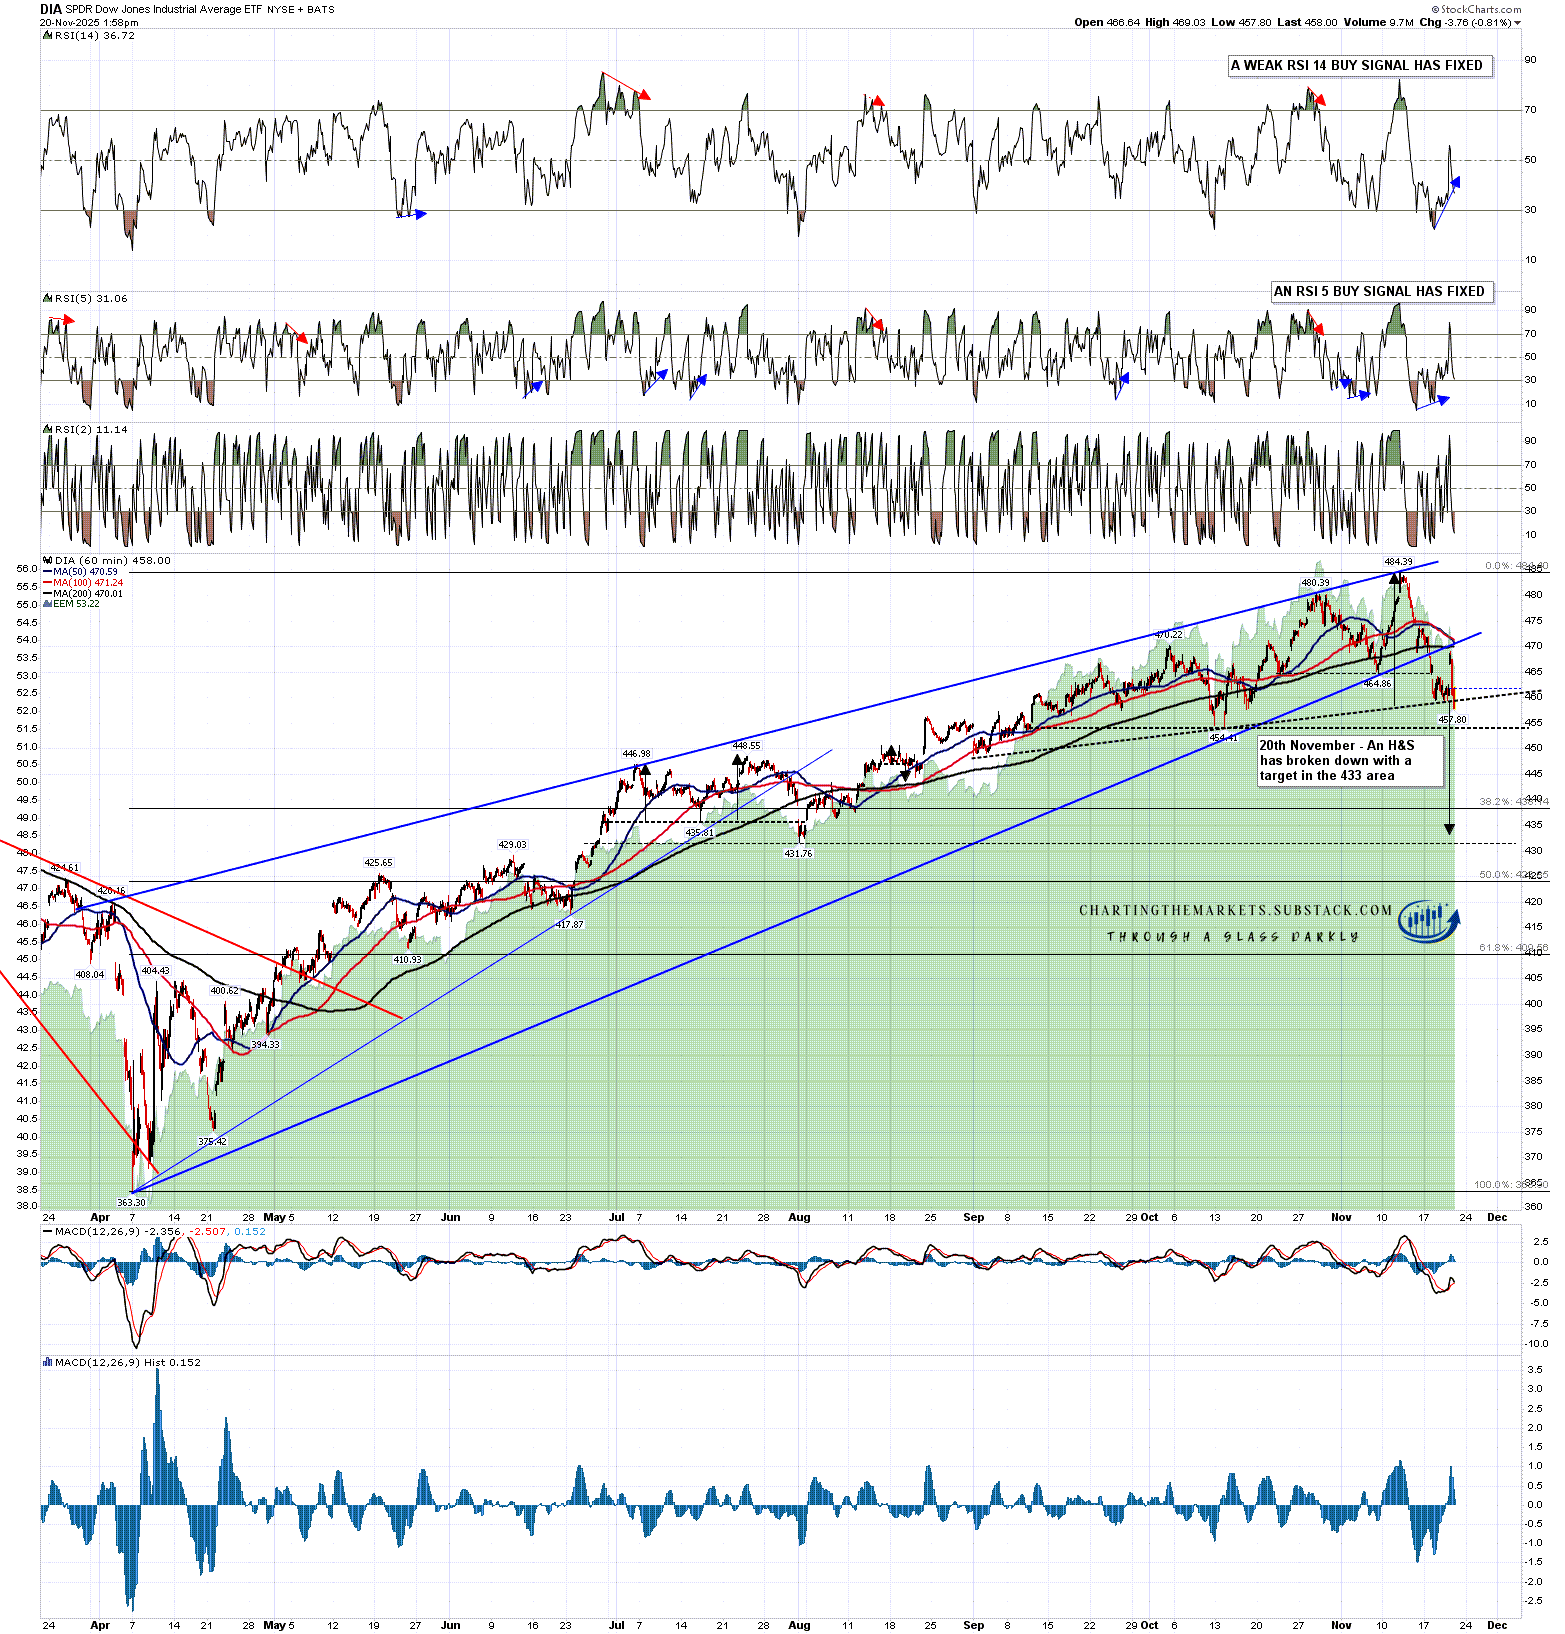
On DIA I was looking at the retest of the October low and possible H&S neckline at 454.41.
DIA came close to that H&S neckline yesterday and even closer today. The wild rally from the low yesterday and then full reversal back into lower lows today set up the H&S right shoulder, which has now broken down with a target in the 433 area.
DIA 60min chart:
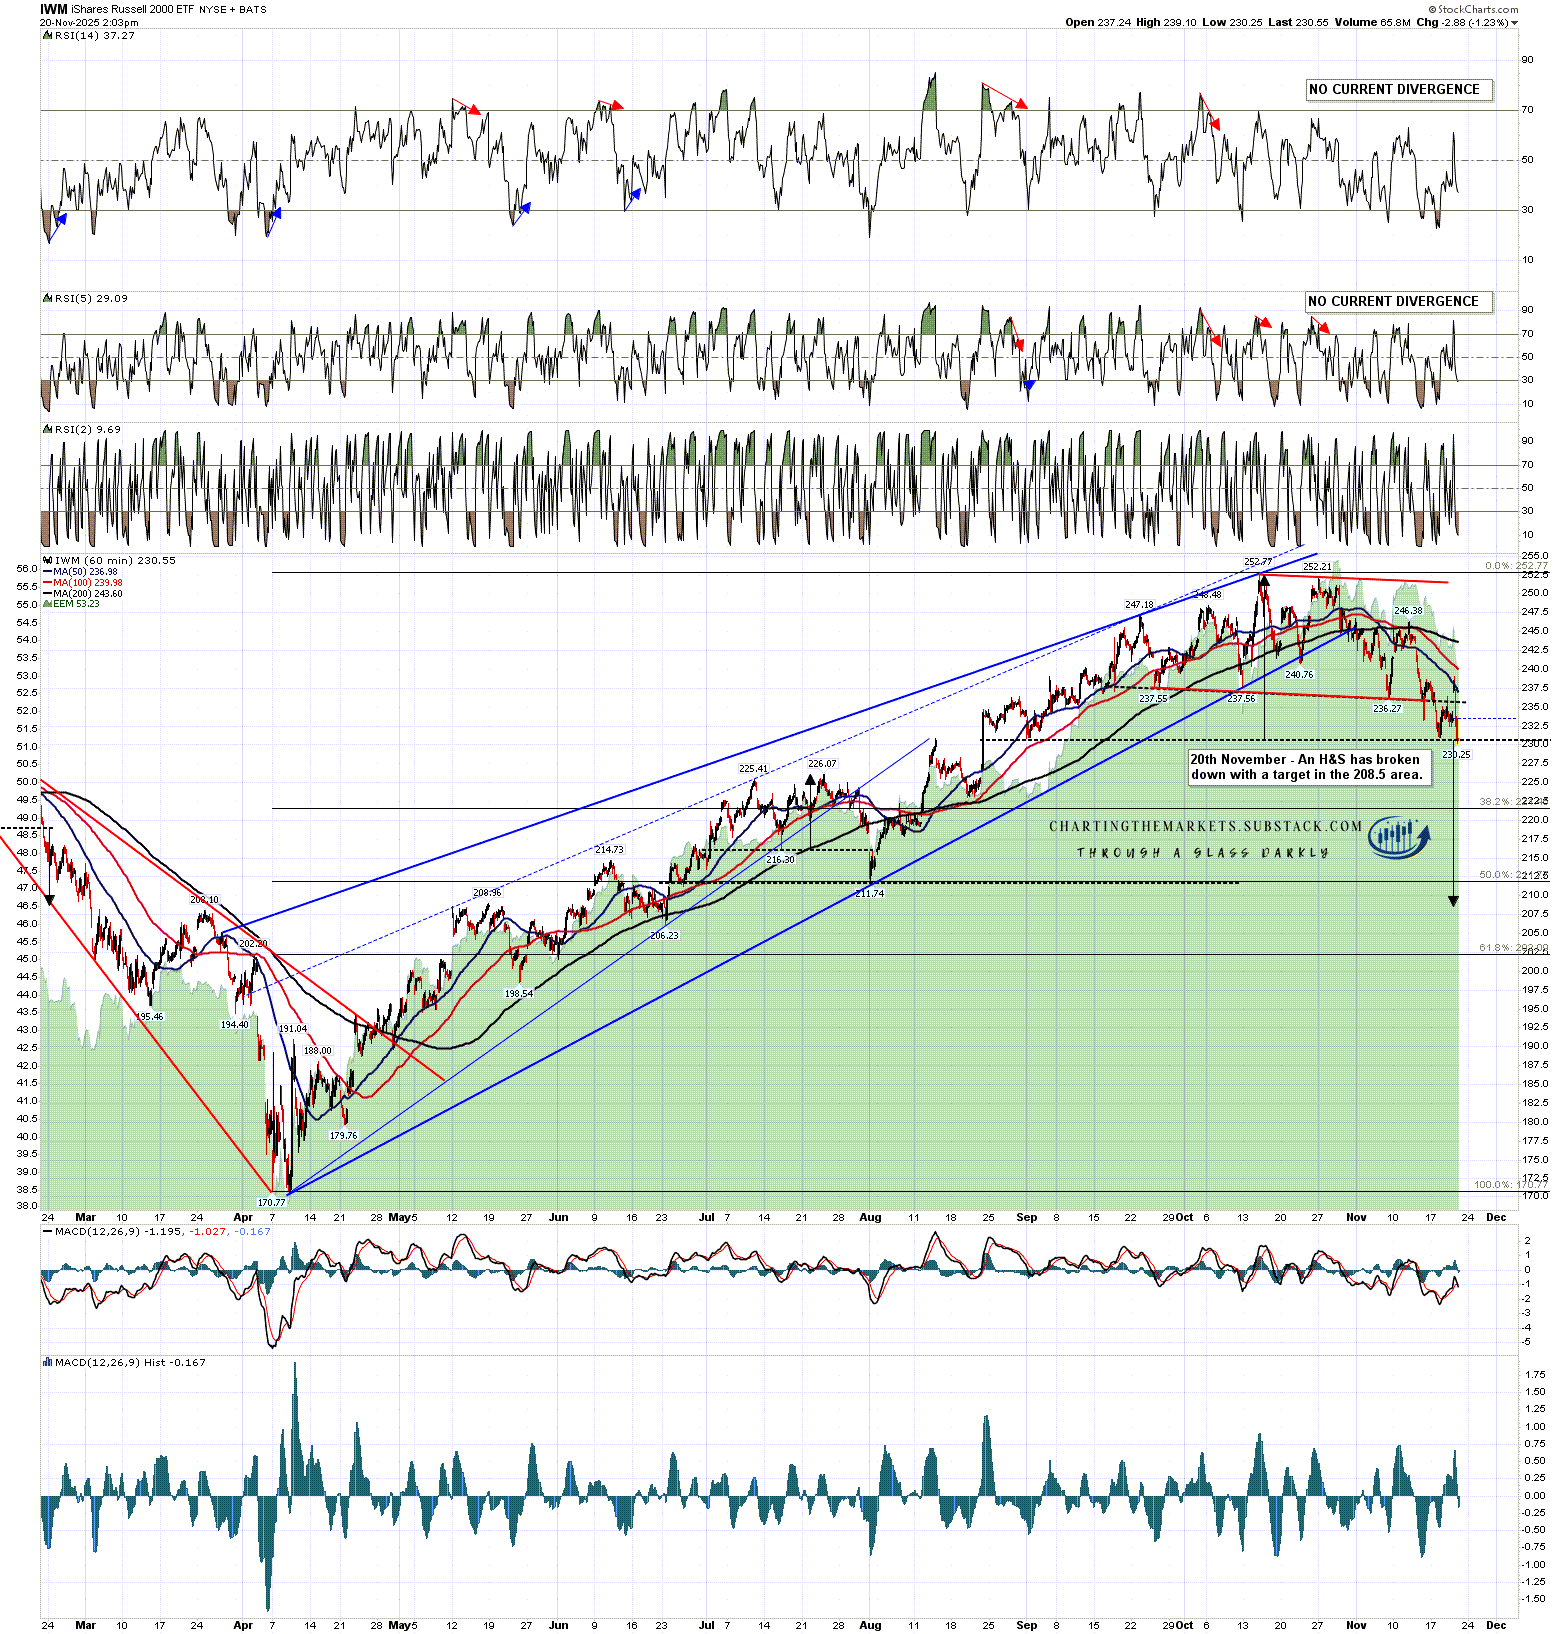
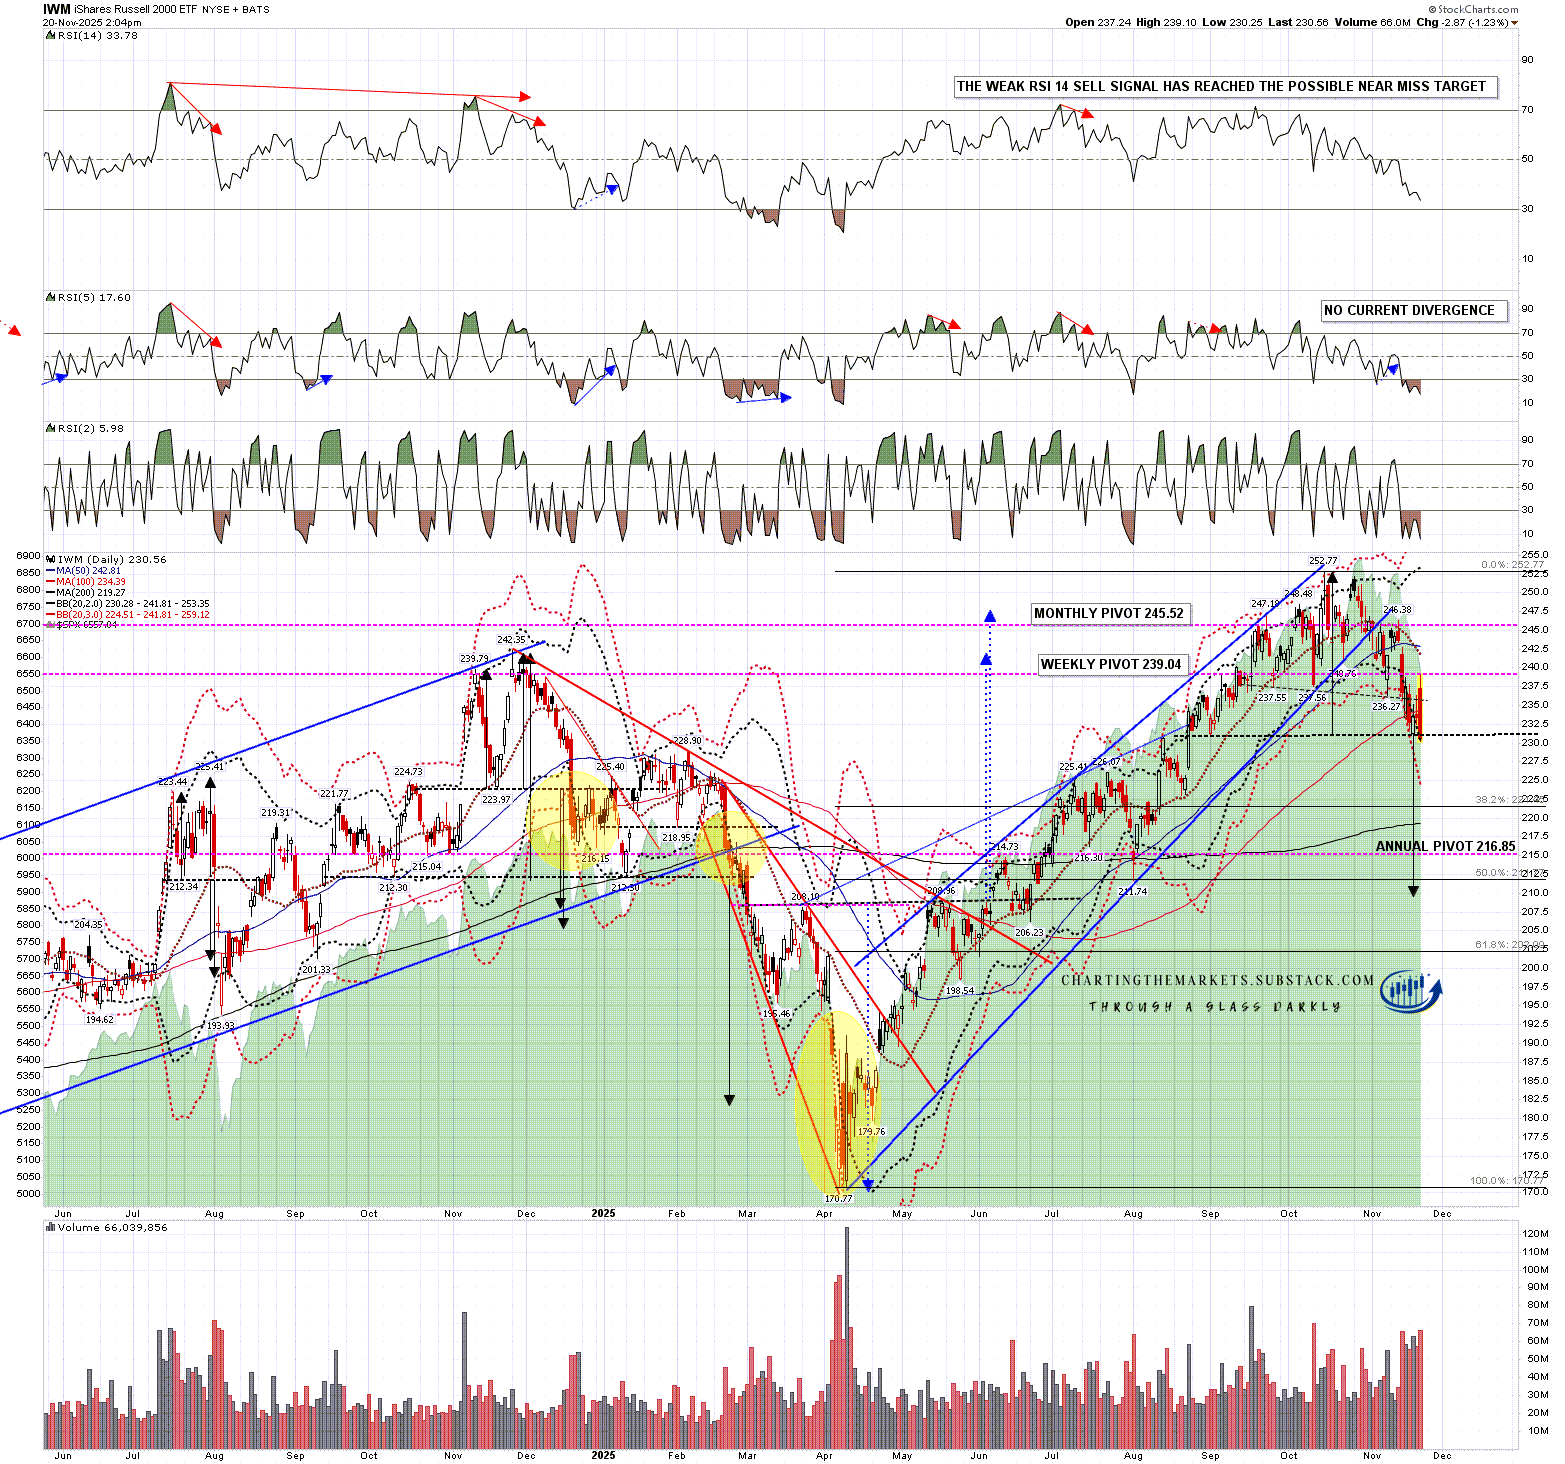
On IWM I was looking at the retest of the October low and possible H&S neckline at 237.55, though I noted that target was a lot closer than on the others as IWM had been leading the decline.
IWM hit that 237.55 target area, formed and H&S right shoulder and then broke down. However it then hit a lower alternate H&S neckline at 231 yesterday. From there the wild rally from the low yesterday and then full reversal back into lower lows today set up the larger H&S right shoulder, which has now broken down with a target in the 208.5 area.
IWM 60min chart:
I’ve been calling this pretty well on the way down, though the speed has surprised me.
In my subscriber only premarket video yesterday morning I had five of my six equity index futures with hourly 60min buy signals fixed or brewing, and predicted a strong rally.
In my subscriber only premarket video this morning I was looking at the possible H&S patterns forming across these four US equity indices and gave target areas which were all reached. I said I was expecting a low retest afterwards which we then saw this afternoon.
I will confess though that I was really expecting to see the lows retested on Monday or Tuesday and, if seen, that would have been considerably more bullish, with multiple possible daily RSI 5 buy signals forming at the low retest. The rally never made it to the close today, so those theoretical buy signals never had a chance to form.
That matters because the break down from these H&S patterns is an inflection point, and I would expect to see one of two outcomes here. The first is of course that these indices head further down and hit their H&S targets.
The second is that we see a full rejection back into the all time highs on all four of these indices, perhaps using the possible double bottoms formed by yesterday rally and today’s low retest to start that full reversal.
I like the double bottom setups here, but buy signals are very thin on the ground, with the only notable one being the hourly RSI 14 buy signal fixed on DIA. Usually if a full reversal was imminent, there would be more clues to suggest that might be coming.
In today’s premarket video I was asked whether I was expecting to see this decline last into the end of the year and I said no in reply. If we continue down from here then I’d still be looking for at least a strong rally and perhaps all time high retests in December, though likely as part of a larger topping process.
In the meantime there are clear targets below, and not much suggesting those won’t be hit. On the IWM daily chart below you can see that the daily middle band is turning down harder, the bands have expanded and there is plenty of room below to fall without hitting the daily 3sd lower band. Until we see more signs of life from bulls I’m looking lower.
IWM daily chart:
One potential fly in the bears’ soup however is that the historical stats all lean significantly bullish tomorrow through Wednesday next week. That hasn’t meant much in November so far but I’ll be watching that. The next bullish leaning day after Wednesday is on 8th December.
If you like my analysis and would like to see more, please take a free subscription at my chartingthemarkets substack, where I publish these posts first. I also do a premarket video every day on equity indices, bonds, currencies, energies, precious commodities and other commodities at 8.45am EST, but only for paying subscribers. Other places to find me are my page on the platform previously known as twitter, and my YouTube channel.
No comments:
Post a Comment