
In my post on Wednesday 22nd October I was looking at the major support being tested on Bitcoin (BTCUSD), Solana (SOLUSD), and Ethereum (ETHUSD), and saying that sustained breaks below those support levels would boost the case that the bull market on Crypto had already ended, barring possible high retests as part of the topping process.
In my post on Thursday 30th October I was looking in detail at those key support levels on the weekly and daily charts and looking at the possible H&S patterns forming on the Solana and Ethereum charts.
In my last post on Tuesday 4th November I was looking at the H&S patterns on the Solana and Ethereum charts, which had started breaking down, and was warning that these big three Crypto instruments were on the verge of a clear break down that would likely confirm the end of the bull market from the December 2022 low.
Since then we have seen that break down, and the bull market on Crypto is likely over, barring a possible high retest on Bitcoin to make the second high of a double top.
In the shorter term Bitcoin reached the double top target in the 88.3k to 90k range, and then all the way down to 80.6k before starting a rally with equities on Friday.
This rally could have legs, this is Thanksgiving week, with bullish leaning days (on equities) Monday through Wednesday this week, a holiday on Thursday and a half trading day on Friday. A strong enough performance on equities this week could start a Santa rally, and that would likely pull Crypto prices up as well.
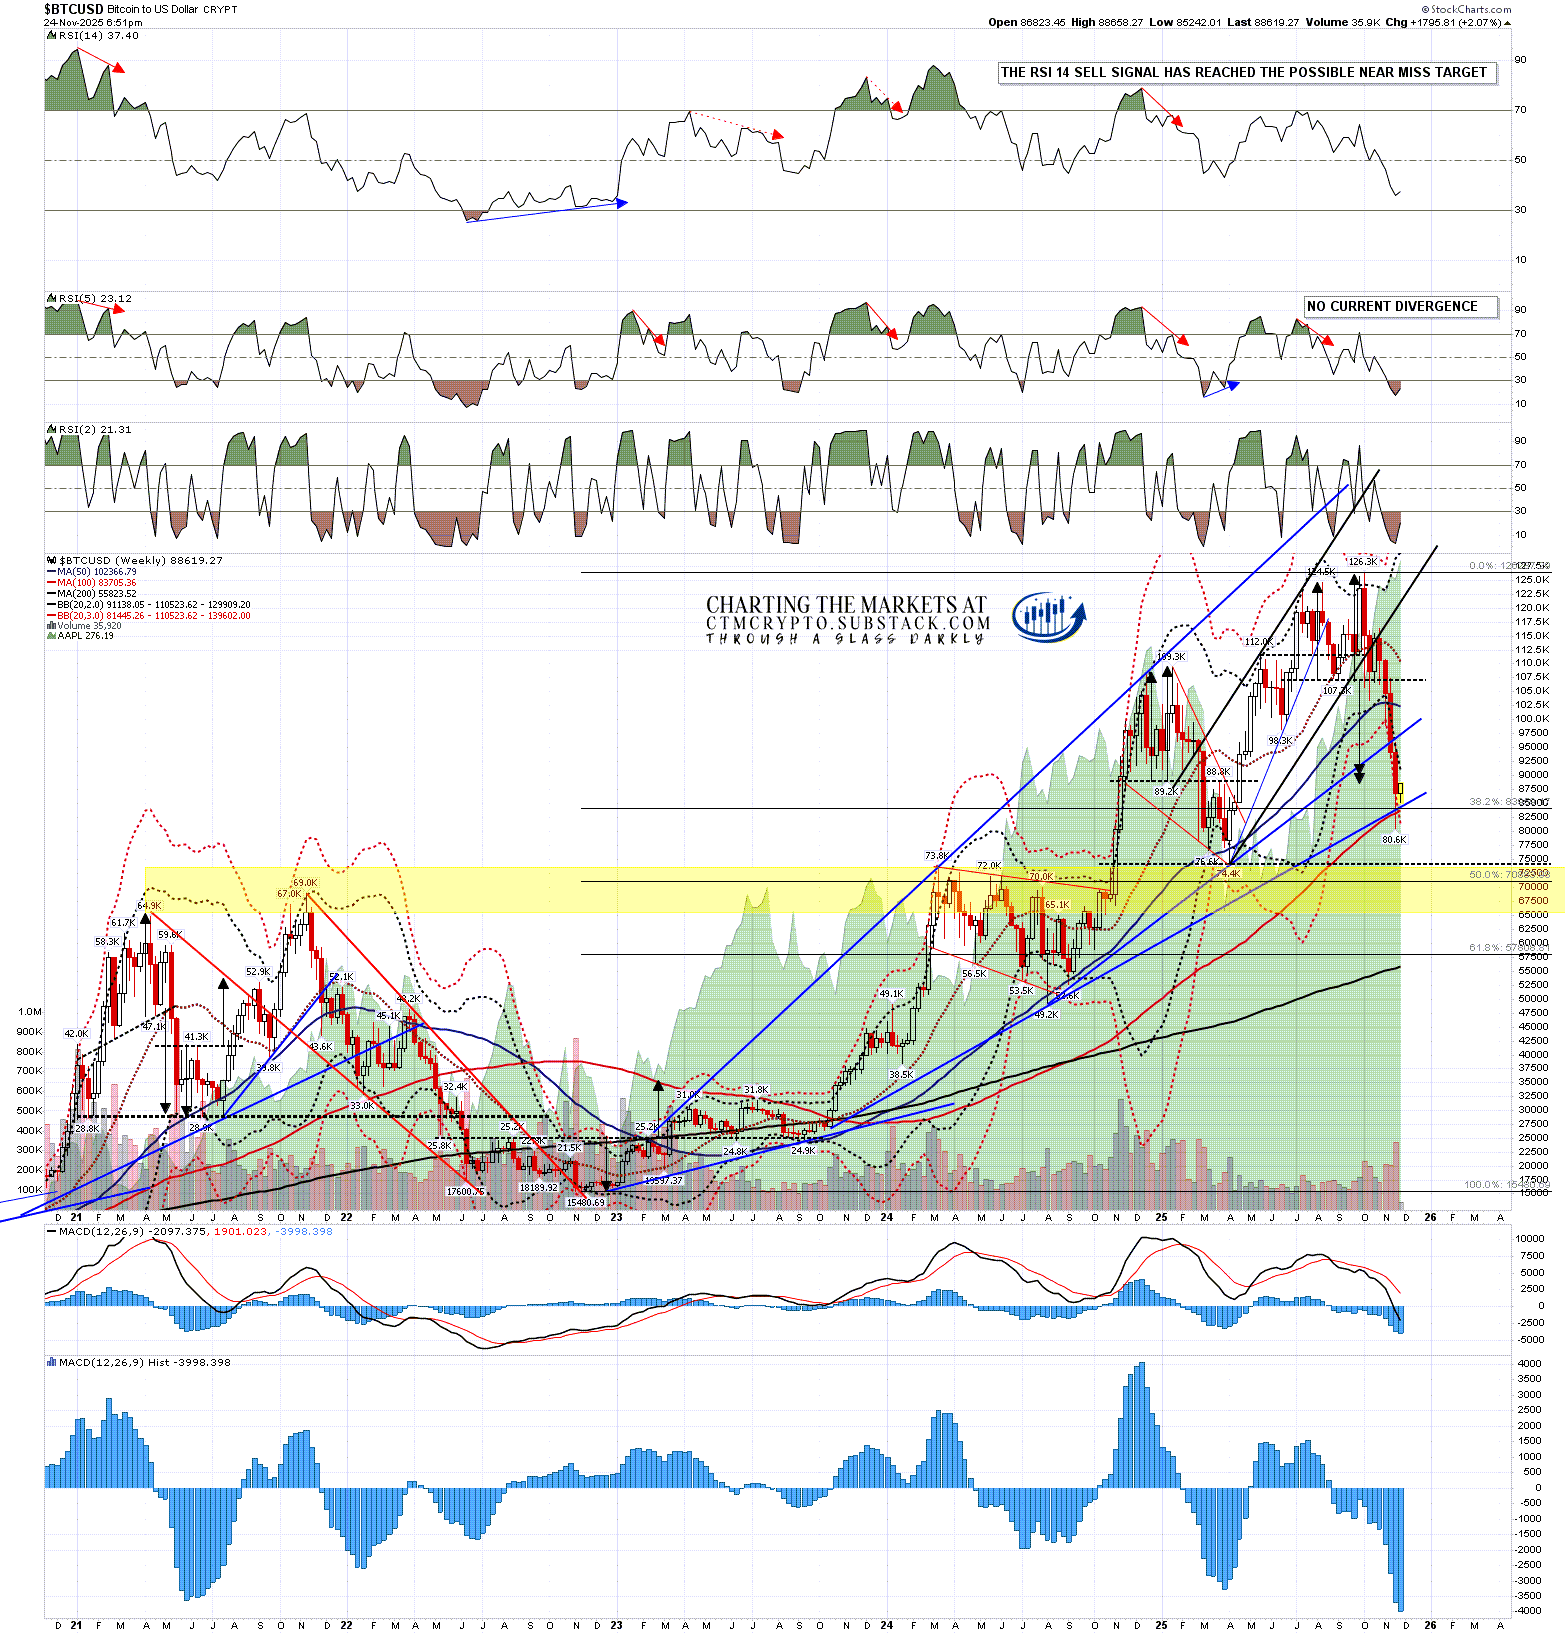
In terms of downside targets the key support at the 50 week MA, currently at 102,360, has been broken and we saw a second confirming weekly close below yesterday. If we see a strong rally from Friday’s low then that could be a rally target, but historically there’s no reason to expect a retest this soon after the break.
On the downside the double top has already reached target but there is another very obvious target below. The 2021 high was at 69k, and the first new high above that in March 2024 was at 73.8k. After a bull flag formed from there into October 2024 (which I called as it formed) then the next leg up was into 109.3k and the next bull flag (which I called as it formed) bottomed in April 2025 at 74.4k, an almost perfect backtest of the broken high at 73.8k.
What this means is that there is a very strong support level and possible H&S neckline in the 74.4k area and, if there is more downside coming soon, that would be the obvious target, and I’d expect to see decent support there.
BTCUSD weekly chart:
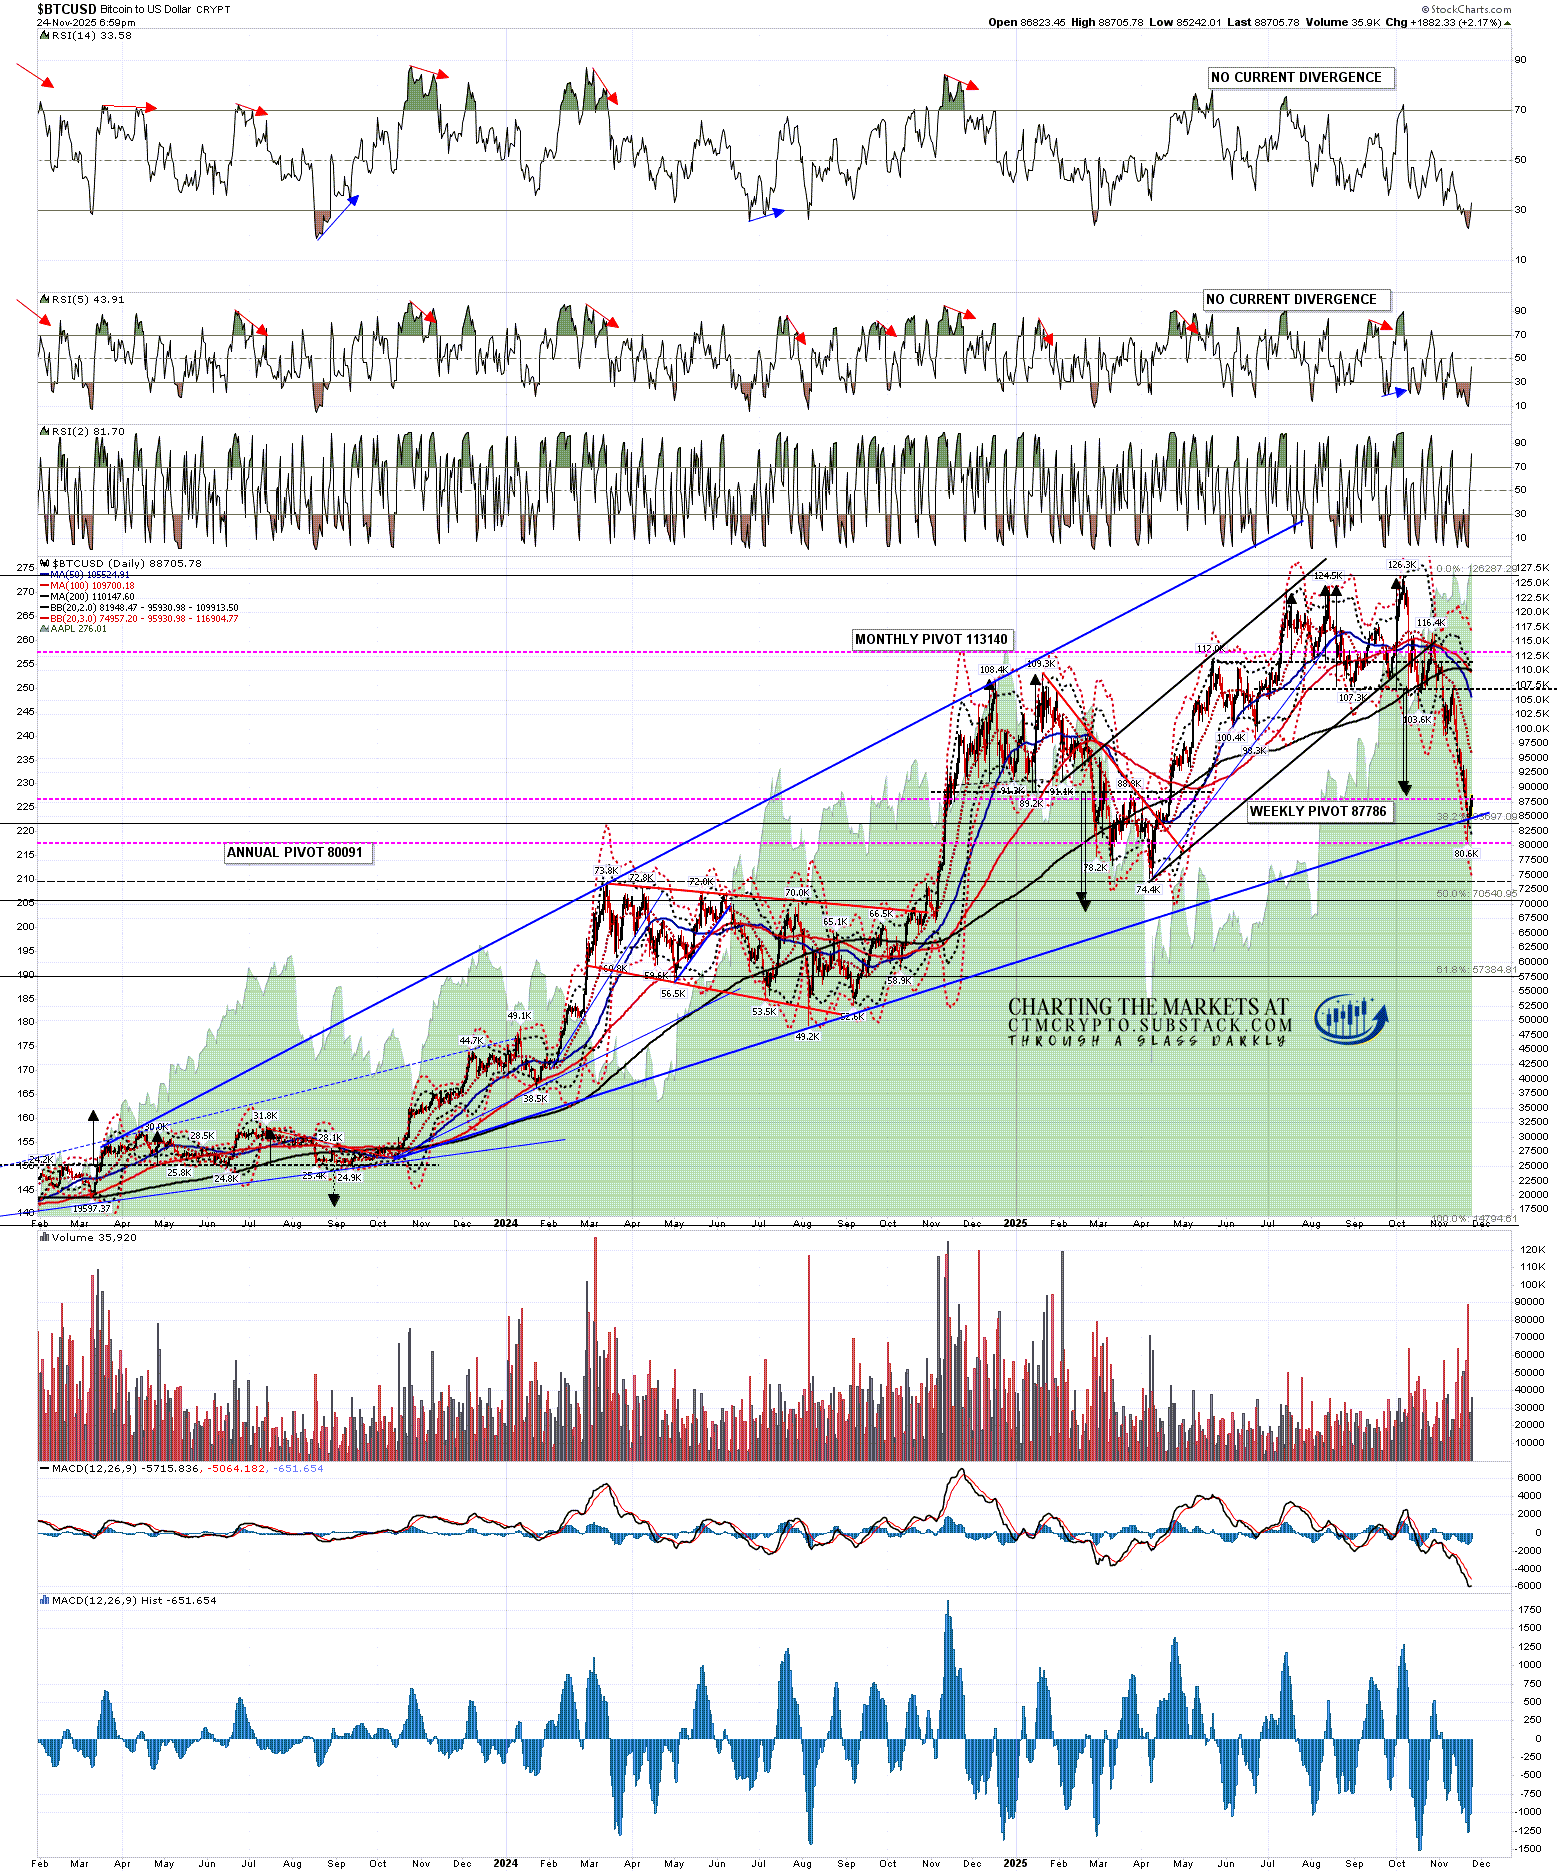
On the Bitcoin daily chart the obvious target for a strong rally would be at the daily middle band, currently in the 95.9k area. On a sustained break above that I’d be watching for the resistance at the 50 week MA, currently in the 102.36k area.
BTCUSD daily chart:
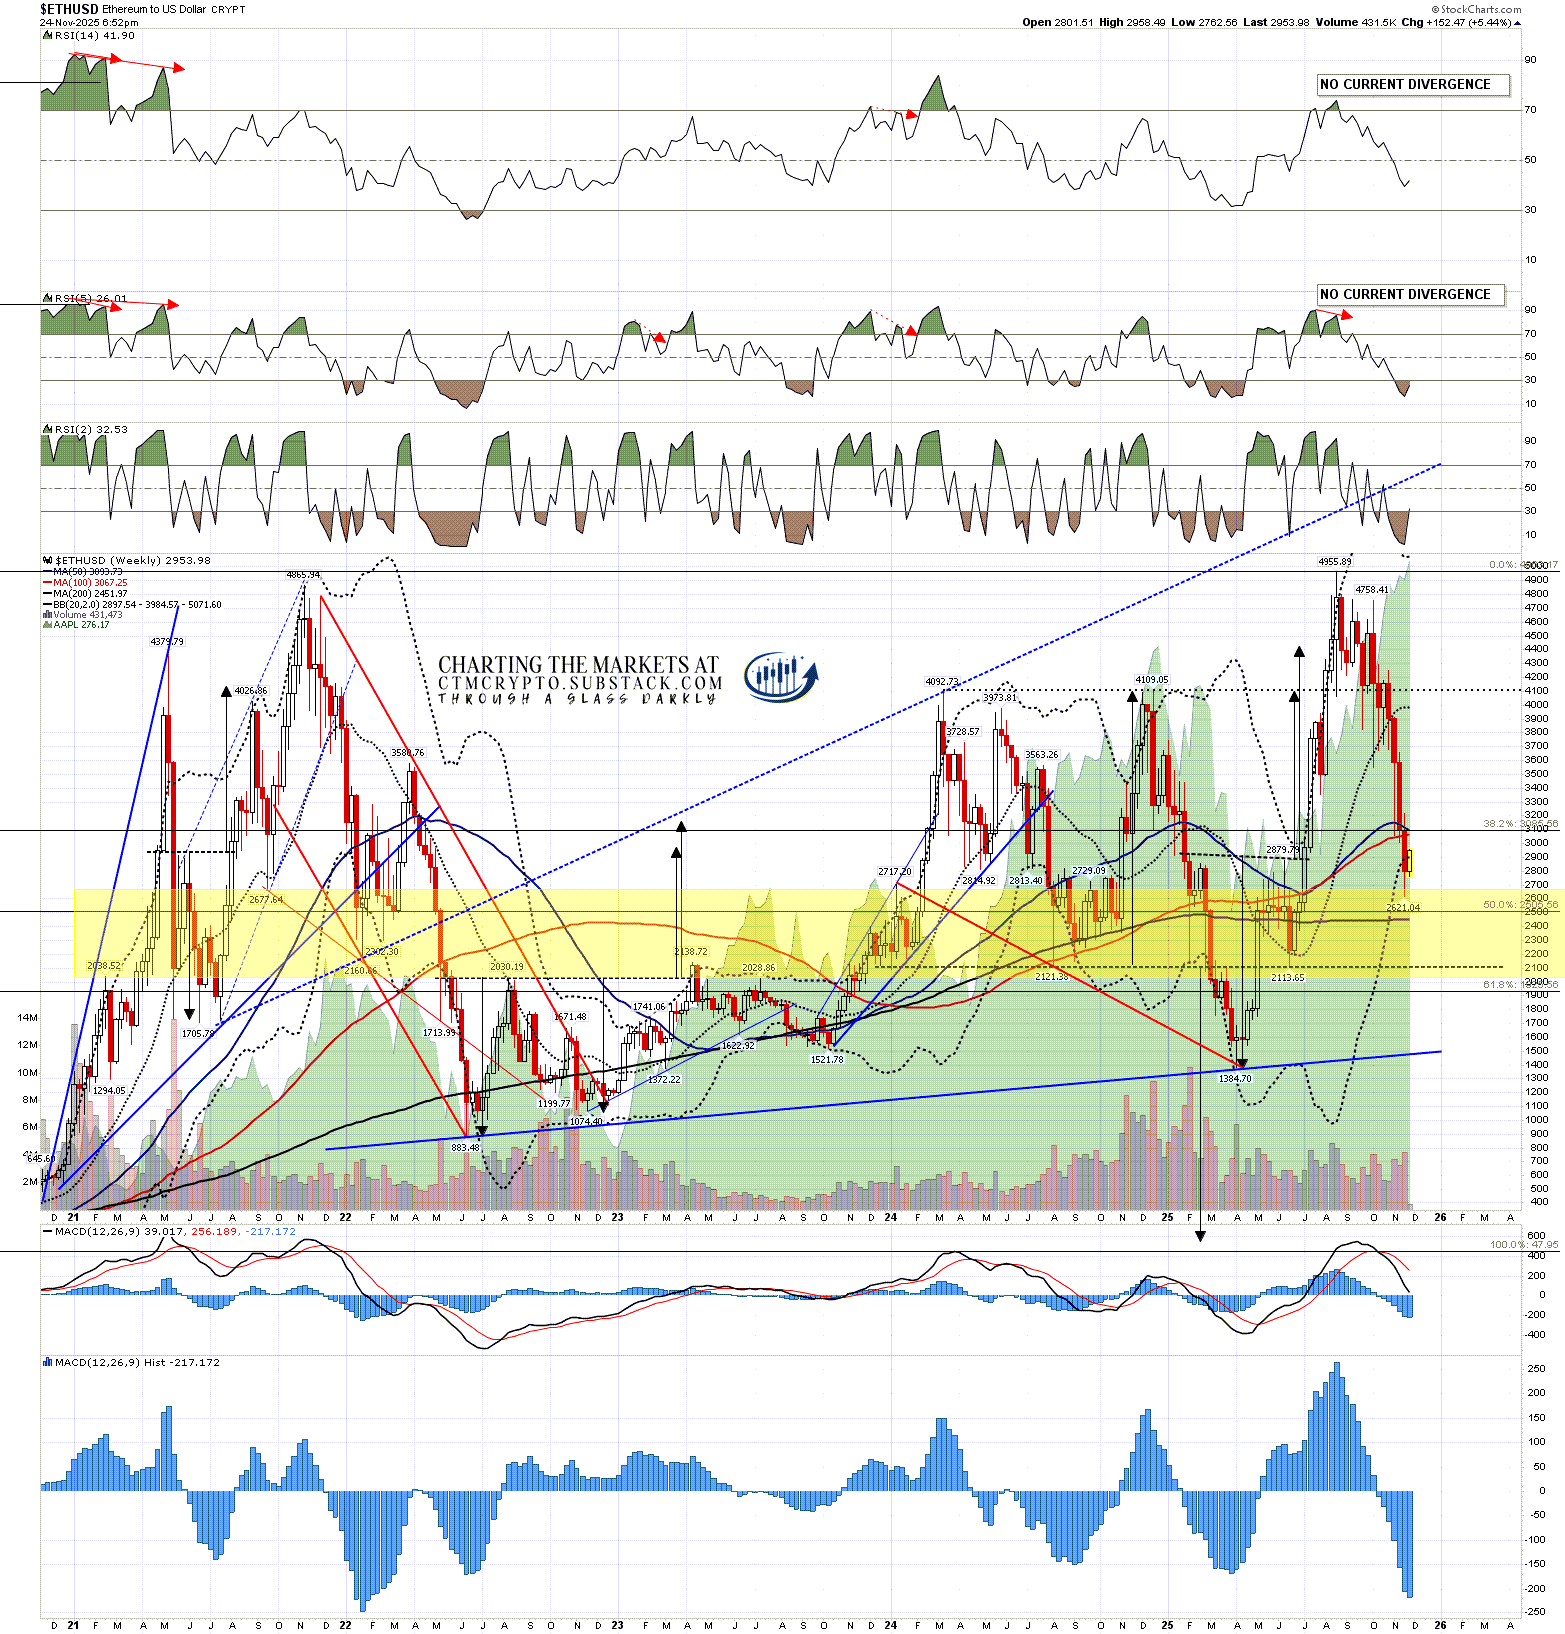
On the Ethereum weekly chart the key support was at the 50 week MA, currently in the 3100 area. That has now seen two weekly closes below so that is a confirmed support break.
ETHUSD weekly chart:
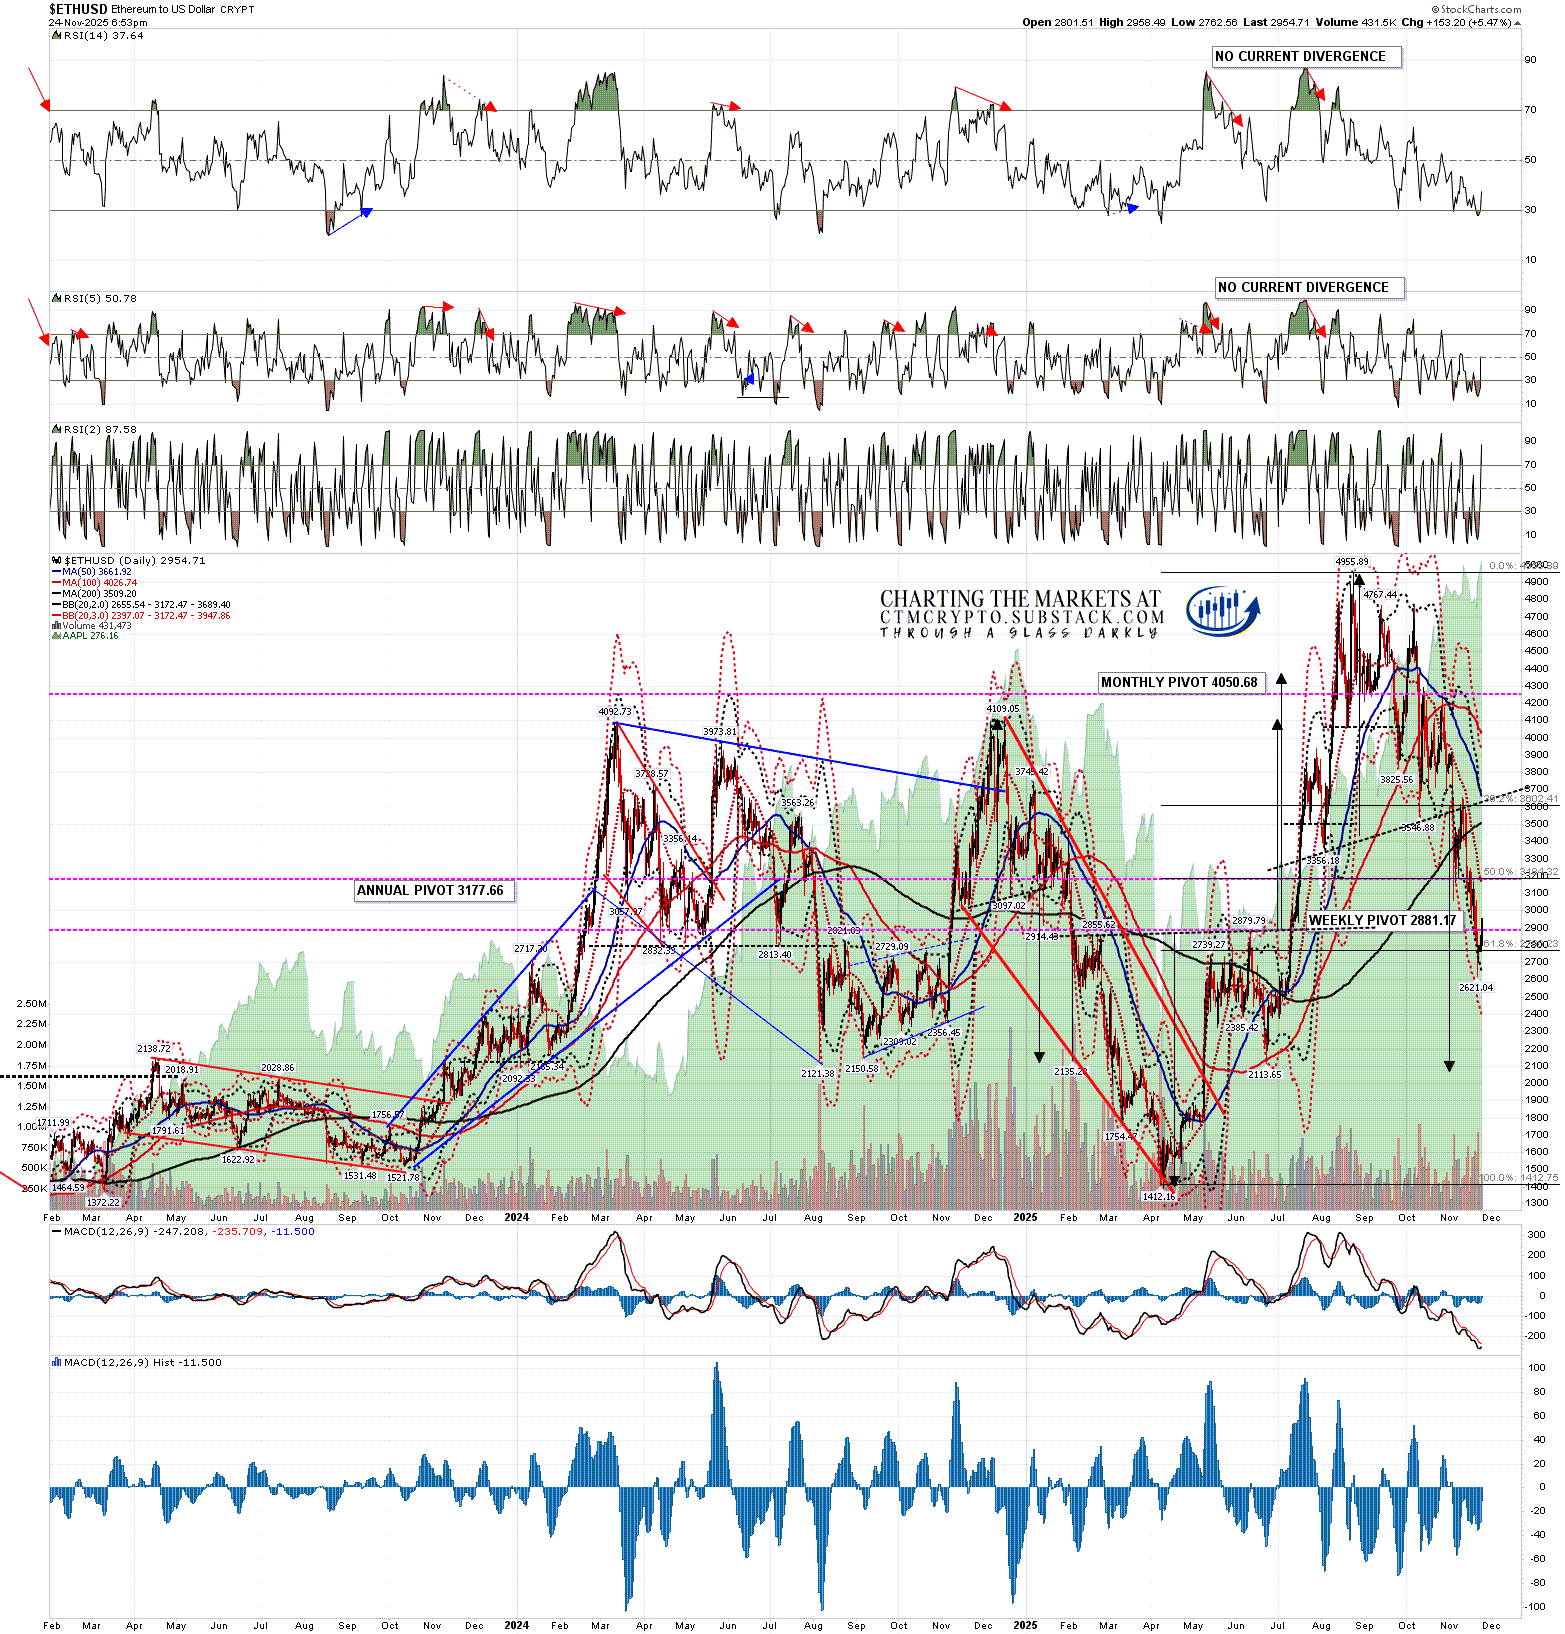
On the Ethereum daily chart there is still a fixed H&S target in the 2050 area, and I’m not seeing anything to suggest that target won’t be reached, but if we see a rally here the obvious first target would be the daily middle band, currently at 3172, and on a sustained break above those the obvious targets would be the 200dma, currently at 3509, just below the 50dma, currently at 3662.
Wherever this potential rally tops out, I’d still expect that H&S target in the 2050 area to be reached.
ETHUSD daily chart:
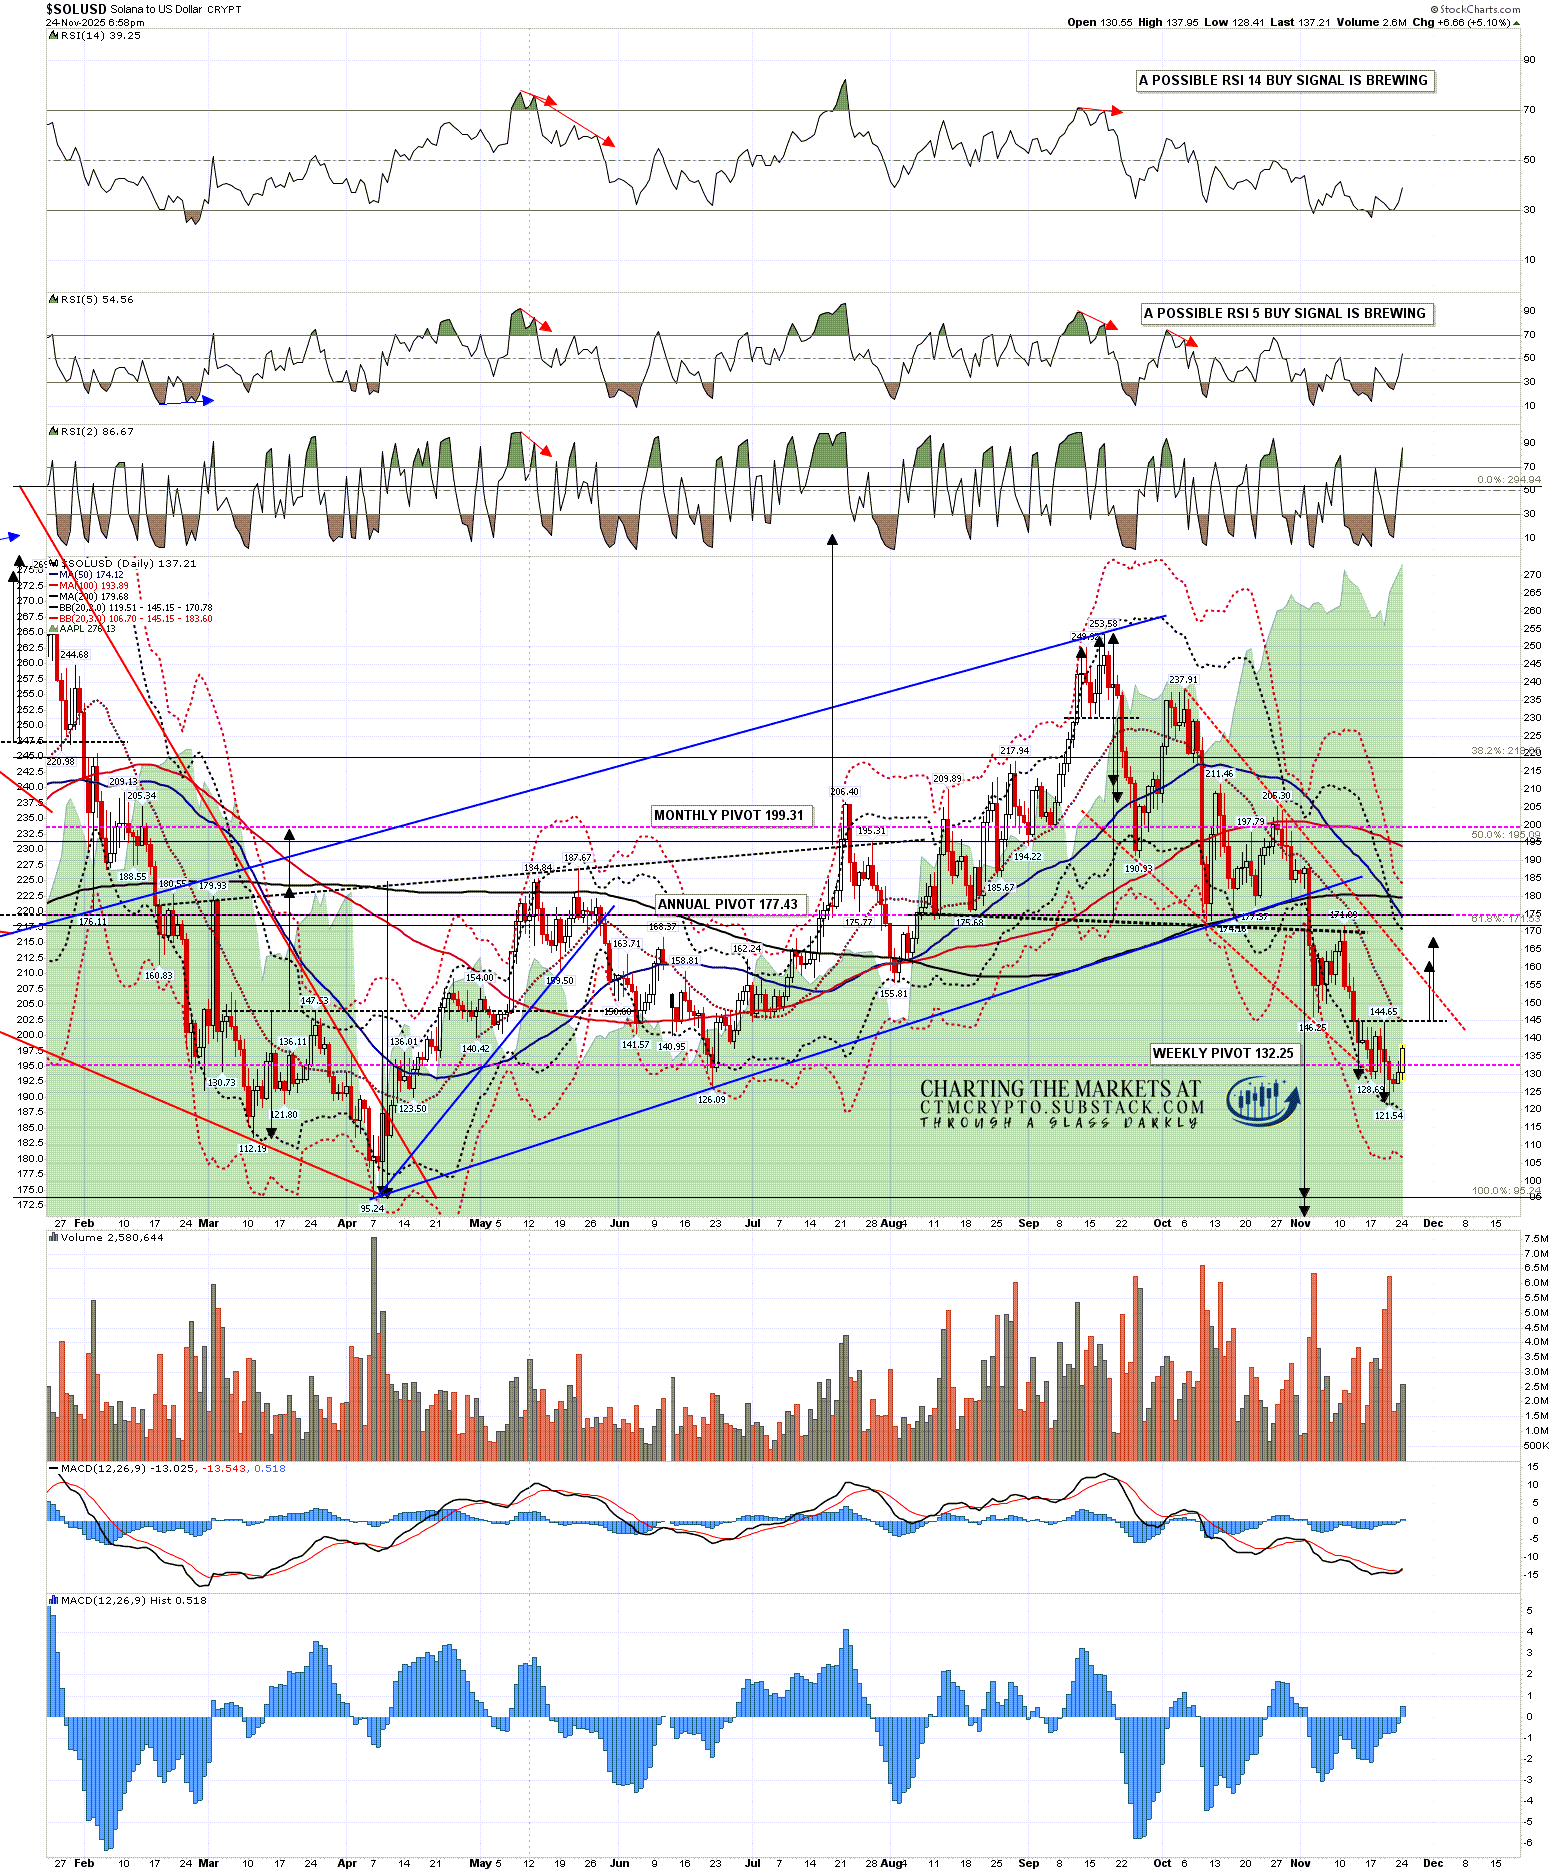
Solana is a somewhat different story, as Solana is the only one of these three where there is positive divergence on the daily chart. If we see a close today in the 137k area that Solana has reached at the time of writing, both RSI 14 and RSI 5 buy signals would fix.
The first big target for a rally would also be the daily middle band, currently at 144.15, but on a break above I would note that there is a possible double bottom setup on the chart below, and on a sustained break above 144.65 the double top target would be in the 160.60 to 167.75 area, setting up a possible backtest of the 50dma, currently in the 174 area.
On the downside there is a fixed H&S target at a retest of the April low at 95.24, and the IHS that had previously broken up with as target in the 282-3 was invalidated on Friday’s break below that IHS right shoulder low at 126.09.
Wherever this potential rally tops out, I’d still expect that H&S target at 95.24 to be reached.
SOLUSD daily chart:
What’s the bottom line here? This Crypto bull market is likely over, Bitcoin is likely in a topping process that might involve a high retest, and the next obvious big move on all three of these is a bear market that should last through 2026 into a likely low close to the end of 2026.
I’m not going to get another Crypto post out before Thanksgiving but I’m planning another post before the end of the week to look at what we can likely expect to see in the bear market that we should see next year.
Since I started doing daily videos on Crypto early last year I’ve got Crypto direction right most of the time and more so than any other analyst anywhere that I’m aware of. I’m a very good analyst and all three of these instruments are very classical chartist friendly. I’m not much of a marketer though, and the free Crypto substack I set up last August still has less than 200 readers. I’d like to increase that readership and invite any suggestions on how I could do that.
If you’d like to see more of these posts please subscribe for free to my Crypto substack. I also do a premarket video every day (except tomorrow at 8.00am) on Crypto at 8.30am EST with morning charts for paying subscribers. All the videos I record are posted shortly after a delay of three days on my Youtube channel, and every post I publish is linked on my twitter.
No comments:
Post a Comment