
In my last post on Tuesday 7th July I was looking at the setup for a strong rally on Oil starting and at the time of writing today Brent Crude is up about $11 and West Texas Intermediate Crude (WTIC) is up about $8 since then. So what now?
On the daily chart the highs last week were at the daily middle bands on both, and in my The Bigger Picture webinar on Sunday I was talking about the importance of those middle bands being broken with confidence to open further upside. That was done yesterday, so today I’m looking at upside targets and resistance levels for this move.
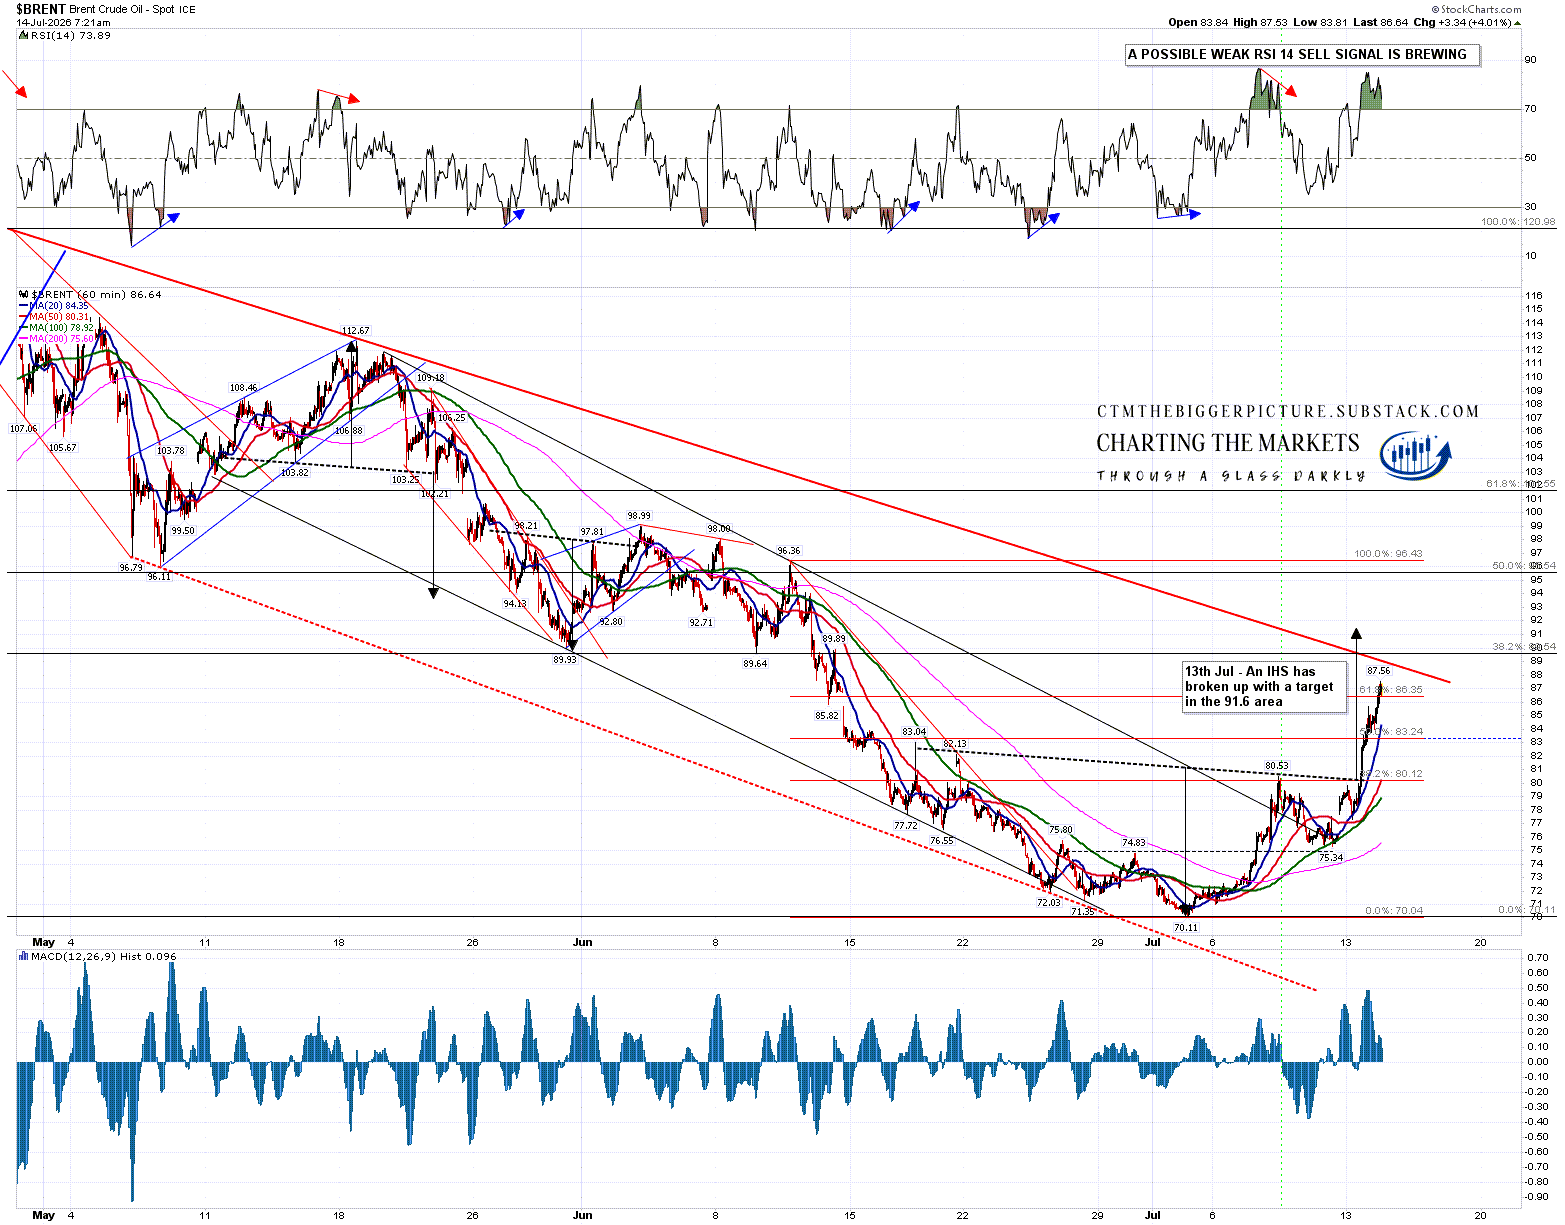
On Brent Crude a decent quality IHS has broken up with a target in the 91.60 area. That looks credible as a target, though I would note that there is an area in the 89.50 to 90.00 range that was important on the way down. That could now be resistance. Above that there are significant broken support areas at 96 and 98/9.
BRENT 60min chart:
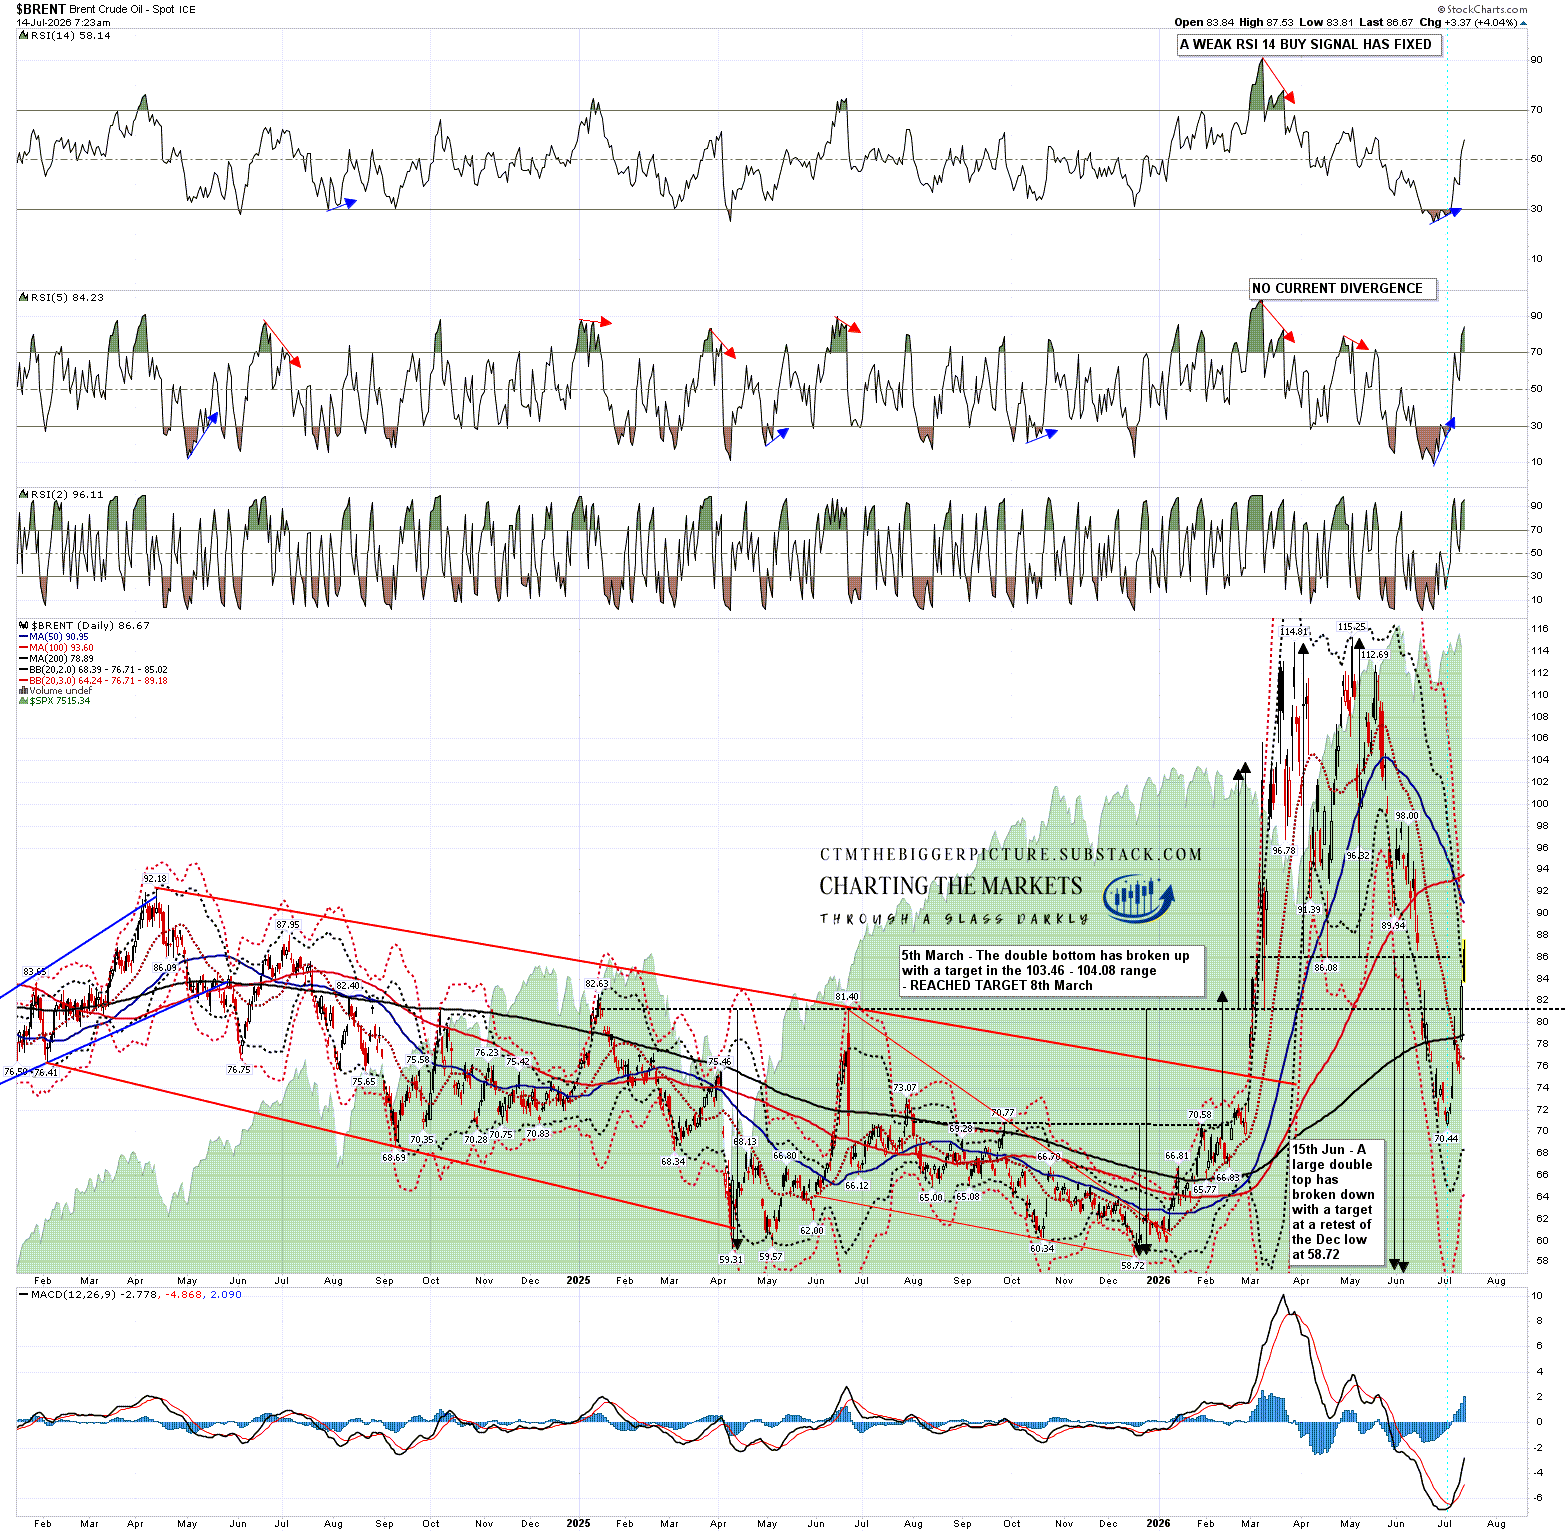
On the Brent Crude daily chart, price is currently over the daily 2sd upper band, with the 3sd upper band not far above at 89.18. The daily middle band is still turning up and the bands have not started expanding yet so I’m thinking that (subject to news), the 89 - 90 area may well hold as resistance this week. The daily RSI 5 buy signal I was looking at last week reached target and the weak RSI 14 buy signal fixed. There is no current negative divergence on the daily RSI 5.
BRENT daily chart:
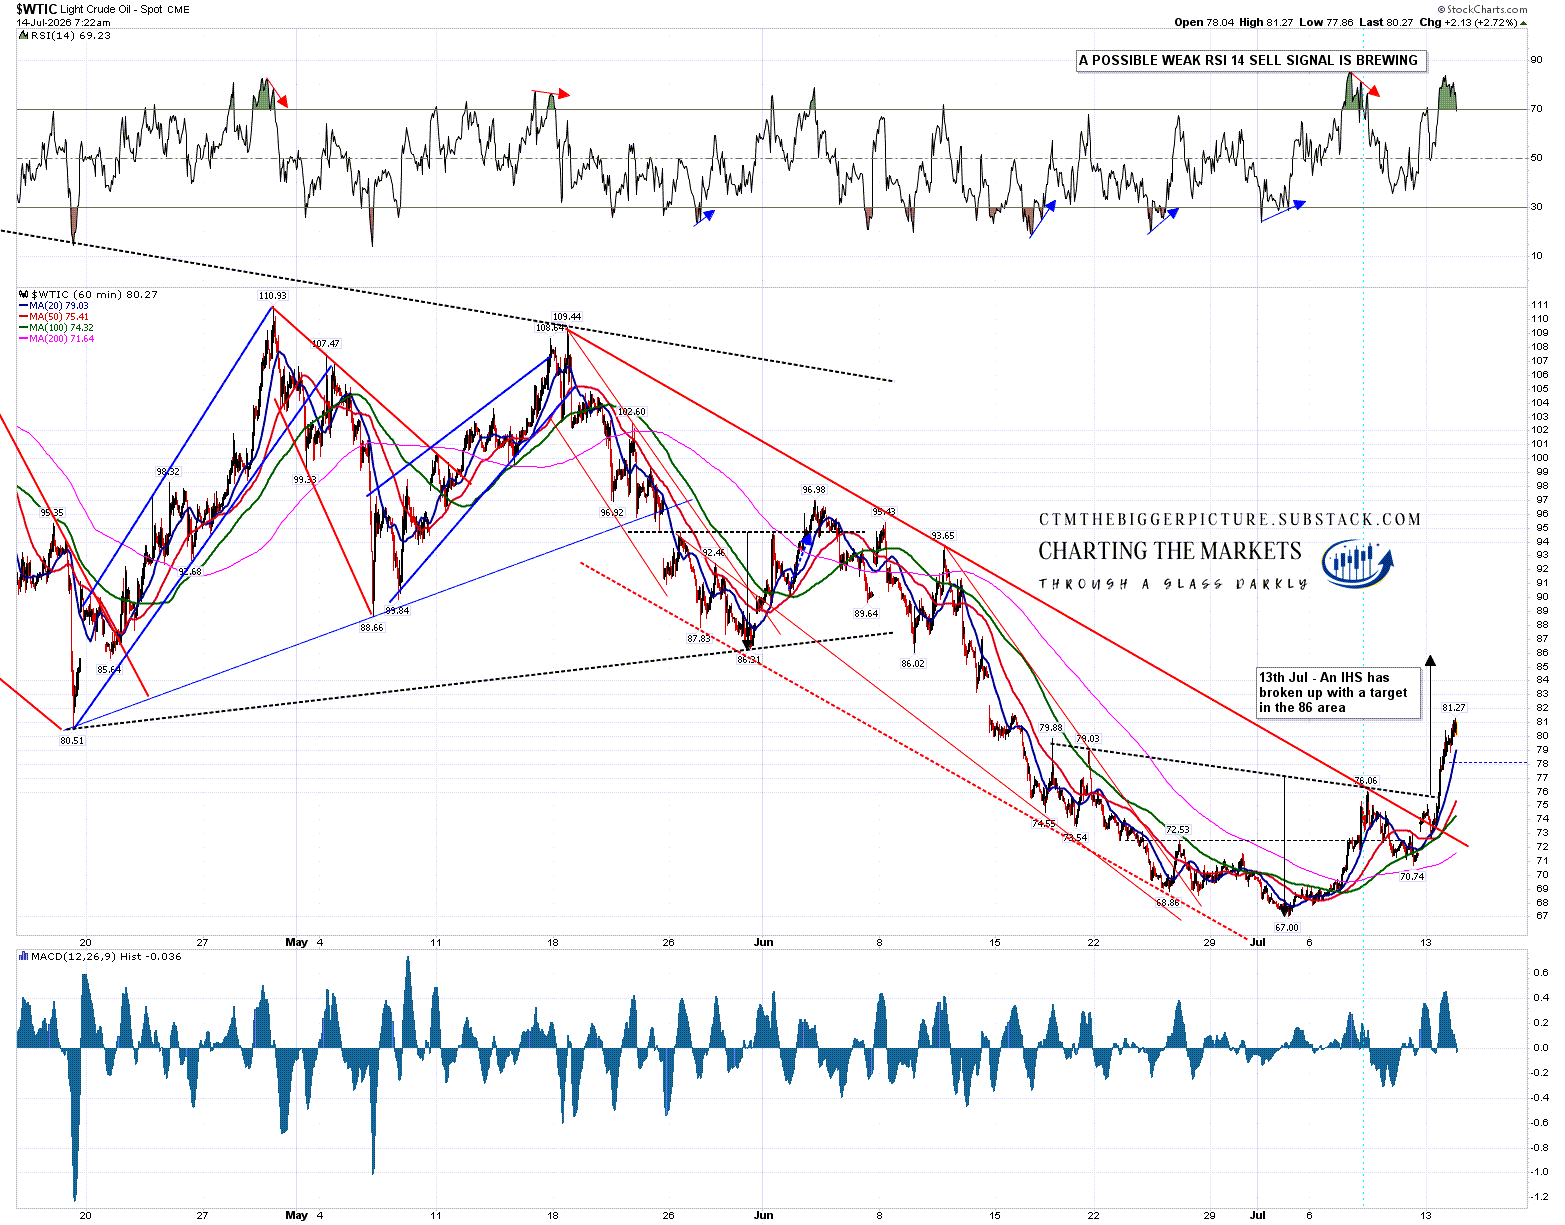
On the WTIC hourly chart a decent quality IHS has broken up with a target in the 86.00 area. That looks credible as a target though I would note that there is an open breakaway gap area just above in the 82.20 to 83.00 area (the equivalent gap on Brent Crude was filled overnight), and an area in the 86.00 to 86.30 range that was important on the way down. Either of those could now be resistance.
WTIC 60min chart:
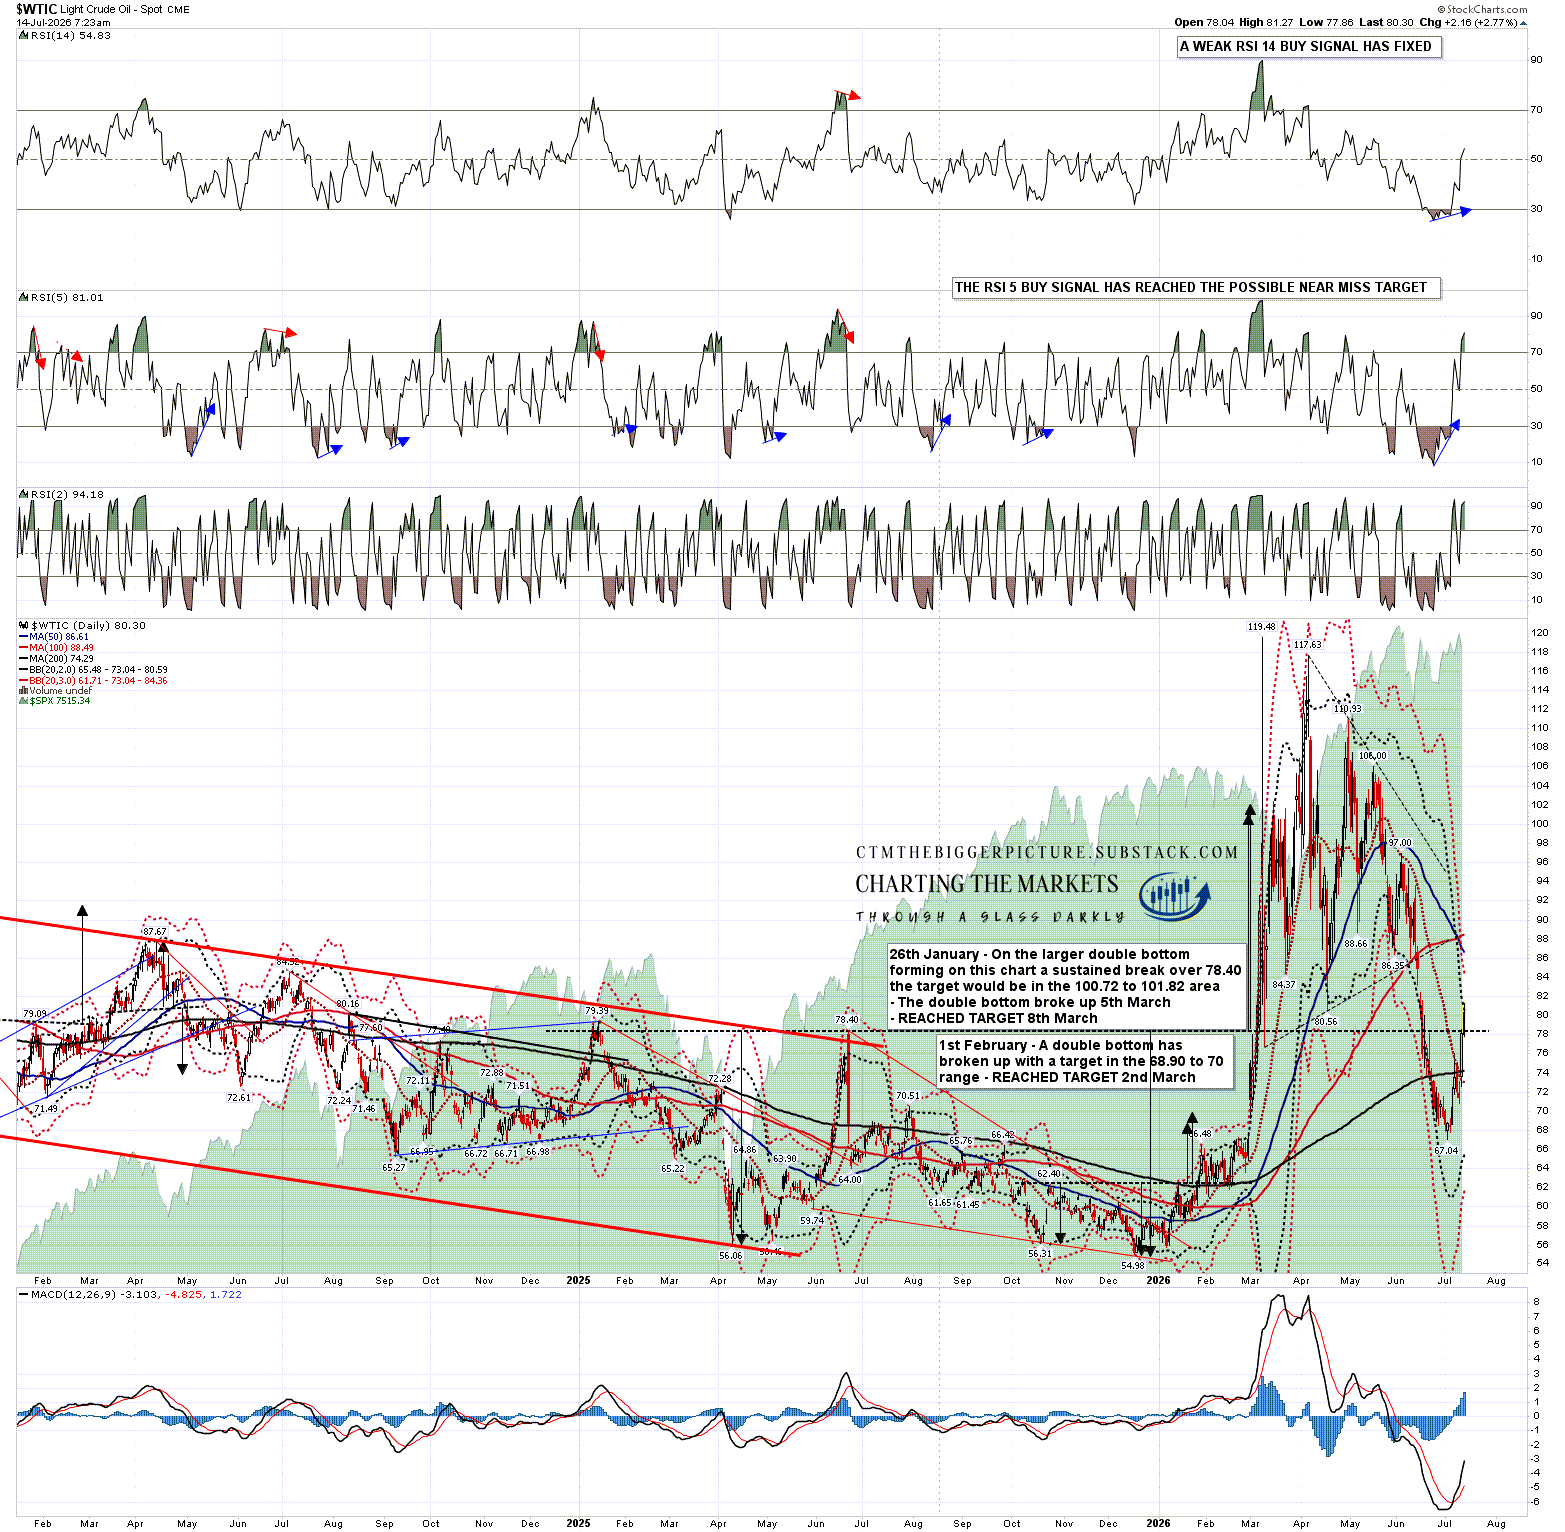
On the WTIC daily chart price is currently testing the daily 2sd upper band at 80.59, with the 3sd upper band currently at 84.36. The daily middle band is still starting to turn up and the bands have not started expanding yet so I’m thinking that (subject to news), the 84-5 area may well hold as resistance this week. The daily RSI 5 buy signal I was looking at last week reached target and the weak RSI 14 buy signal fixed. There is no current negative divergence on the daily RSI 5.
WTIC daily chart:
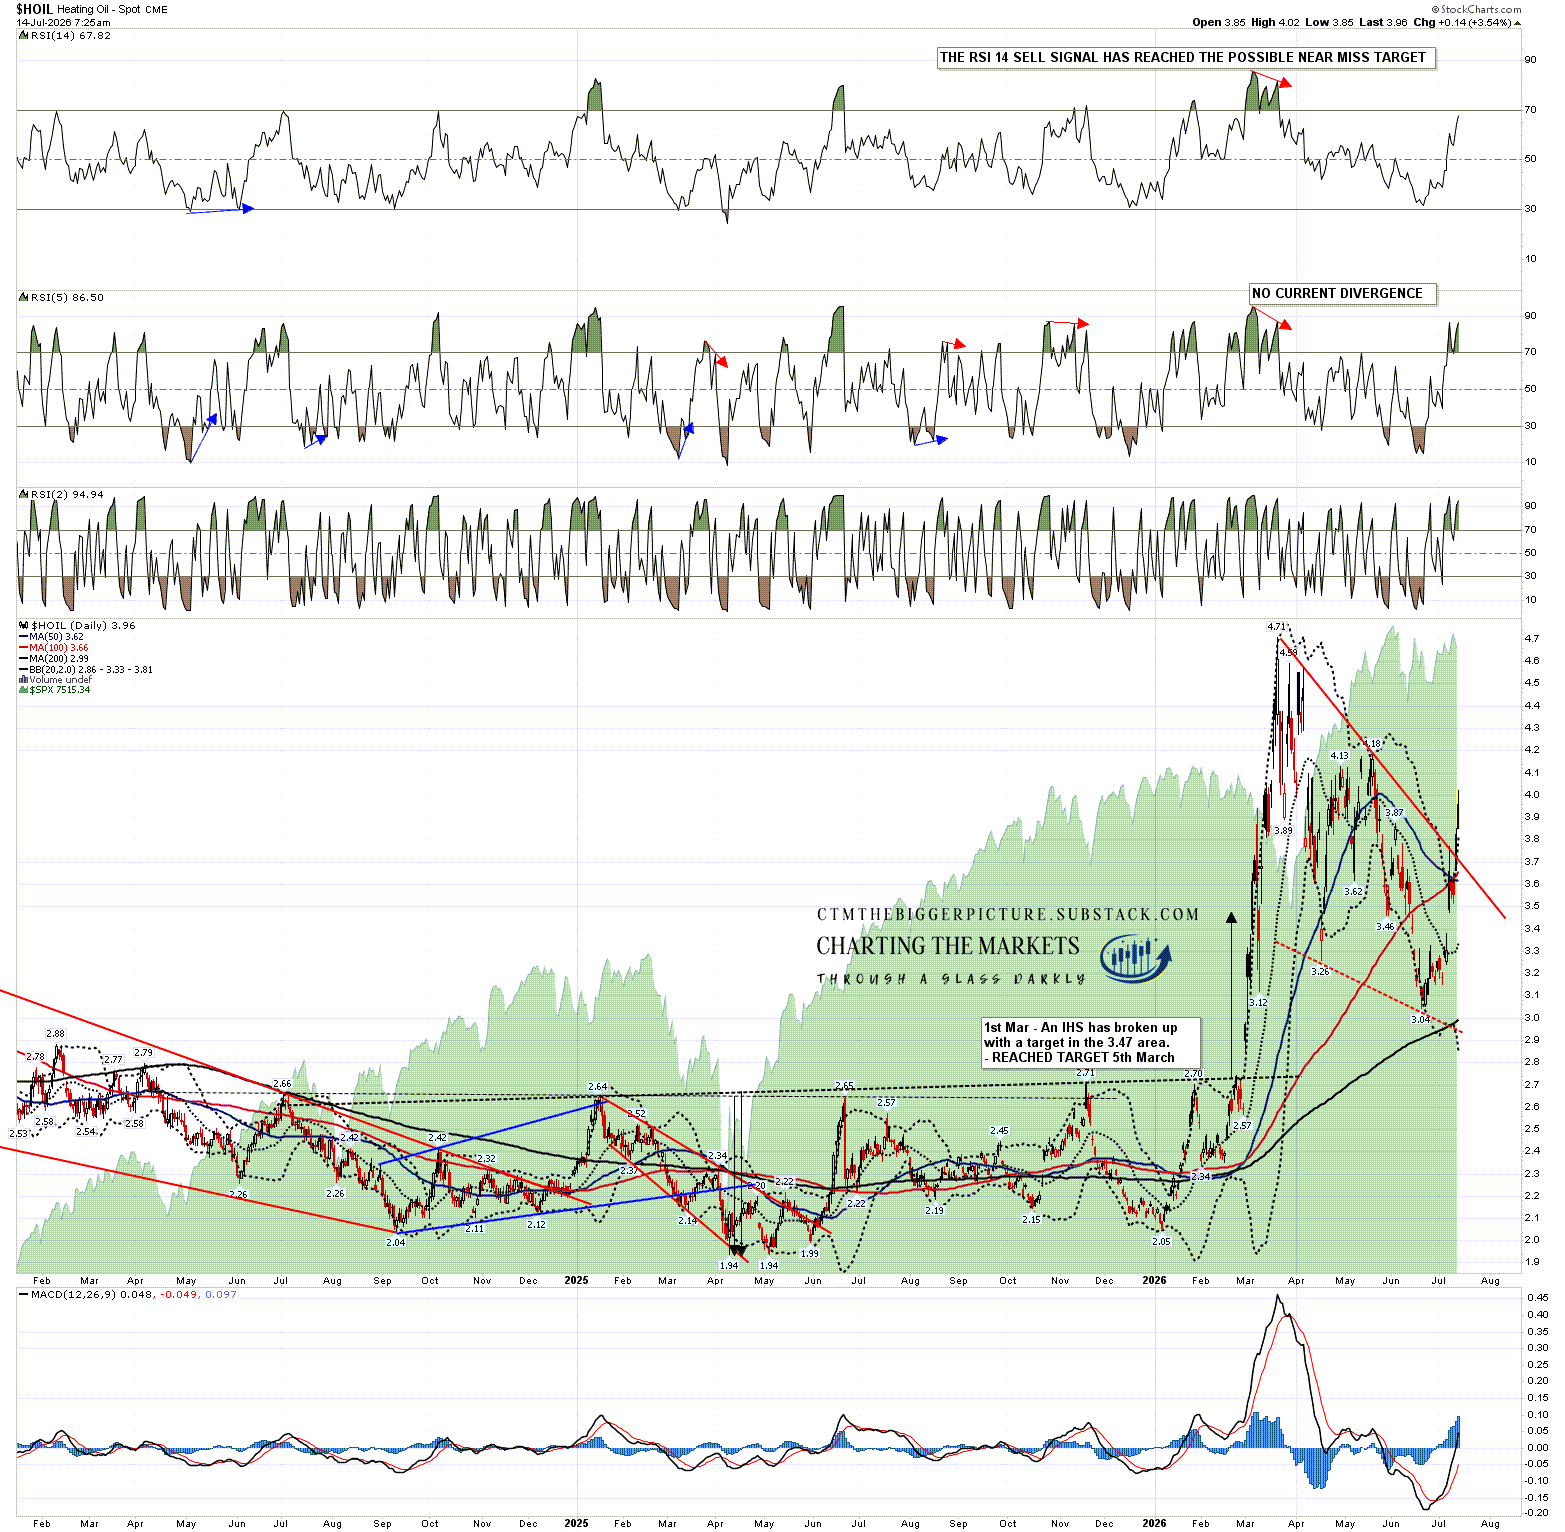
The last chart for today is the Heating Oil daily chart where is good quality bull flag formed from the March high and broke up this week. This flag has a target at a retest of the March high at 4.71.
HOIL daily chart:
There is an obvious caveat I need to make here, in that all of this is very subject to news, and if another peace process were to start seriously then that might send the oil markets down again. There is however no current sign of any peace process starting and both sides seem to be getting more entrenched into their positions.
Is there a disaster scenario here we should be aware of? Definitely if Iran are pushed to a stage where they felt desperate, and the Persian Gulf allies of the US were to look more directly involved in the war against Iran, rather than just hosting the bases of the US while the US and Israel wage war against Iran. I would note that this is increasingly the case with Bahrain, Kuwait and UAE directly and also Saudi Arabia against the Houthis. This might lead to Iran attacking oil and gas infrastructure in those countries, which would be very bad, or perhaps even their water desalinisation infrastructure, which could make much of the Middle East uninhabitable for an indefinite period. I am hoping that there are enough sane people on both sides to avoid this scenario.
If you like my analysis and would like to see more, please take a free subscription at my thebiggerpicture substack, where I publish these posts first and for members (from next week) also bi-weekly videos looking at equity indices, bonds, currencies and commodities. Those videos are posted on my Youtube channel after a seven day delay. Links to all my posts from my charting substacks are also always posted on my twitter.


No comments:
Post a Comment