
In my post on Tuesday 7th July I was looking at the setup for a strong rally on Oil starting and we have seen that strong rally since.
In my last post on Tuesday 14th July I was looking at the targets and resistance levels on Brent Crude (Brent) and West Texas Intermediate Crude (WTIC) and noting that both were getting close to their 3sd upper bands, and that the 89-90 area on Brent and 84-5 area on WTIC might well hold on those this week to allow the daily middle bands on both to start turning up, and for the daily bands to start expanding. Both peaked that day, spent two days forming bull flags, and have made higher highs today.
So what now?
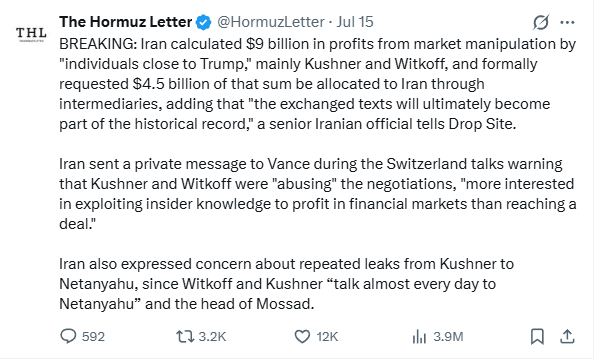
Well I would mention that there has been a strong pattern during this war of ‘peace negotiations’ being announced on Sundays just before futures markets reopen. I don’t think that seems a big risk this weekend , as Trump appears to be wanting to escalate the war, and Iran seems disinclined to engage with the US at all, but there do seem to be strong incentives for some in the US administration to conduct talks regularly:
That said, now that Brent and WTIC have had some time for the daily bands to turn and expand, and with more data points from the bull flag lows, it’s time to look at upside targets and resistance levels again.
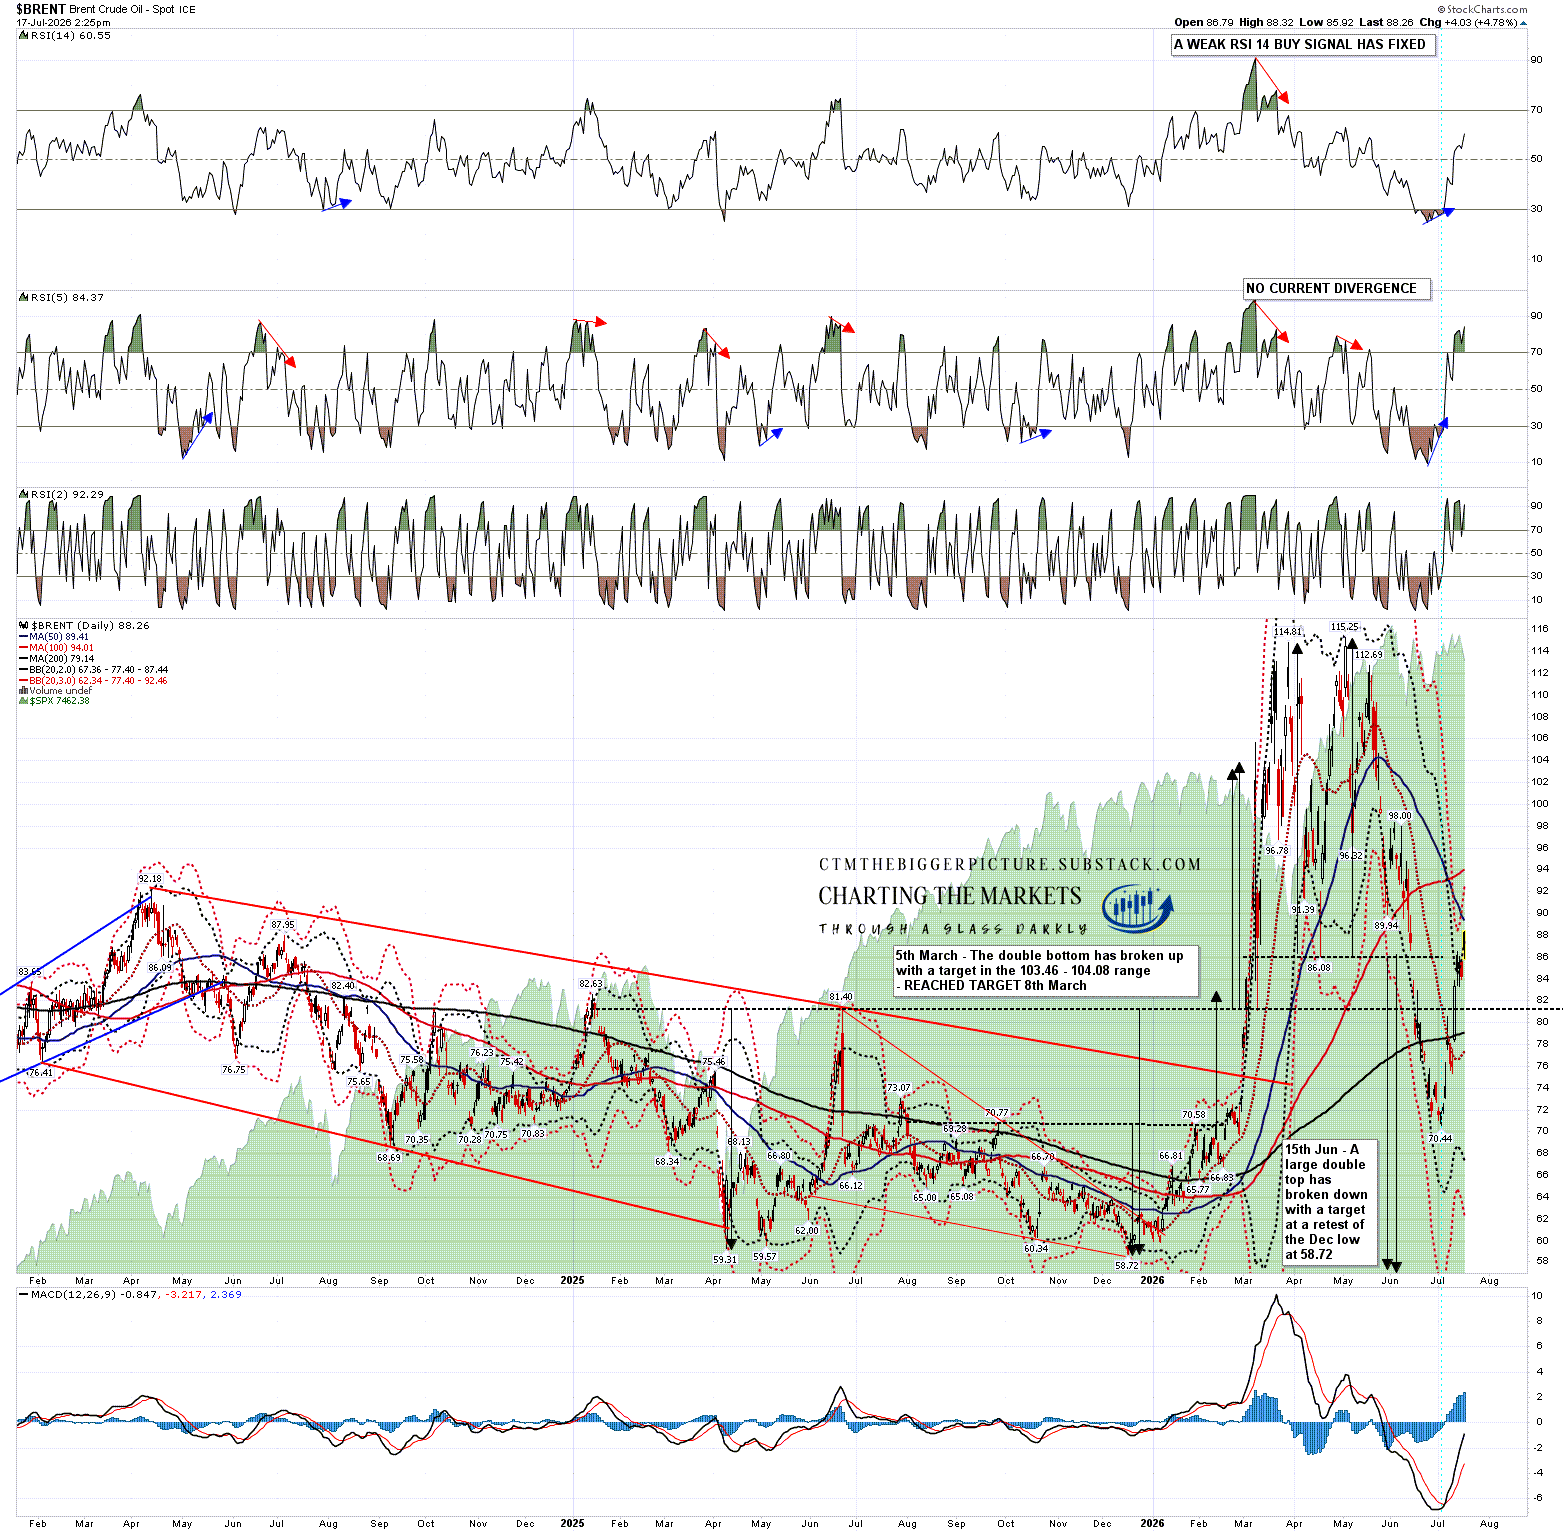
On the Brent daily chart the middle band has turned up and the bands are now expanding. Brent is close to a test of the 50dma at 89.41, and the 3sd upper band is now at 92.46, up from 89.18 at my post on Tuesday. As the bands expand the 3sd upper band can get to a stage of rising several dollars per day.
BRENT daily chart:
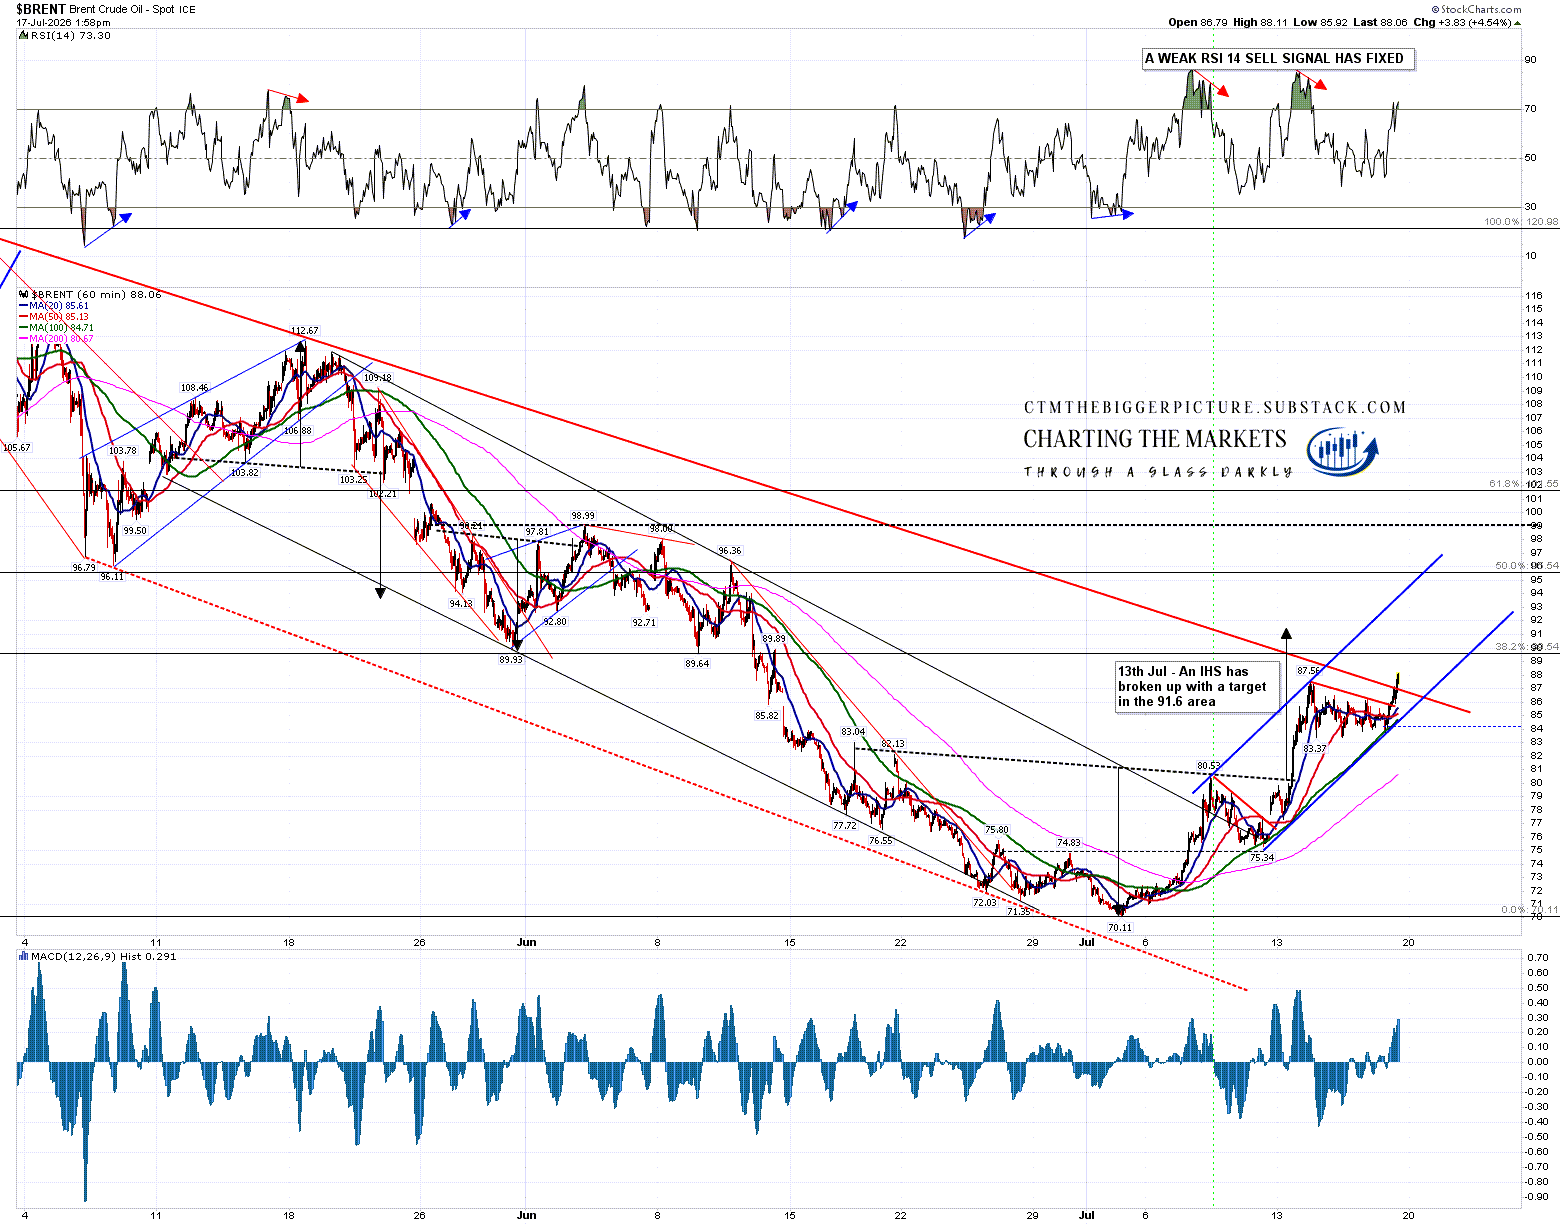
On the Brent hourly chart an RSI 14 sell signal fixed but didn’t make target at the flag low. That’s worth bearing in mind but these regularly fail in strong uptrends. As I mentioned on Tuesday there is some established (potential support turned) resistance in the 89.5 to 90 area, an open IHS target in the 91.6 area and a rising channel has been established from the right shoulder low with channel resistance currently in the 93.25 area.
There are two possible IHS necklines that might be the next big target, with my preferred option in the 98.99 area, and a less good option in the 96.36 area.
BRENT 60min chart:
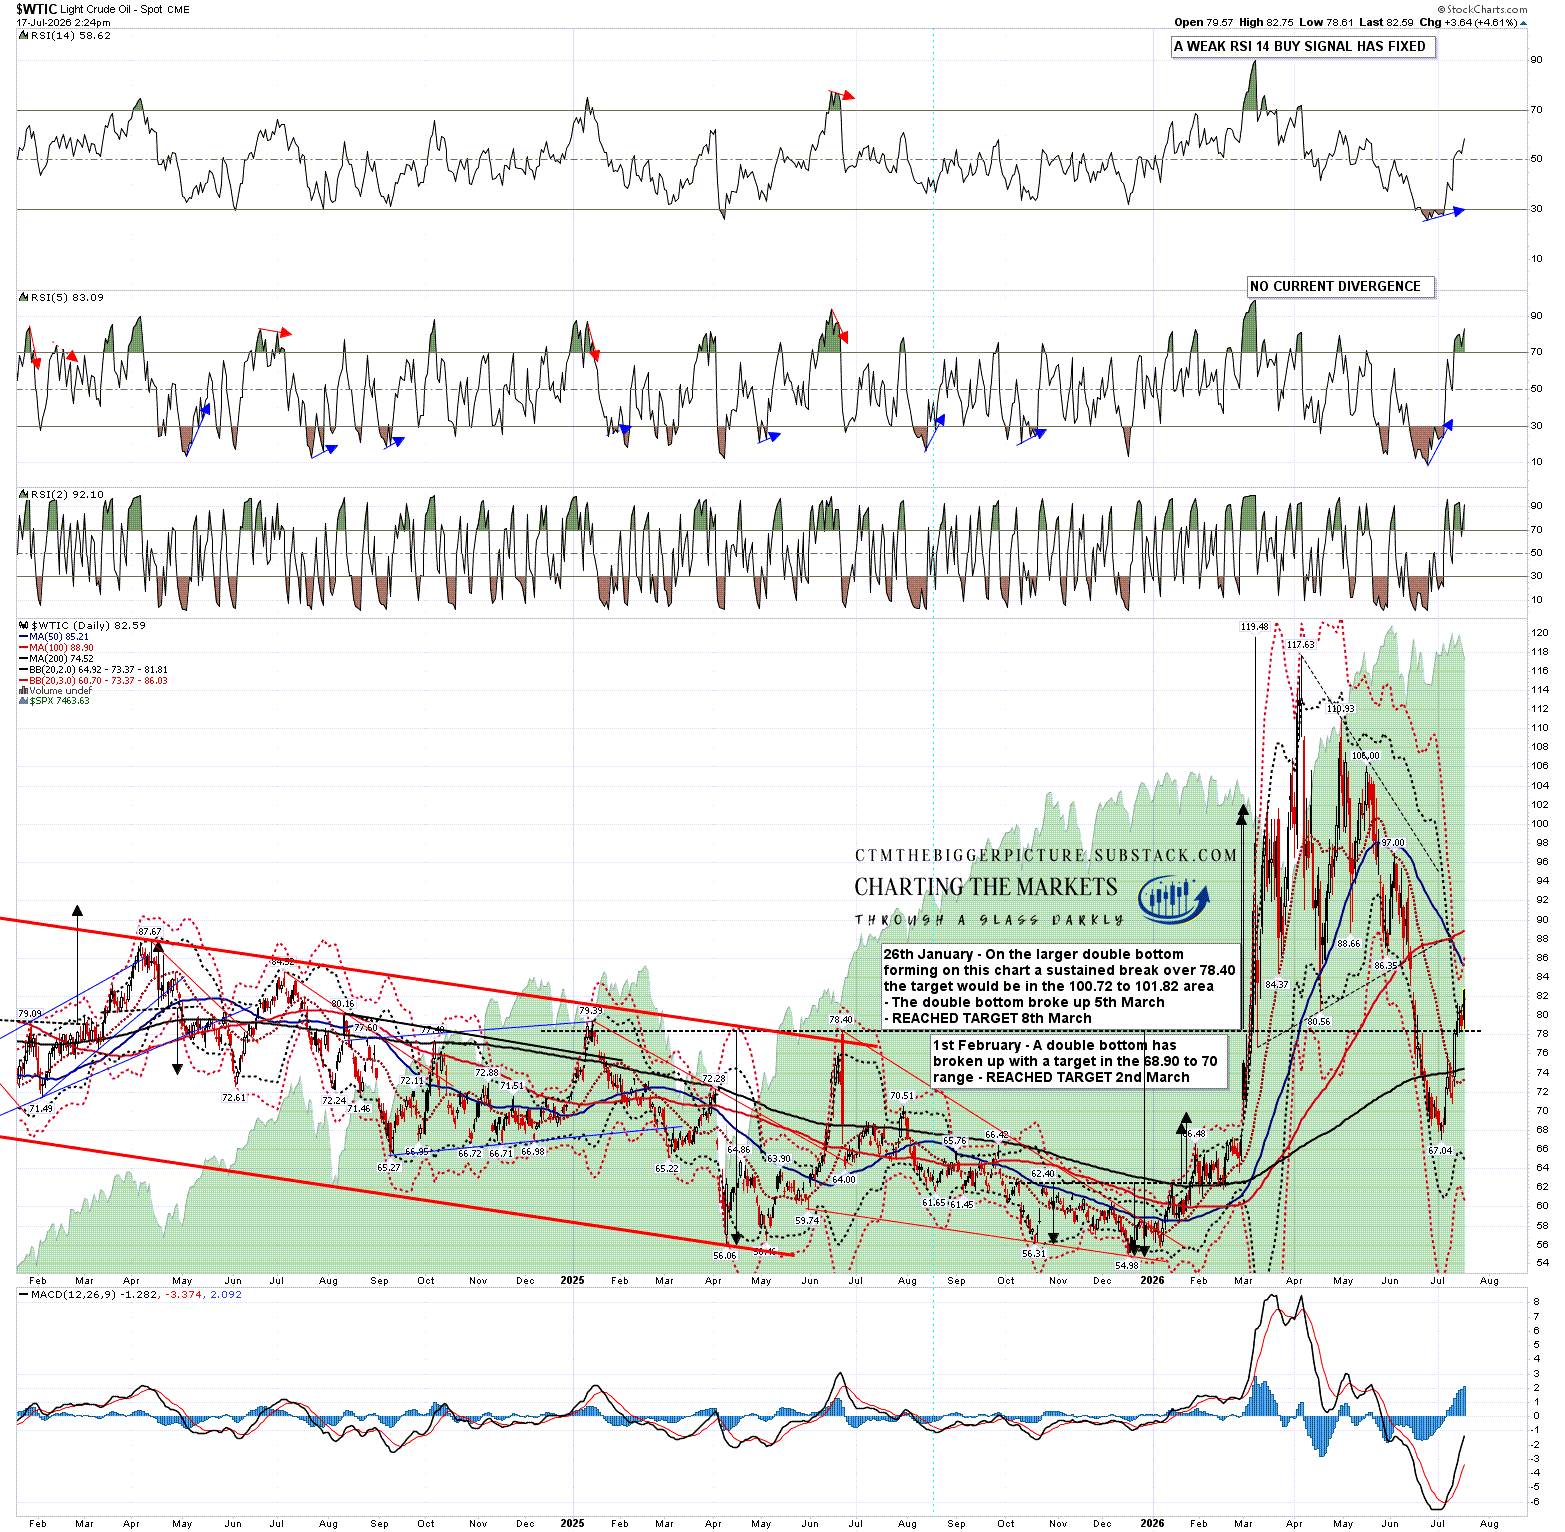
On the WTIC daily chart the middle band has turned up and the bands are now expanding. WTIC is close to a test of the 50dma at 85.21, and the 3sd upper band is now at 86.03, up from 84.36 at my post on Tuesday. As the bands expand the 3sd upper band can get to a stage of rising several dollars per day.
WTIC daily chart:
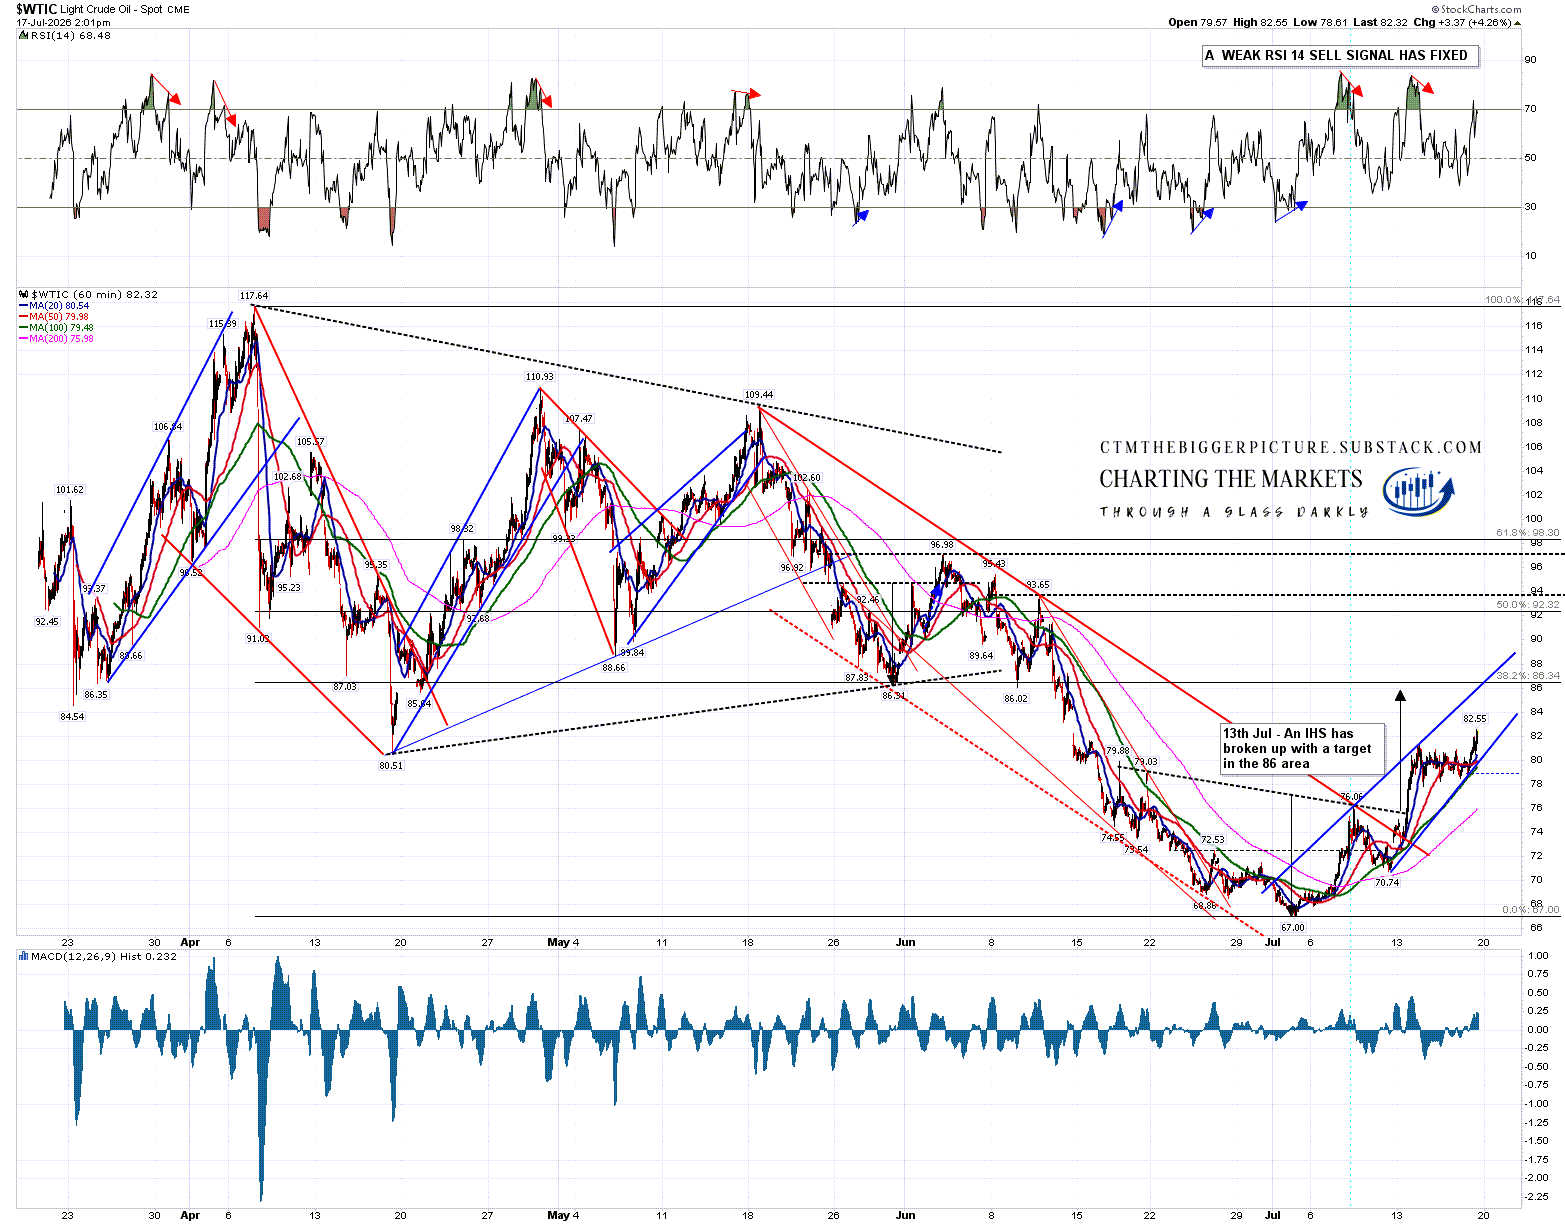
On the WTIC hourly chart an RSI 14 sell signal fixed but didn’t make target at the flag low. That’s worth bearing in mind but these regularly fail in strong uptrends. As I mentioned on Tuesday there is some established (potential support turned) resistance in the 86 area, an open IHS target also in the 86 area and a likely rising wedge has been established from the right shoulder low with wedge resistance currently also in the 86 area.
There are two possible IHS necklines that might be the next big target, with my preferred option in the 96.98 area, and a less good option in the 93.65 area.
WTIC 60min chart:
In terms of how far all this goes, that is to a large extent dependent short term on the status of the Iran War, though I think enough supply chain damage has already been done that even if the war was to end this weekend, oil might well be impressively volatile for another year or two.
In terms of how the war goes it could get a whole lot worse. I’ve been mentioning the worst scenarios regularly in recent months, and mentioned it again in my equities post this morning on my main substack. On the less bad scenario Iran may attack oil and gas infrastructure in Gulf neighbours and extensive damage could be done that might take years to repair. On the disaster scenario Iran attacks water desalinisation infrastructure in Gulf neighbours and all the Gulf states apart from Iran and Iraq might become semi to mostly uninhabitable until that infrastructure was rebuilt.
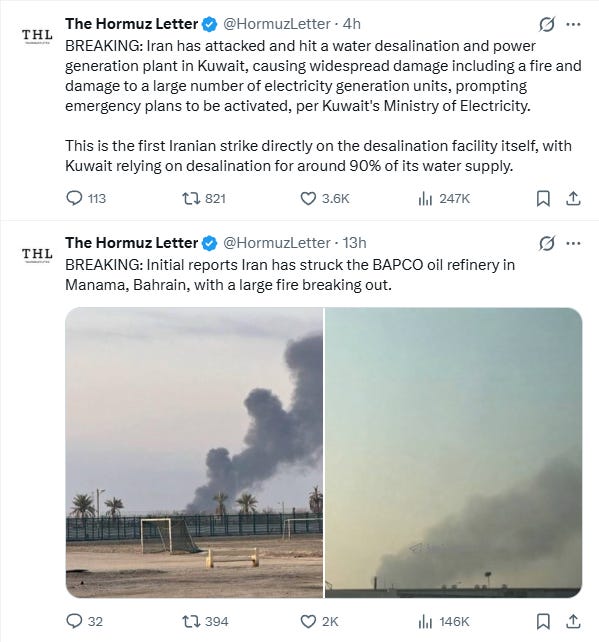
Iran has been clear that they won’t do that unless the US starts attacking their civilian infrastructure and this week the US has started attacking their civilian infrastructure. In response Iran attacked oil infrastructure in Bahrain yesterday and a water desalinisation plant in Kuwait overnight in what appear to be warning shots to the US to change direction. We’ll see how that develops this weekend but further escalation has the potential to send oil prices into uncharted territory, which would be over $225 per barrel on both Brent and WTIC, adjusted for inflation.
Are the Trump administration insane enough to risk this disaster scenario in the Persian Gulf? Yes, in that they have already started down that road this week despite clear warnings from Iran. We may find out whether they are prepared to continue risking that this weekend. I’ll be watching with interest & everyone have a great weekend. :-)
If you like my analysis and would like to see more, please take a free subscription at my thebiggerpicture substack, where I publish these posts first and for members (from next week) also bi-weekly videos looking at equity indices, bonds, currencies and commodities. Those videos are posted on my Youtube channel after a seven day delay. Links to all my posts from my charting substacks are also always posted on my twitter.


No comments:
Post a Comment