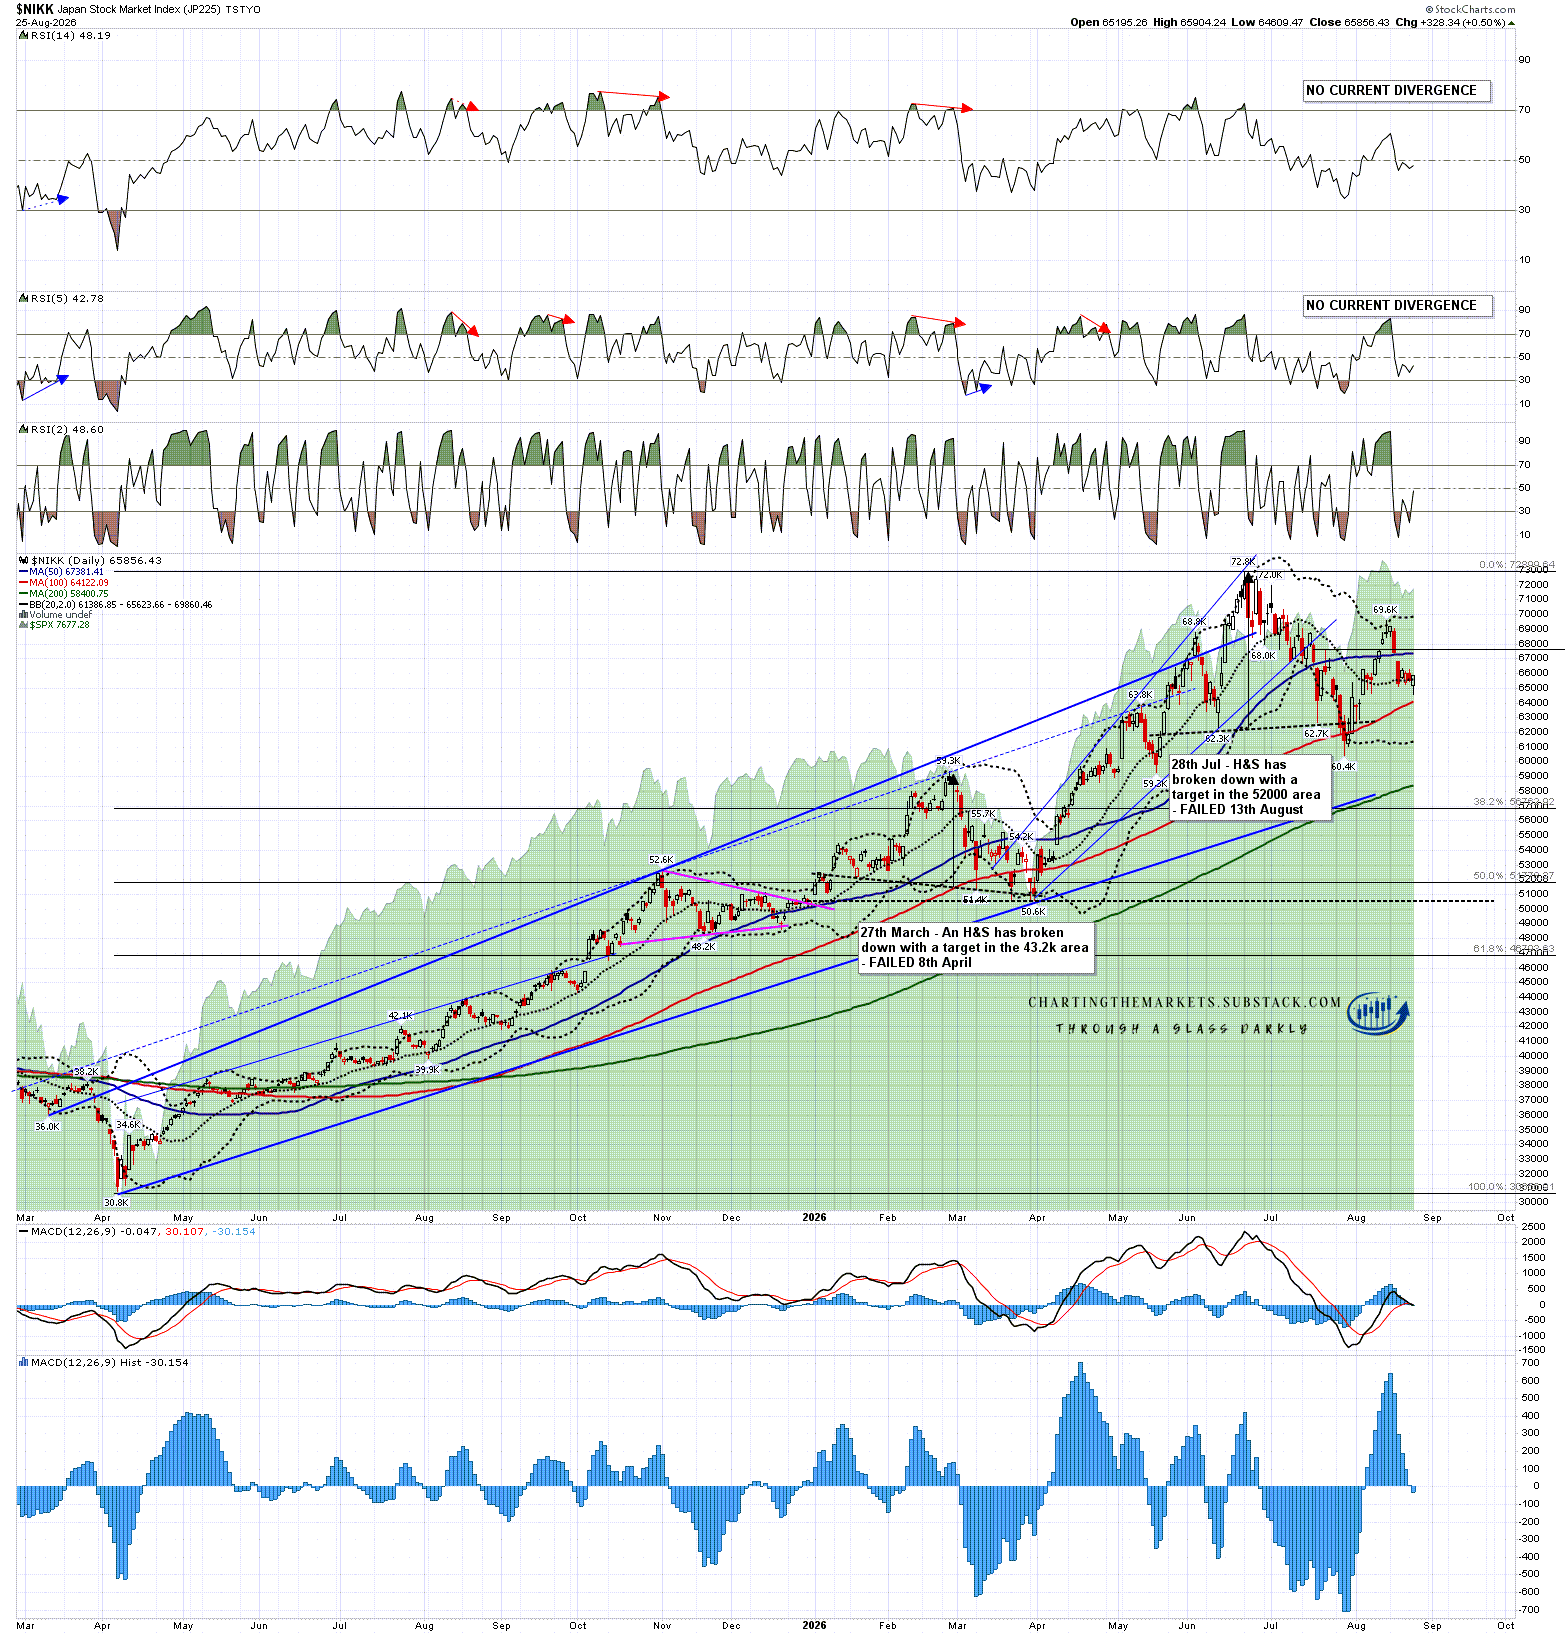
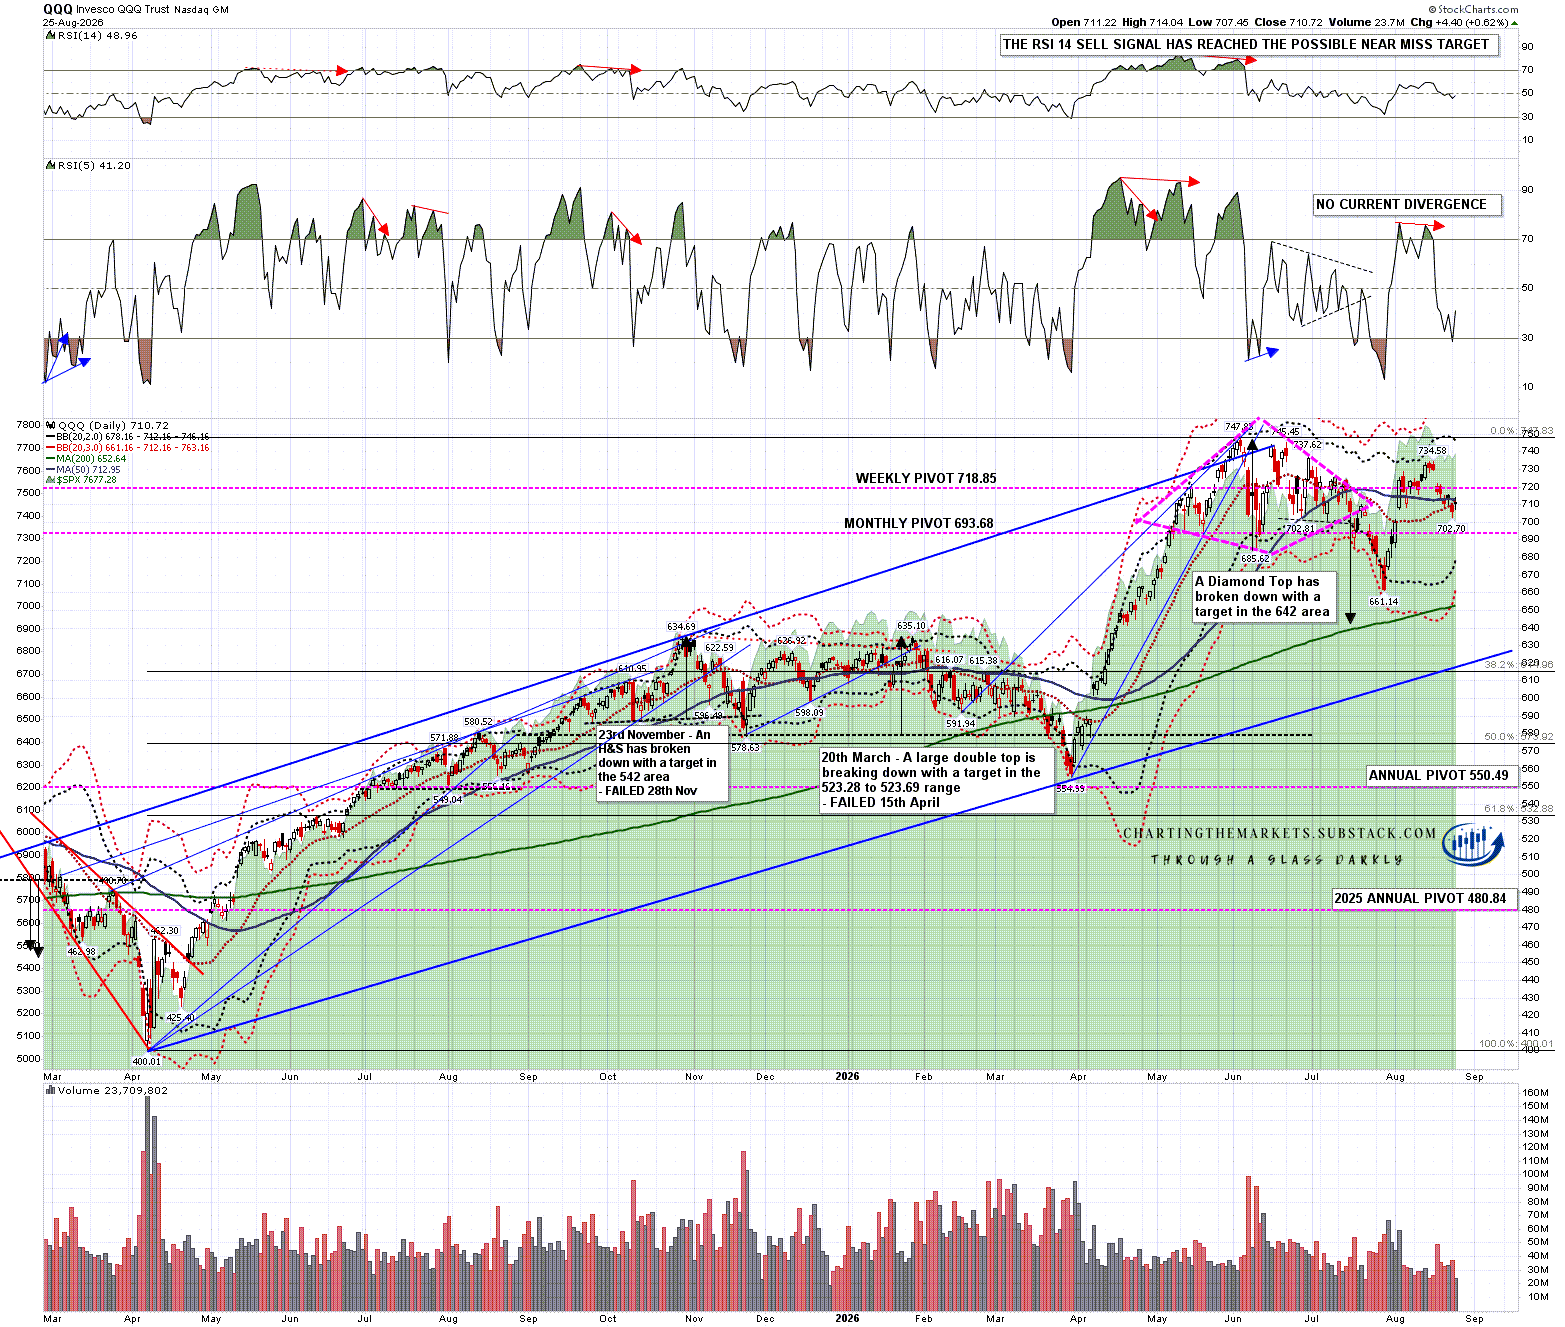
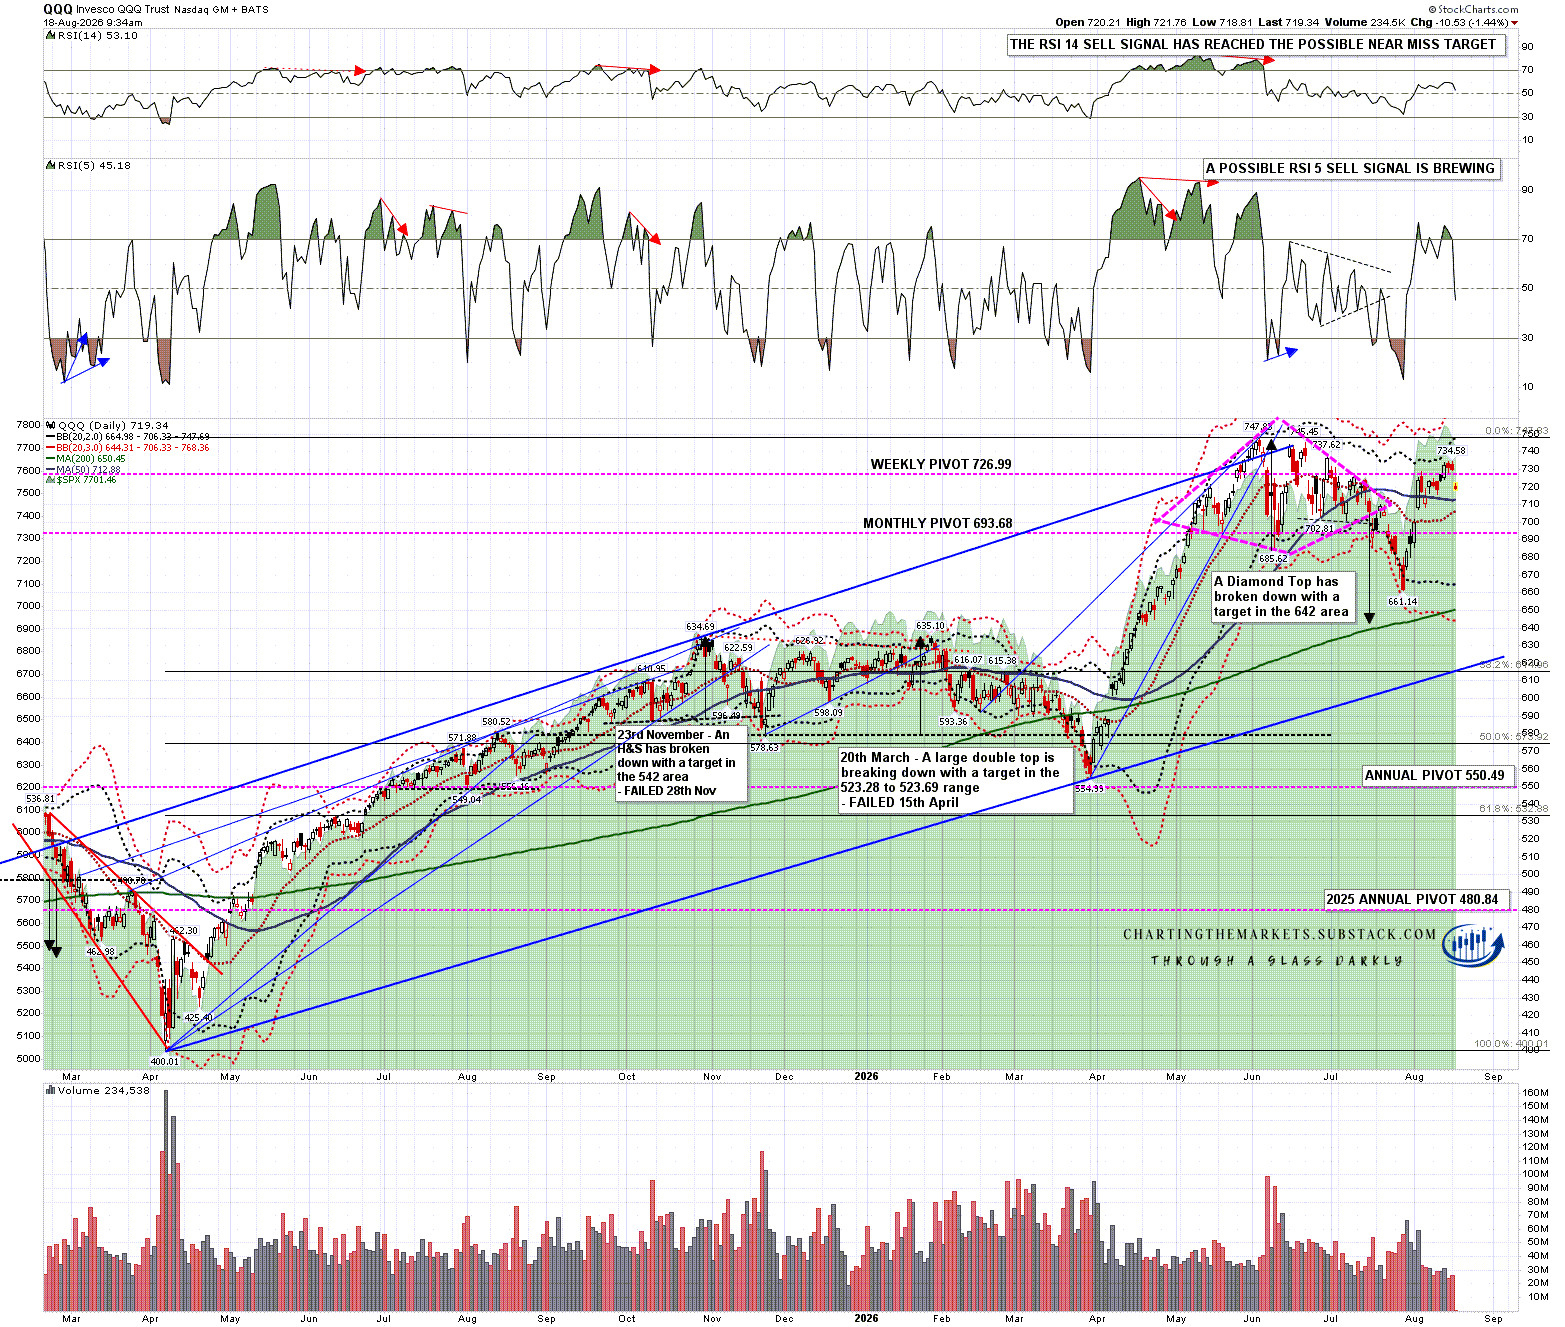
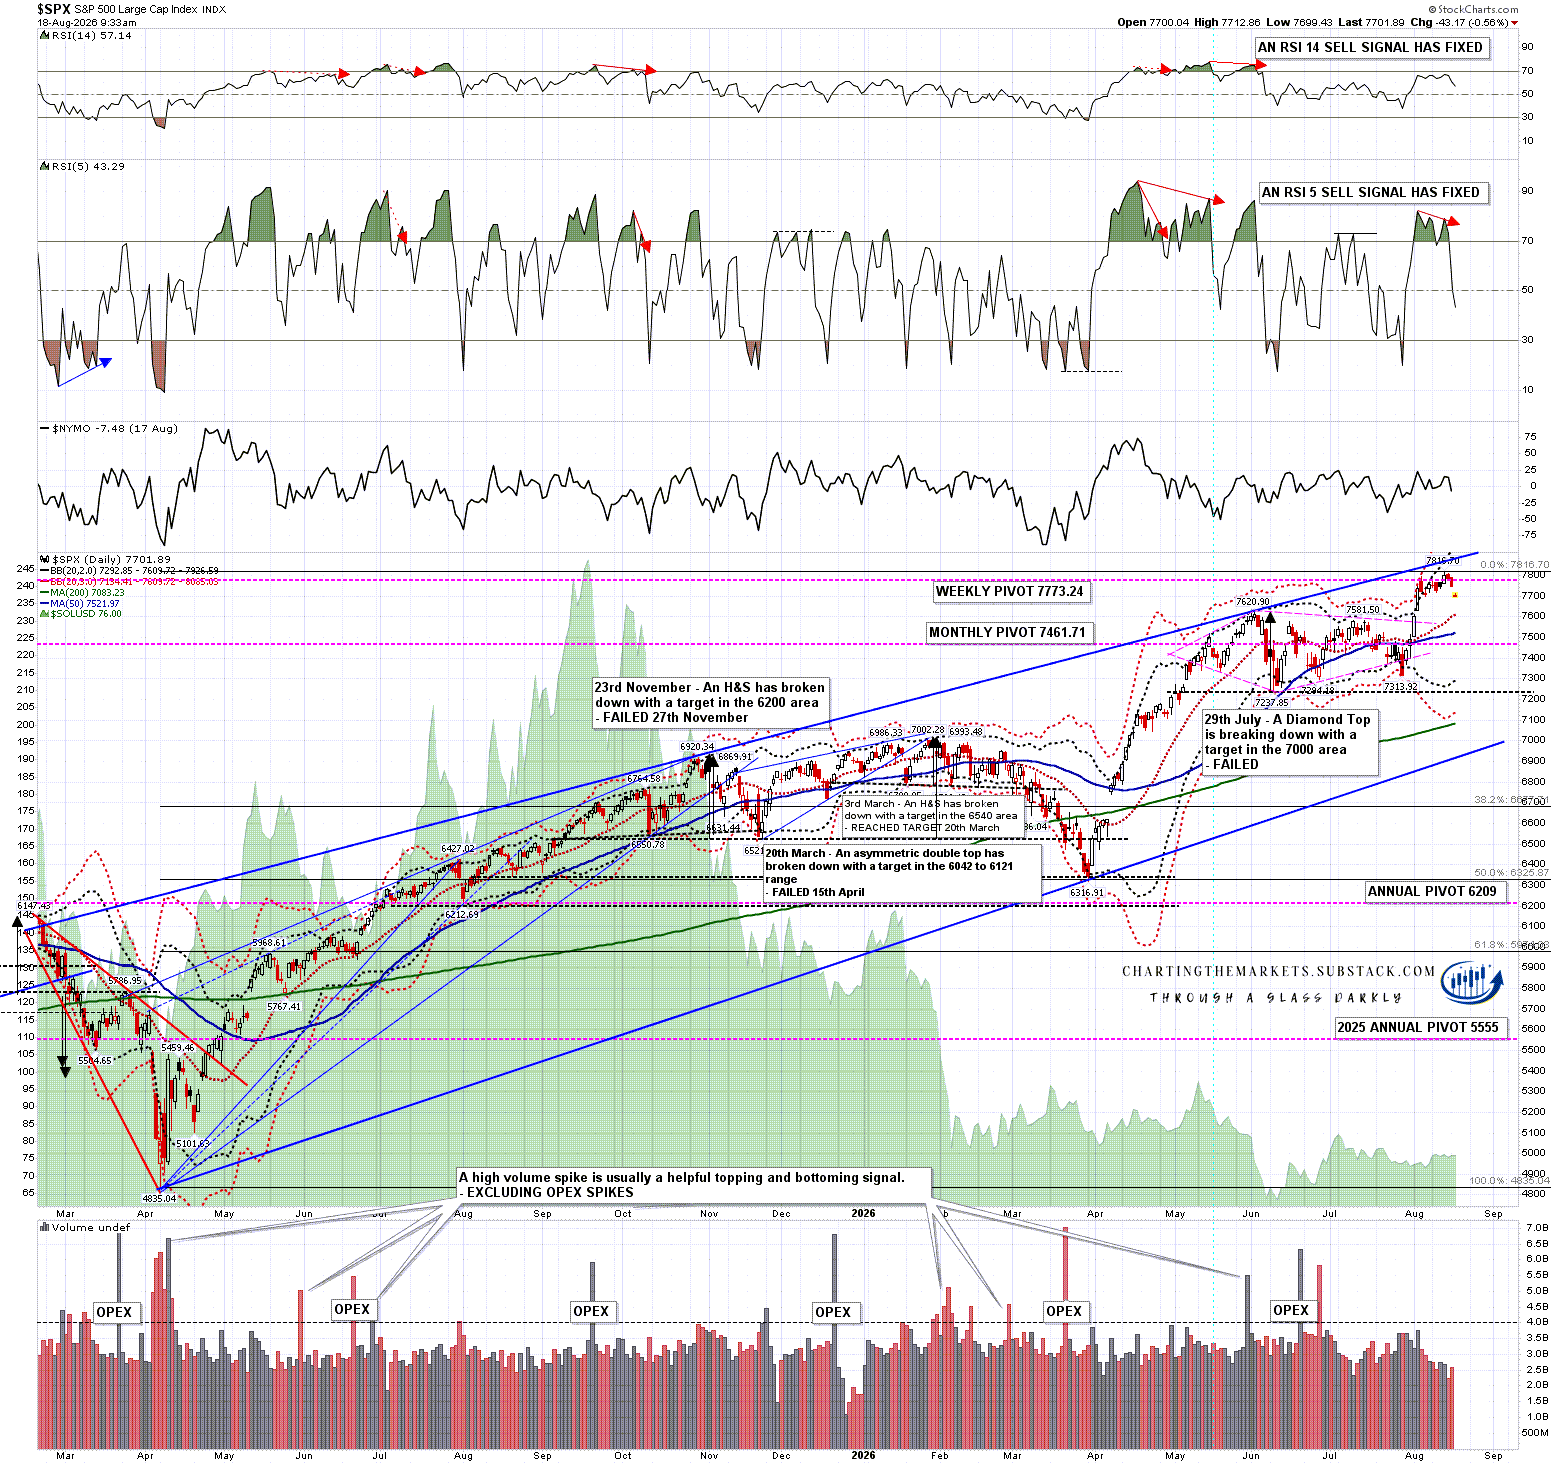
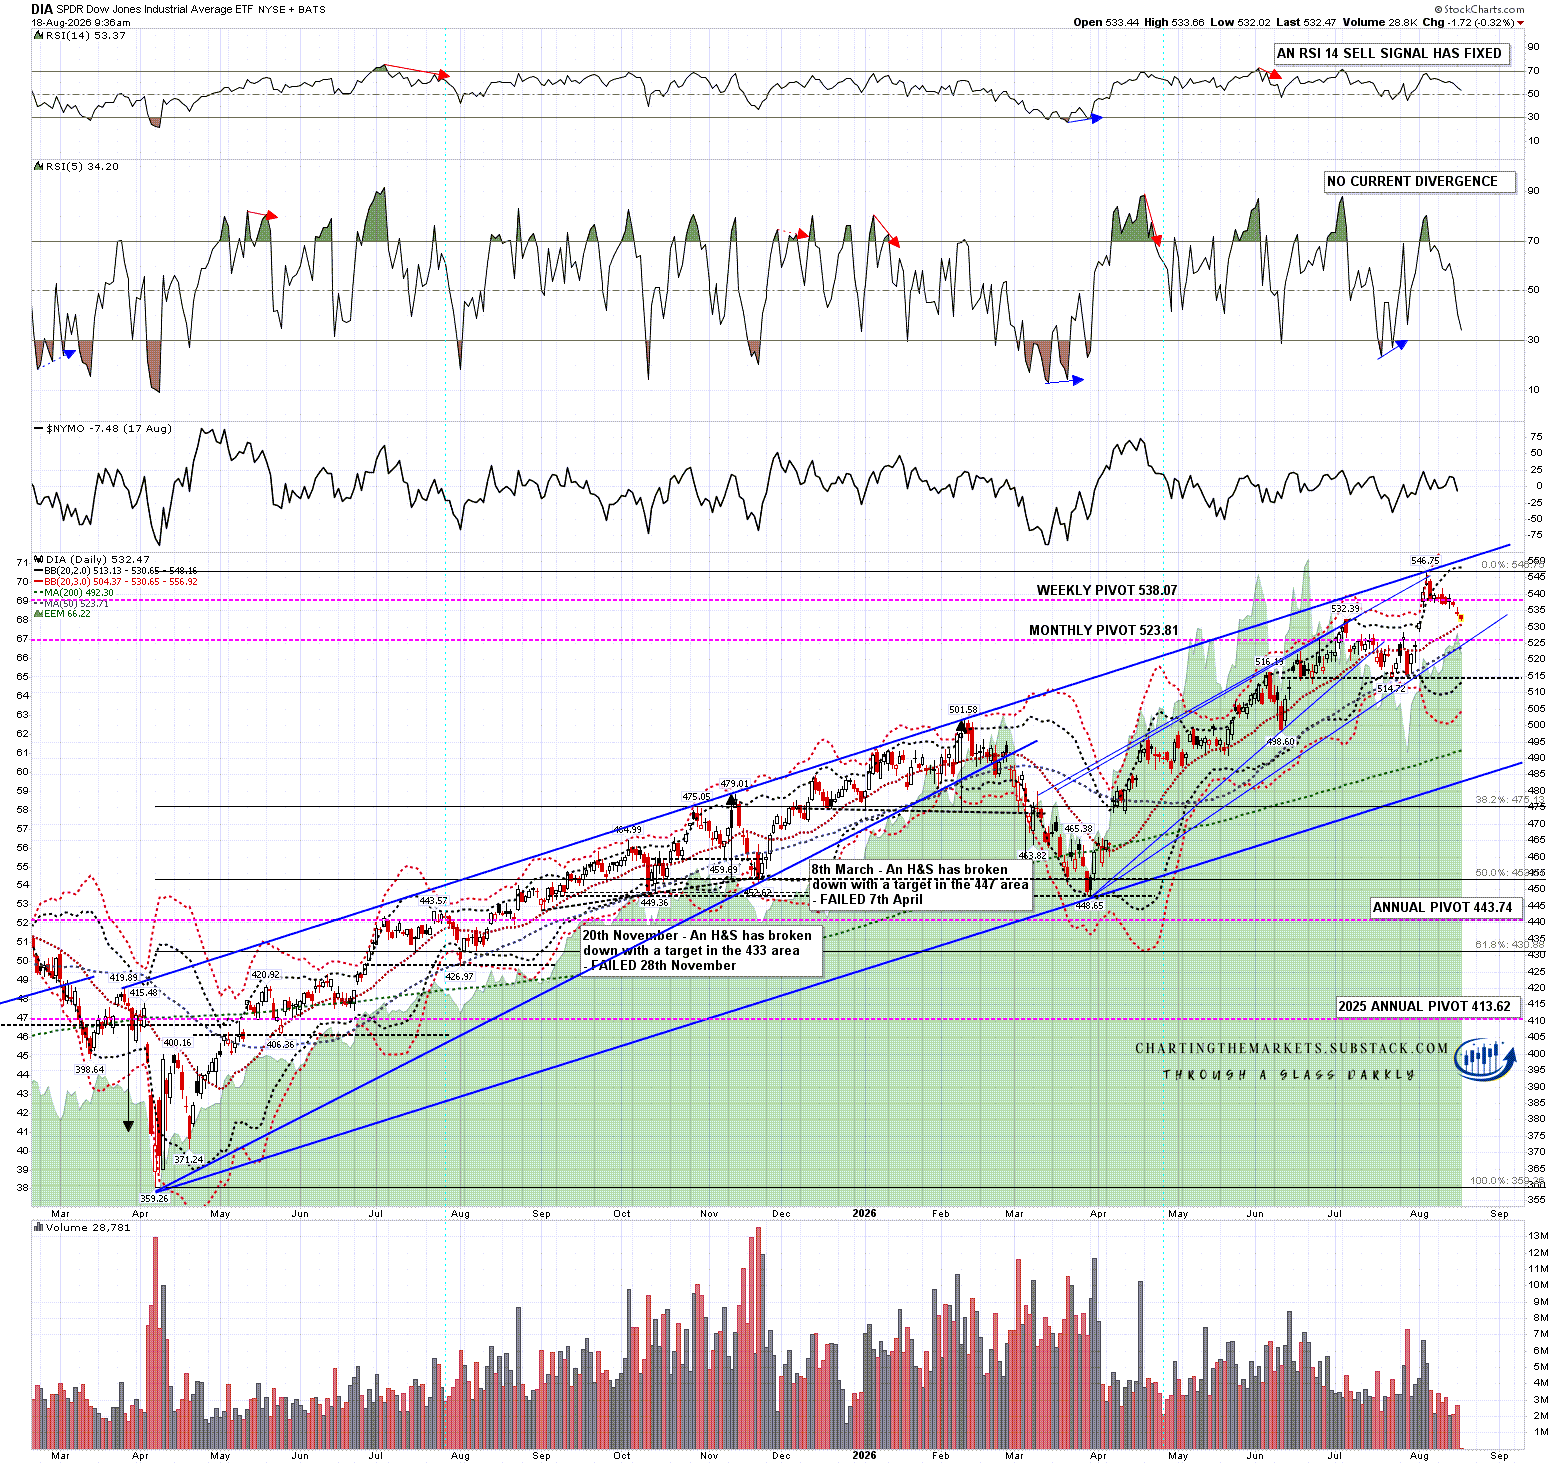
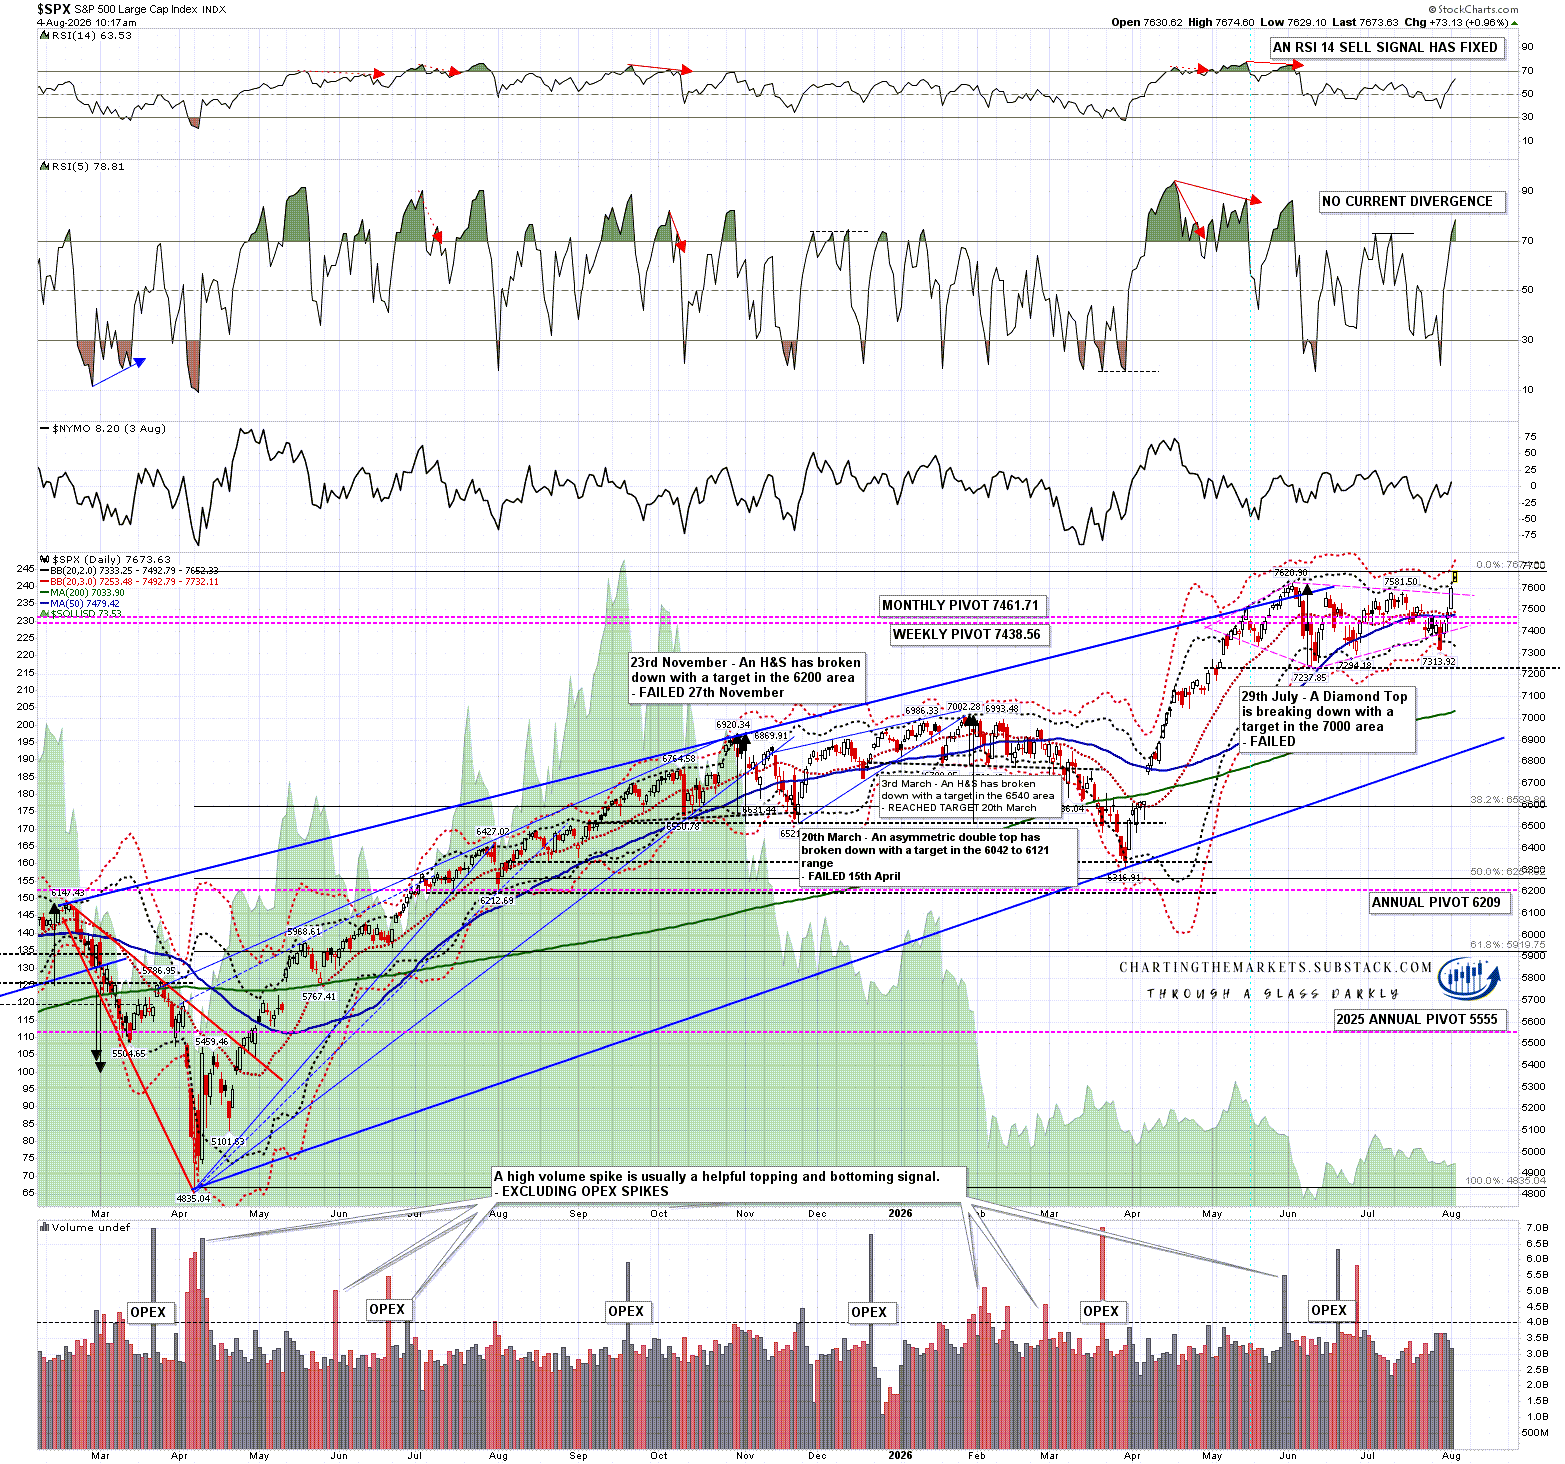
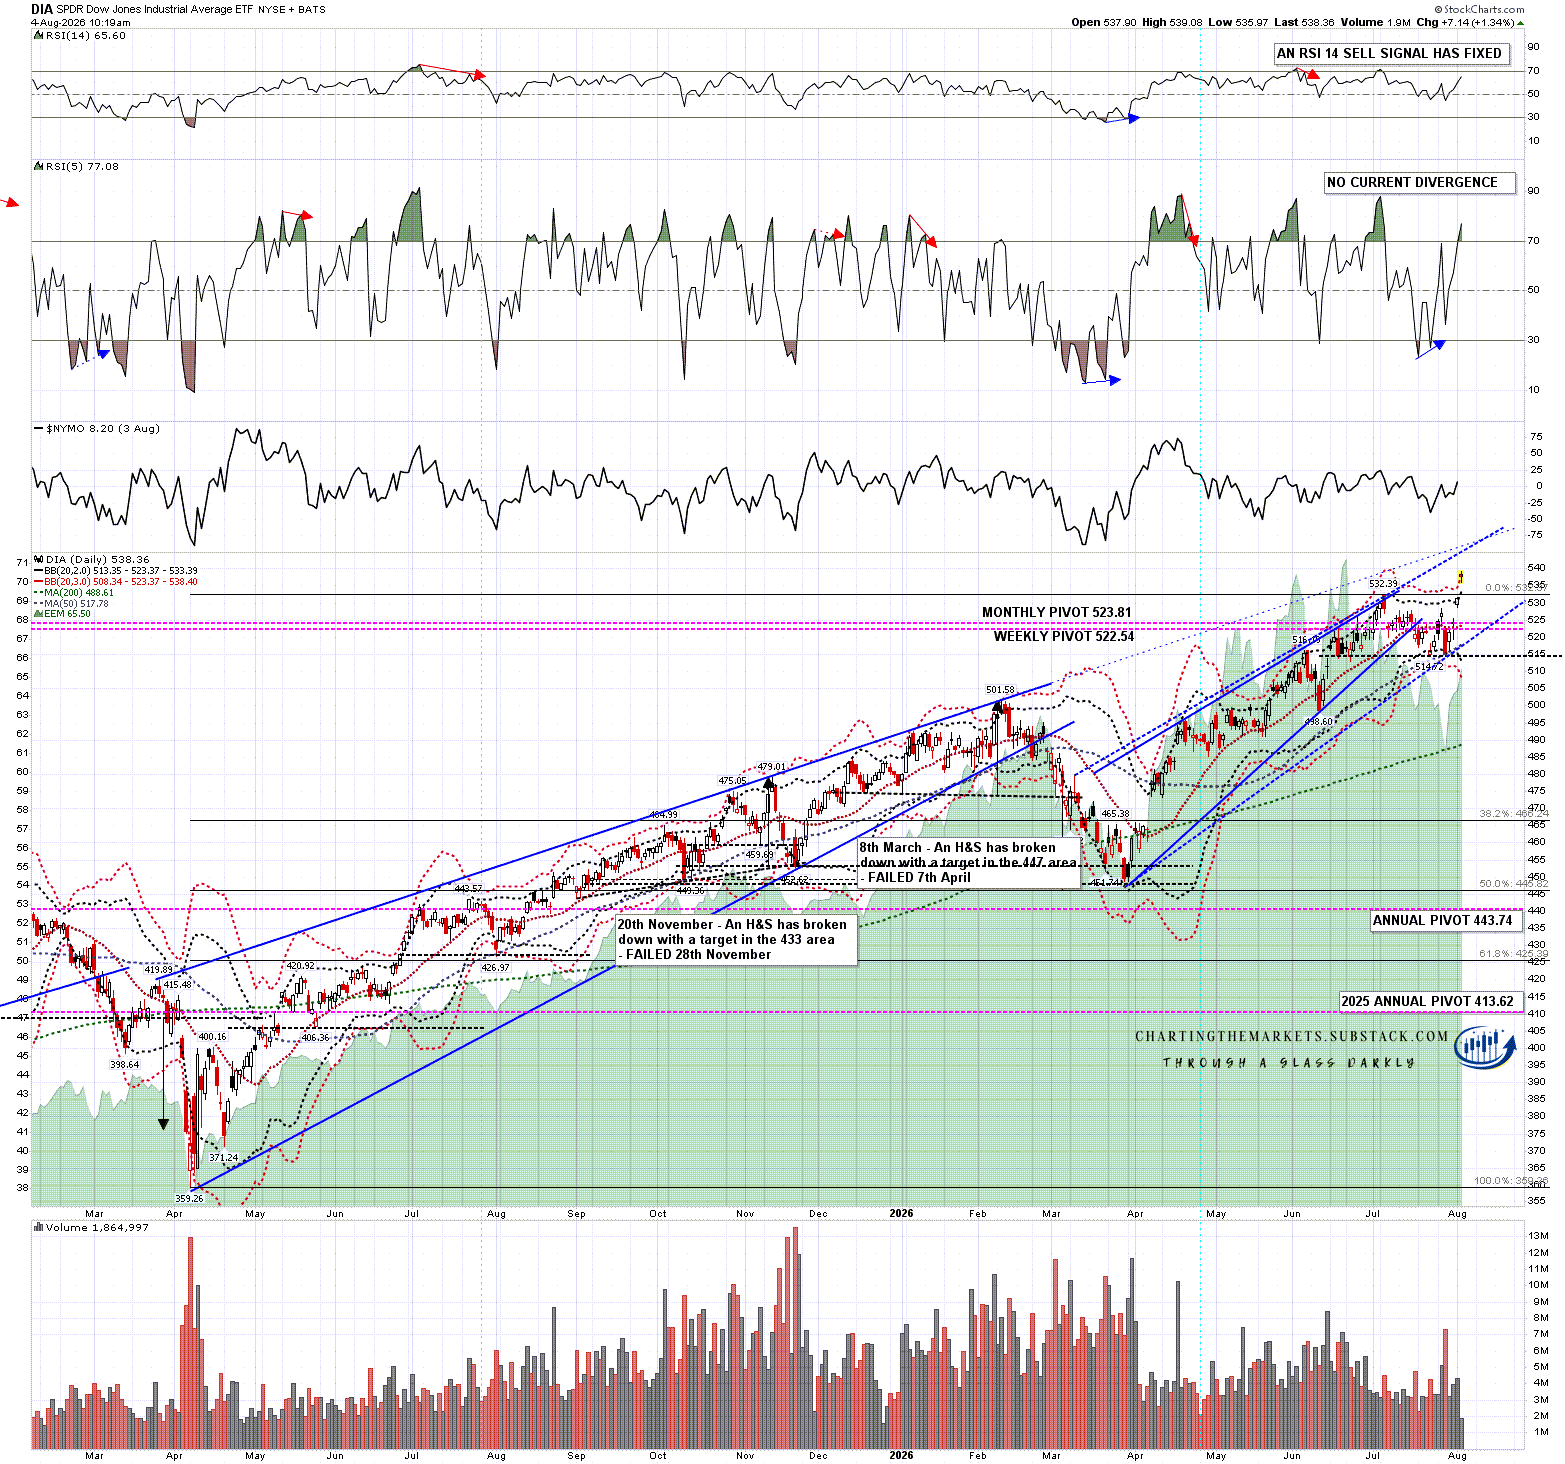
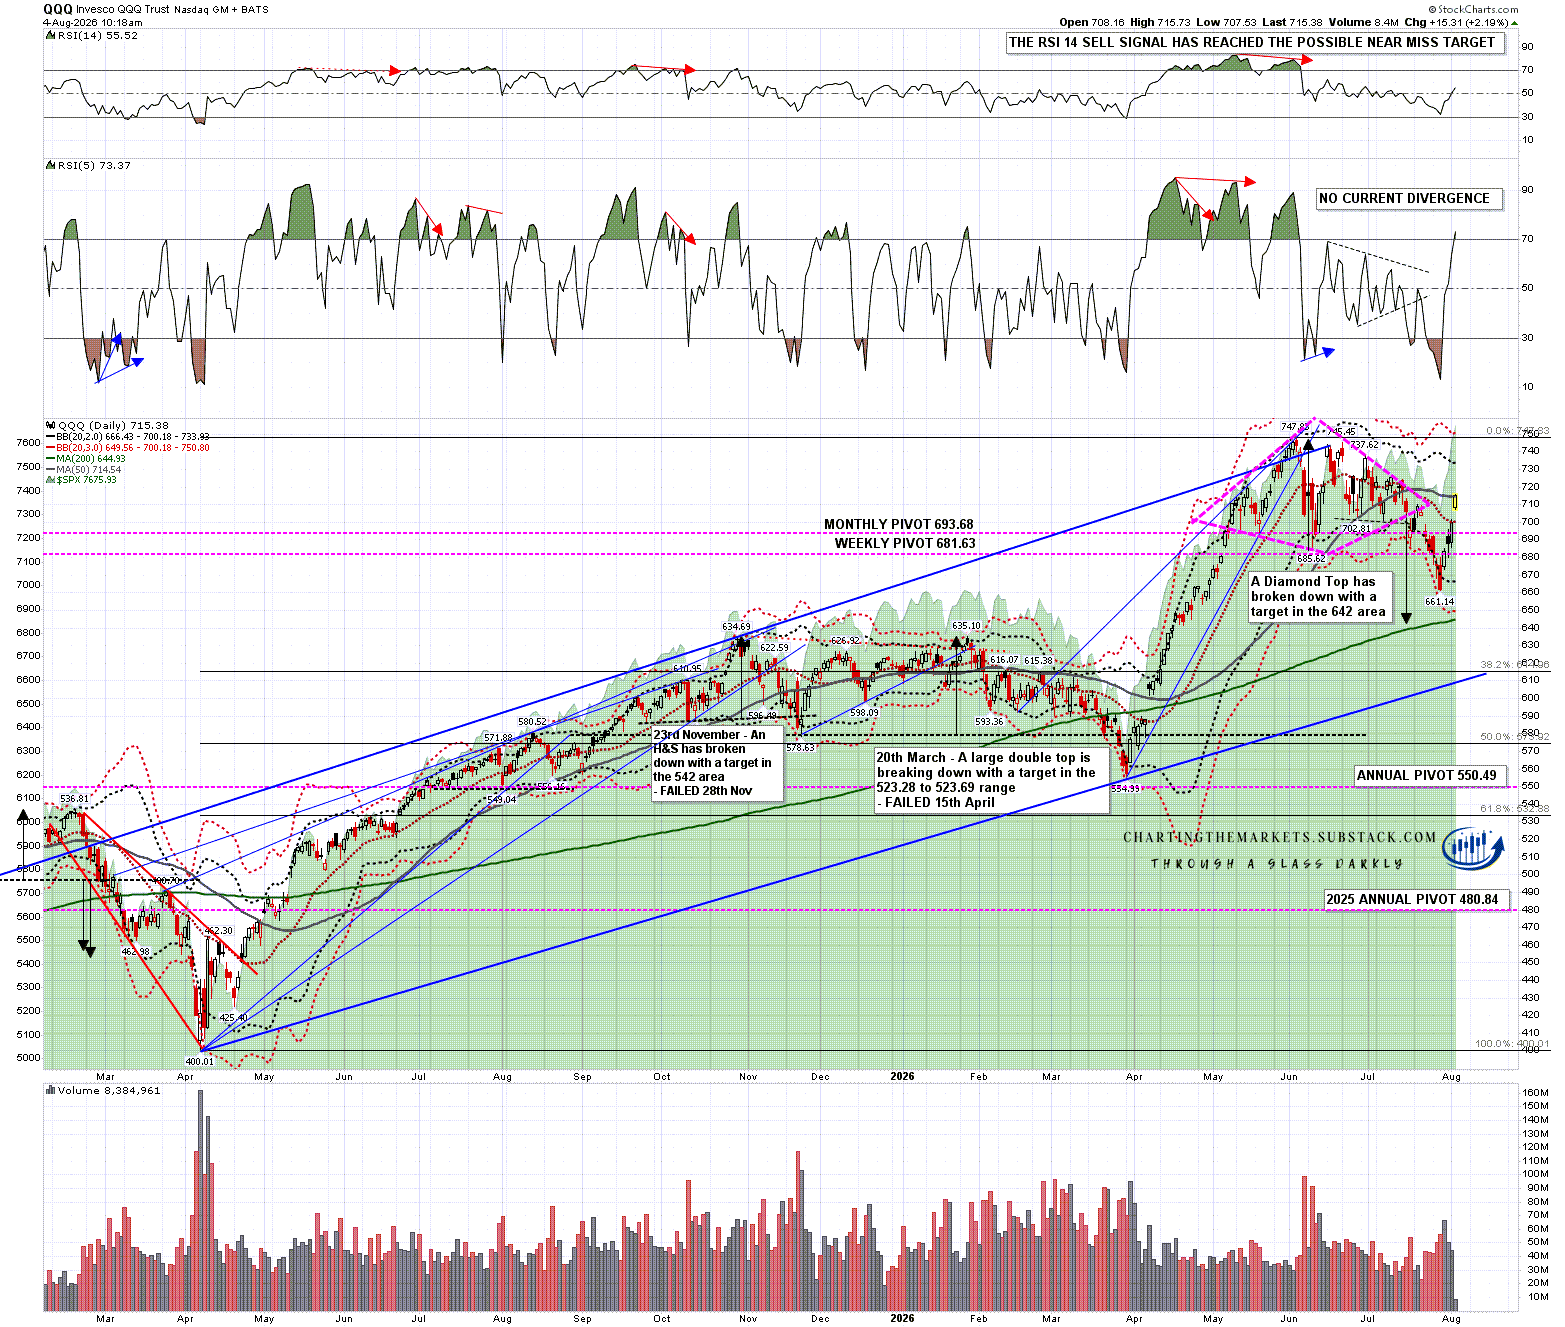
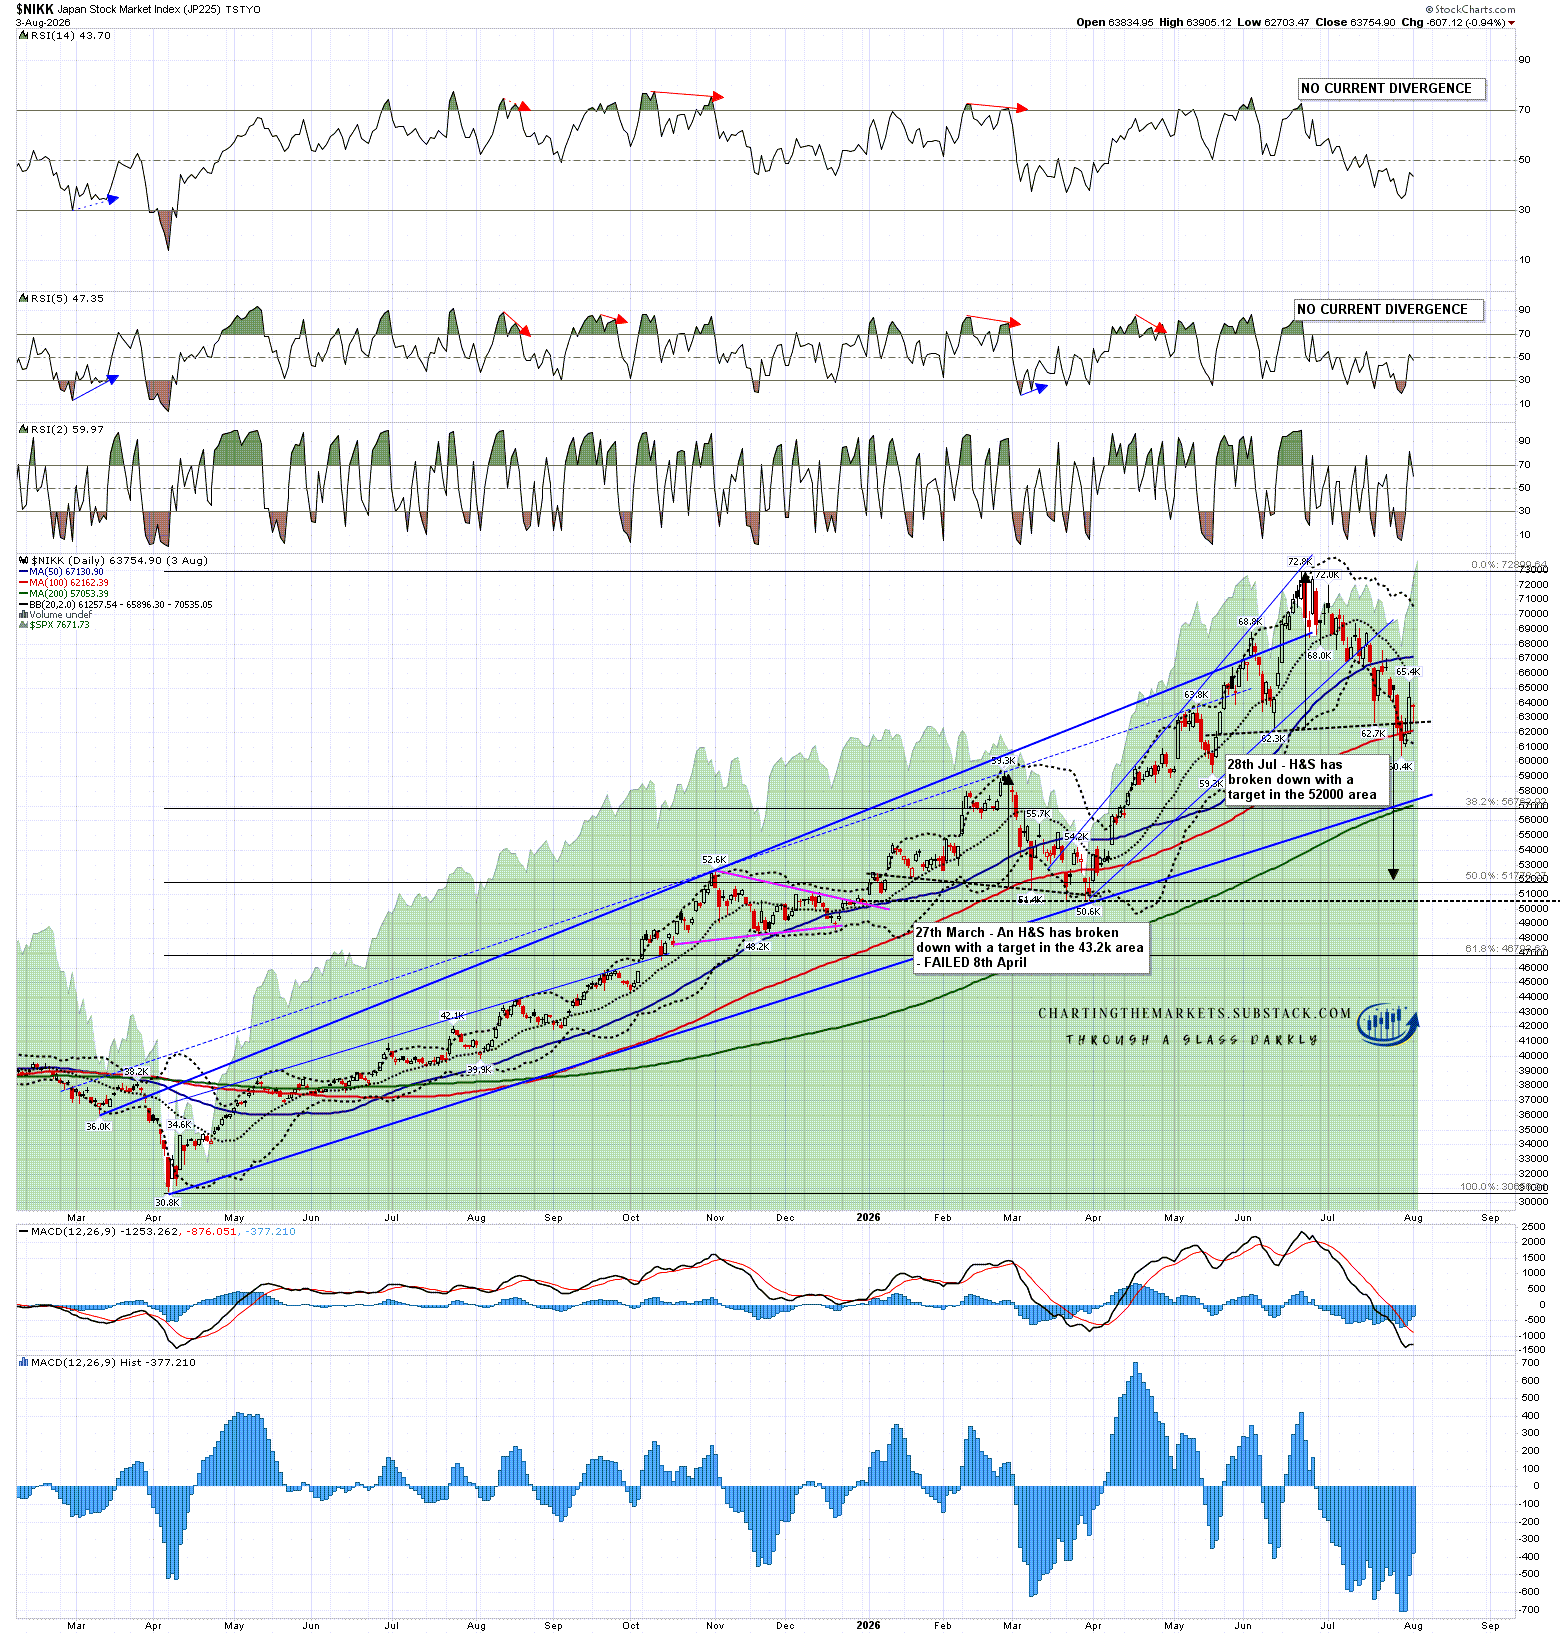
In my post on Tuesday 4th August I was looking at the ambiguous setup on US indices and the Nikkei after the strong rally into the beginning of August, noting the three good quality topping patterns that were still intact on the Philadelphia Semiconductor Index (SOX), QQQ and Nikkei.
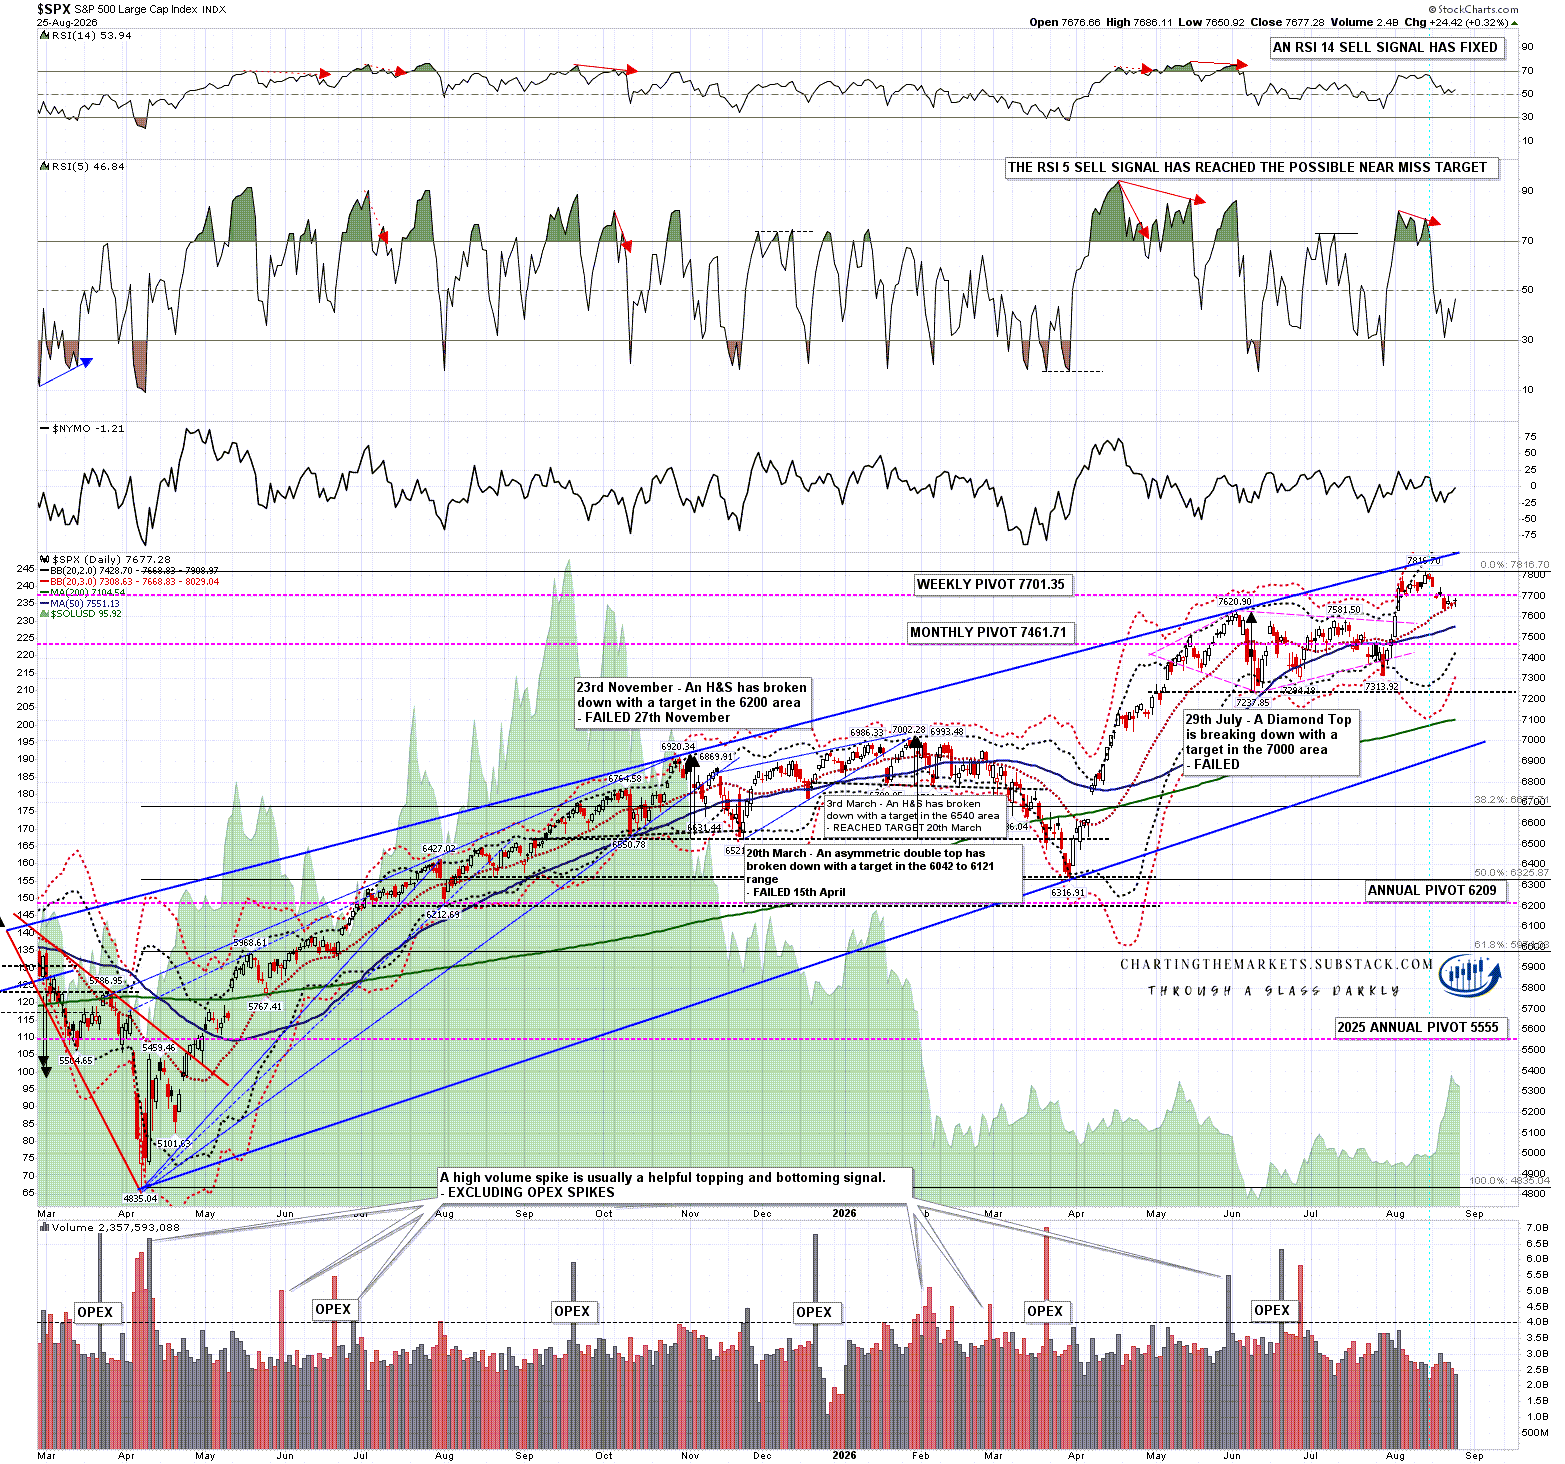
I also noted that SPX was close to the daily 3sd upper band, and said that I was looking for a short term consolidation of a week or so, to allow time for the daily middle bands to go higher, and for the daily outer bands to expand, opening up further possible upside. We have since seen that consolidation last for three weeks so far, the daily middle bands have turned up, and the outer bands expanded, but have since started to contract again.
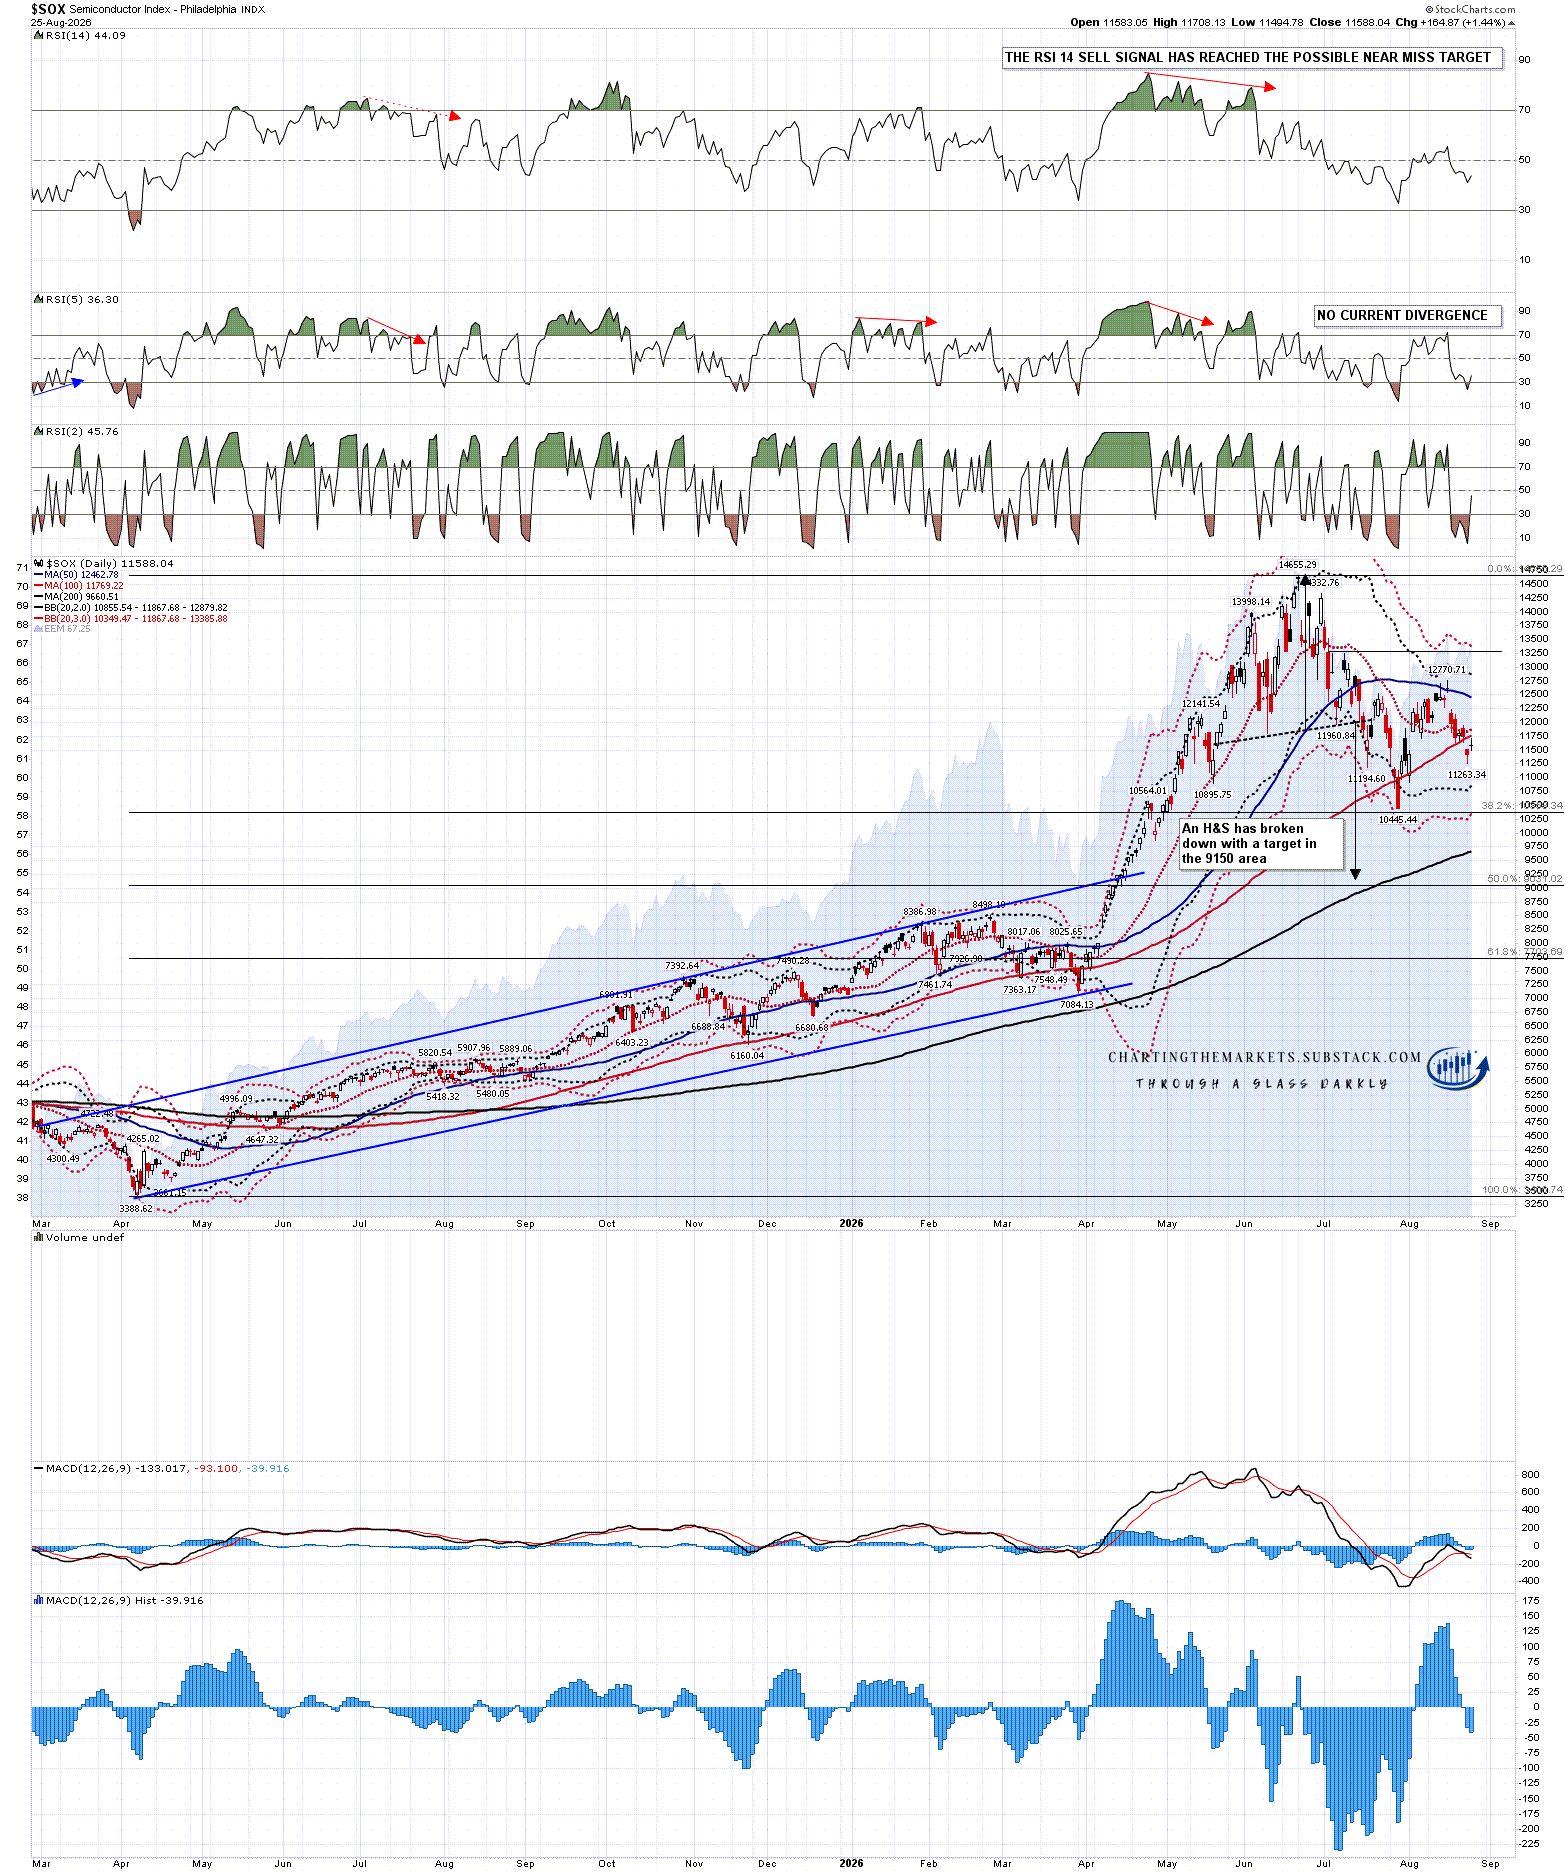
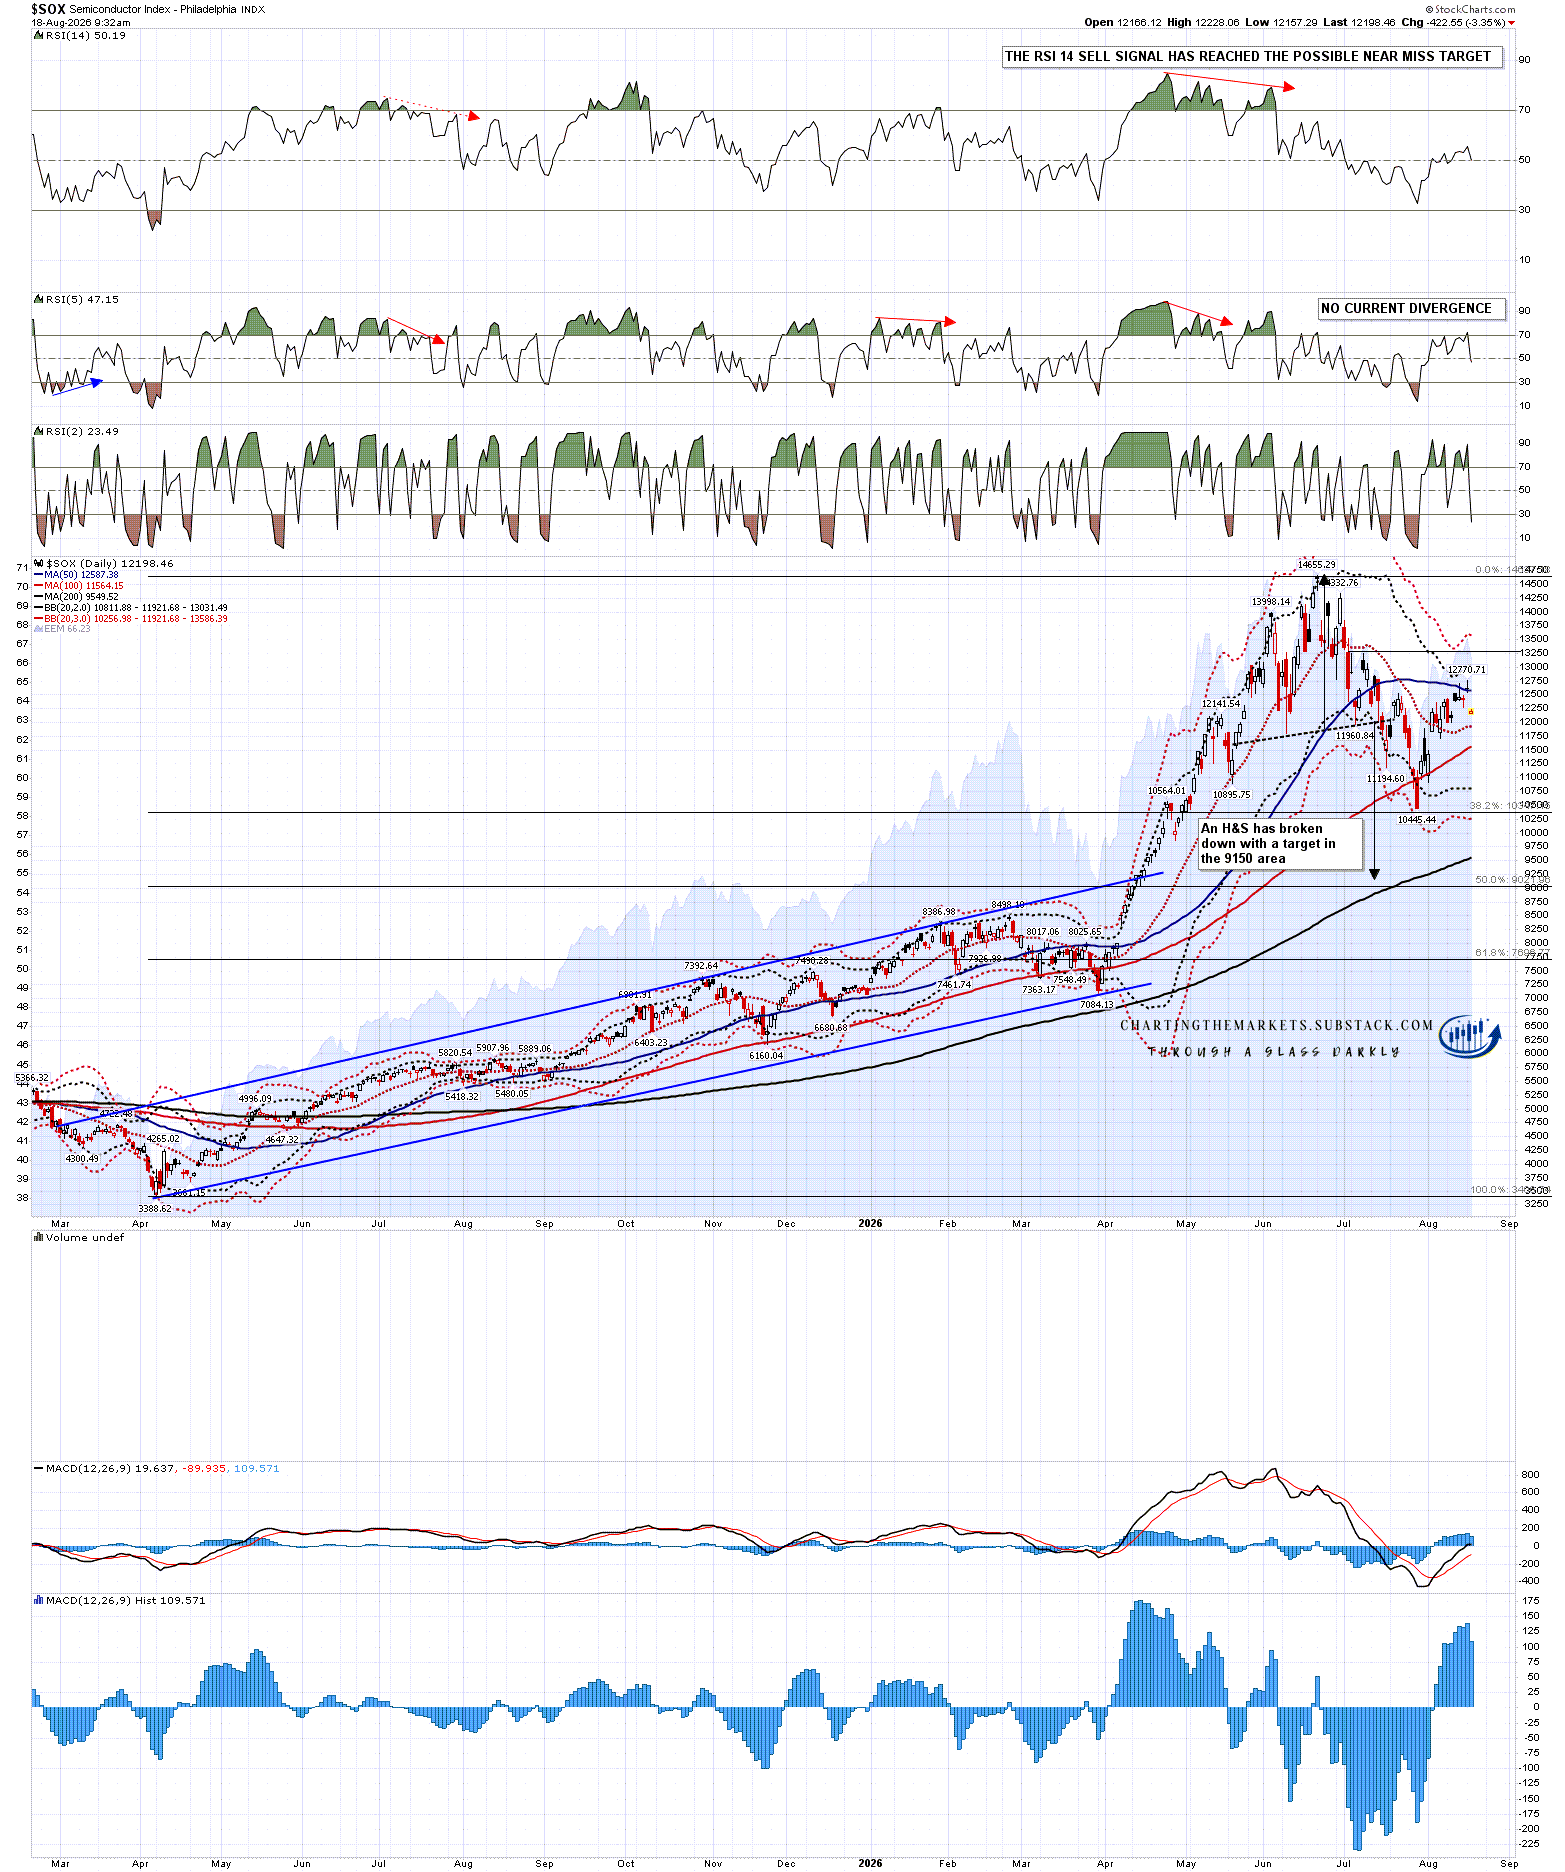
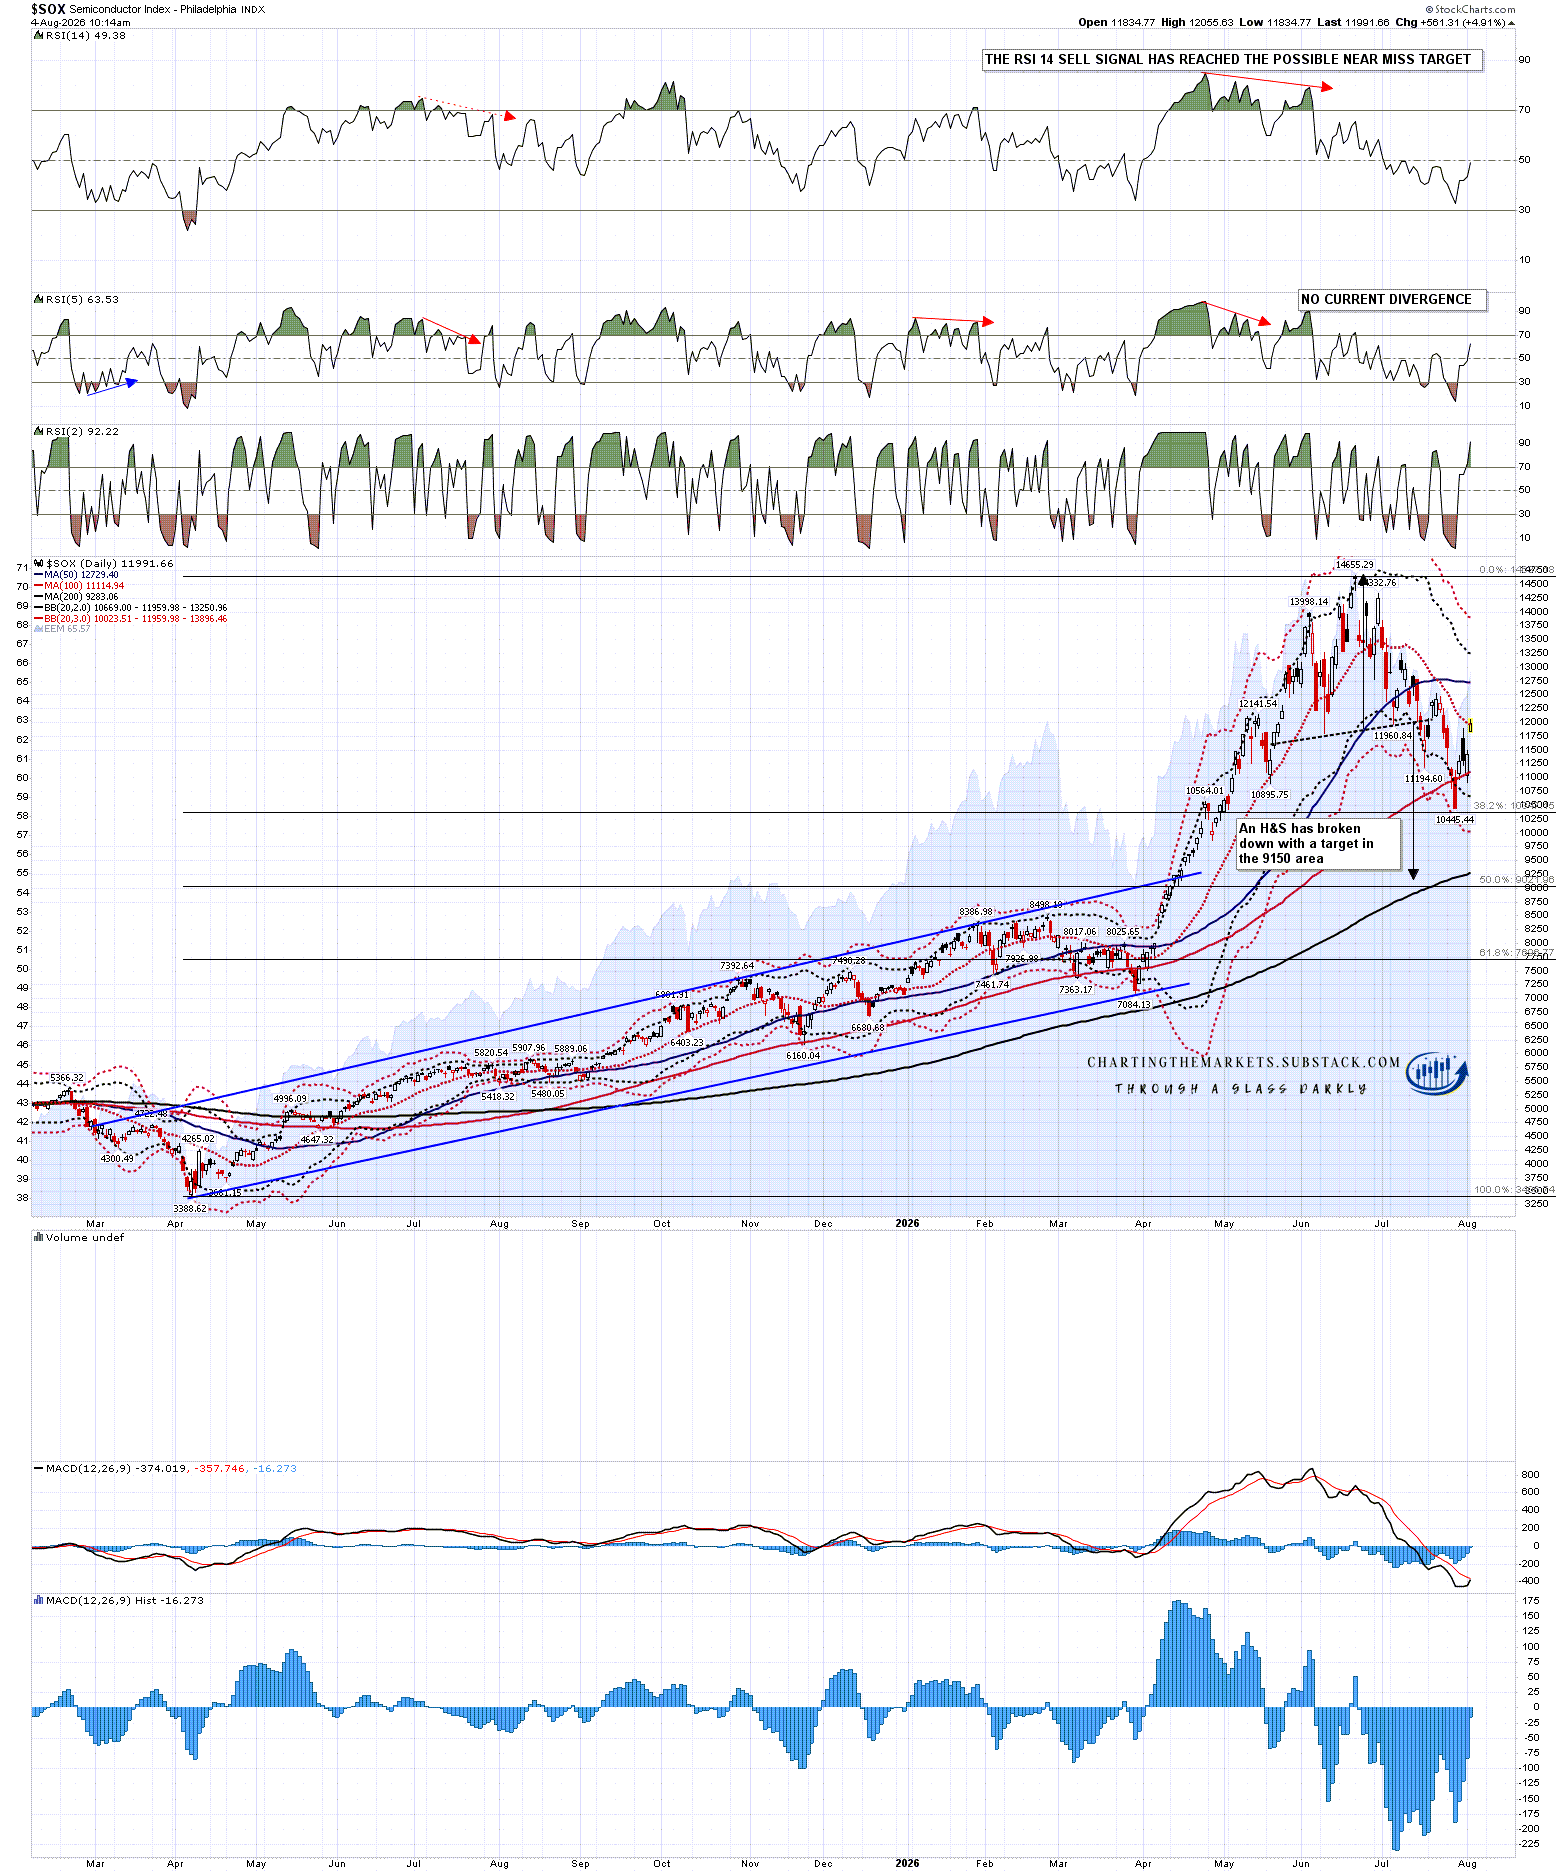
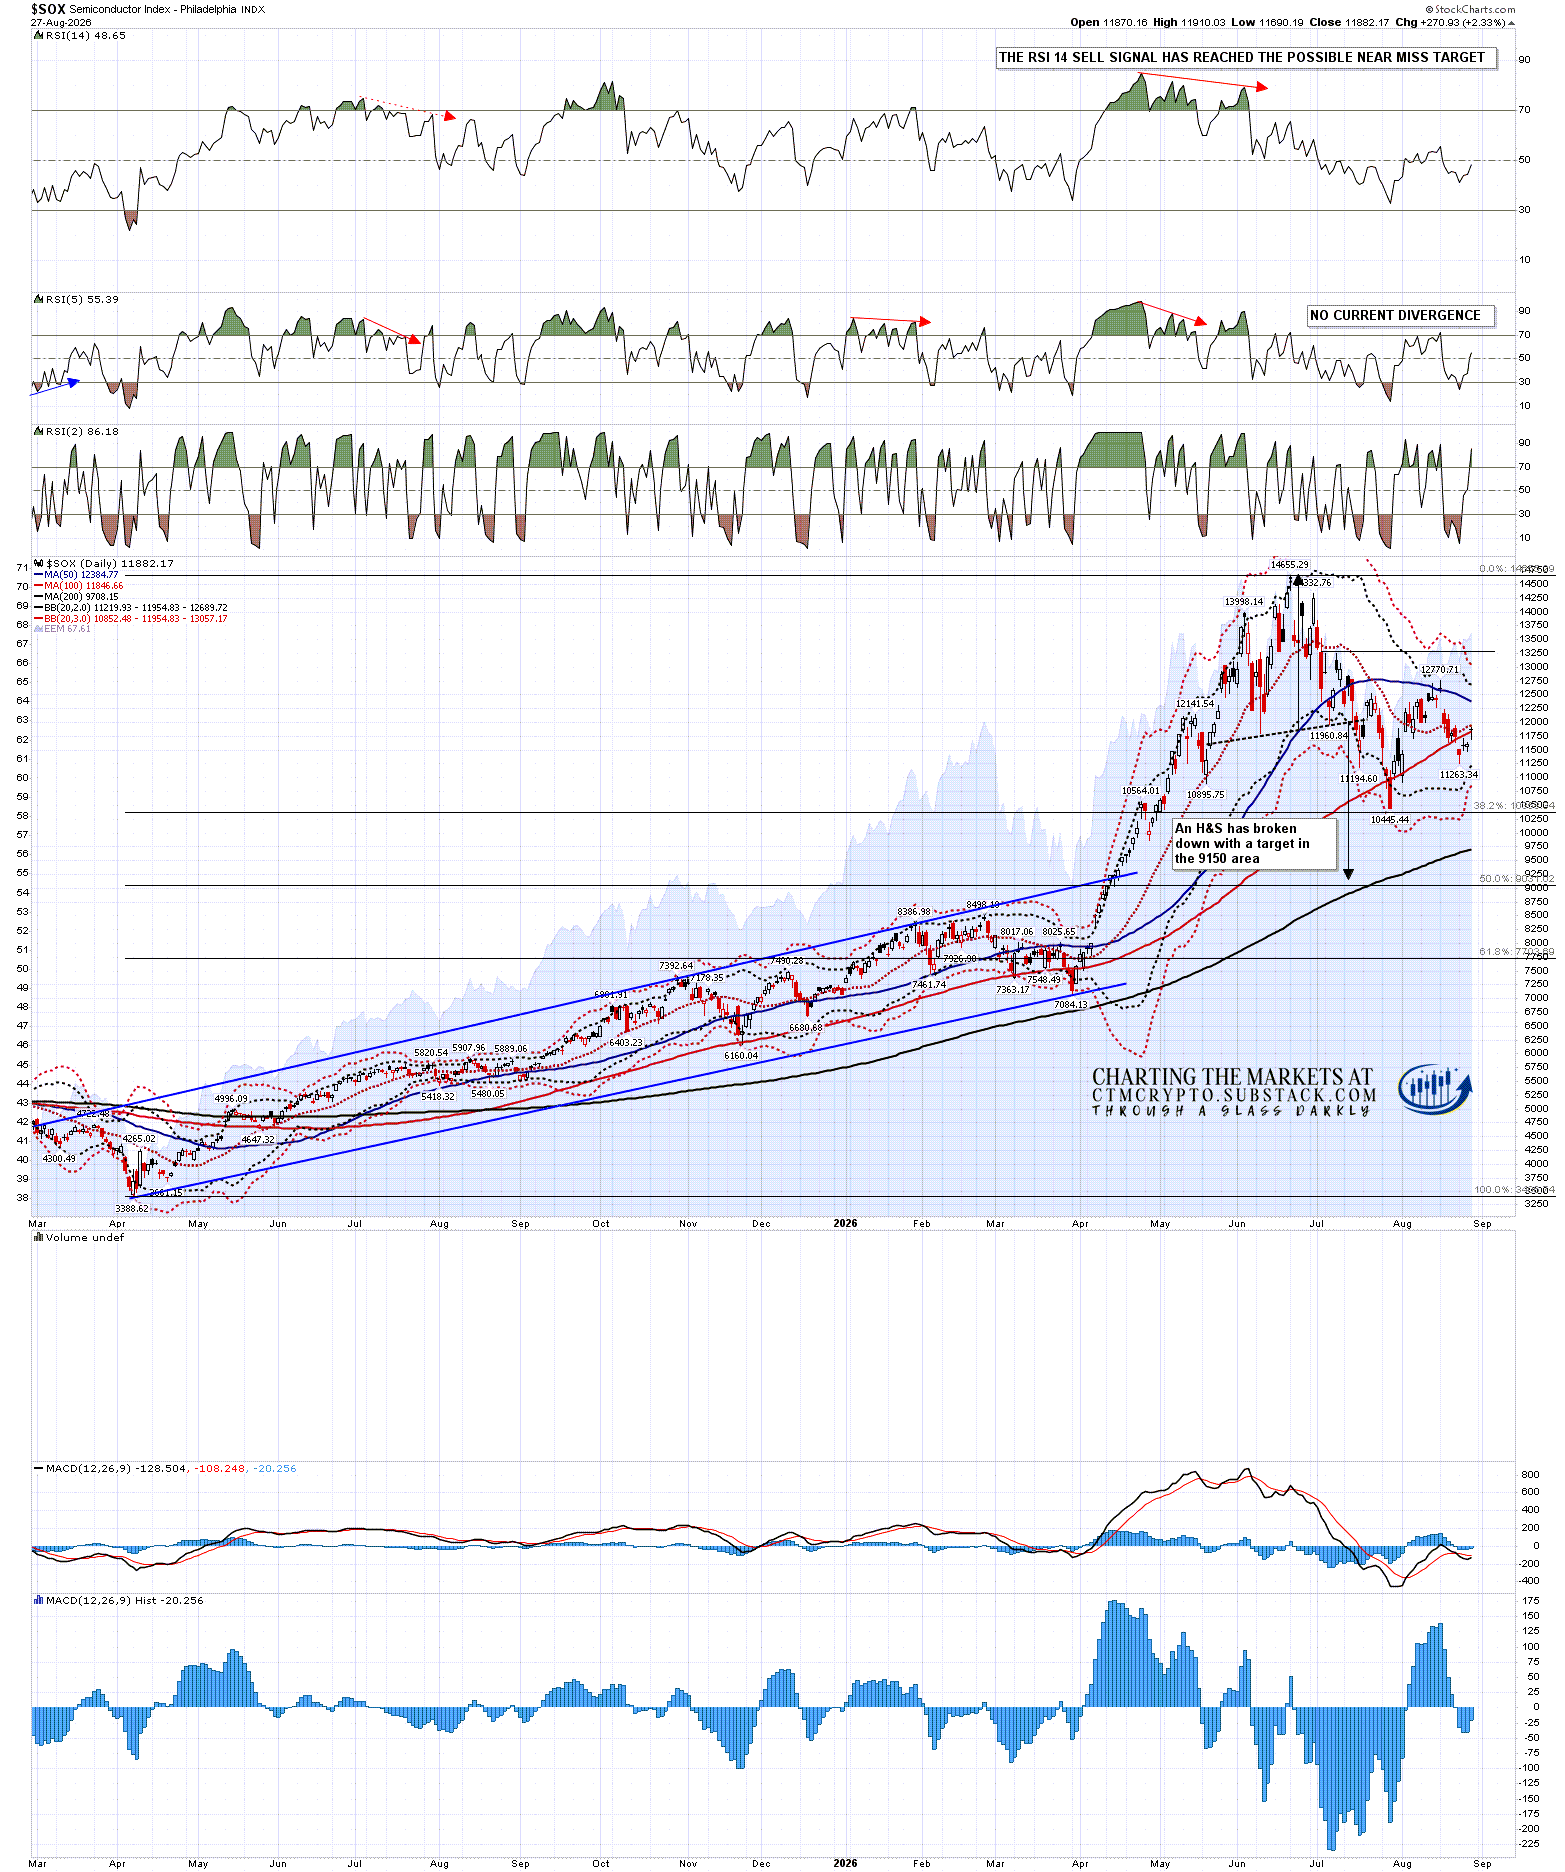
Of those three topping patterns the high quality H&S on Nikkei has since failed with a target at a retest of the all time high but the but the topping patterns on SOX and QQQ remain intact. The H&S right shoulder high on SOX is at 13,249.07 and if that fails to hold as resistance the target would be an all time high retest, but so far that has not been in danger of failing, with a thorough backtest of the 50dma marking the high so far.
In my last post on Wednesday I was looking at the importance of the daily middle bands as trend support and since then we have seen good NVDA earnings on Wednesday night and a modest rally. We are still clearly in this inflection point though and it seems very possible we will see a break up or down on the Fed statement at Jackson Hole expected at 10am EST this morning.
In the meantime the Philadelphia Semiconductor Index (SOX) has rallied back to test daily middle band support from below. This is an index I am watching very carefully as, in the absence of a rejection higher, it is likely in the process of retracing 50% of the huge move up from the April 2025 low:
SOX daily chart:
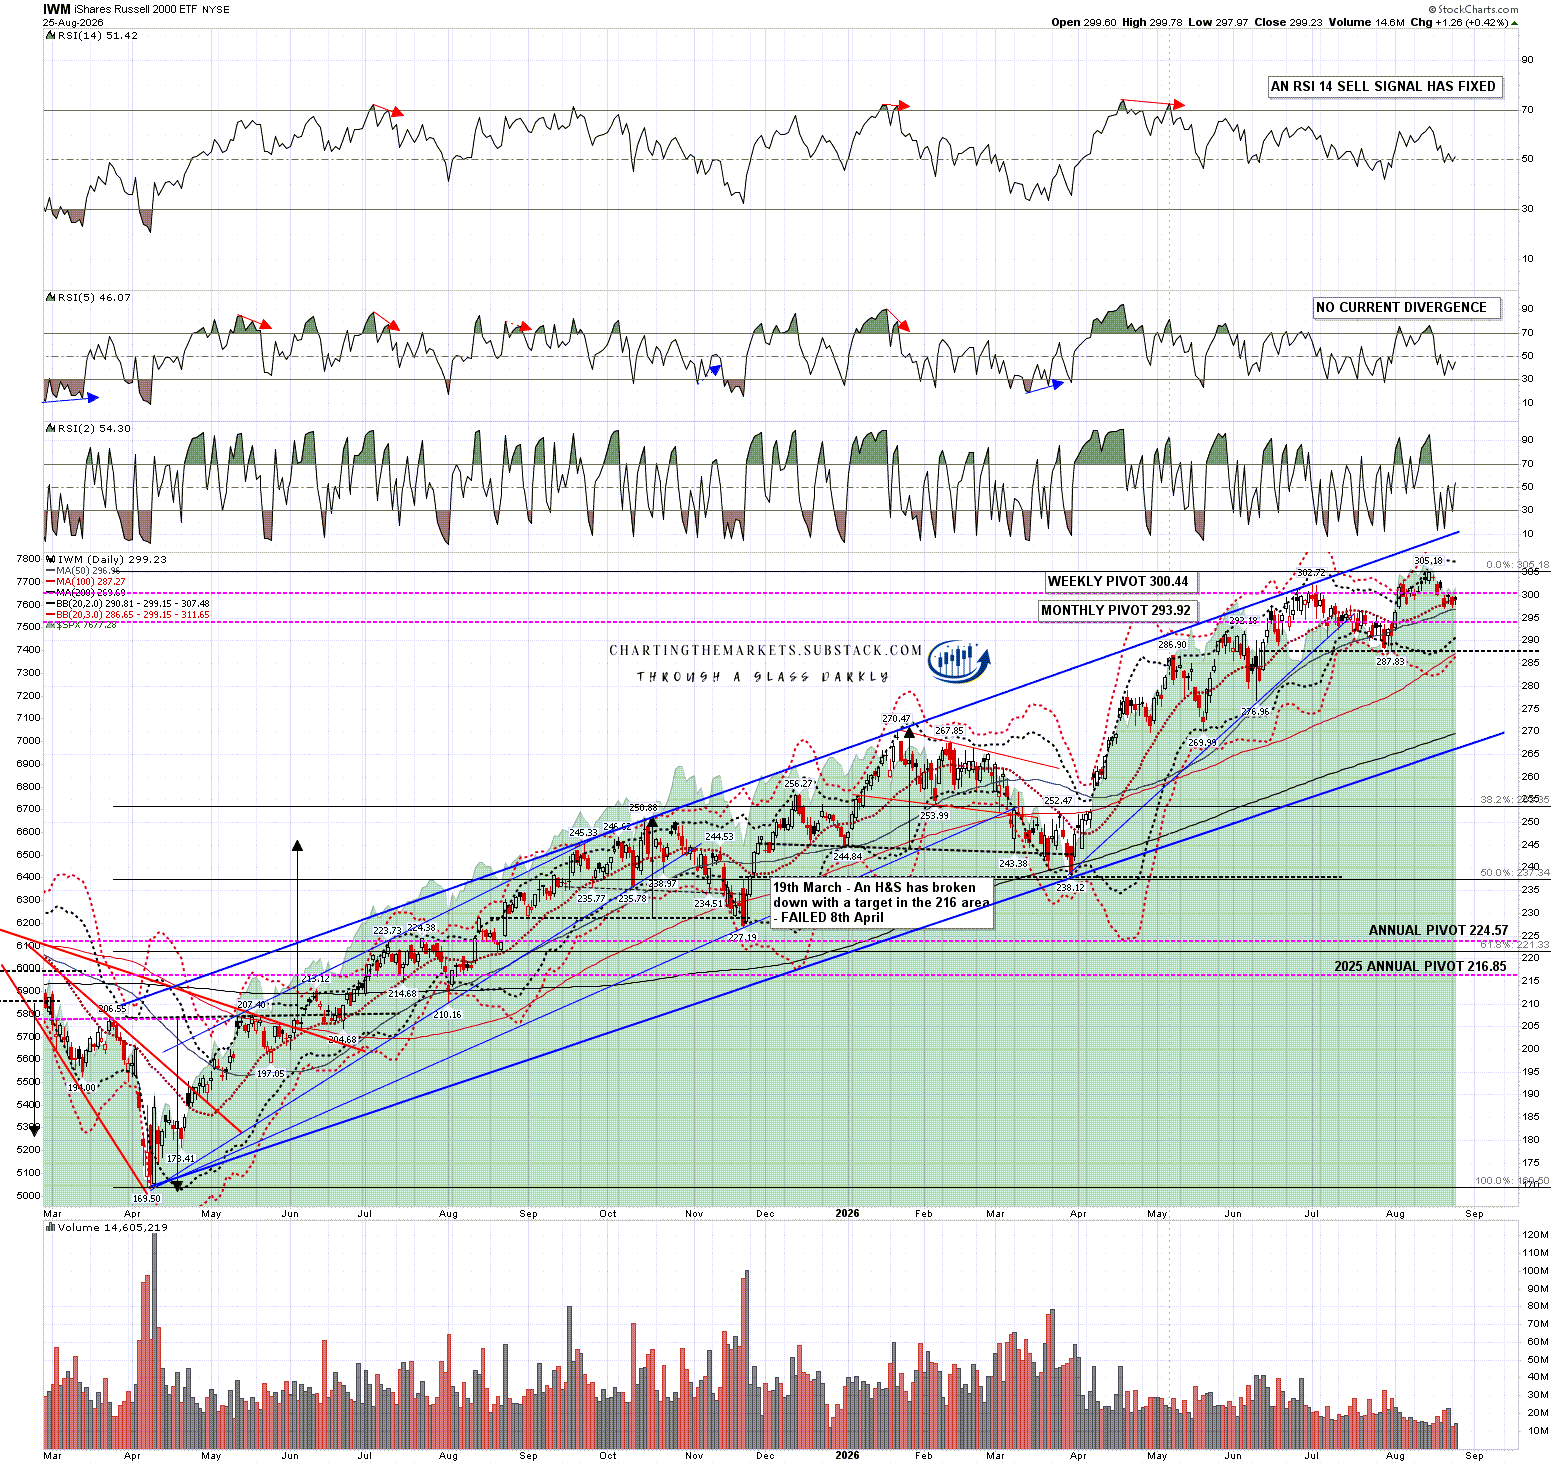
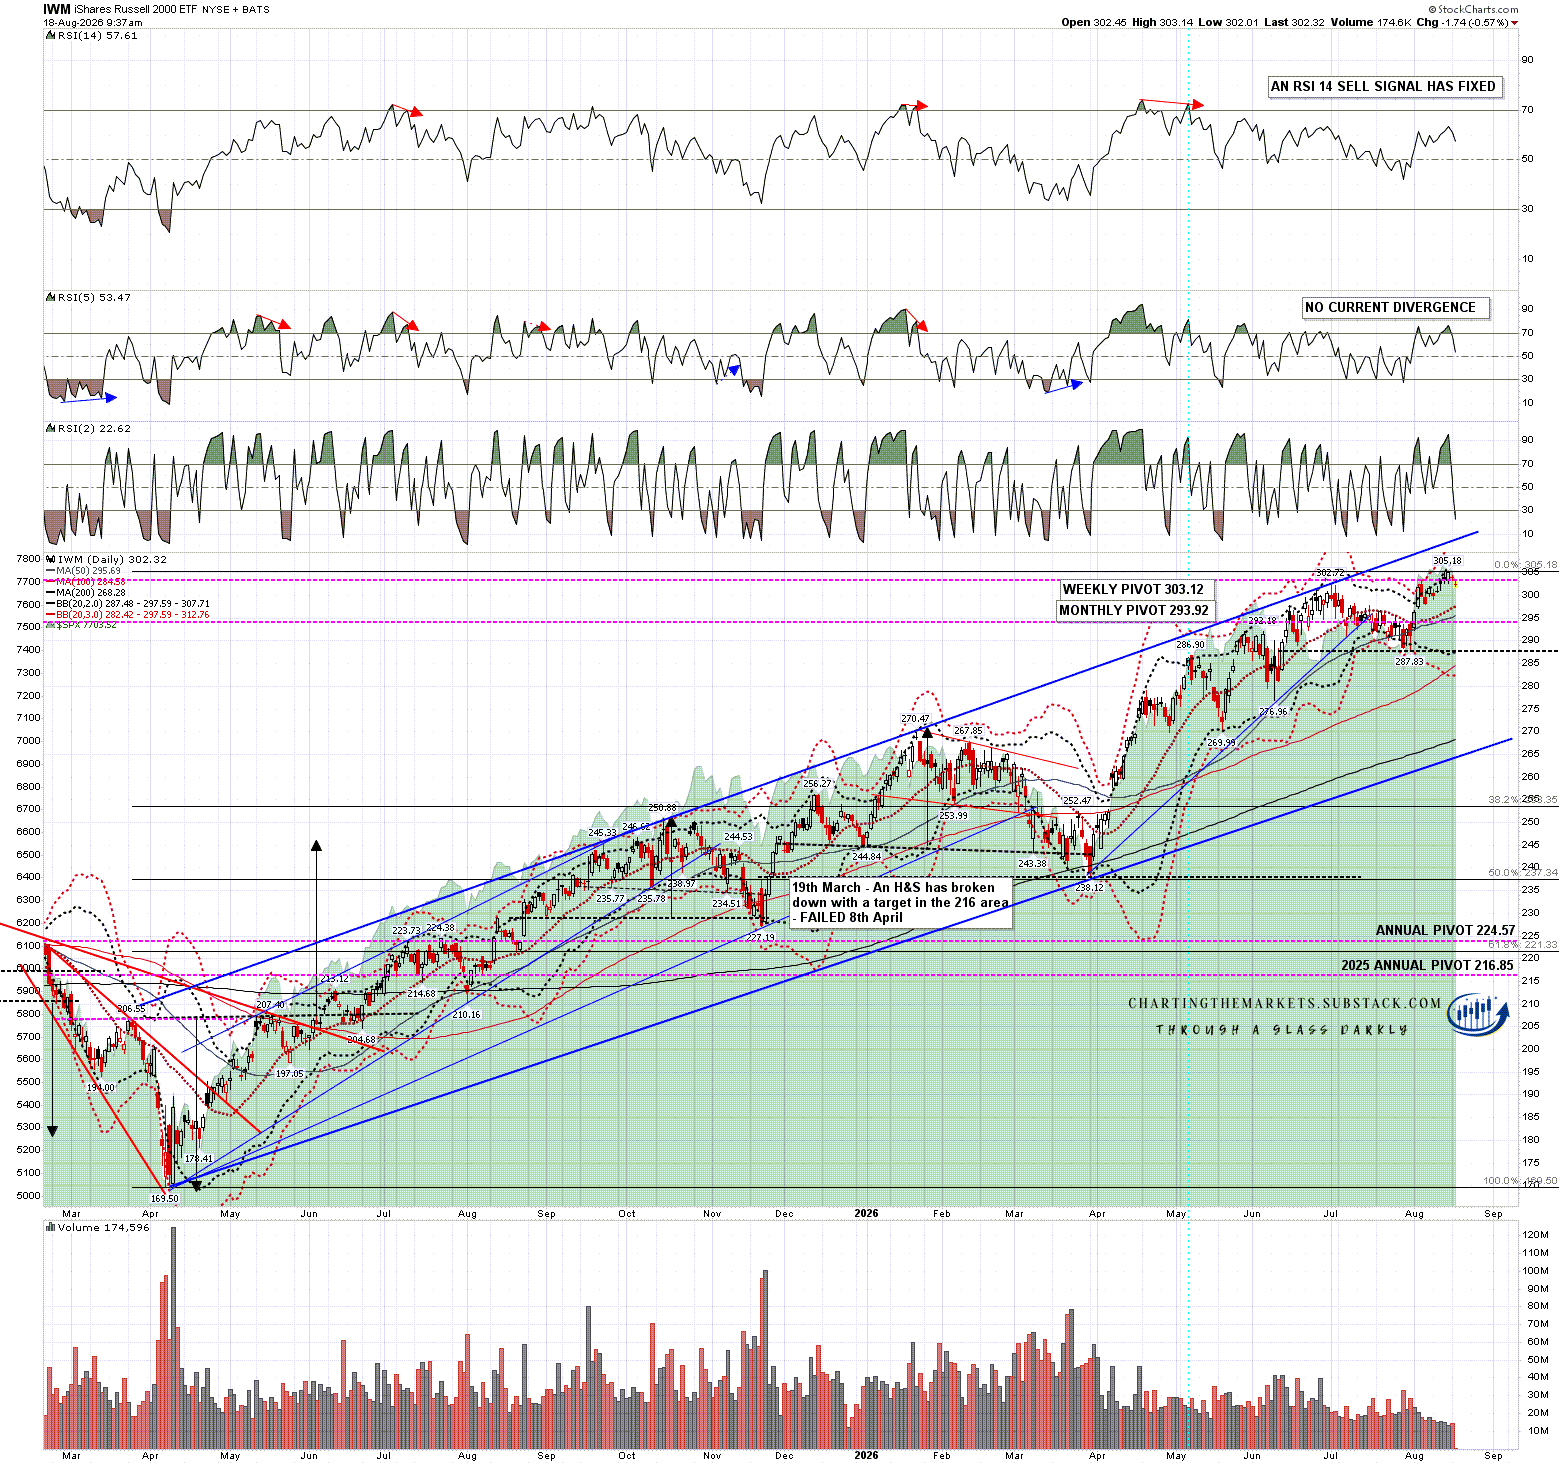
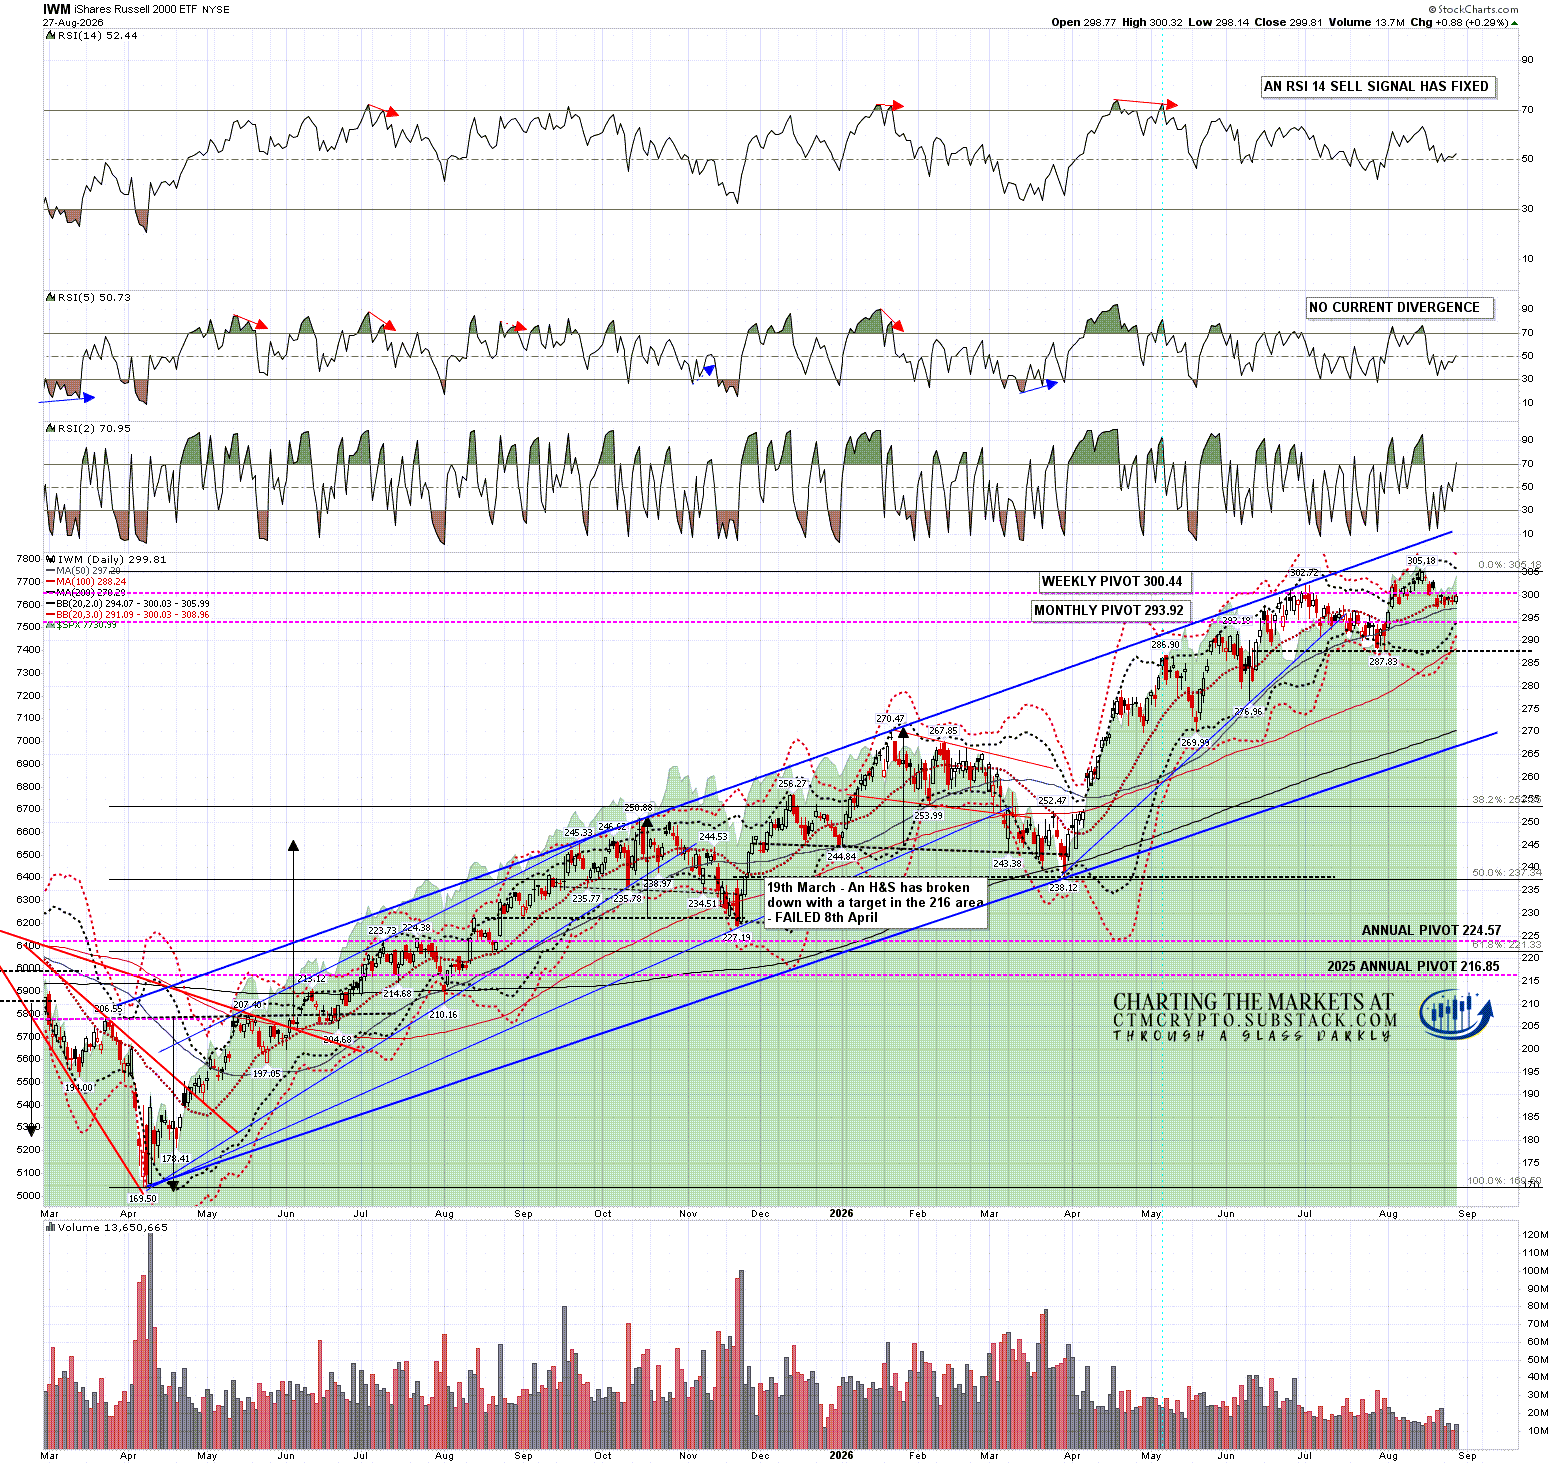
IWM has also closed under the daily middle band every day this week including yesterday. There is currently no obvious reversal pattern setting up a retest of the all time high.
IWM daily chart:
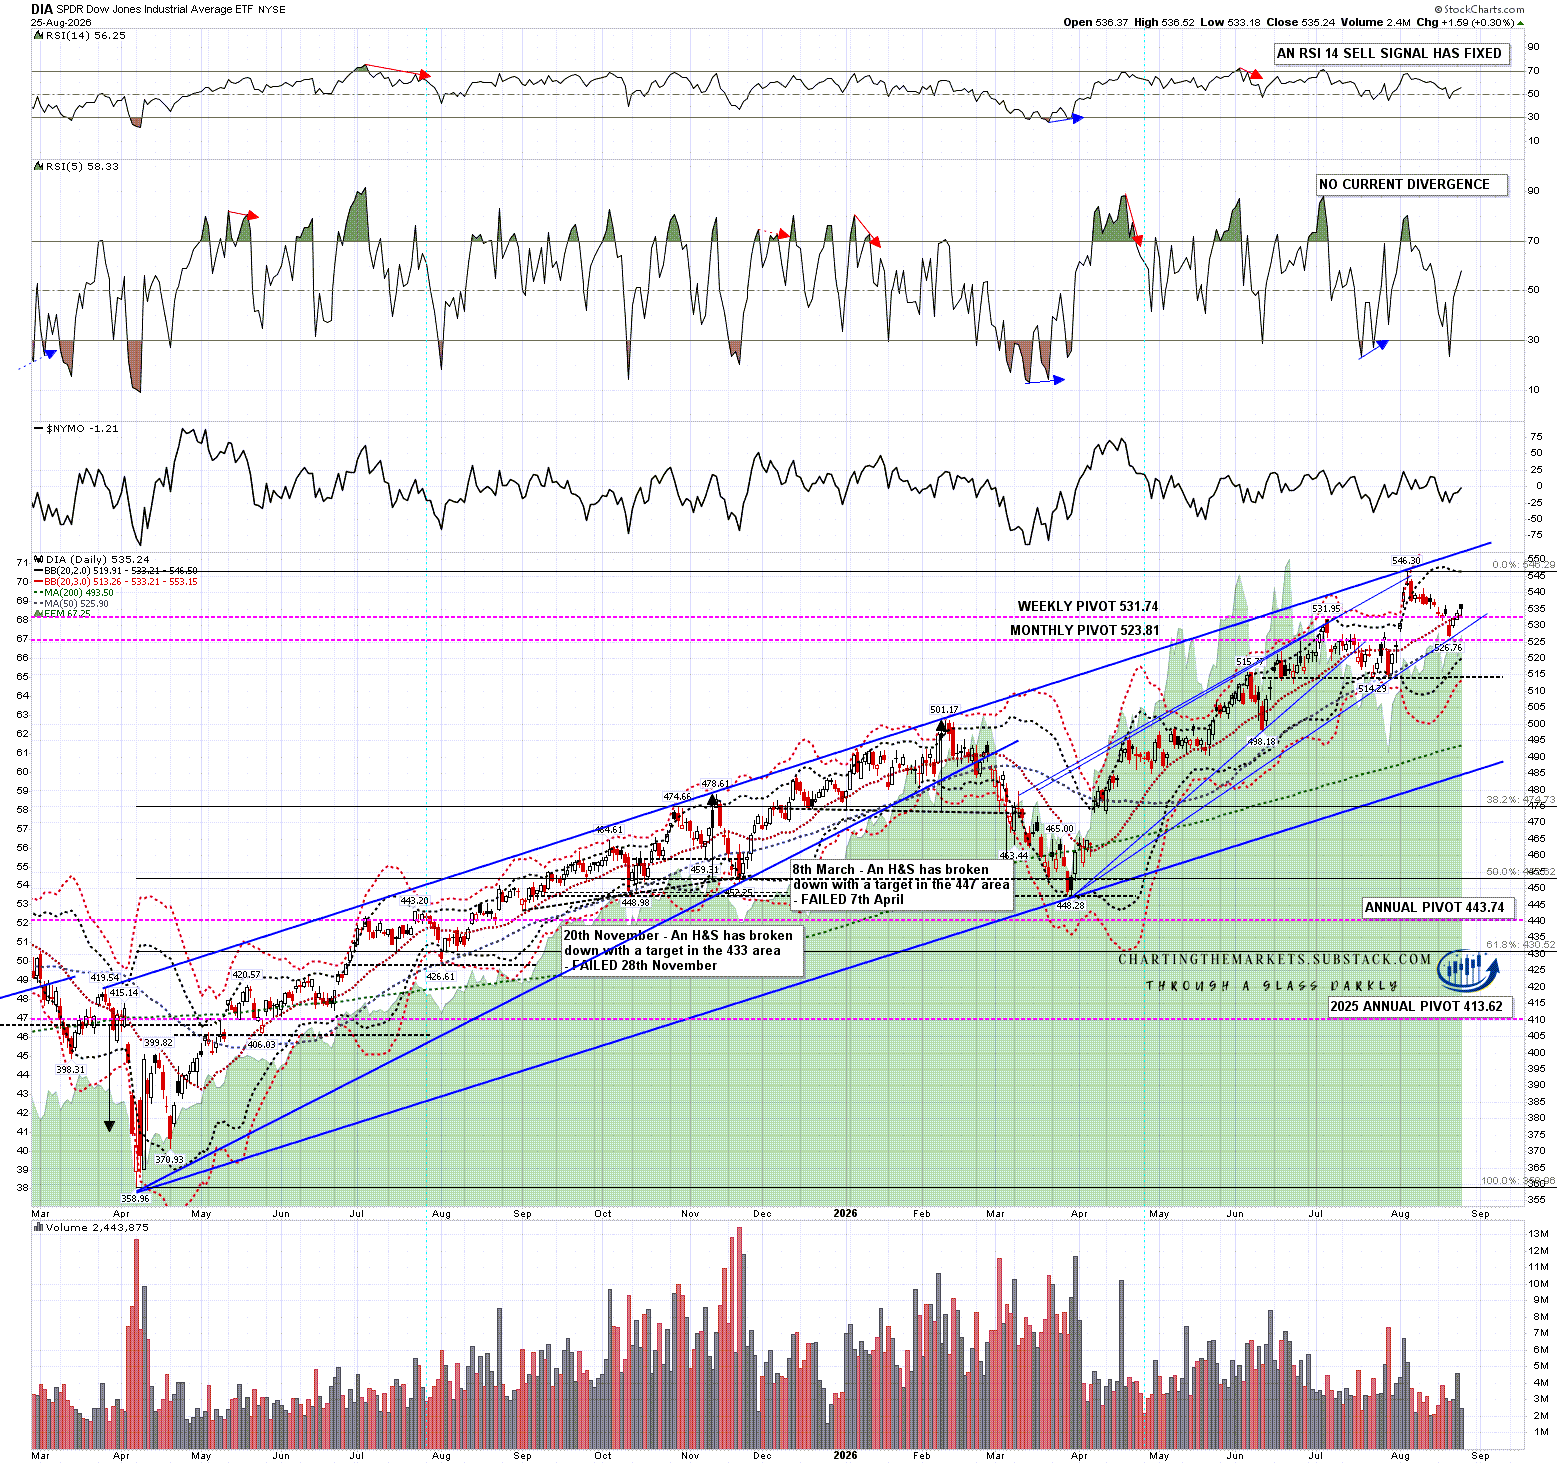
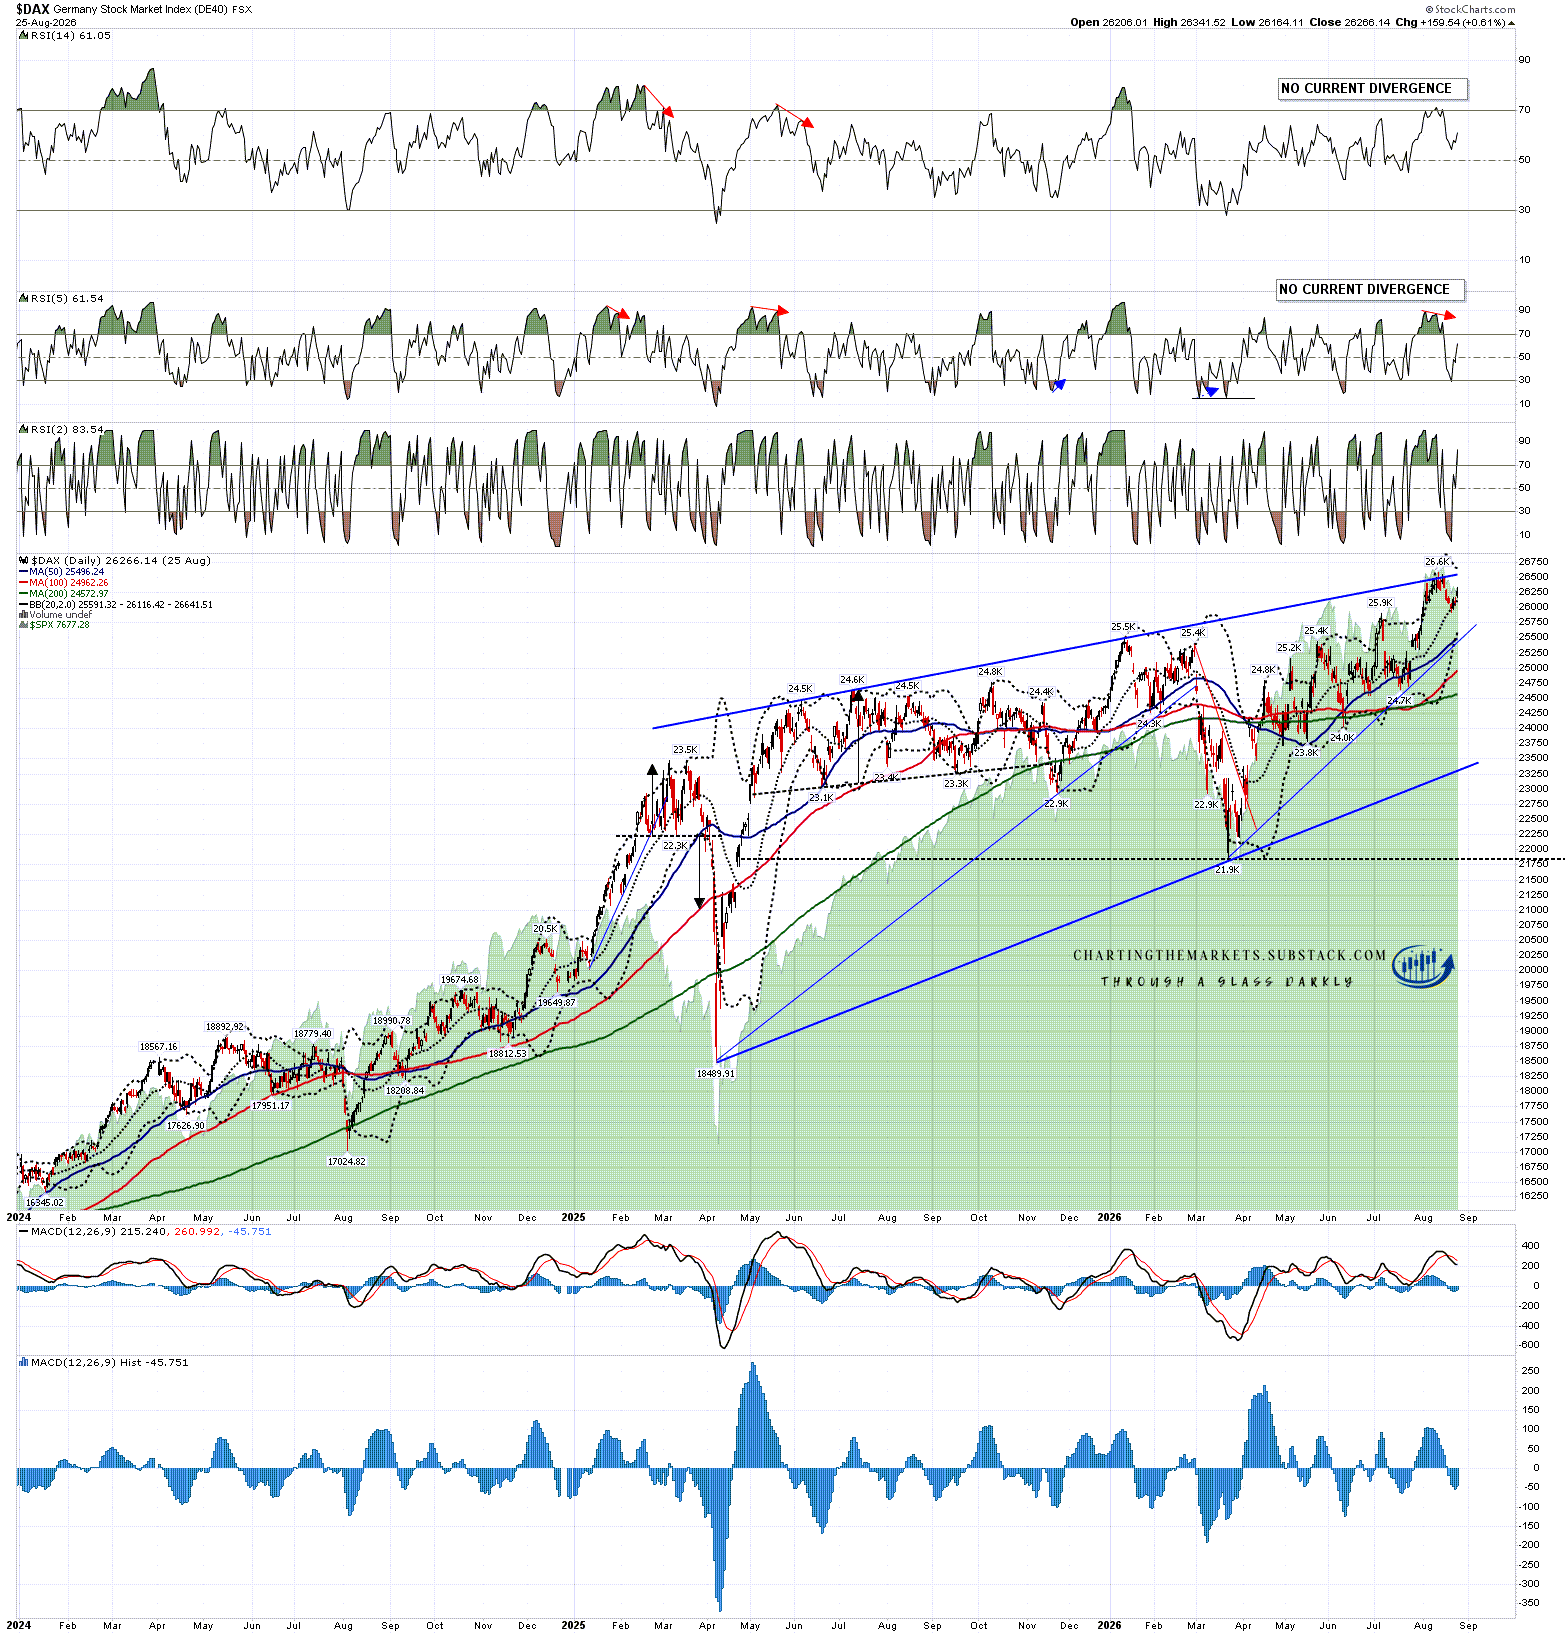
Of the other indices SPX had a decent, though still modest, move up from the daily middle band yesterday, closing ~0.4% above it, QQQ and DAX did a bit better, closing ~0.7% above it, and both DIA and NIKK closed marginally above their daily middle bands. This is a promising start for possible high retests, but we are still clearly in the inflection point.
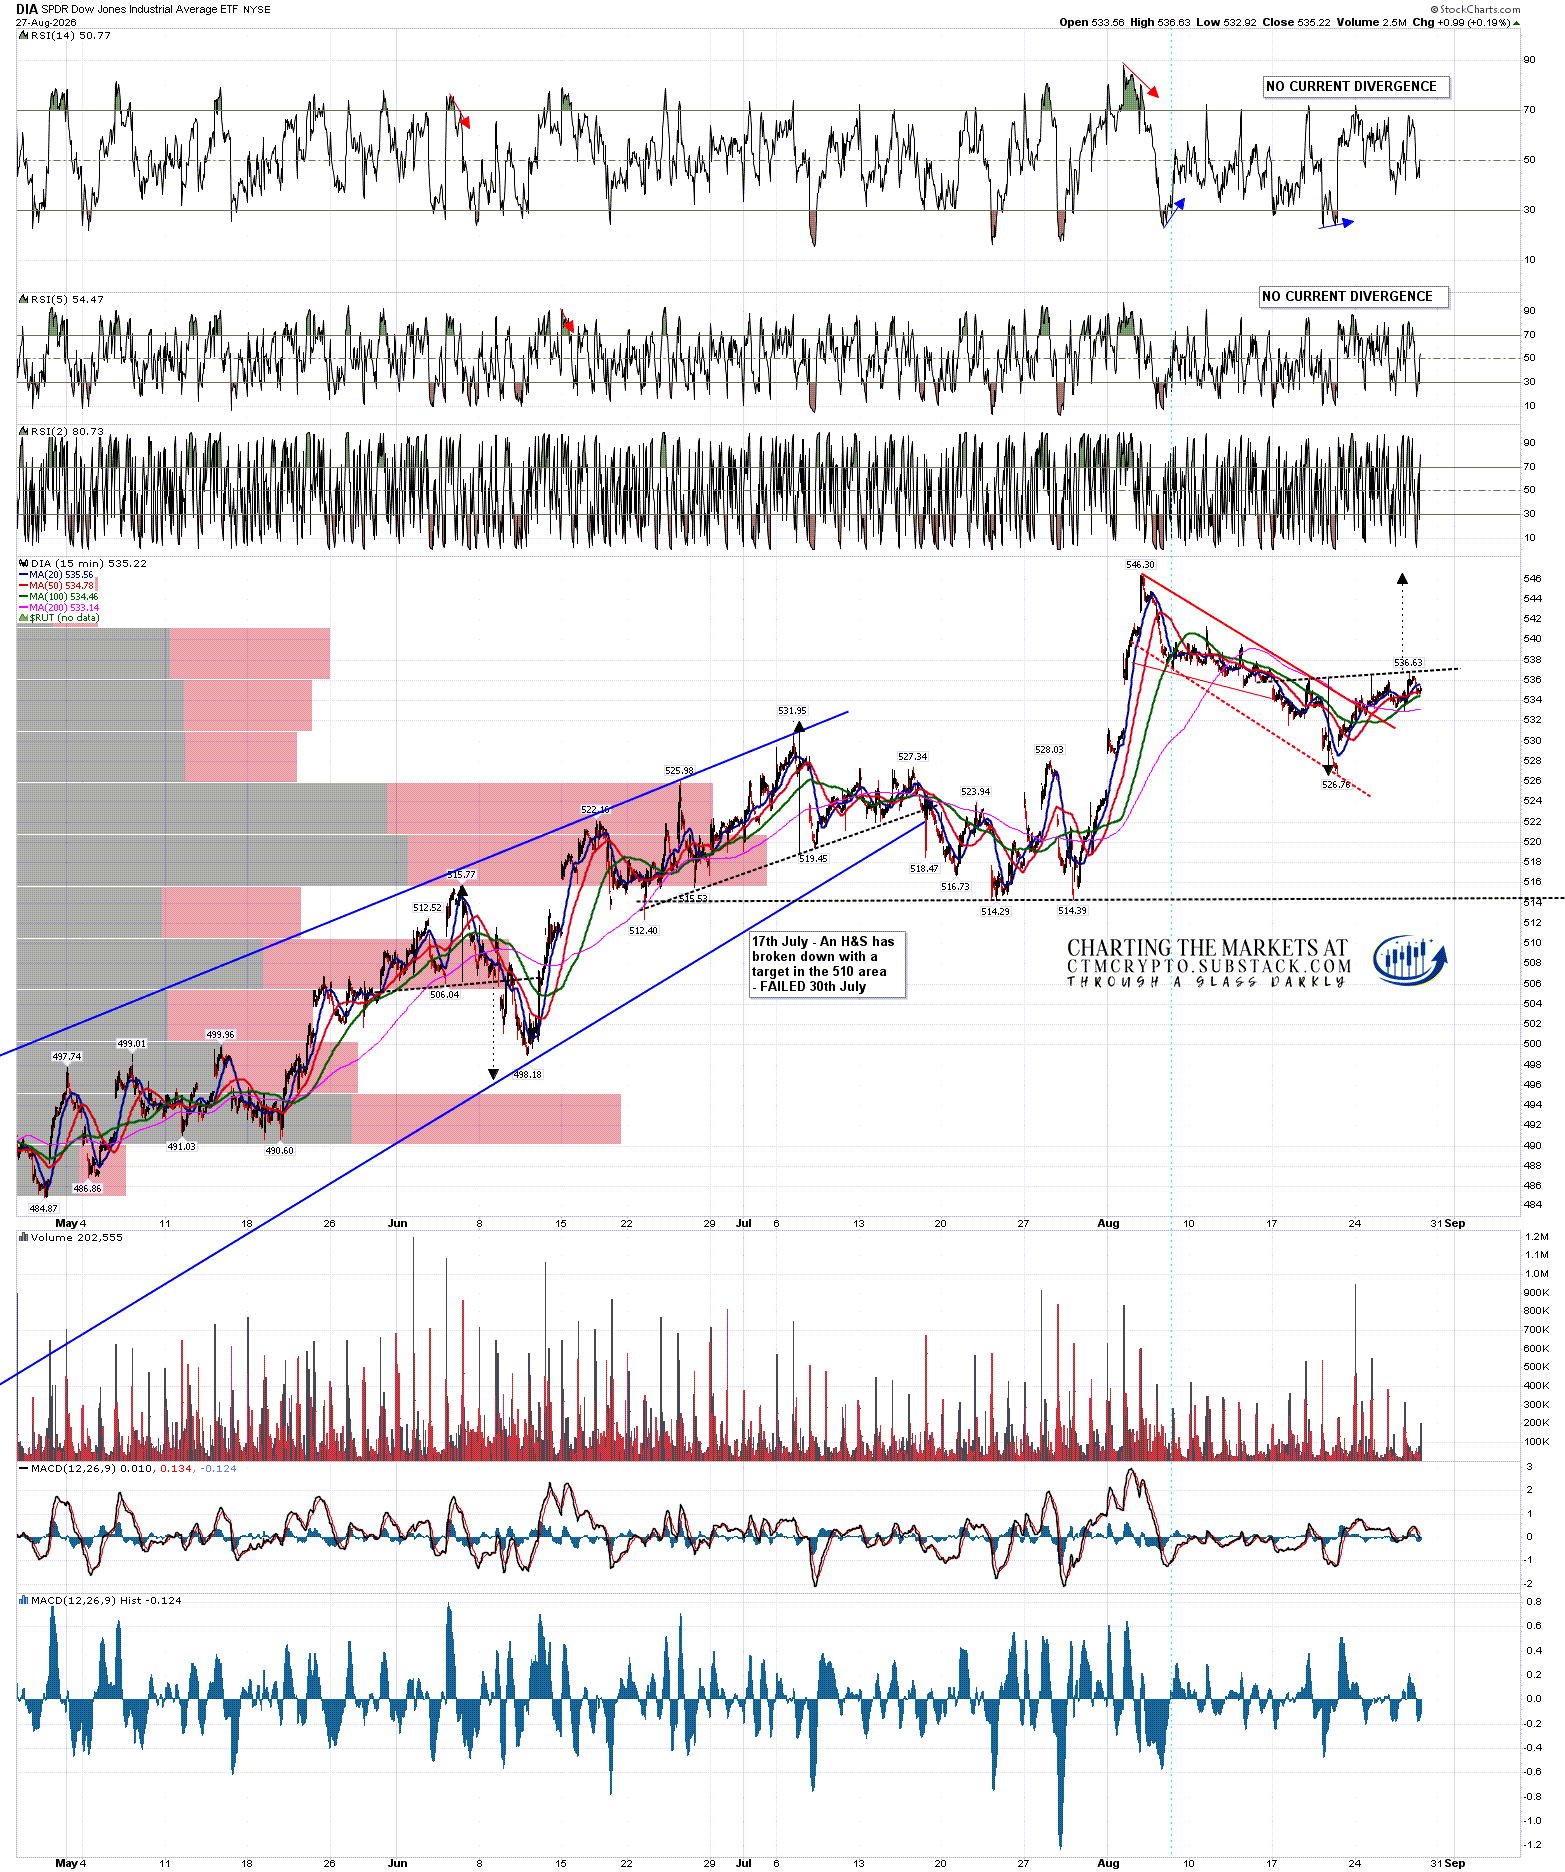
Are there any reversal patterns forming that might deliver those high retests? Yes. The best is on DIA, with a decent quality IHS formed that on a sustained break up would look for a retest of the all time high made in early August.
DIA 15min chart:
A possible IHS is forming on SPX and on a sustained break up would look for a retest of the all time high made in mid August.
SPX 15min chart:
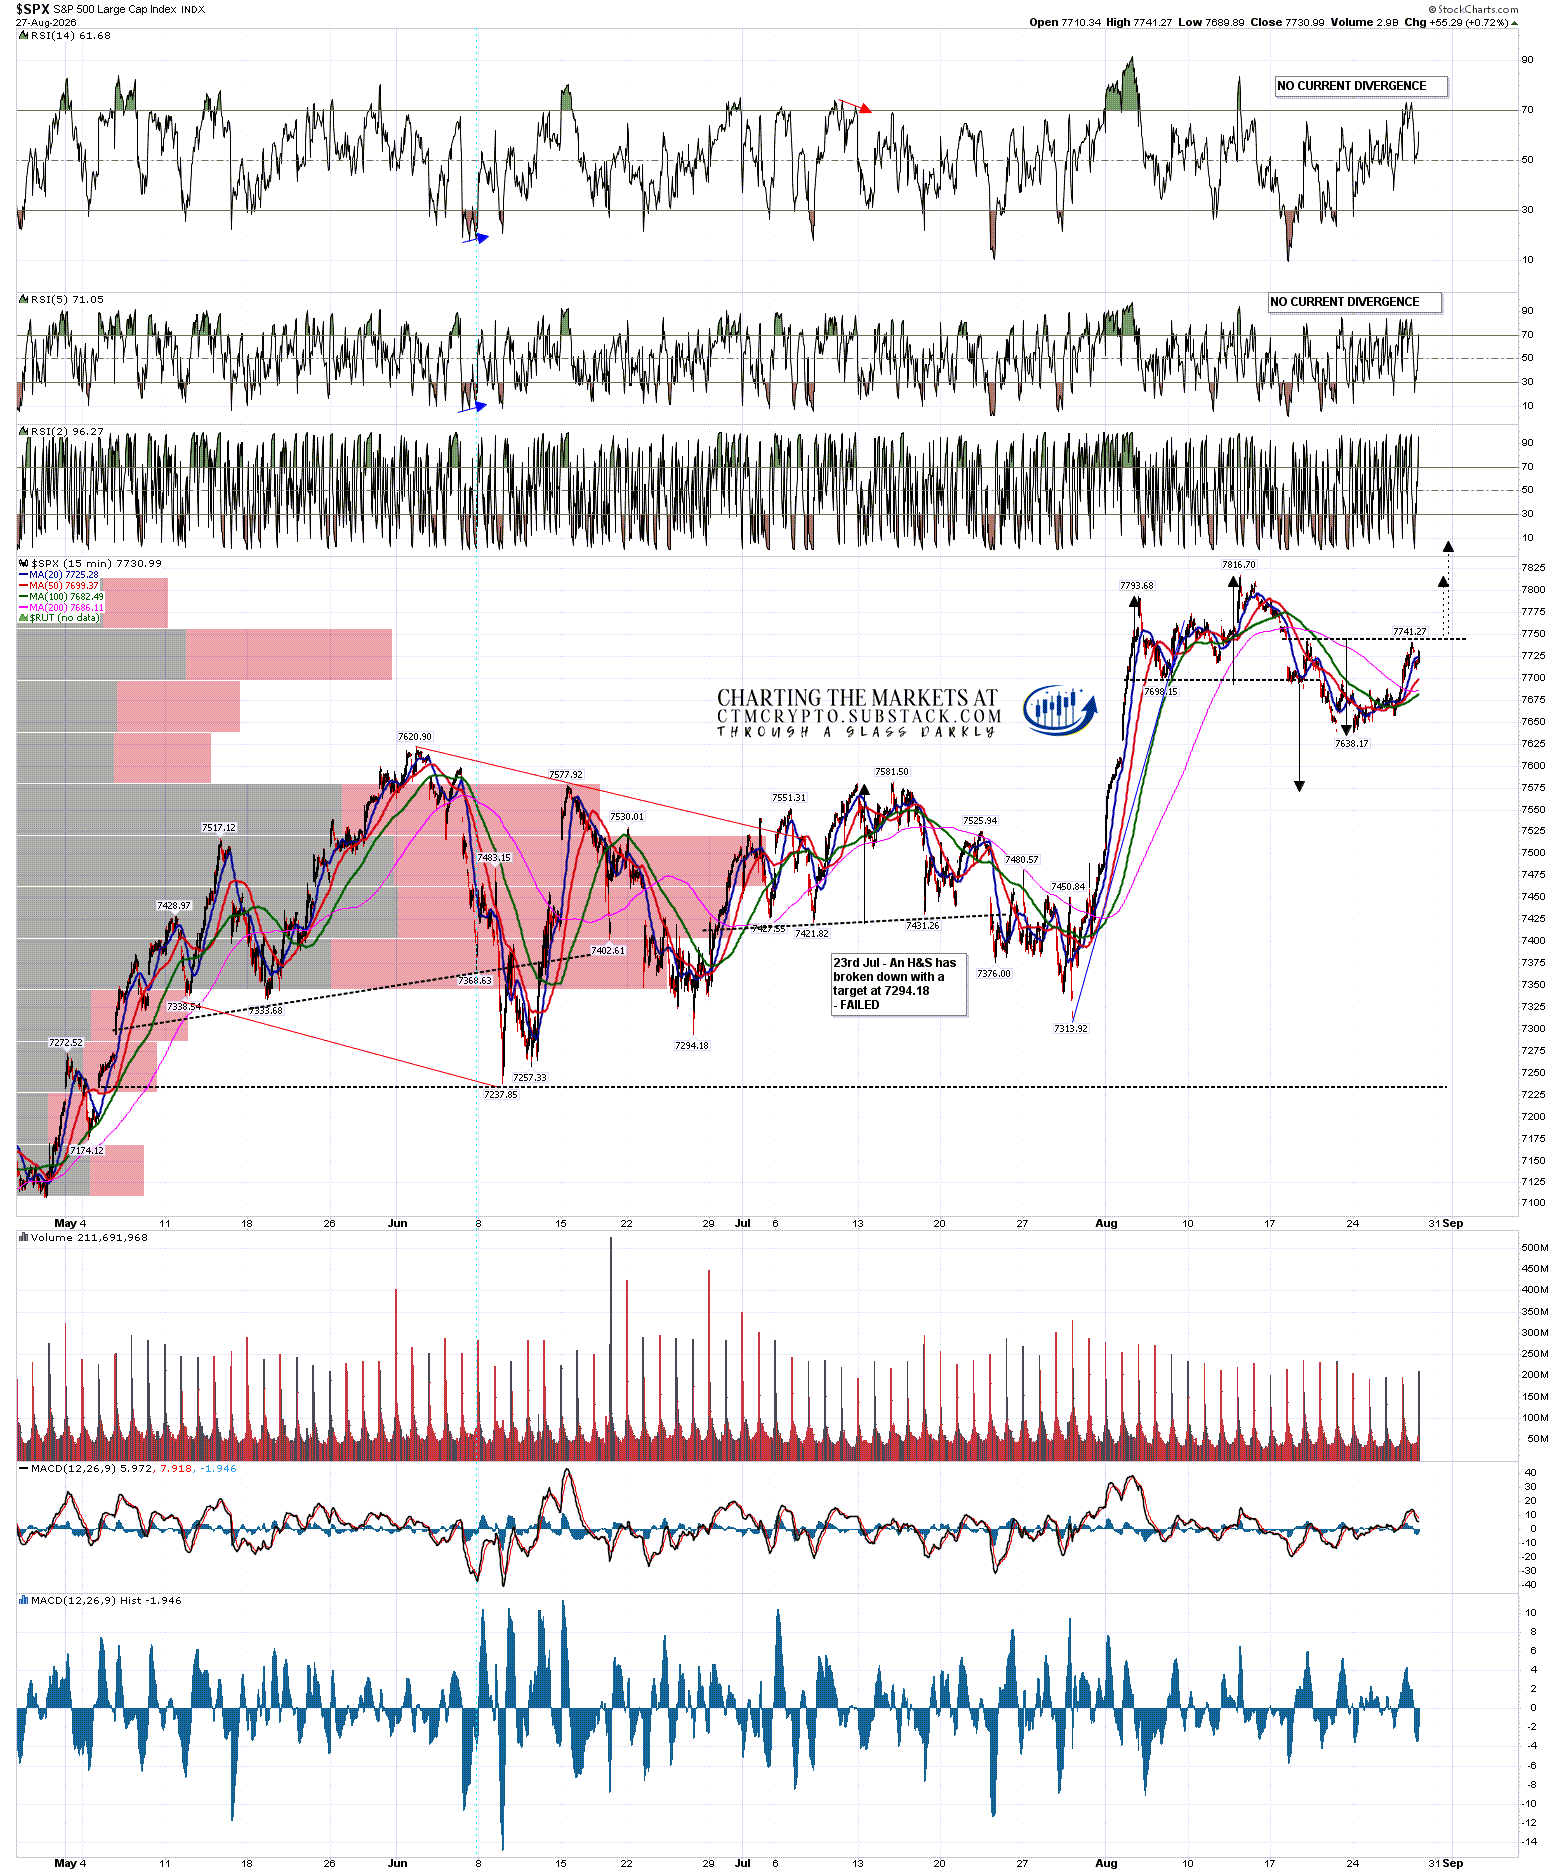
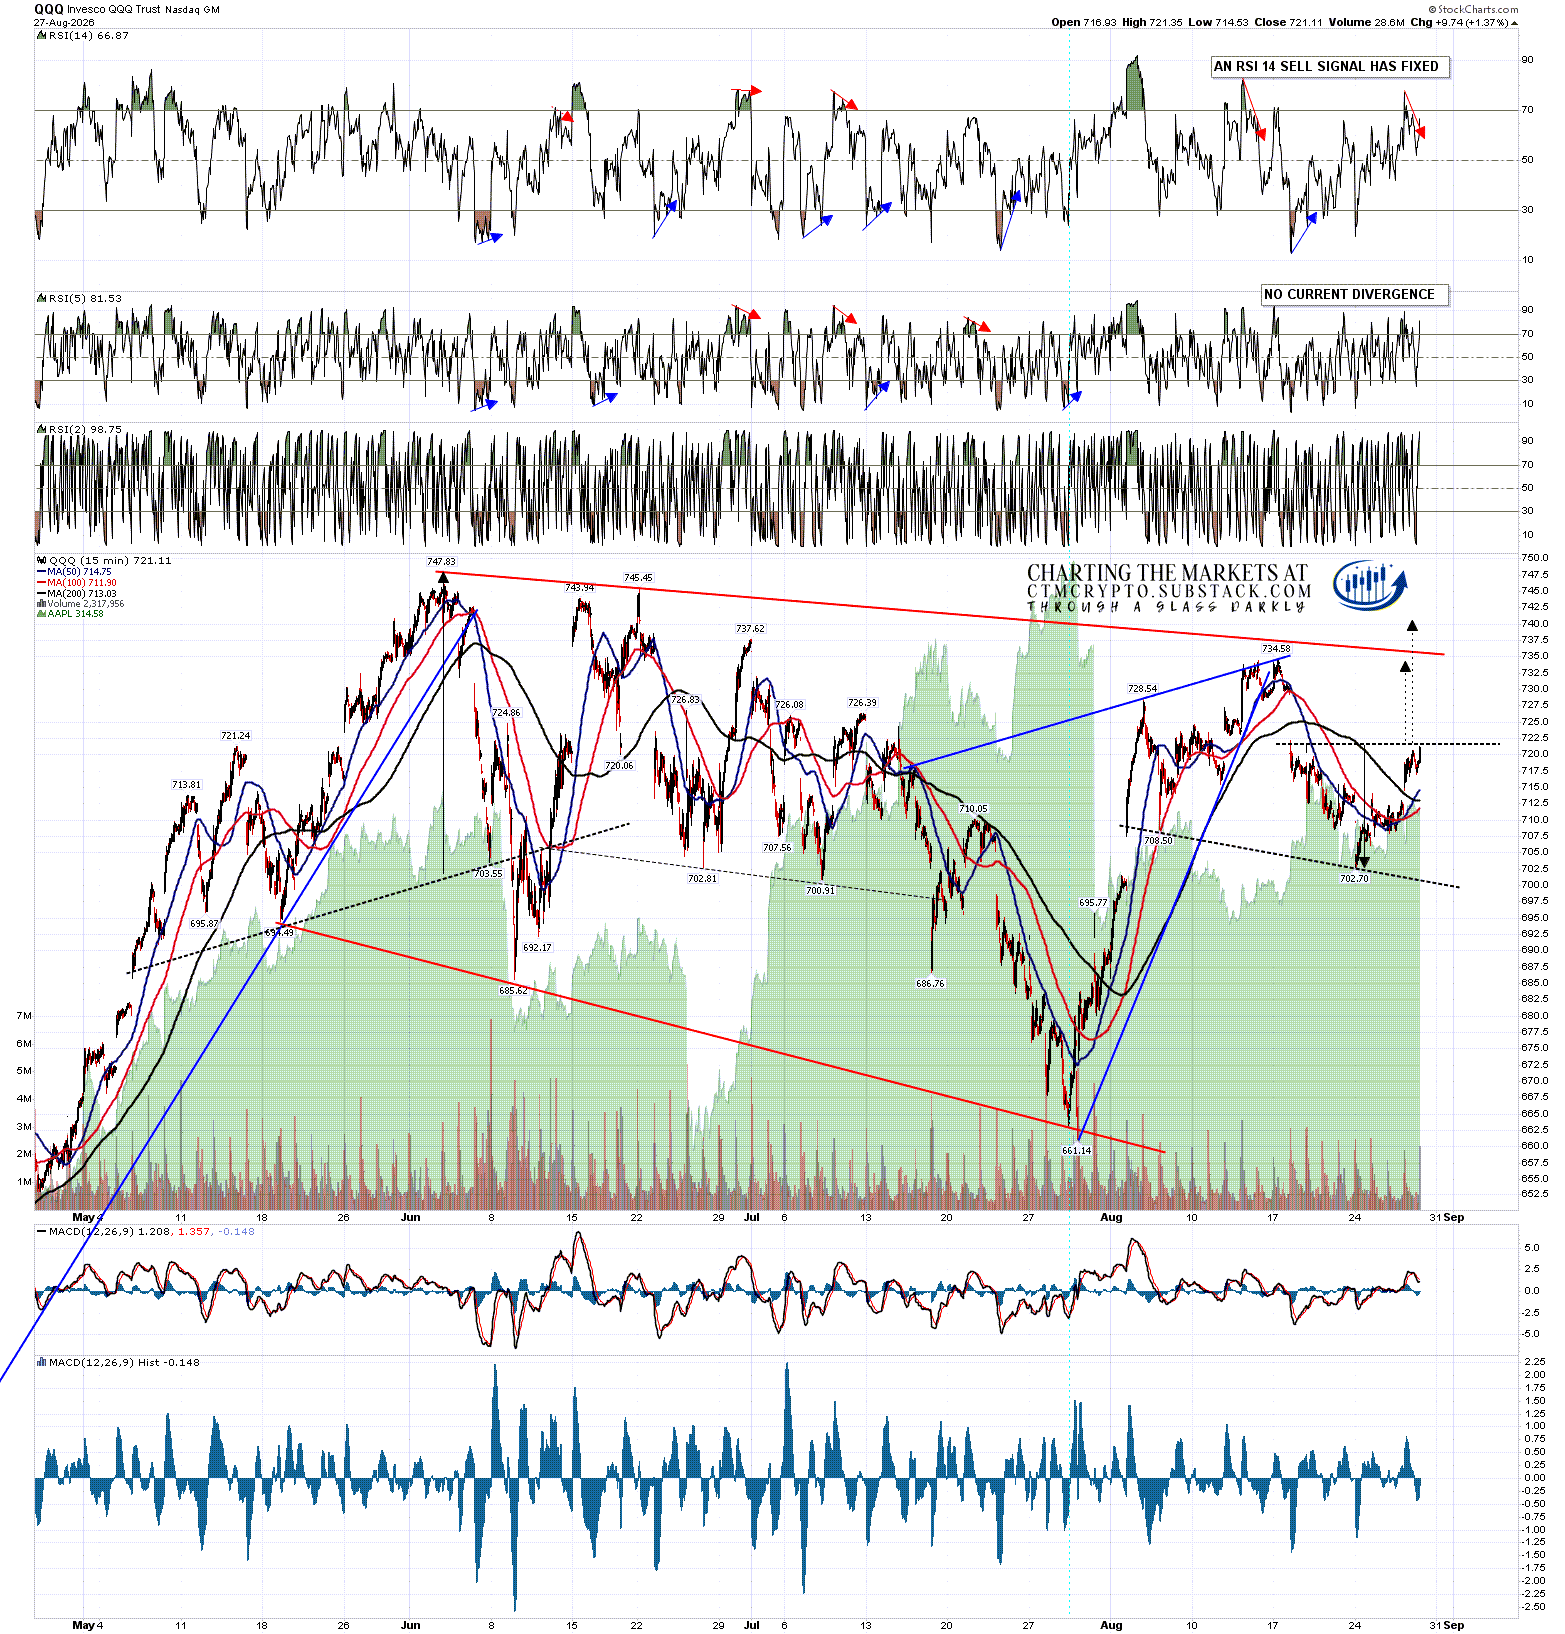
A small IHS may be forming on QQQ as well, and on a sustained break up would look for a retest of the short term high made in mid August. That pattern wouldn’t be looking for a retest of the all time high, but wouldn’t need to go a lot further to deliver that.
QQQ 15min chart:
What are my expectations of the Jackson Hole Speech? Well any talk of a cut in the Fed Funds Rate seems unlikely, as there is still a lot of upwards pressure on prices, and the new trade war with Canada and talk of increased tariffs elsewhere will definitely not be helping with that. We should really see a rise in the Fed Funds Rate, but the consensus view seems to be that Warsh will try to delay further rises until after the midterm vote on November 3rd, by which time it is possible that inflationary pressures may have moderated. If we don’t see any shift in rates then the tone of the speech today will be watched carefully. We’ll see how that goes.
I am writing a big post on the outlook for bonds that I’m planning to publish later today or over the weekend on my The Bigger Picture substack, so watch out for that.
If you like my analysis and would like to see more, please take a free subscription at my chartingthemarkets substack, where I publish these posts first. I also do a premarket video every day on equity indices, bonds, currencies, energies, precious commodities and other commodities at 8.45am EST, but only for paying subscribers. Other places to find me are my page on the platform previously known as twitter, and my YouTube channel.