
In my last post on Tuesday 4th August I was looking at the ambiguous setup on US indices and the Nikkei after the strong rally into the beginning of August, noting the three good quality topping patterns that were still intact on the Philadelphia Semiconductor Index (SOX), QQQ and Nikkei.
I also noted that SPX was close to the daily 3sd upper band and said that I was looking for a short term consolidation of a week or so to allow time for the daily middle bands to go higher, and for the daily outer bands to expand, opening up further possible upside. We have since seen that consolidation, the daily middle bands have turned up and the outer bands have expanded.
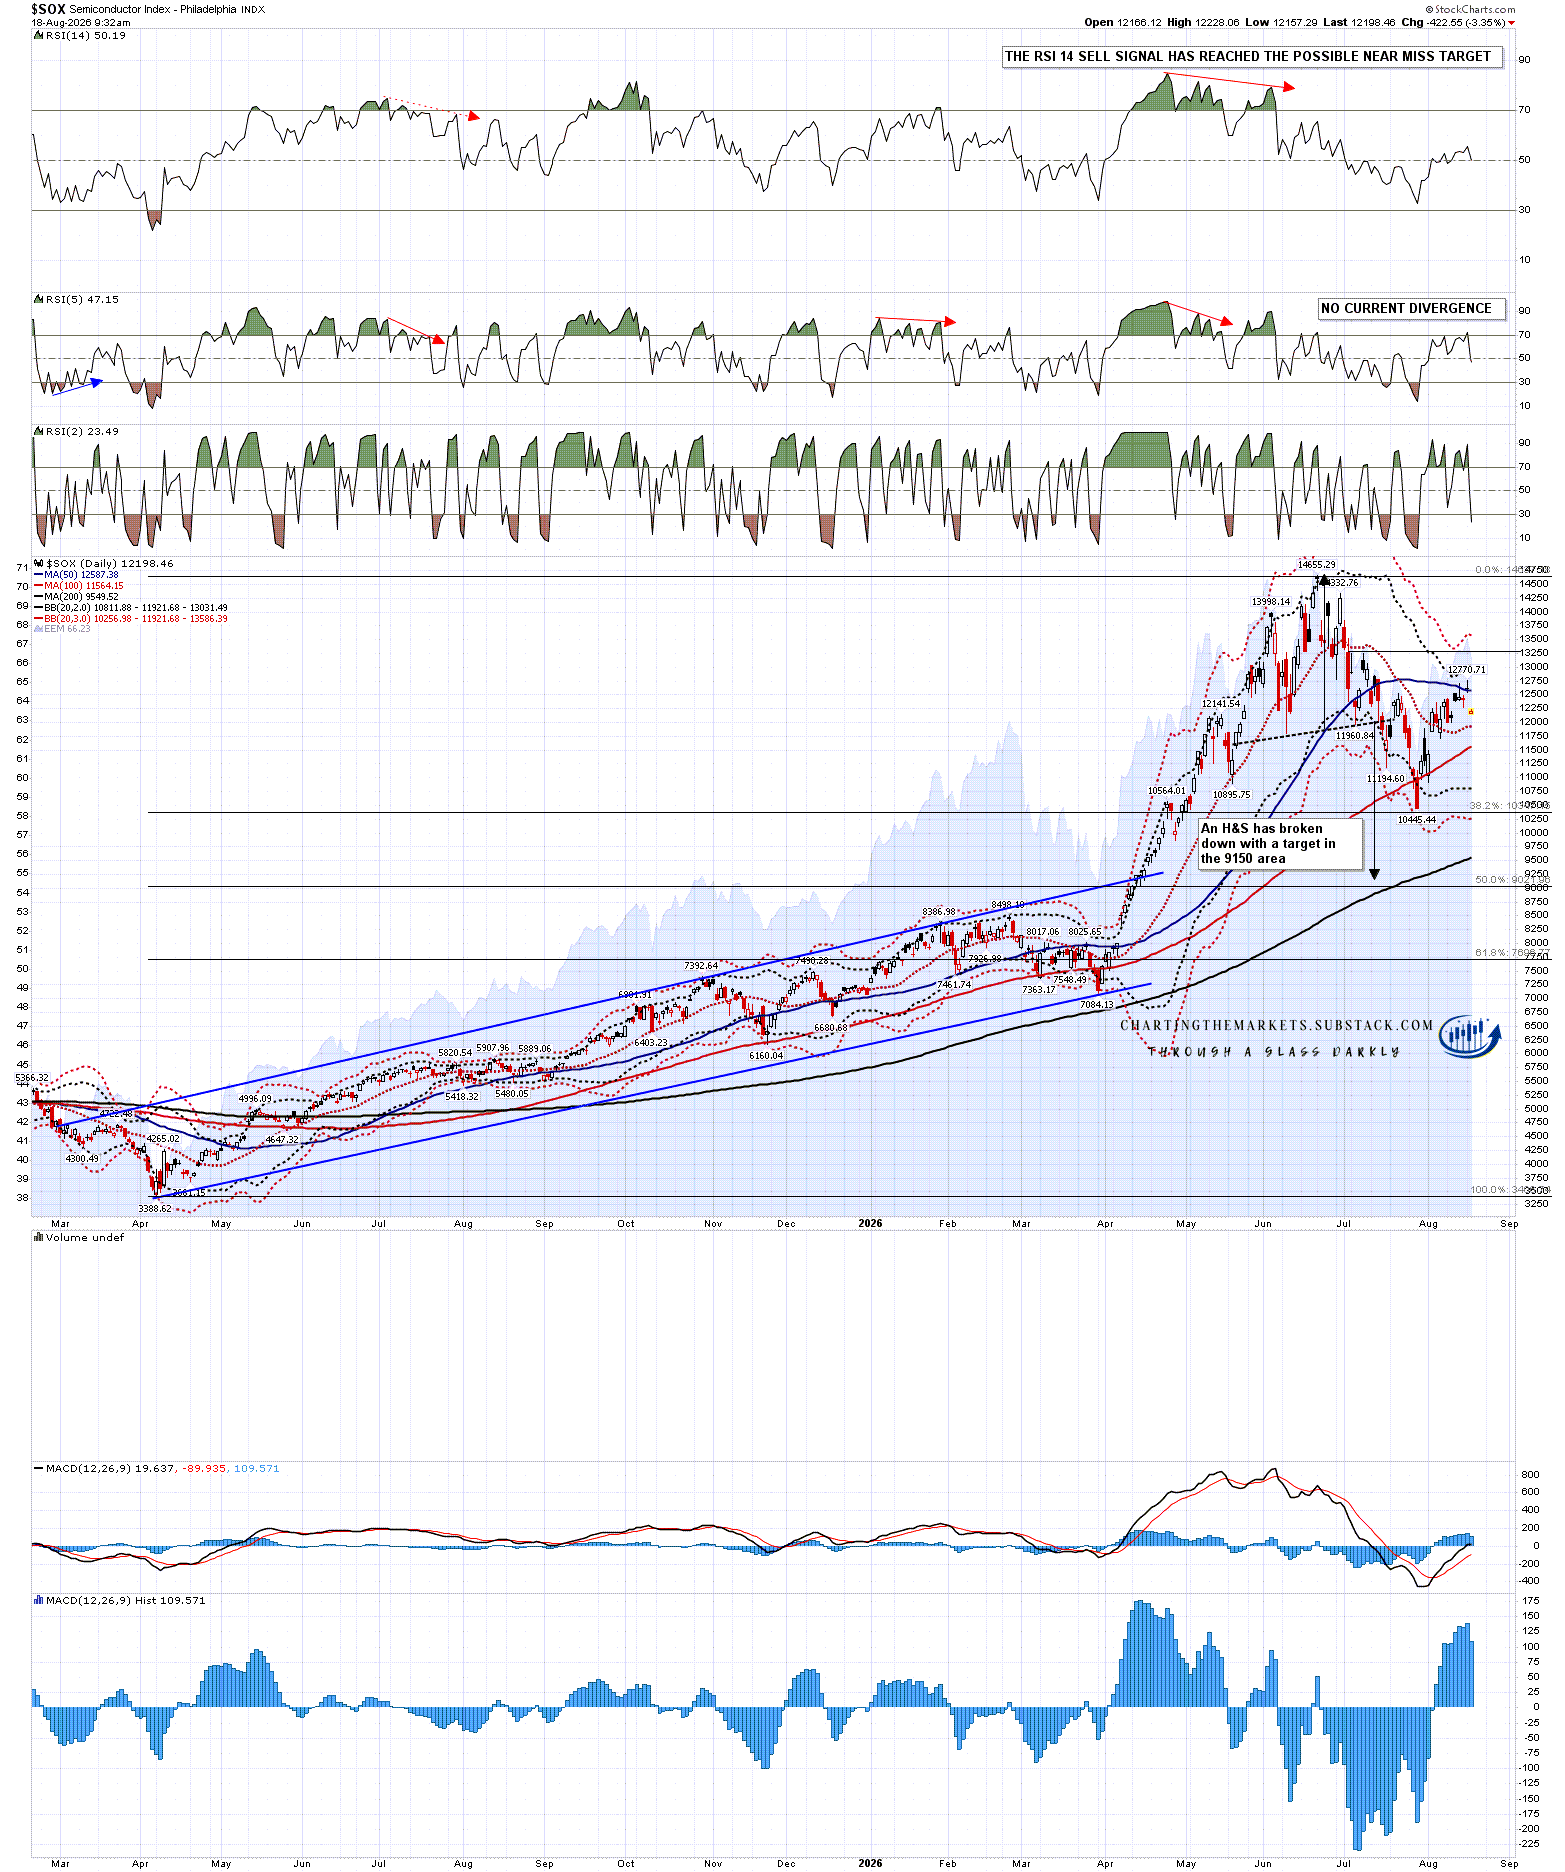
Of those three topping patterns the high quality H&S on Nikkei failed on Friday but the topping patterns on SOX and QQQ remain intact. If we are going to see US indices go higher the obvious driver for that move would be AI & Tech generally so I have been watching SOX with particular interest, and there we have seen a thorough backtest of the 50dma which has held so far. The H&S right shoulder high is at 13,249.07 and if that fails to hold as resistance the target would be an all time high retest but so far that has not been in danger of failing:
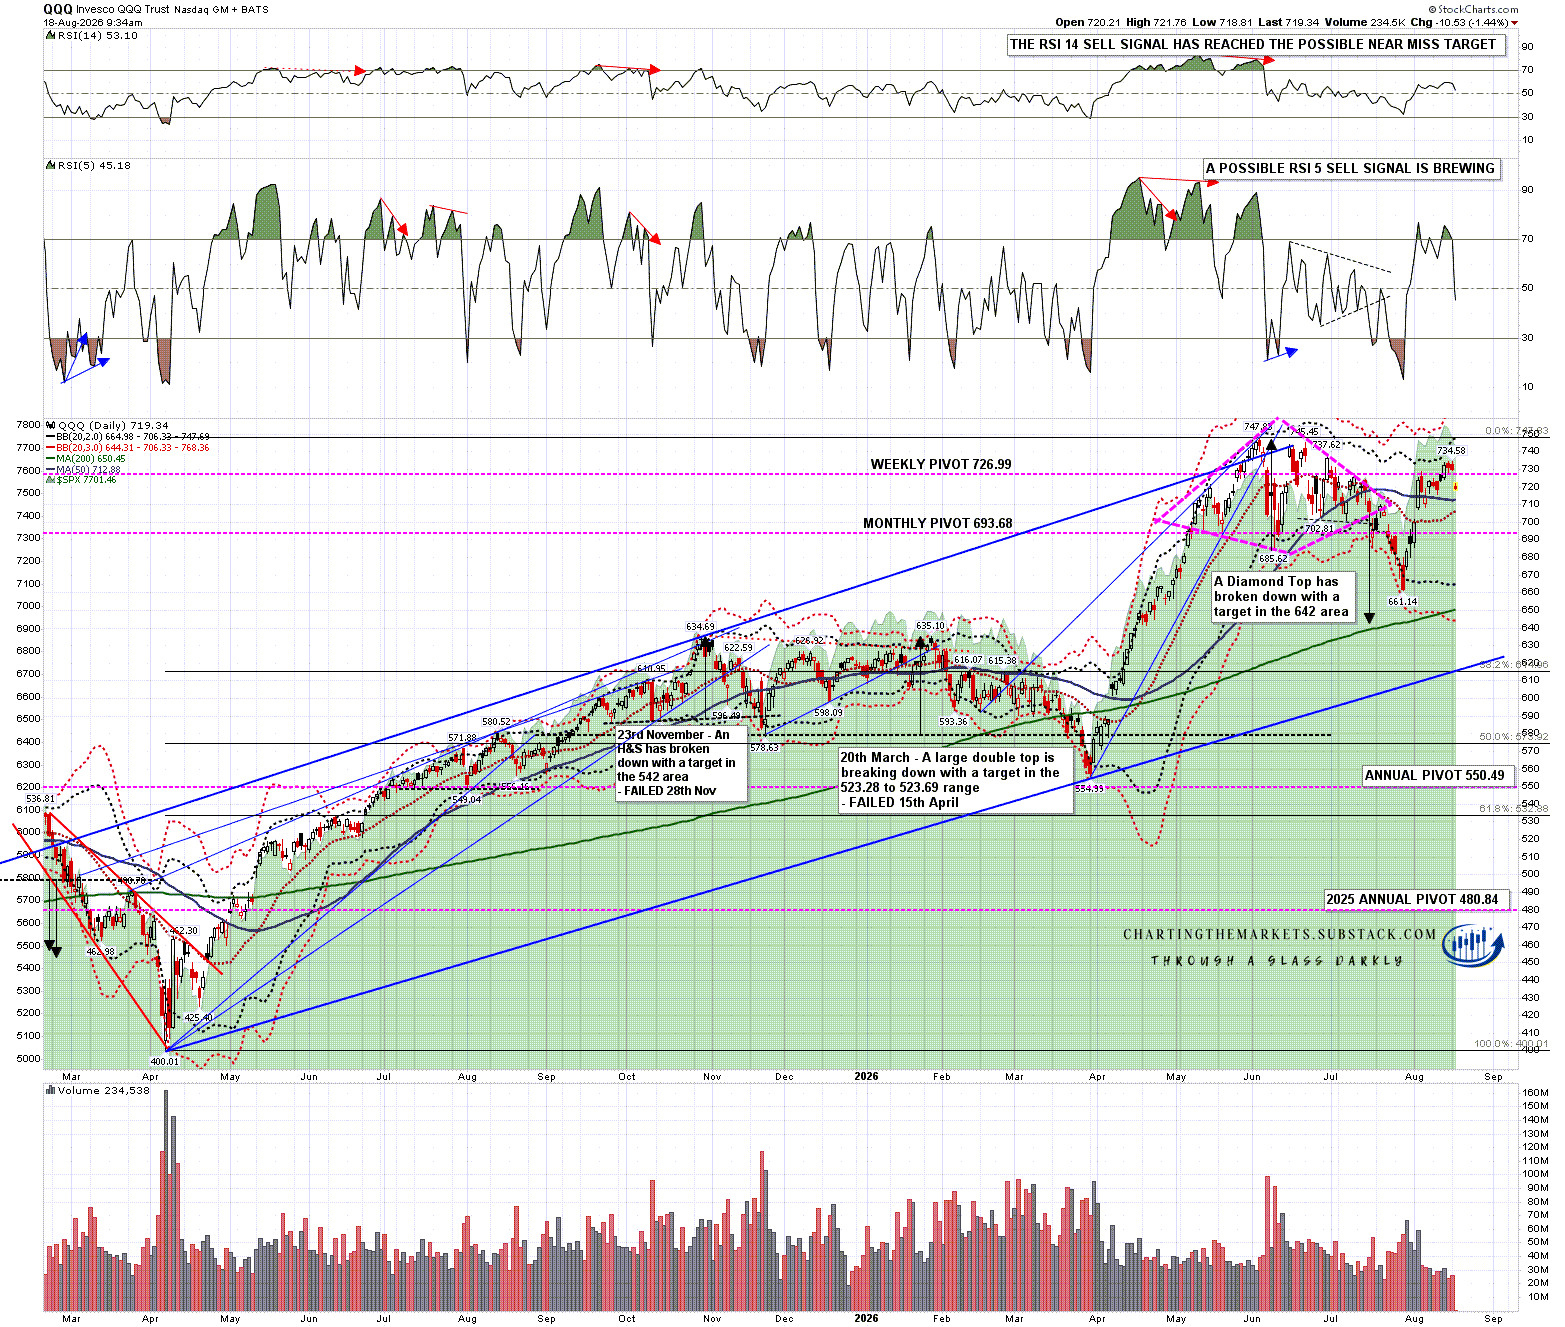
The QQQ diamond top would only fail on the retest of the all time high and has not come that close to that yet. This isn’t as important though as a retest of the all time high would initially just set up a possible alternate double top.
QQQ daily chart:
It is DIA, SPX and IWM that are particularly interesting here in terms of a possible further leg up in this seemingly endless bull market. All of these have significant and decent quality resistance trendlines from the April 2025 low that would need to be broken to open up a serious move higher.
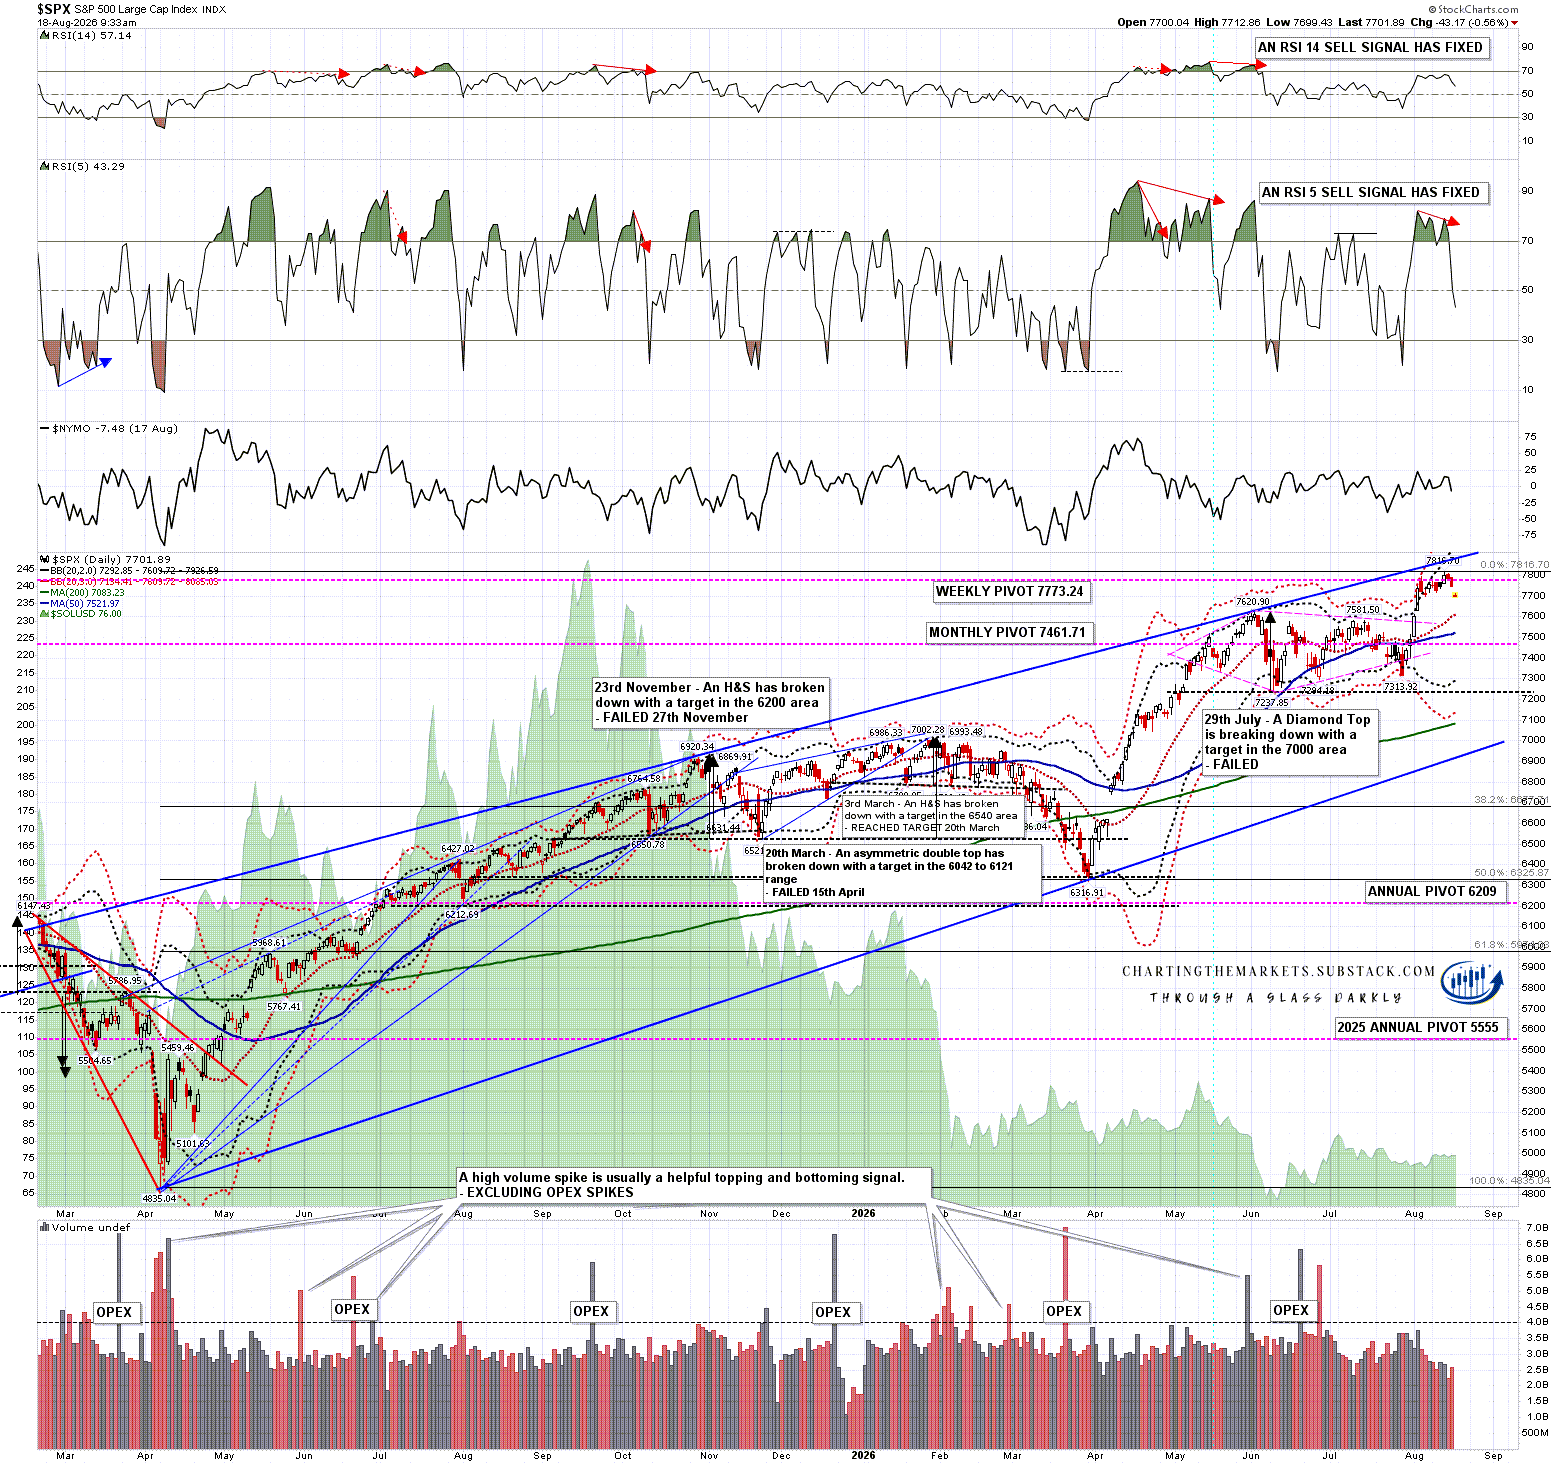
Looking at SPX I have a strong rising wedge resistance trendline currently in the 7860-70 area. If that isn’t going to break then the next obvious target within the rising wedge would be wedge support, currently in the 6930 area.
In the short term a daily RSI 5 sell signal fixed last night, I’m wondering about a possible backtest of the daily middle band currently at 7610, and a small double top is trying to break down with a target in the 7580-7603 range.
SPX daily chart:
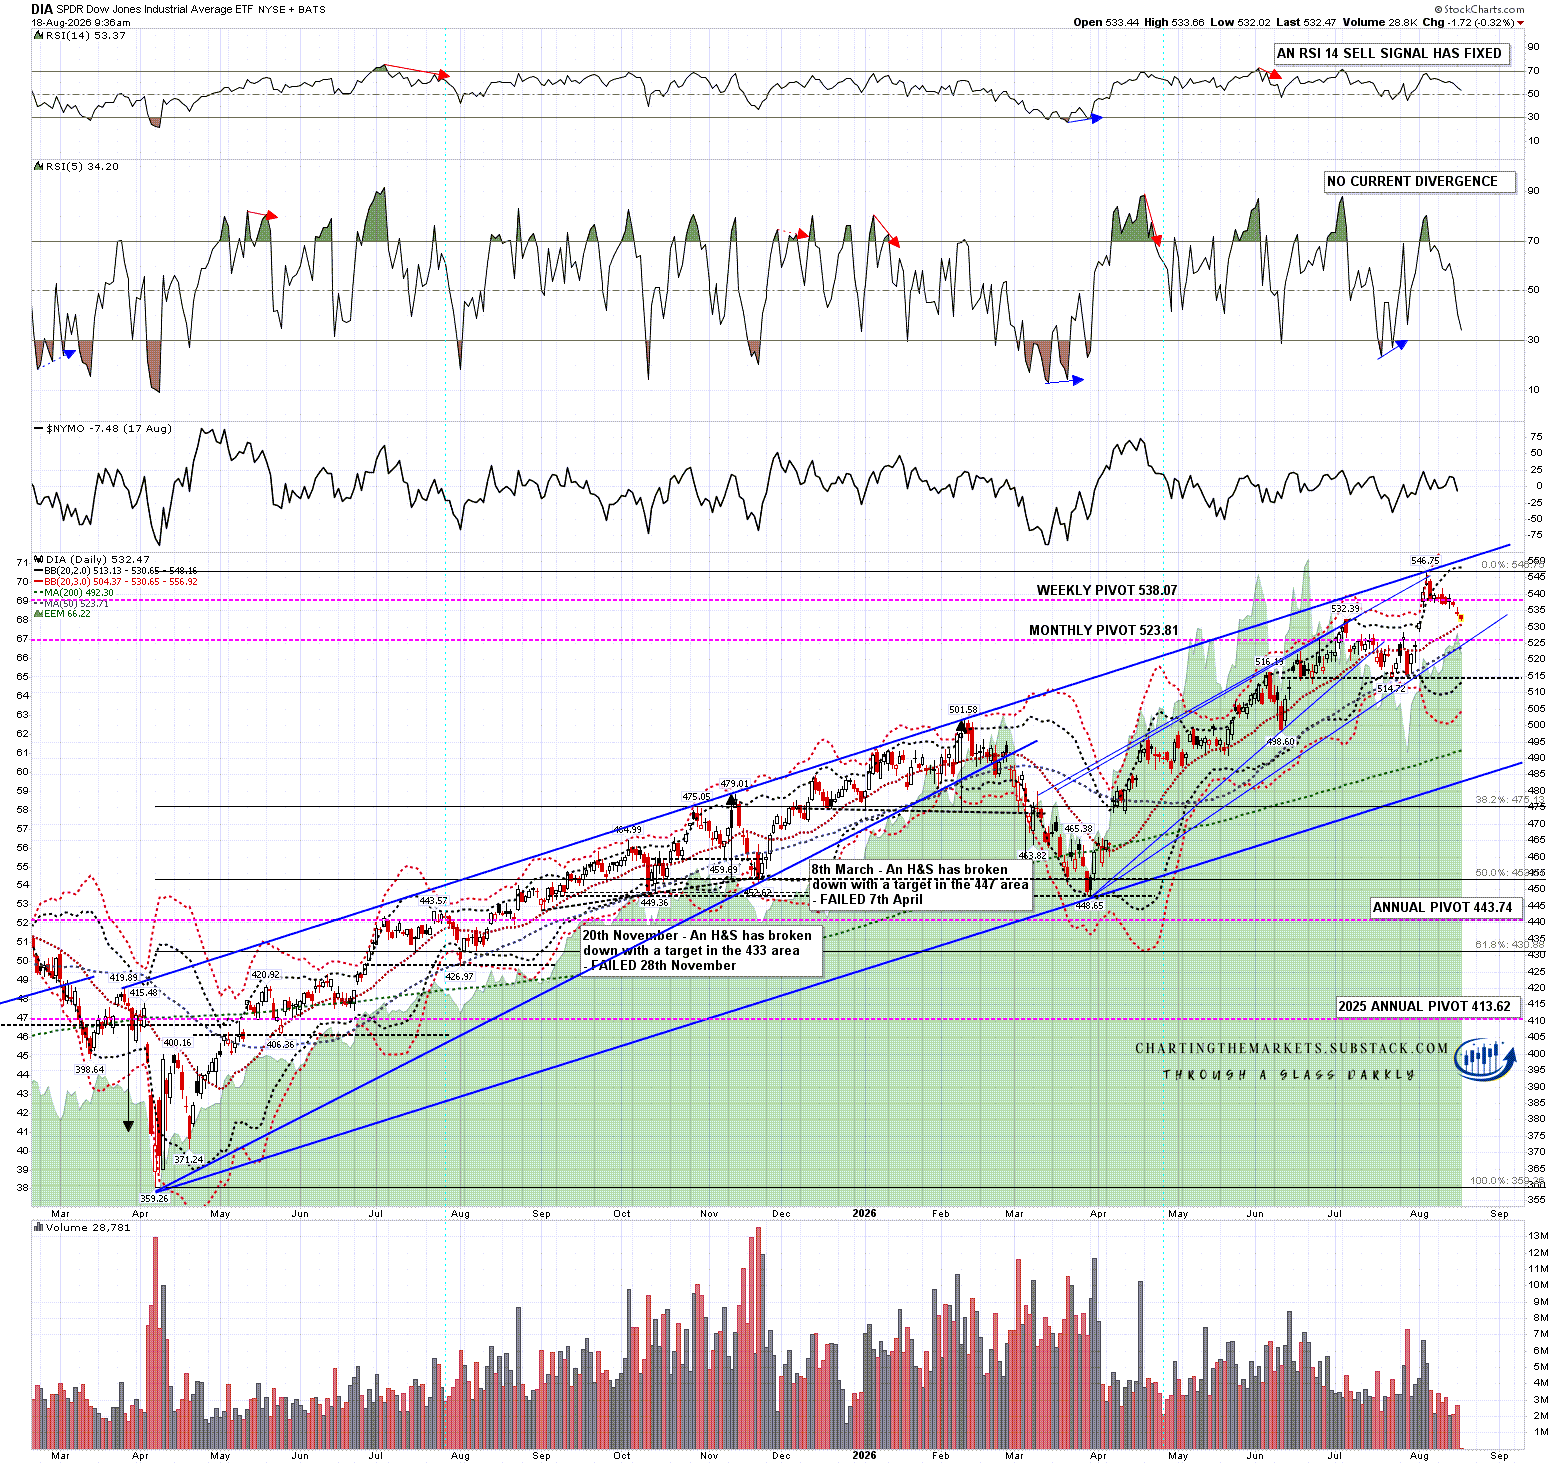
Looking at DIA I have a strong rising megaphone resistance trendline which was actually hit at the latest all time high. If that isn’t going to break then the next obvious target within the rising megaphone would be megaphone support, currently in the 483 area.
In the short term I have support at the daily middle band at 530.65, close to being backtested today, at rising support from the March low, currently at 524, and the 50dma, currently at 523.71.
DIA daily chart:
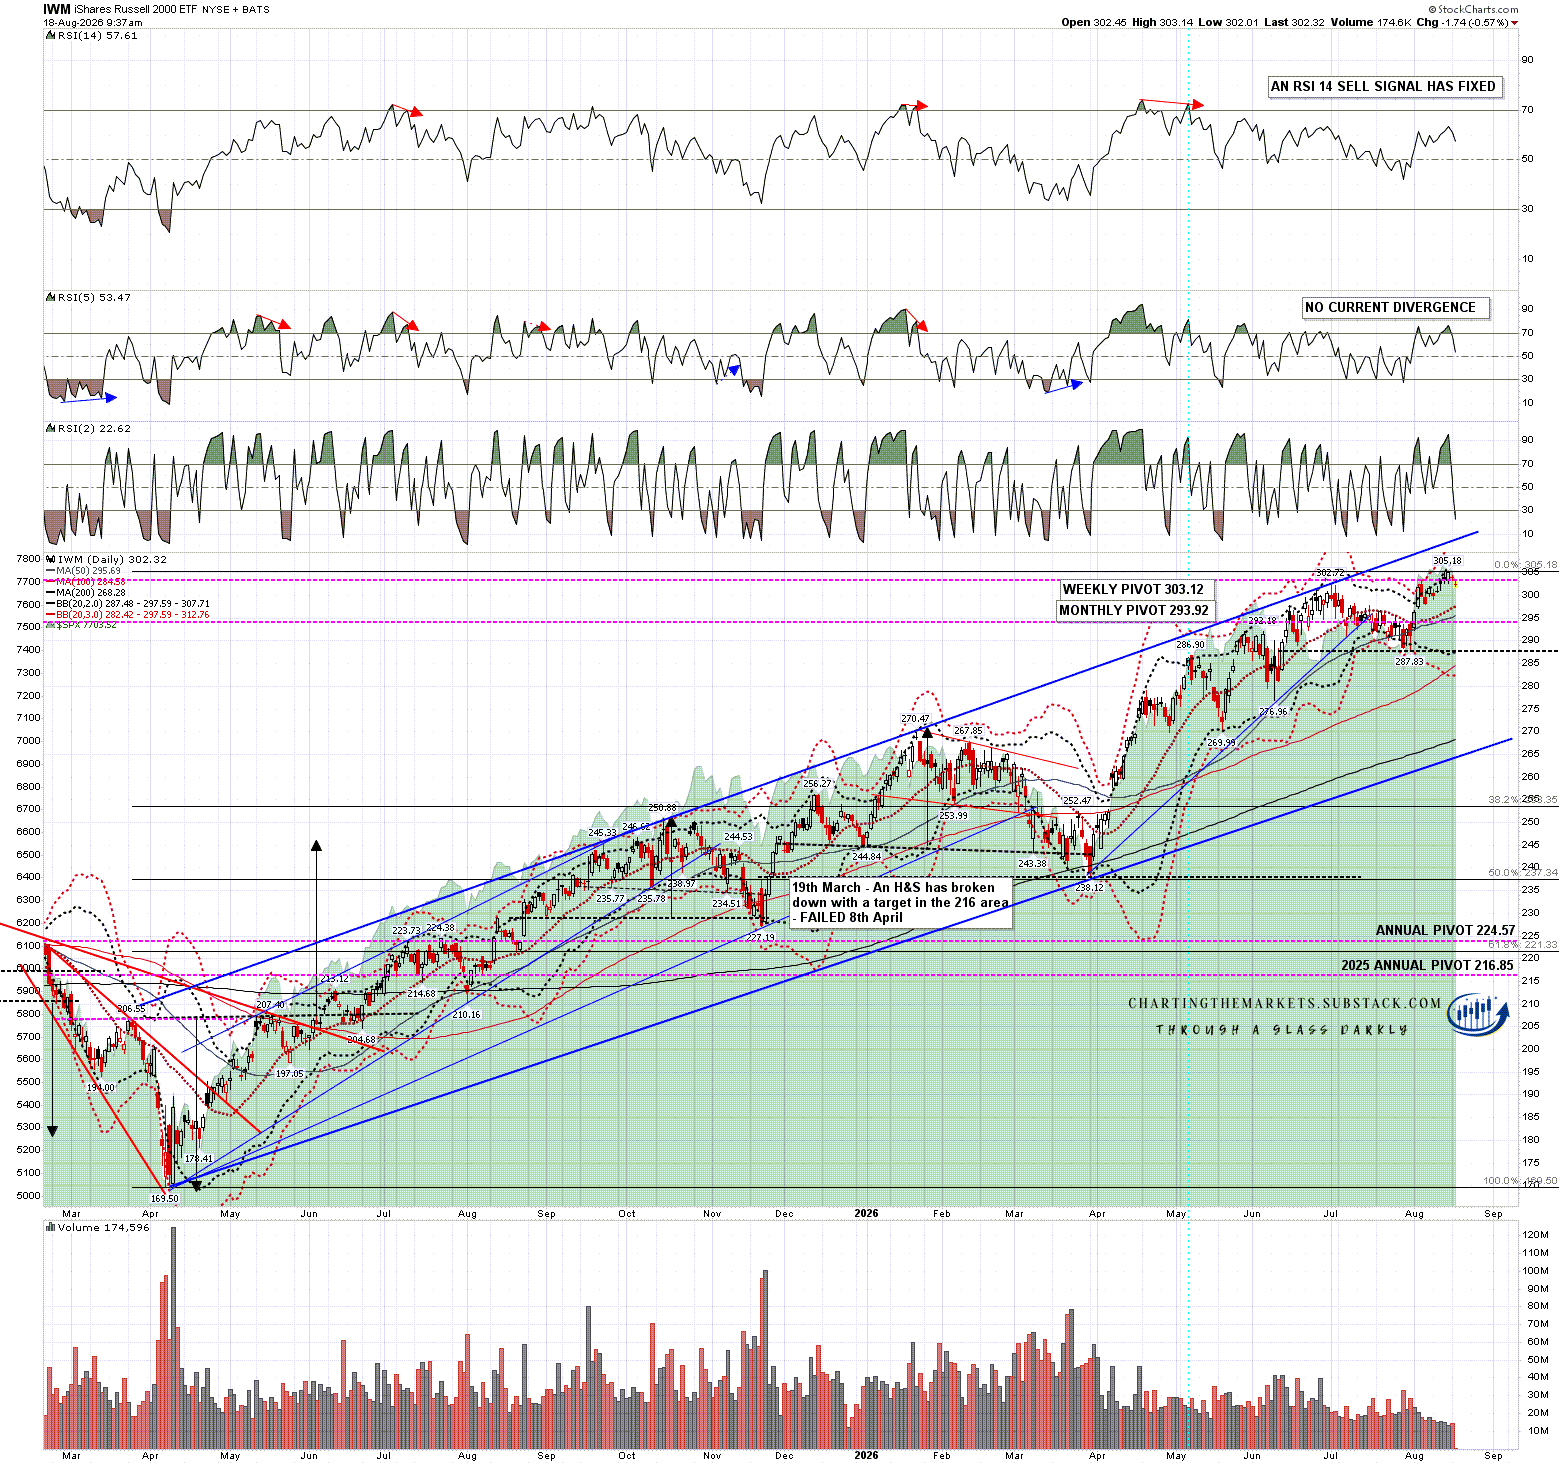
Looking at IWM I have a strong rising megaphone resistance trendline currently in the 312 area. If that isn’t going to break then the next obvious target within the rising megaphone would be megaphone support, currently in the 264 area.
In the short term I’m wondering about a possible backtest of the daily middle band currently at 297-8, and a possible double top has formed with support at 287.83 and, in the event that double top breaks down, a target in the 270.5 to 273 area.
IWM daily chart:
I remain skeptical about another big move up on equities here as Tech has been faltering in recent months for very good reasons, and there are strong and well established resistance trendlines above on all of SPX, DIA & IWM. If we do see that move it would likely be because we were seeing another big leg up on Tech that would drag the other indices higher.
If we are to see that big leg up on Tech, the first real confirmation would be a failure of the H&S on SOX with a move over 13,249.07. That would open a retest of the all time high at 14,655.29, setting up a possible larger double top and another inflection point. If we were to see a strong break up from there then that would likely break all my other resistance trendlines with confidence.
Until we see that, SOX is still pointing firmly down and in the short term there is a decent case that more downside is coming across the board. If we see the US indices go lower I’ll be watching the 7580 to 7620 area on SPX as the next obvious strong support level.
If you like my analysis and would like to see more, please take a free subscription at my chartingthemarkets substack, where I publish these posts first. I also do a premarket video every day on equity indices, bonds, currencies, energies, precious commodities and other commodities at 8.45am EST, but only for paying subscribers. Other places to find me are my page on the platform previously known as twitter, and my YouTube channel.


No comments:
Post a Comment