
In my last post on Friday 4th September and my previous post on Wednesday 2nd September I was looking at the case that the current retracement has been a bullish consolidation that would likely be followed by retests of the all time highs on some or all of SPX, QQQ, DIA and IWM.
To a significant degree I’m looking for high retests for purely technical reasons, because there isn’t much here in the way of topping patterns that have formed, so I’d like to see some high retests to set up double tops, but there are also H&S options that might form after a significant further decline from here.
In terms of the technical setup for high retests from here the setups are decent, but the main problem has been the steady stream of bad news, which got a lot worse last week. That is increasing the possibility that we might see a break down directly from here.
So what’s the bad news? Well the first part is the worsening inflation picture, mainly due to the Iran War. The Producer Price Index inflation numbers last week were bad, and the CPI numbers this week will most likely be bad too. The odds I’m seeing for a rate rise of 0.25% at FOMC on Wednesday are currently at 86% on Kalshi. 30 year treasury yields have now risen from a low at 39.06 (3.906%) in September 2024 to a high so far this month at 54.24 (5.424%), while over the same period the Fed Funds rate has been cut by 1.25%.
The other bad news was from the Iran War, where the Strait of Hormuz has been relatively quiet, but the civil war in Yemen has started moving very fast. Last week the Houthi rebels took the entire Yemen Red Sea coastline from the Saudi-backed government forces, capturing a fortune in weapons and war materiel and taking full control of the Bab al-Mandeb Strait, which is the main way the Saudis have been bypassing the Strait of Hormuz to export their oil.
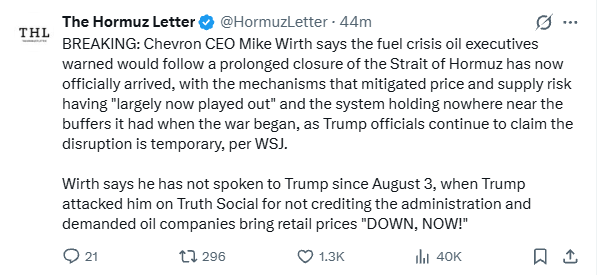
Just to make the Saudi exclusion from the Red Sea all the more complete their seven million bpd East-West oil pipeline to the Red Sea was bombed last week and badly damaged. It has closed down for at least a month. Saudi oil exports have likely now been cut by at least four million bpd which will exacerbate existing shortfalls which, as you can see from this statement from Chevron CEO Mike Wirth that I saw tonight, were already very serious:
It looks possible that the Houthis may control the rest of Sudan within days which would be a further big victory for Iran-aligned forces in the Middle East, and may well result in further damage to Saudi oil facilities.
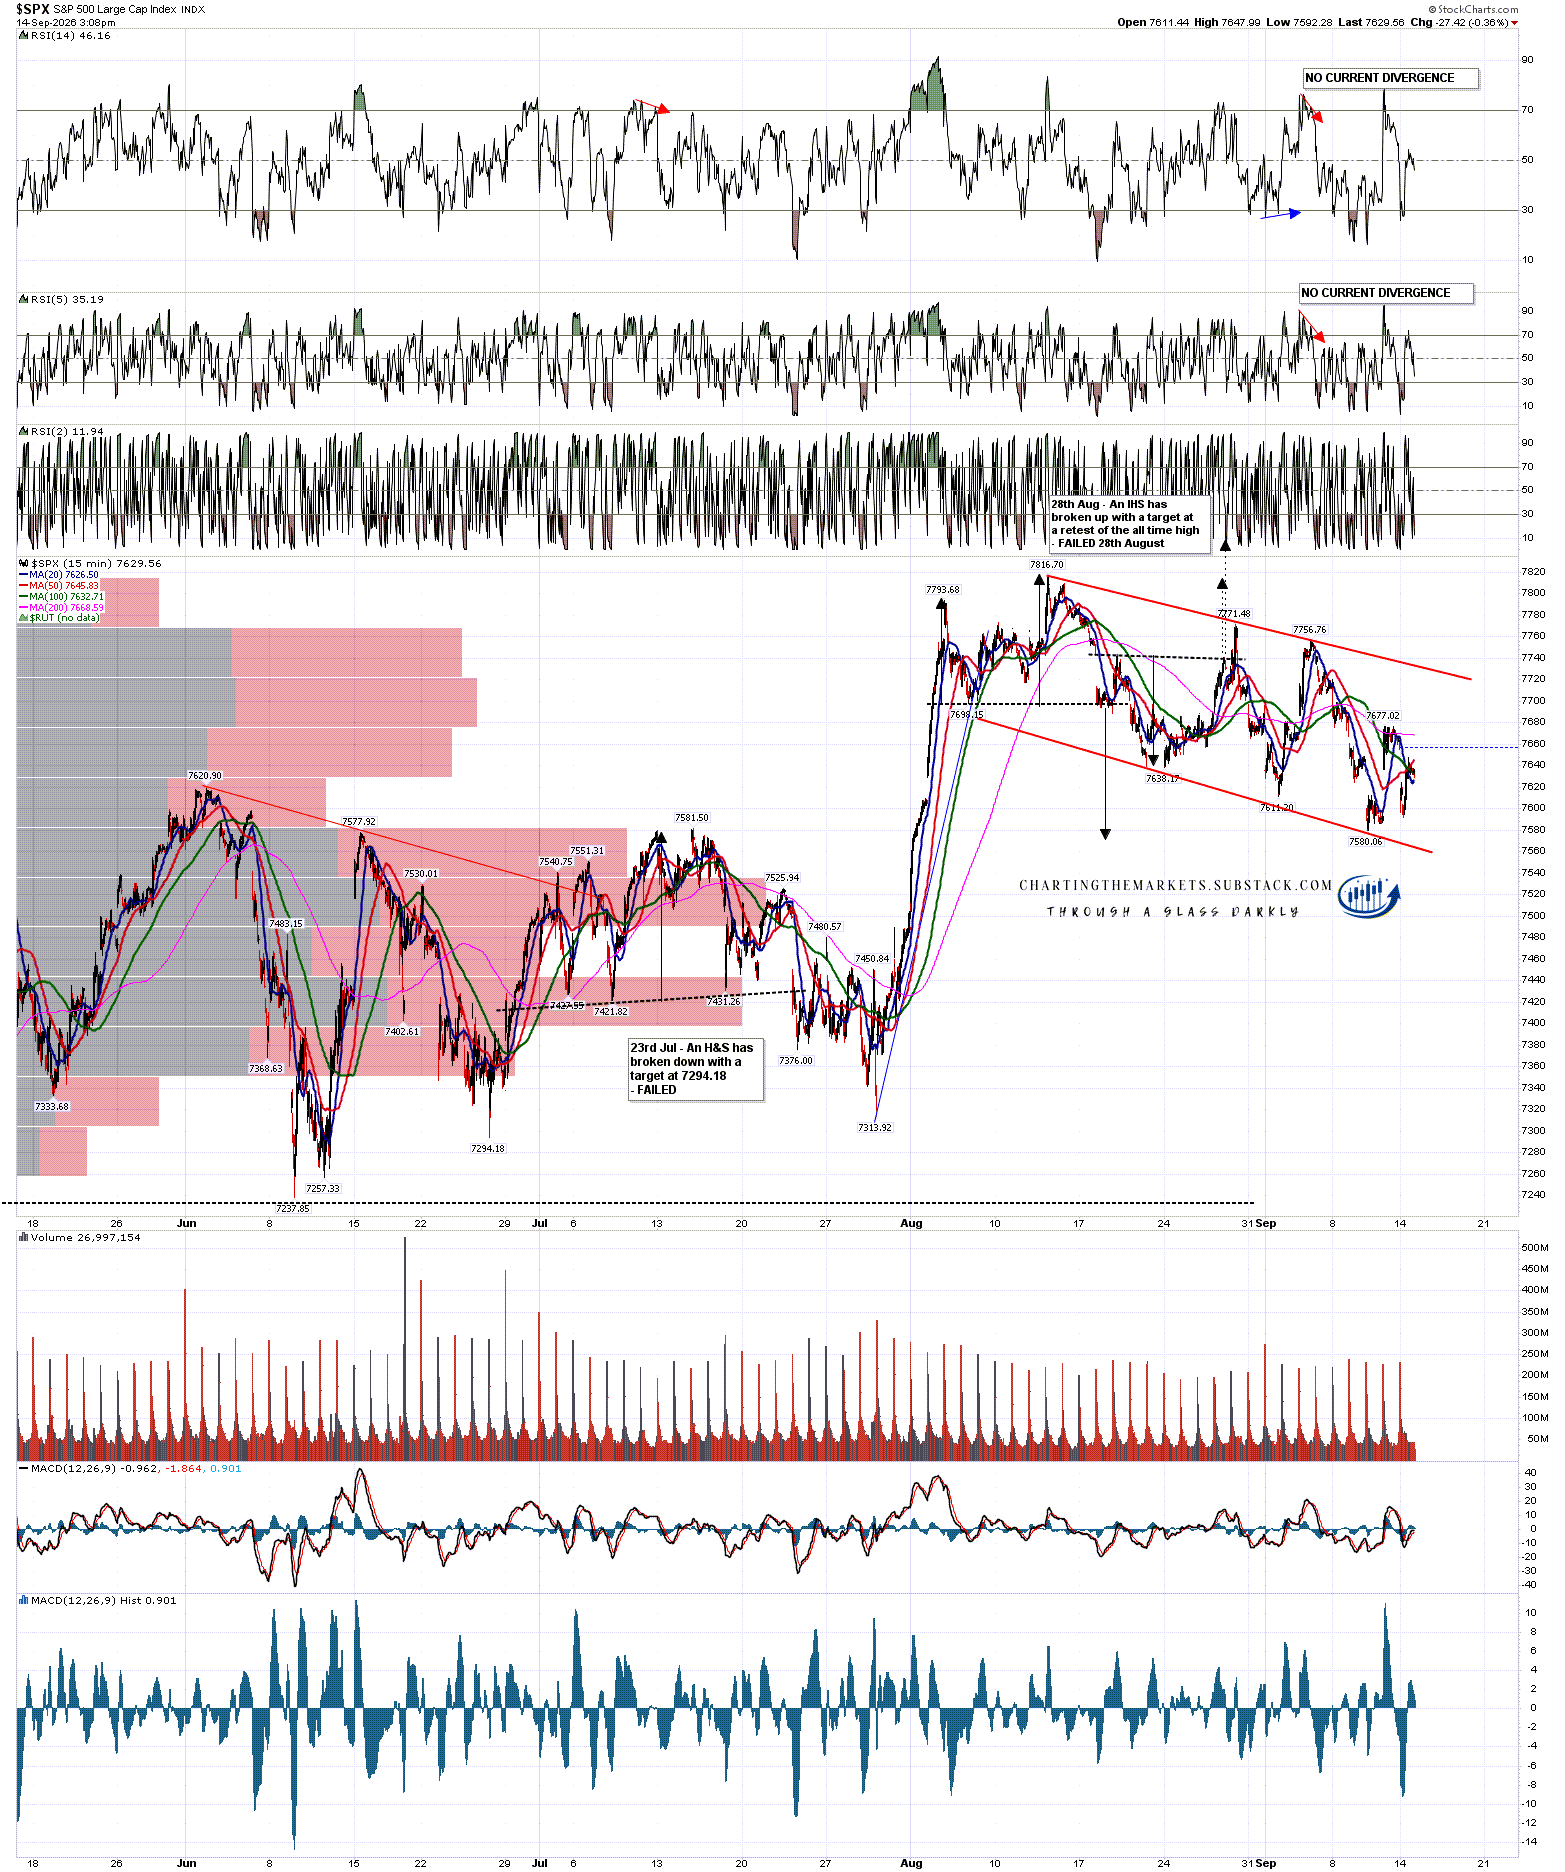
All that said I still have a couple of very nice looking bull flags, which haven’t failed down yet. The first is on SPX with a very decent looking falling megaphone bear flag.
SPX 15min chart:
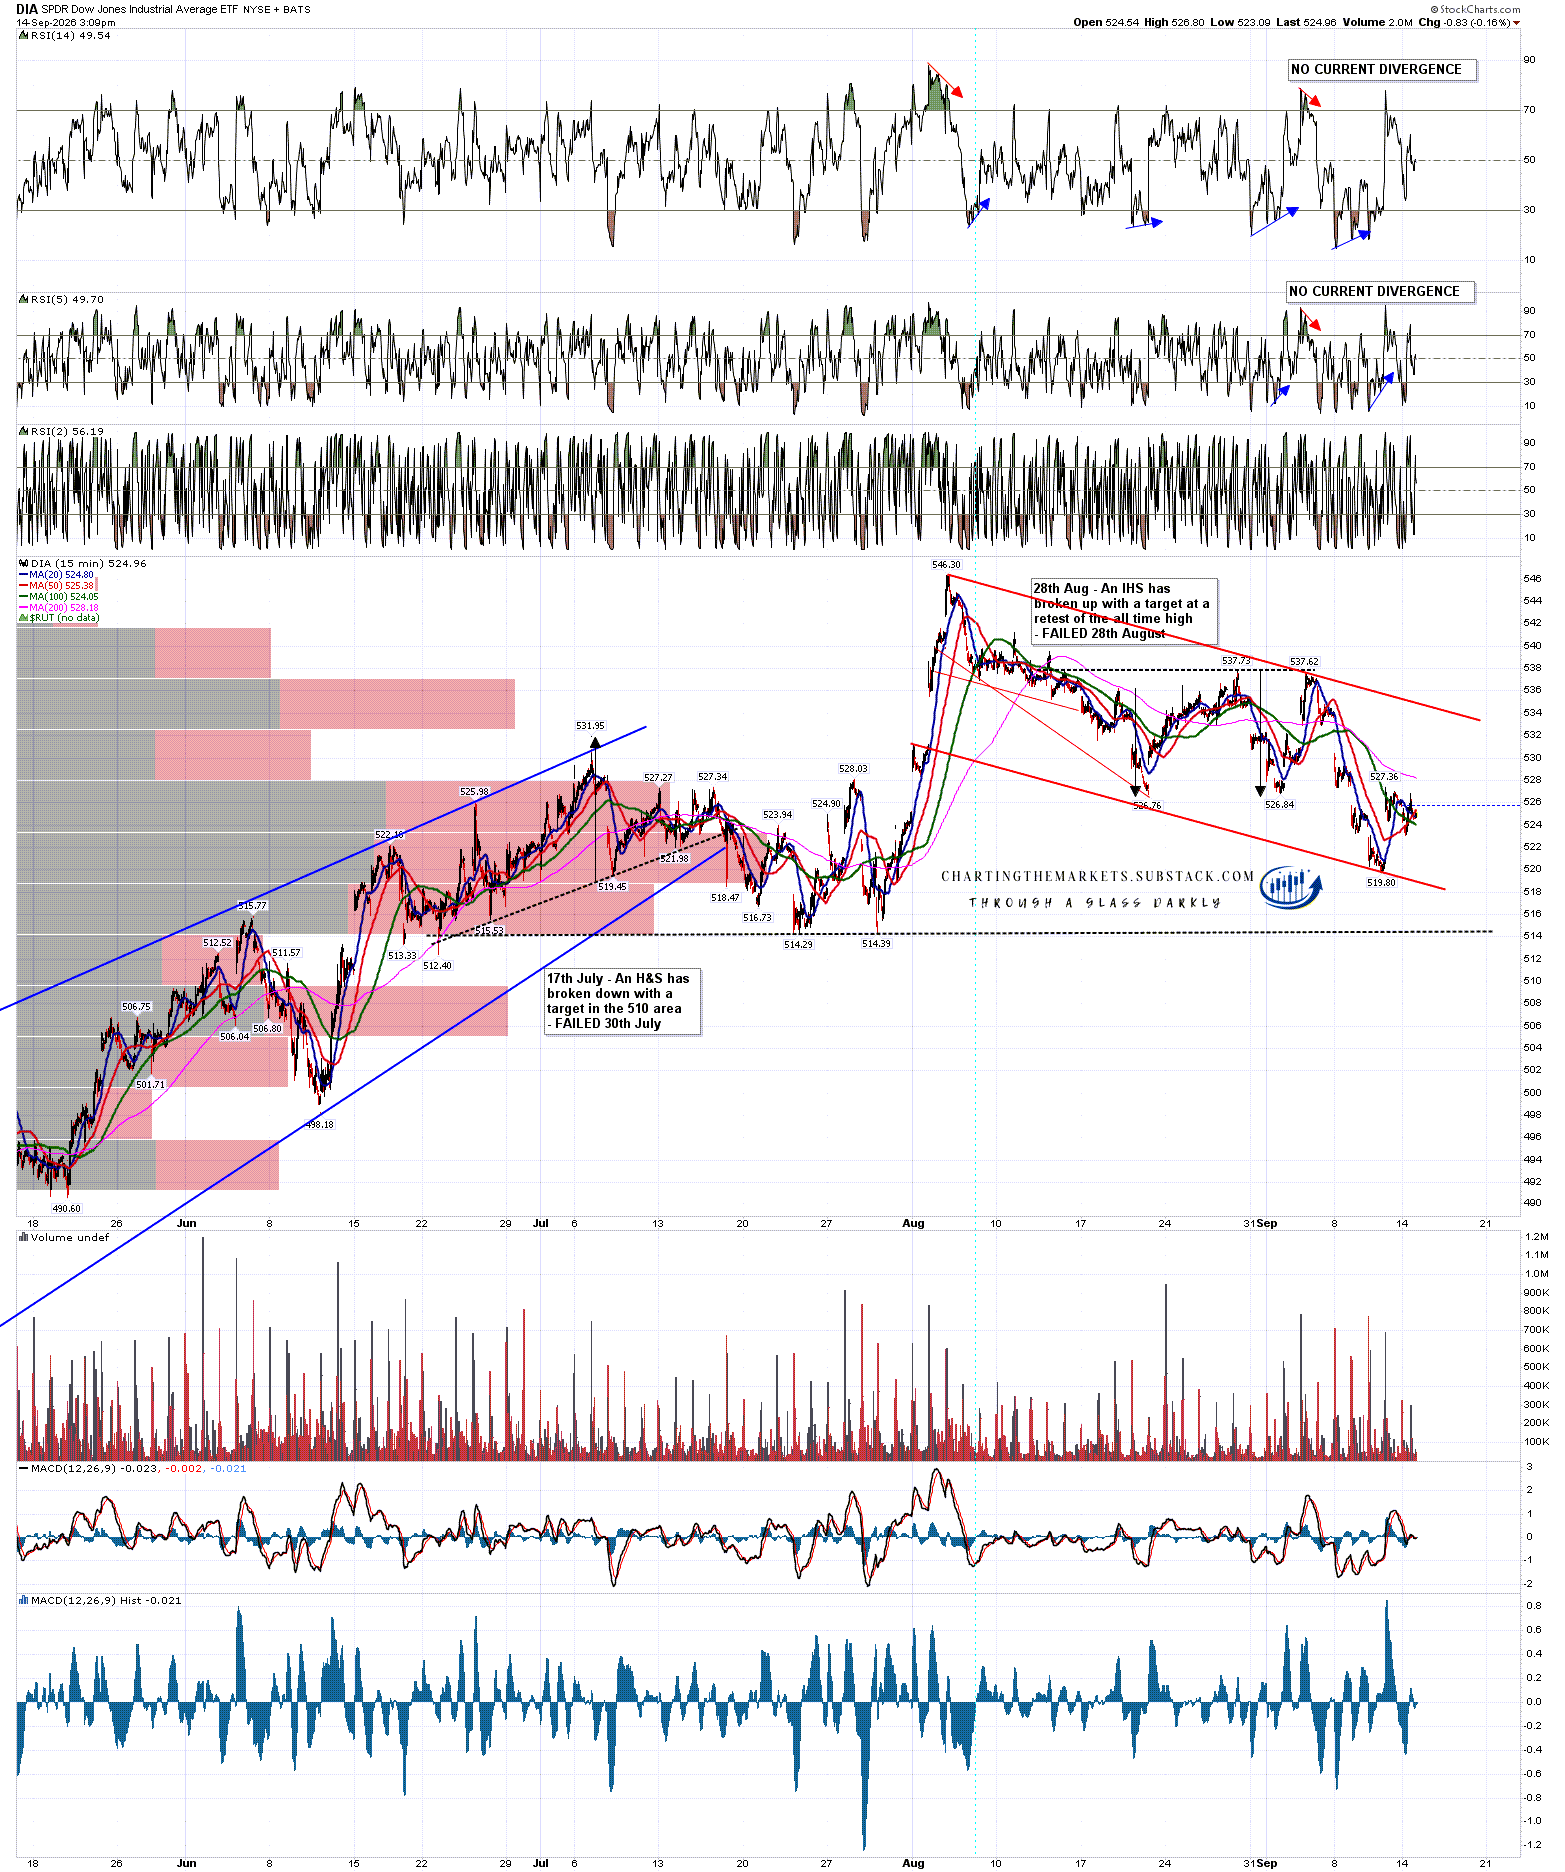
The bull flag on DIA is even nicer, with a perfect bull flag channel.
DIA 15min chart:
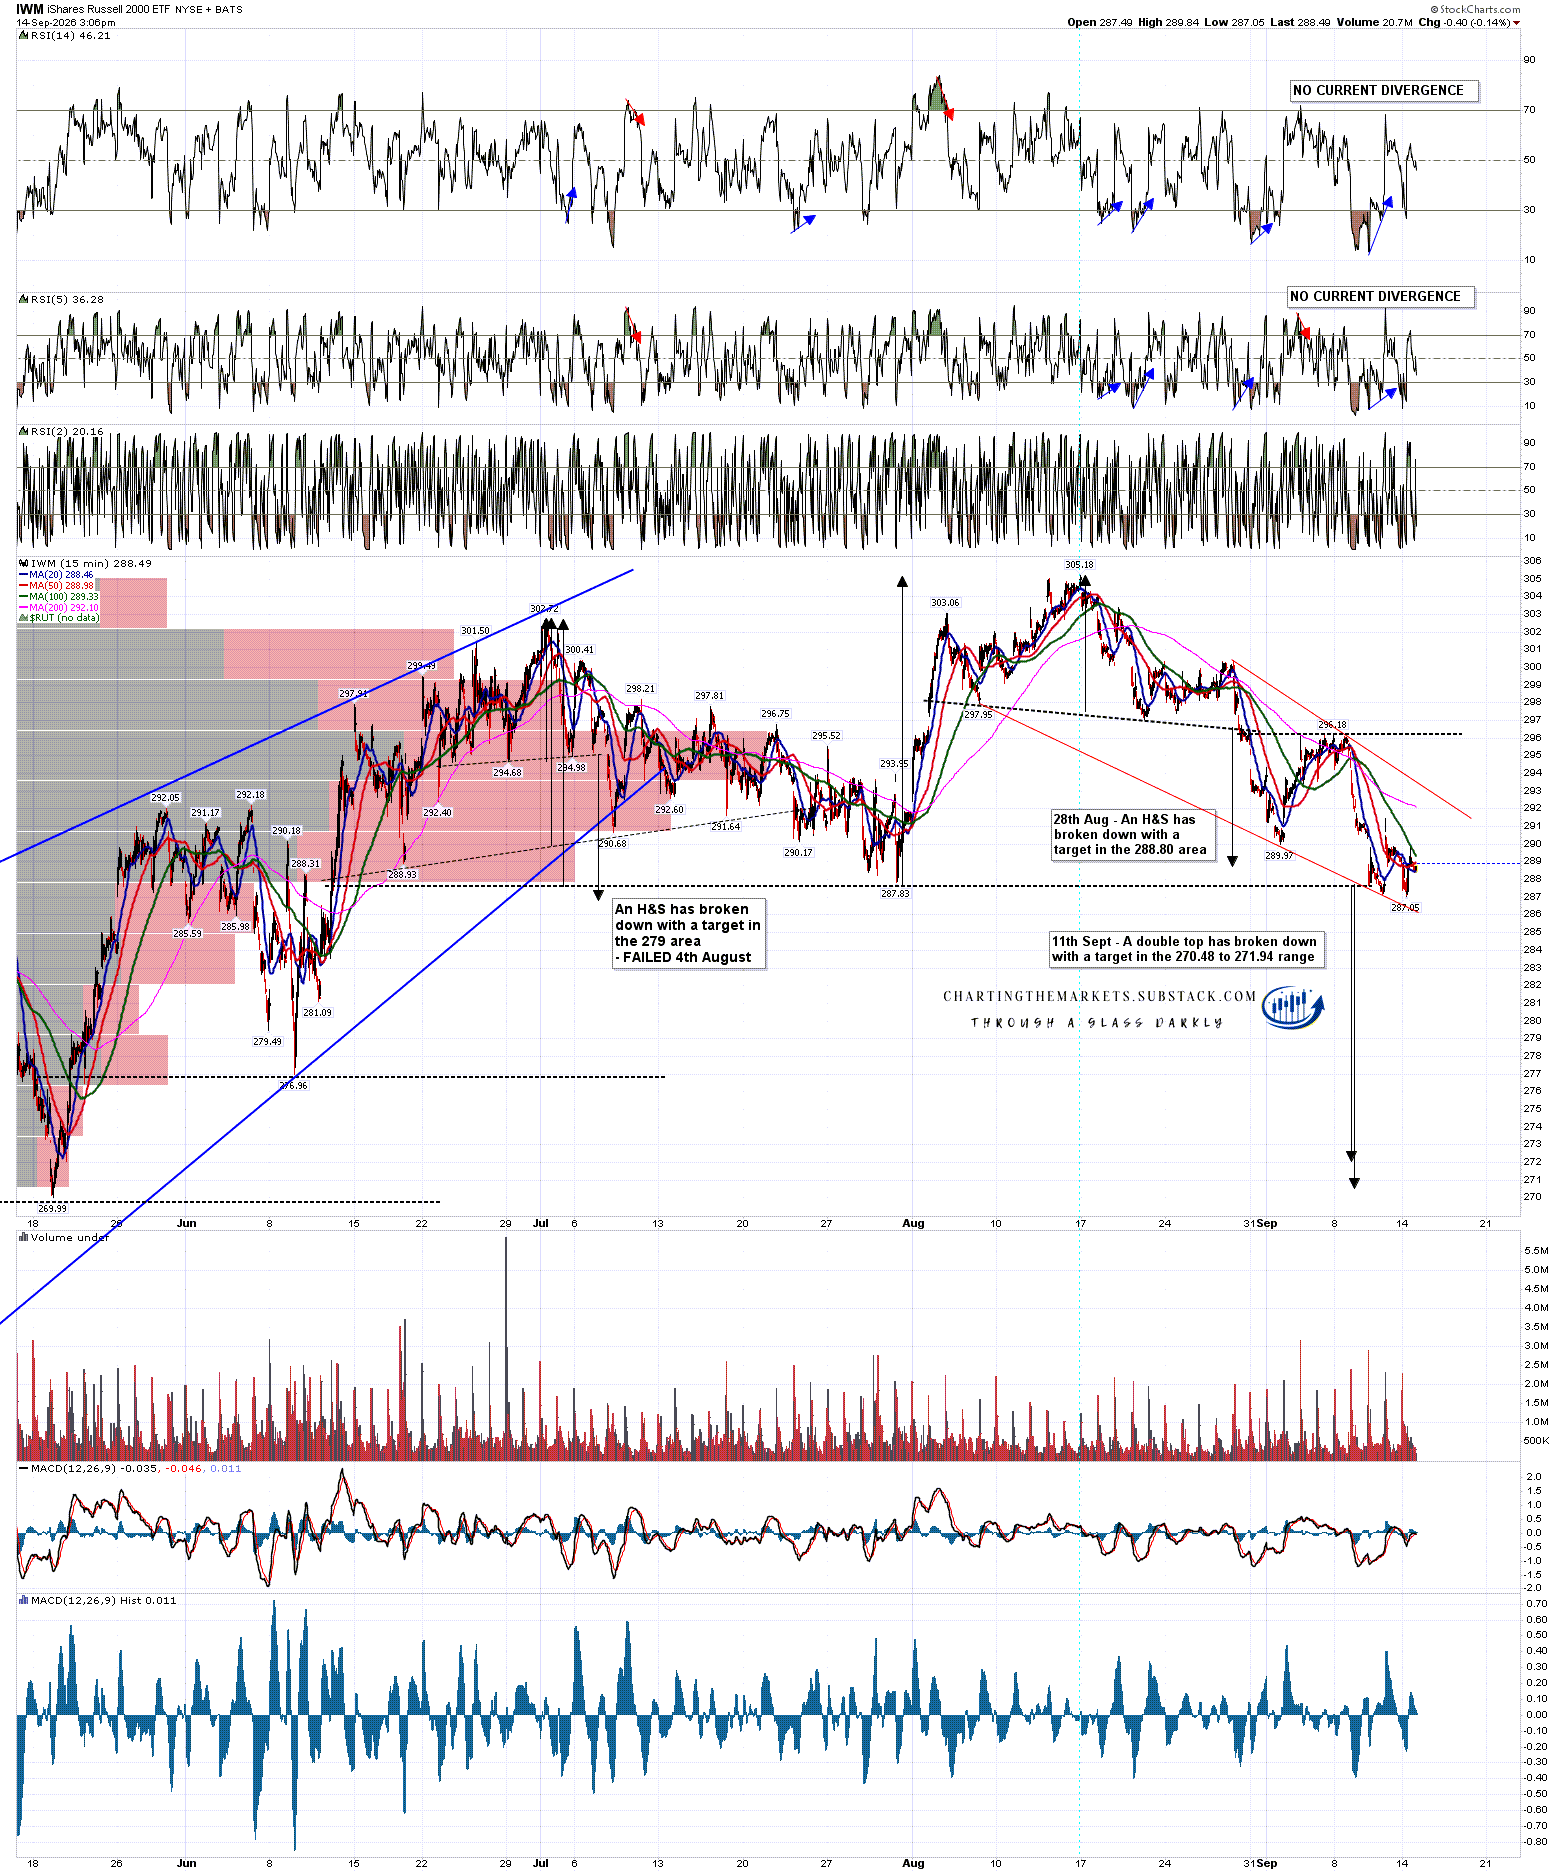
There may also be a bull flag forming here on IWM, though more obvious is the large double top that has broken down with a target in the 270.48 to 271.94 range.
That is not necessarily bearish of course. Any pattern like this breaking up or down has in effect two targets, either the pattern target here in the 270.48 to 271.94 range, or rejection back into a retest of the high, which is of course what a bull flag target would also be.
IWM 15min chart:
The key may well be the Philadelphia Semiconductor Index (SOX), which was encouragingly strong with QQQ last week against SPX and DIA, with breaks and closes over the daily middle band combined with tests of main resistance at the 50dma on Tuesday, Wednesday and Friday last week. None of those 50dma tests delivered a break above though, and SOX was back retesting the daily lower band today.
SOX daily chart:
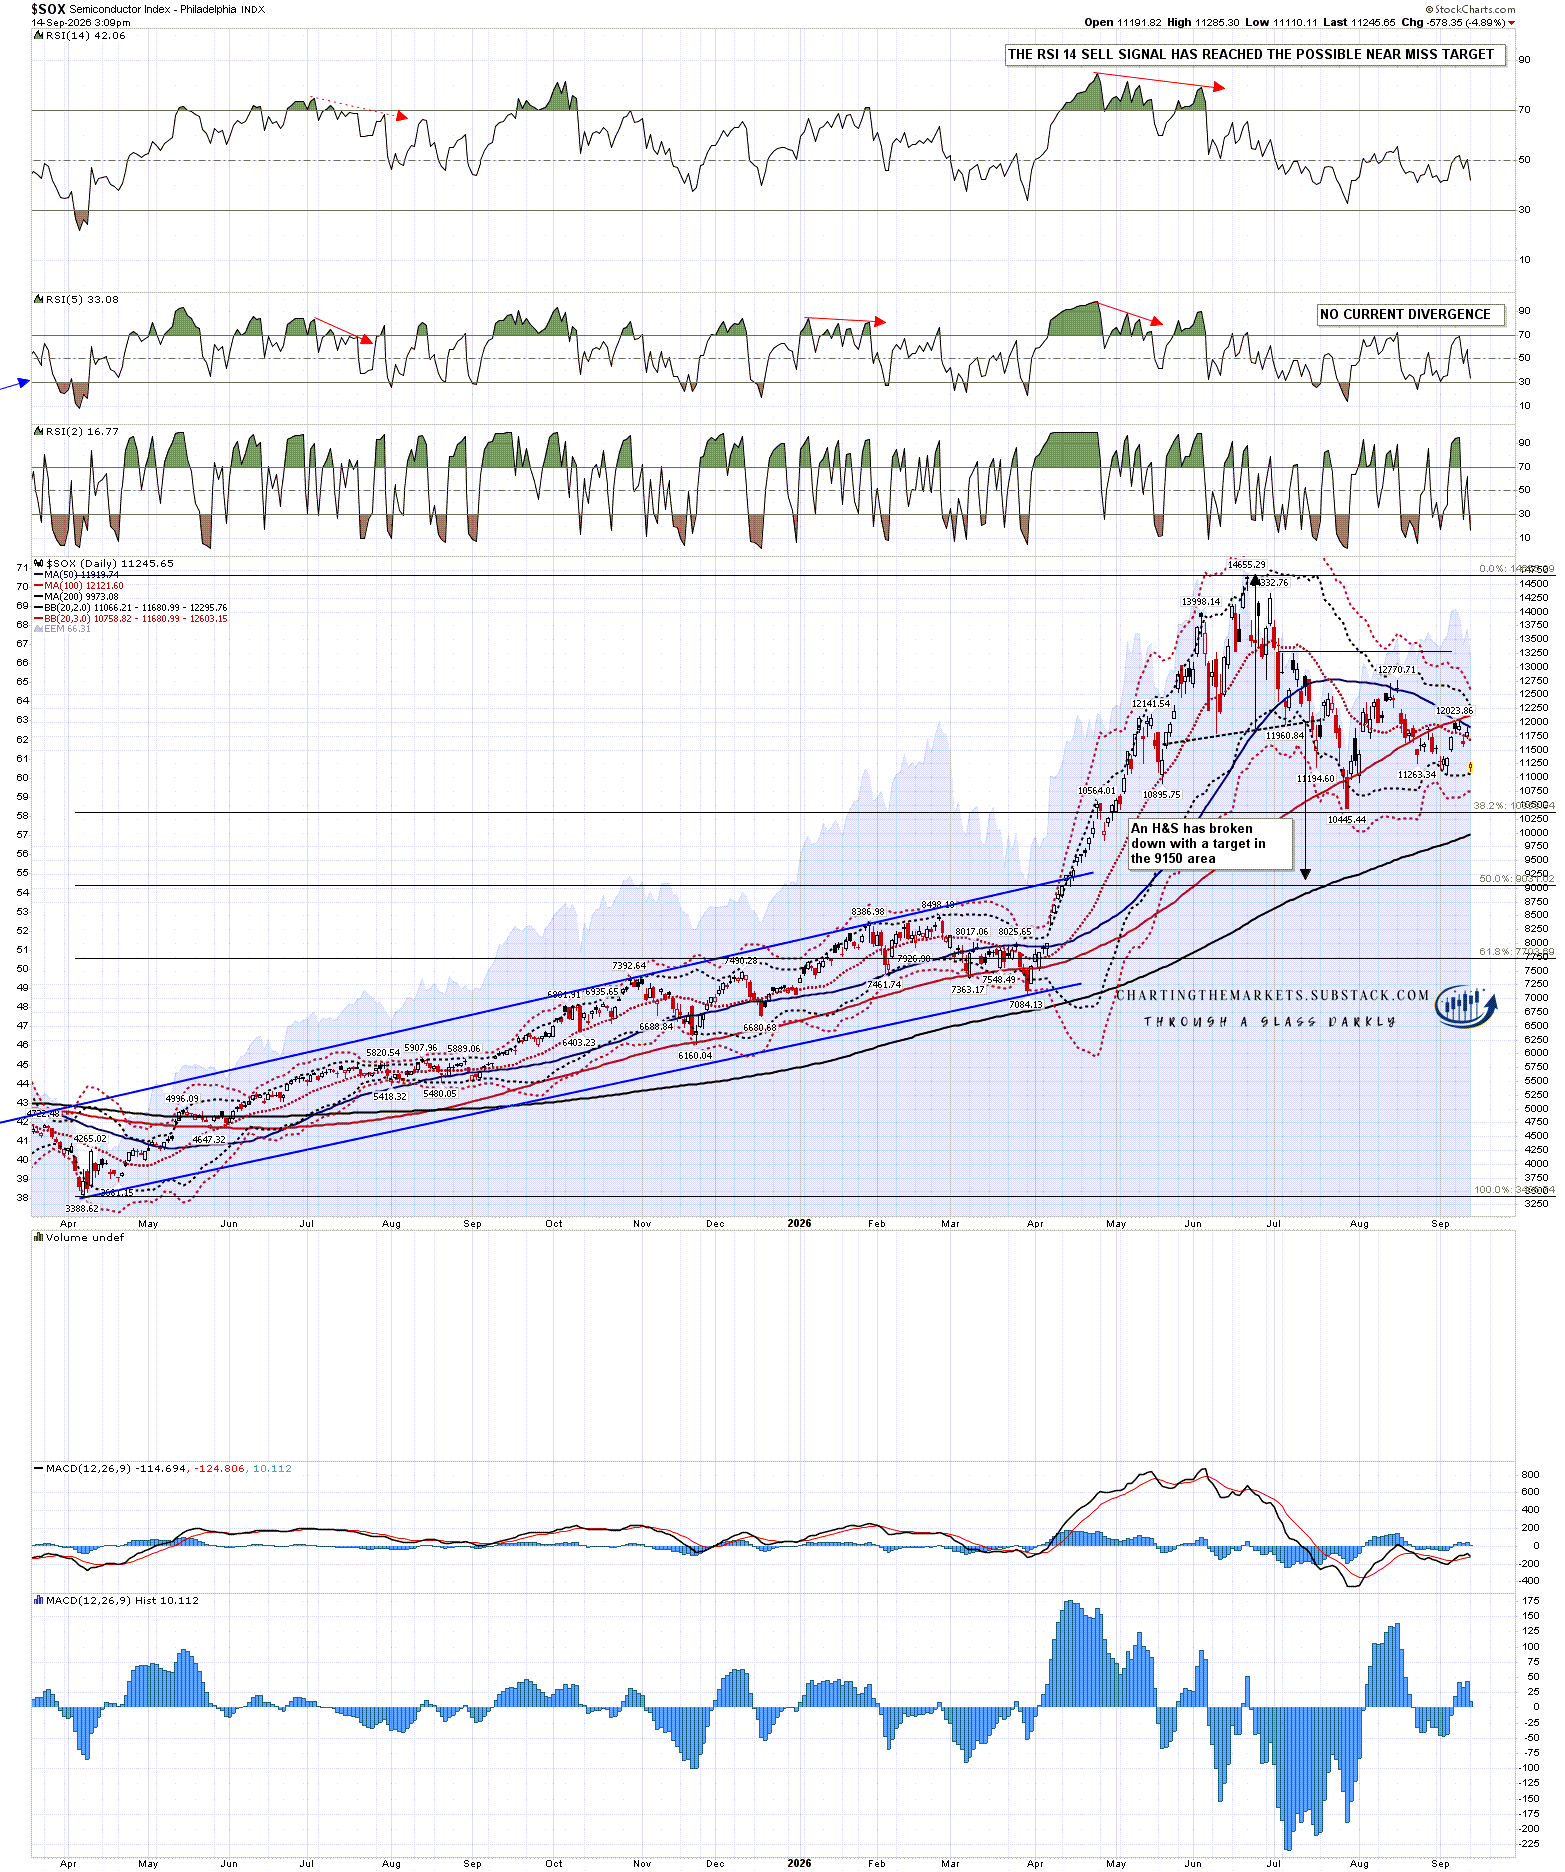
I’ve been saying repeatedly that high retests would be a lot easier with a push up on Tech, and I’m thinking that in the absence of any actual good news we may well only see those high retests if SOX can break up.
On the hourly chart below you can see that as well as very clear resistance at the 50dma SOX has now also developed a very strong five touch resistance trendline from the all time high at 14655.29. If SOX can break that trendline then we may finally see that break over the 50dma and have a decent shot at multiple all time high retests.
SOX 60min chart:
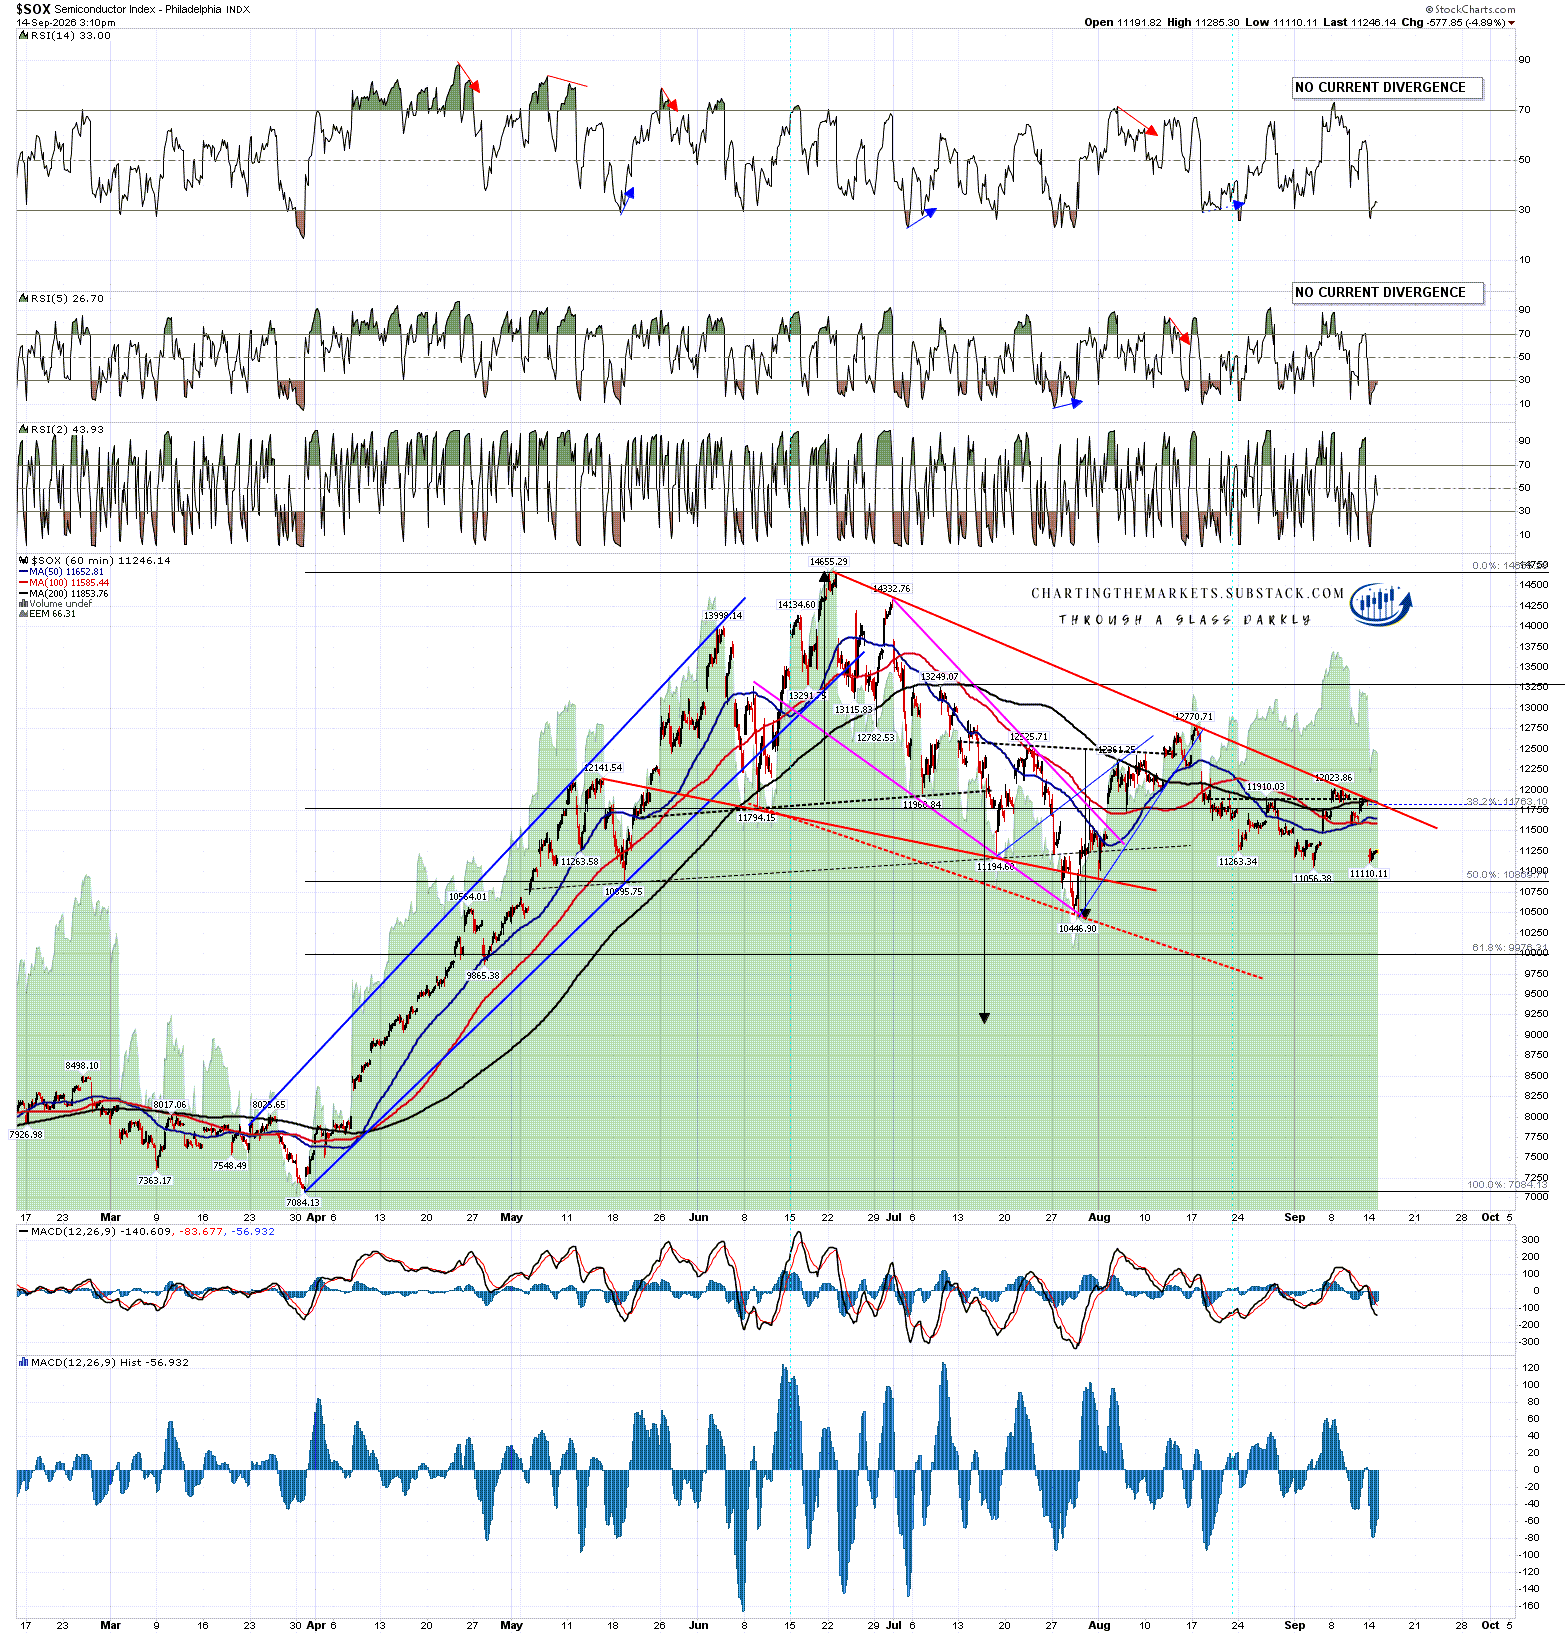
If we don’t see a break up soon though, we’ll likely see a break down instead.
If you like my analysis and would like to see more, please take a free subscription at my chartingthemarkets substack, where I publish these posts first. I also do a premarket video every day on equity indices, bonds, currencies, energies, precious commodities and other commodities at 8.45am EST, but only for paying subscribers. Other places to find me are my page on the platform previously known as twitter, and my YouTube channel.


No comments:
Post a Comment