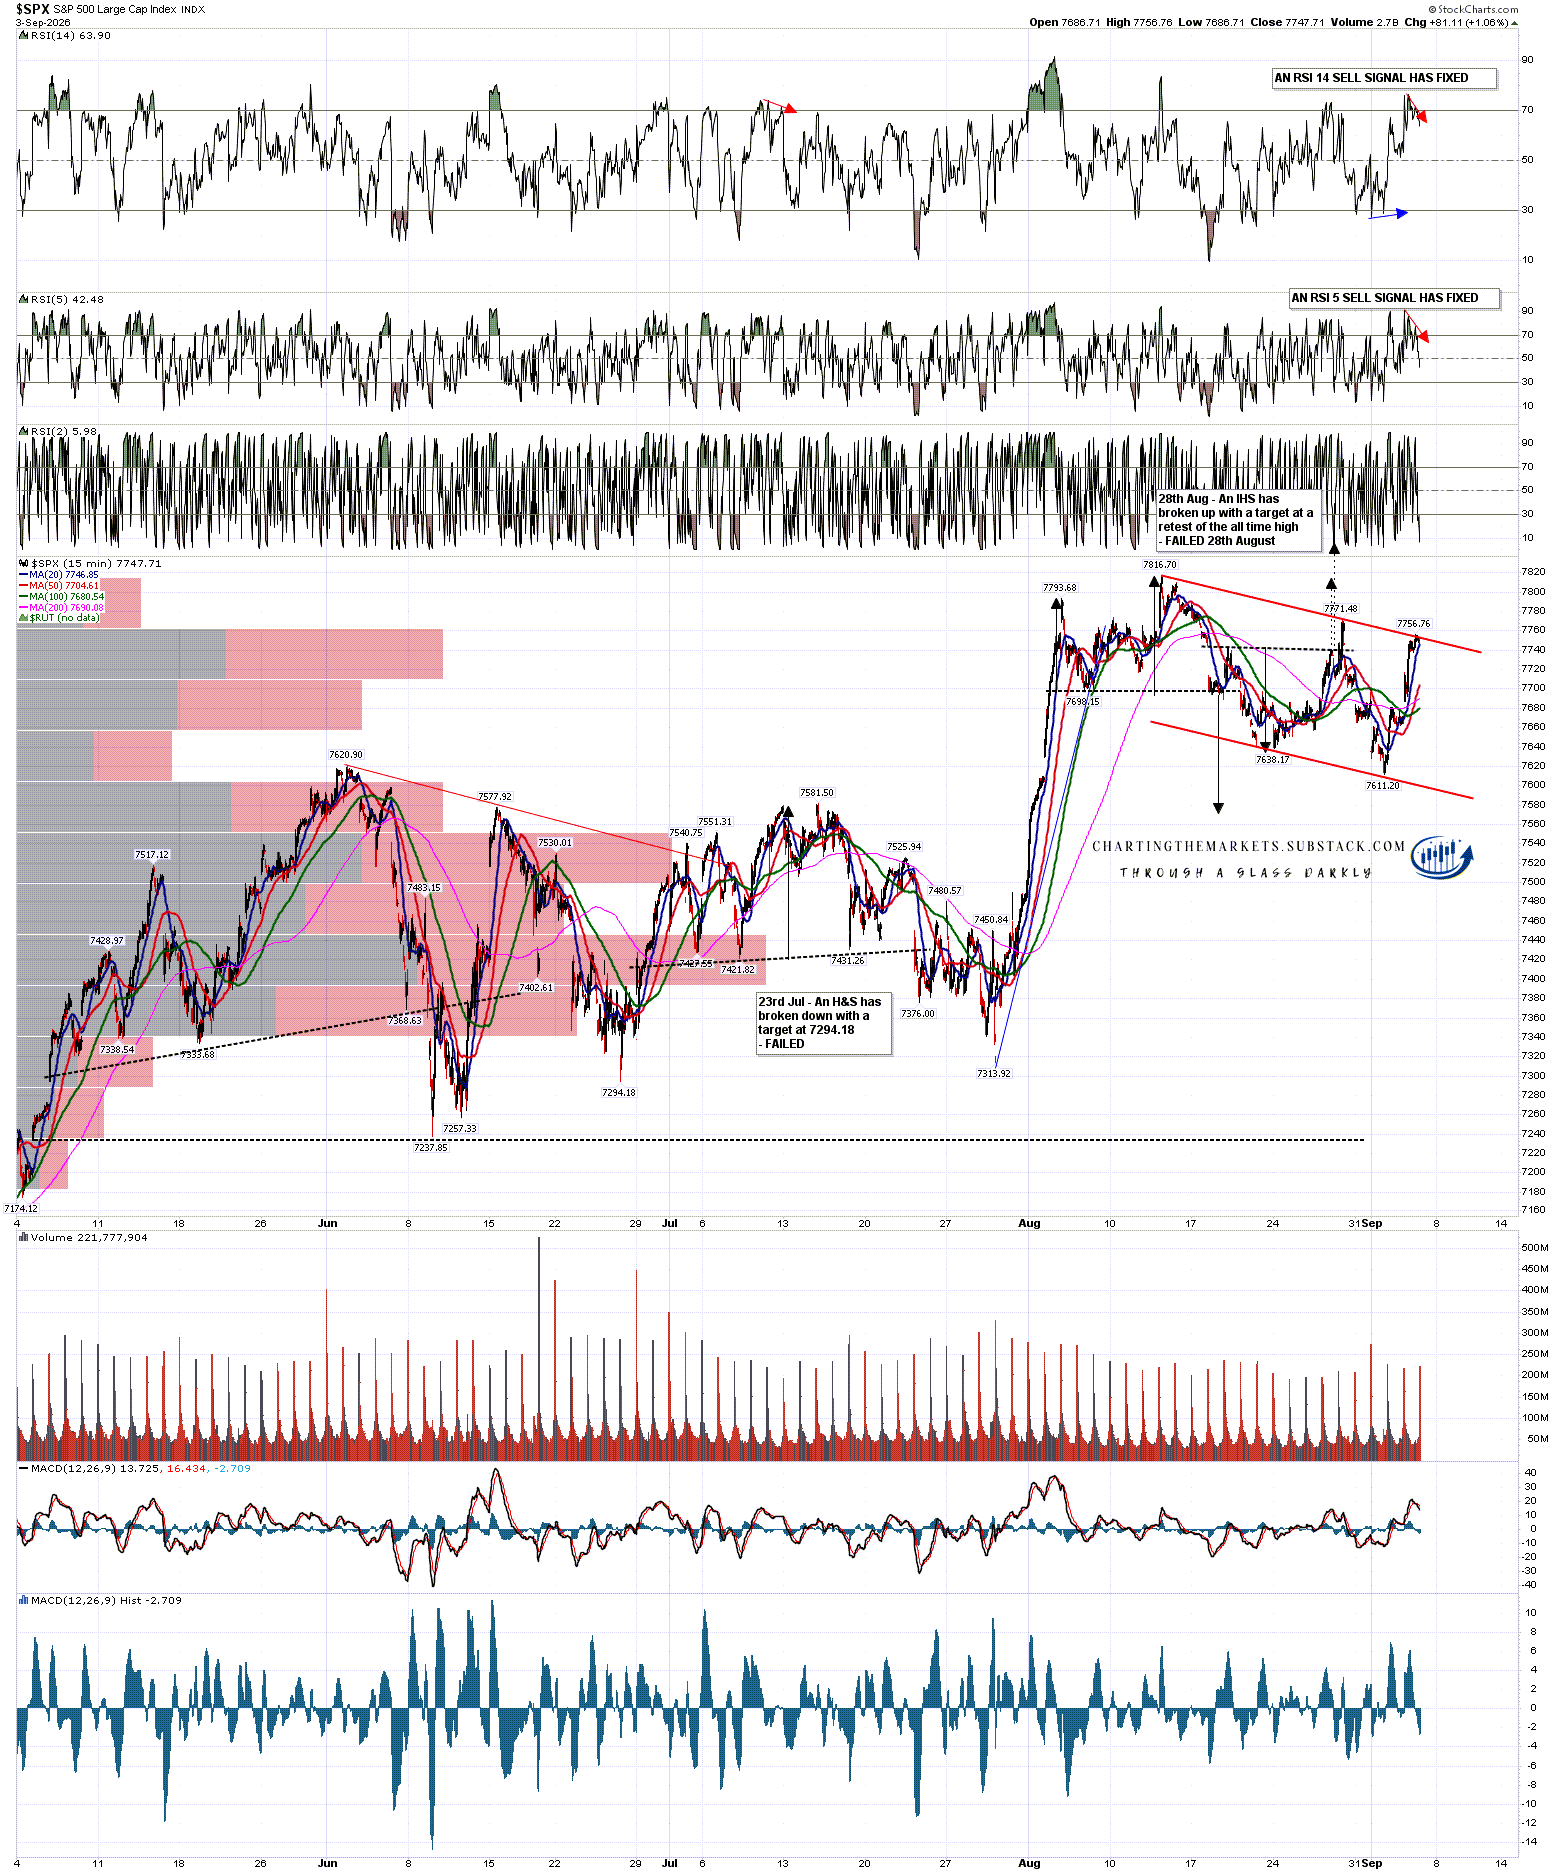
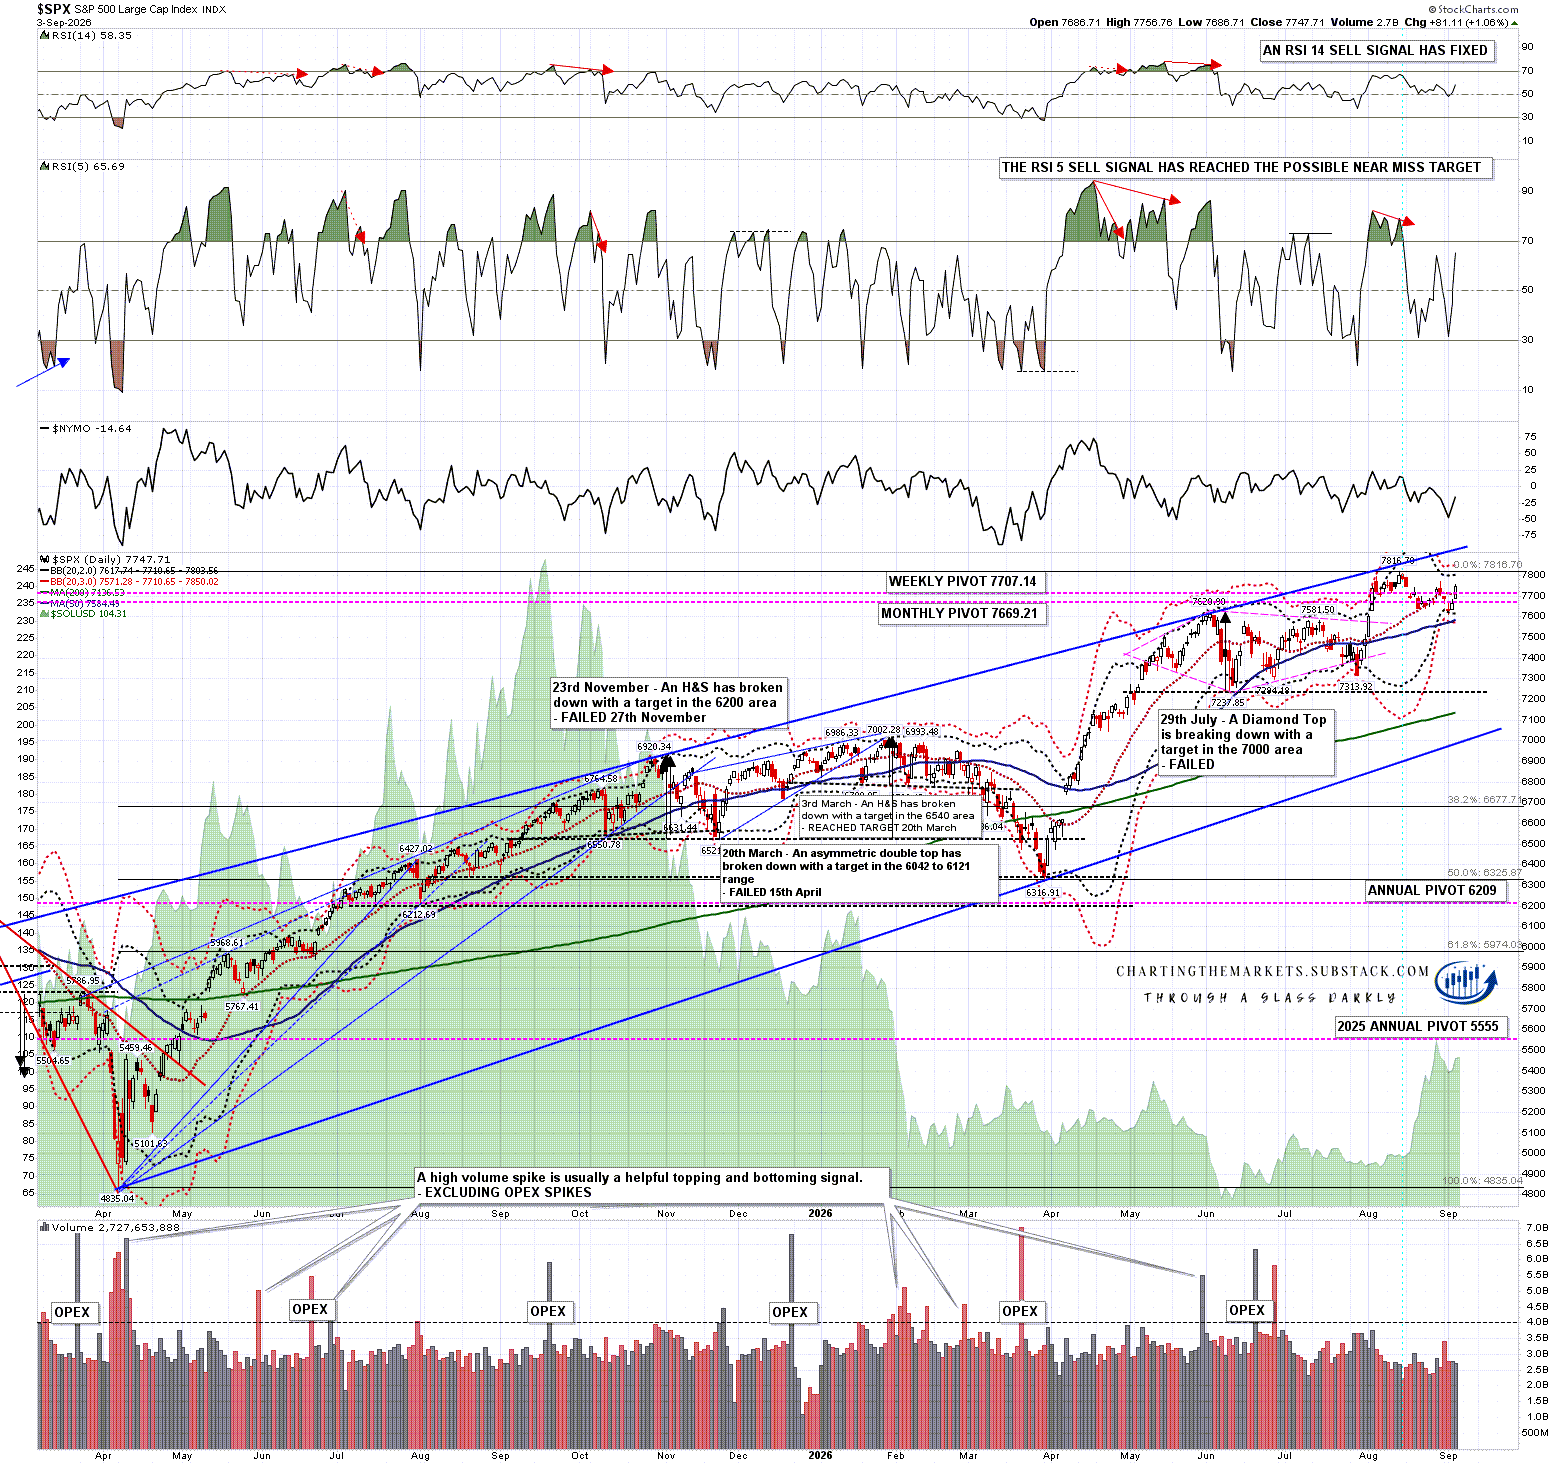
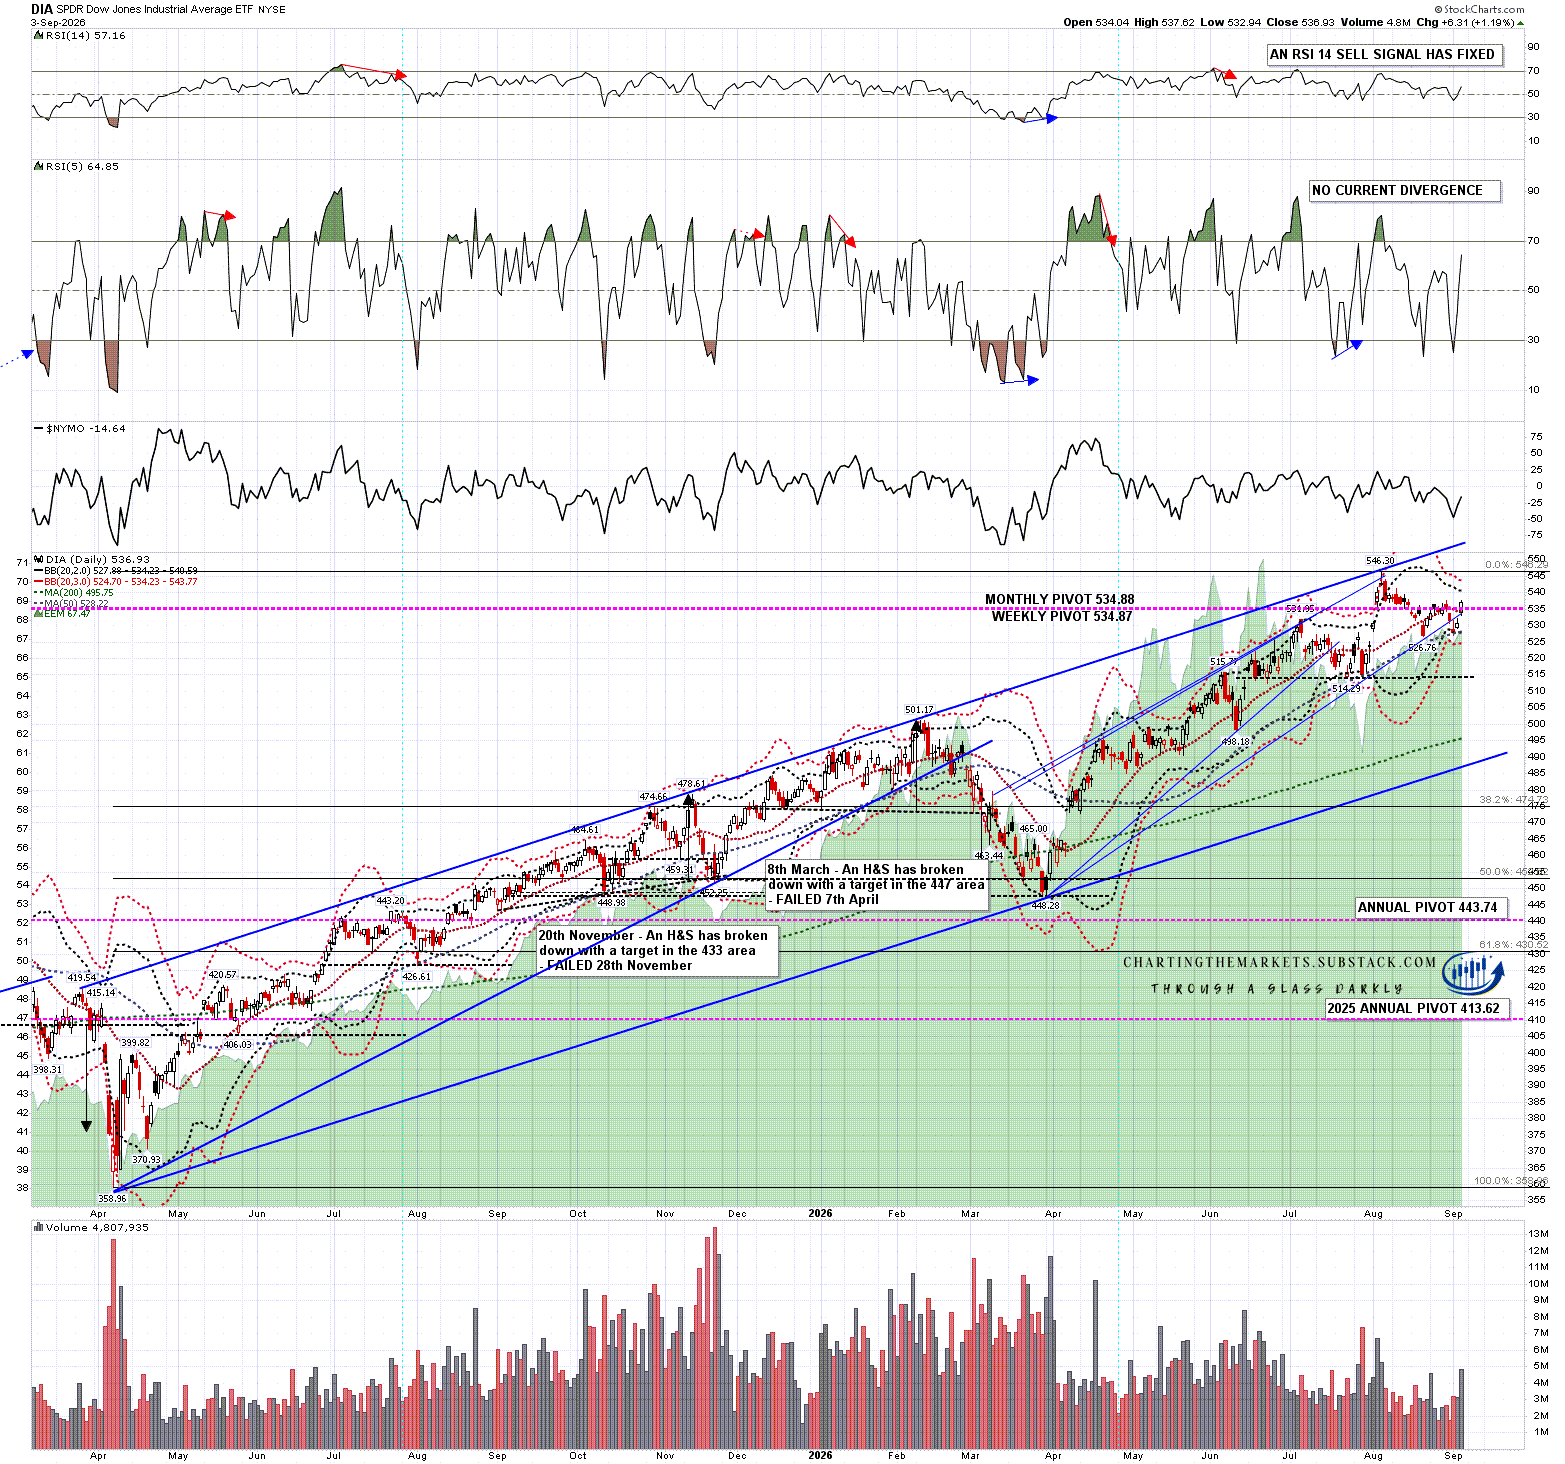
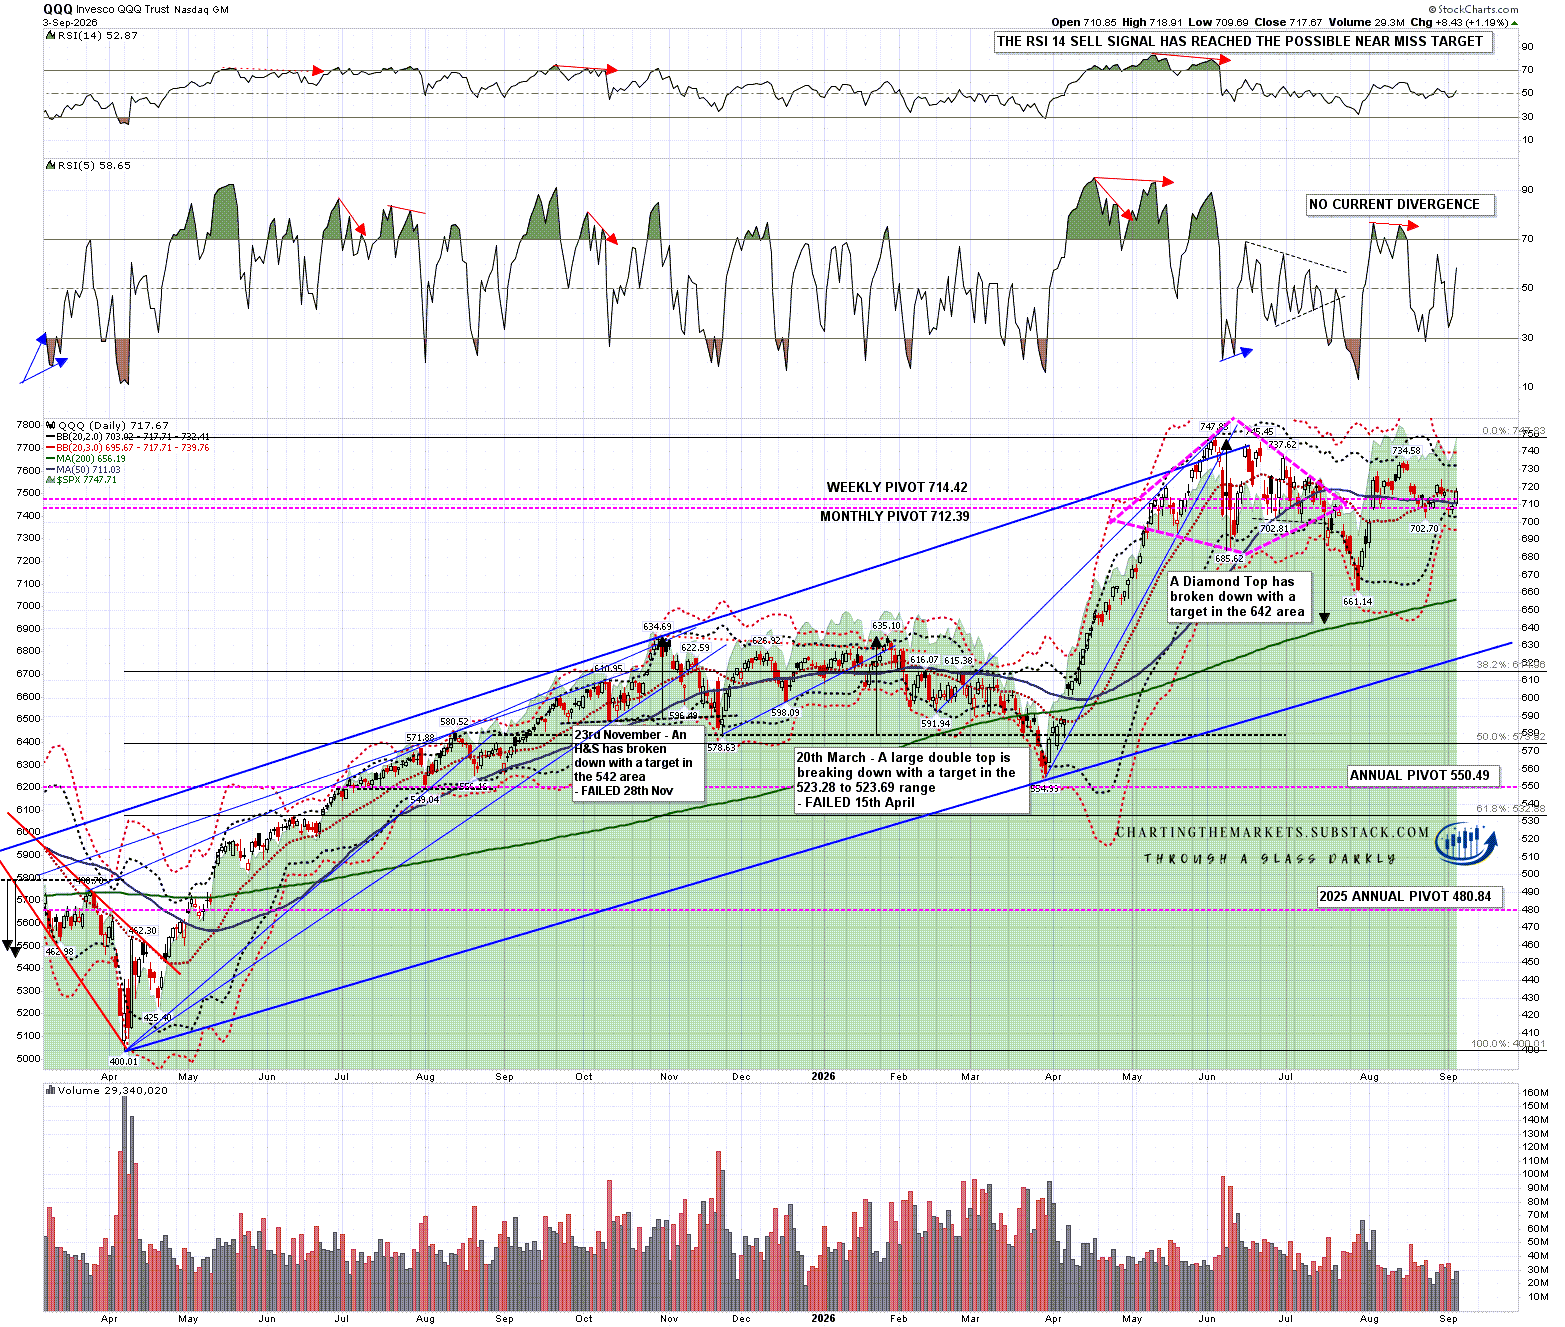
- WE'RE JUST RANDOM SPECKS OF DUST IN A TORNADO TO THE MARKETS .......
- CHARTISTS MUST PUT ALL BIAS ASIDE AND LET THE CHARTS DO THE TALKING OR WE'LL SEE ONLY WHAT WE WANT TO SEE
- This blog has a copy of all header posts that I publish anywhere, so that those interested in seeing what my thoughts are on the markets can find them easily.
- I will be answering questions and responding to comments, so feel free to respond to any posts and I will see your comment even if it is not on the most recent post.
- If you're interested in seeing any intraday charts I post, I do that on twitter, and my twitter handle is @shjackcharts.
- The charts in the posts are as large as I can practically make them. if you would like to look at one more closely, click on it, and the link will take you to a larger version at screencast. If you click on that again, you will get a full page version, and can use the resizing function on your browser to enlarge parts of interest further.

Tuesday, 18 August 2026

Still A Tale of Two Markets

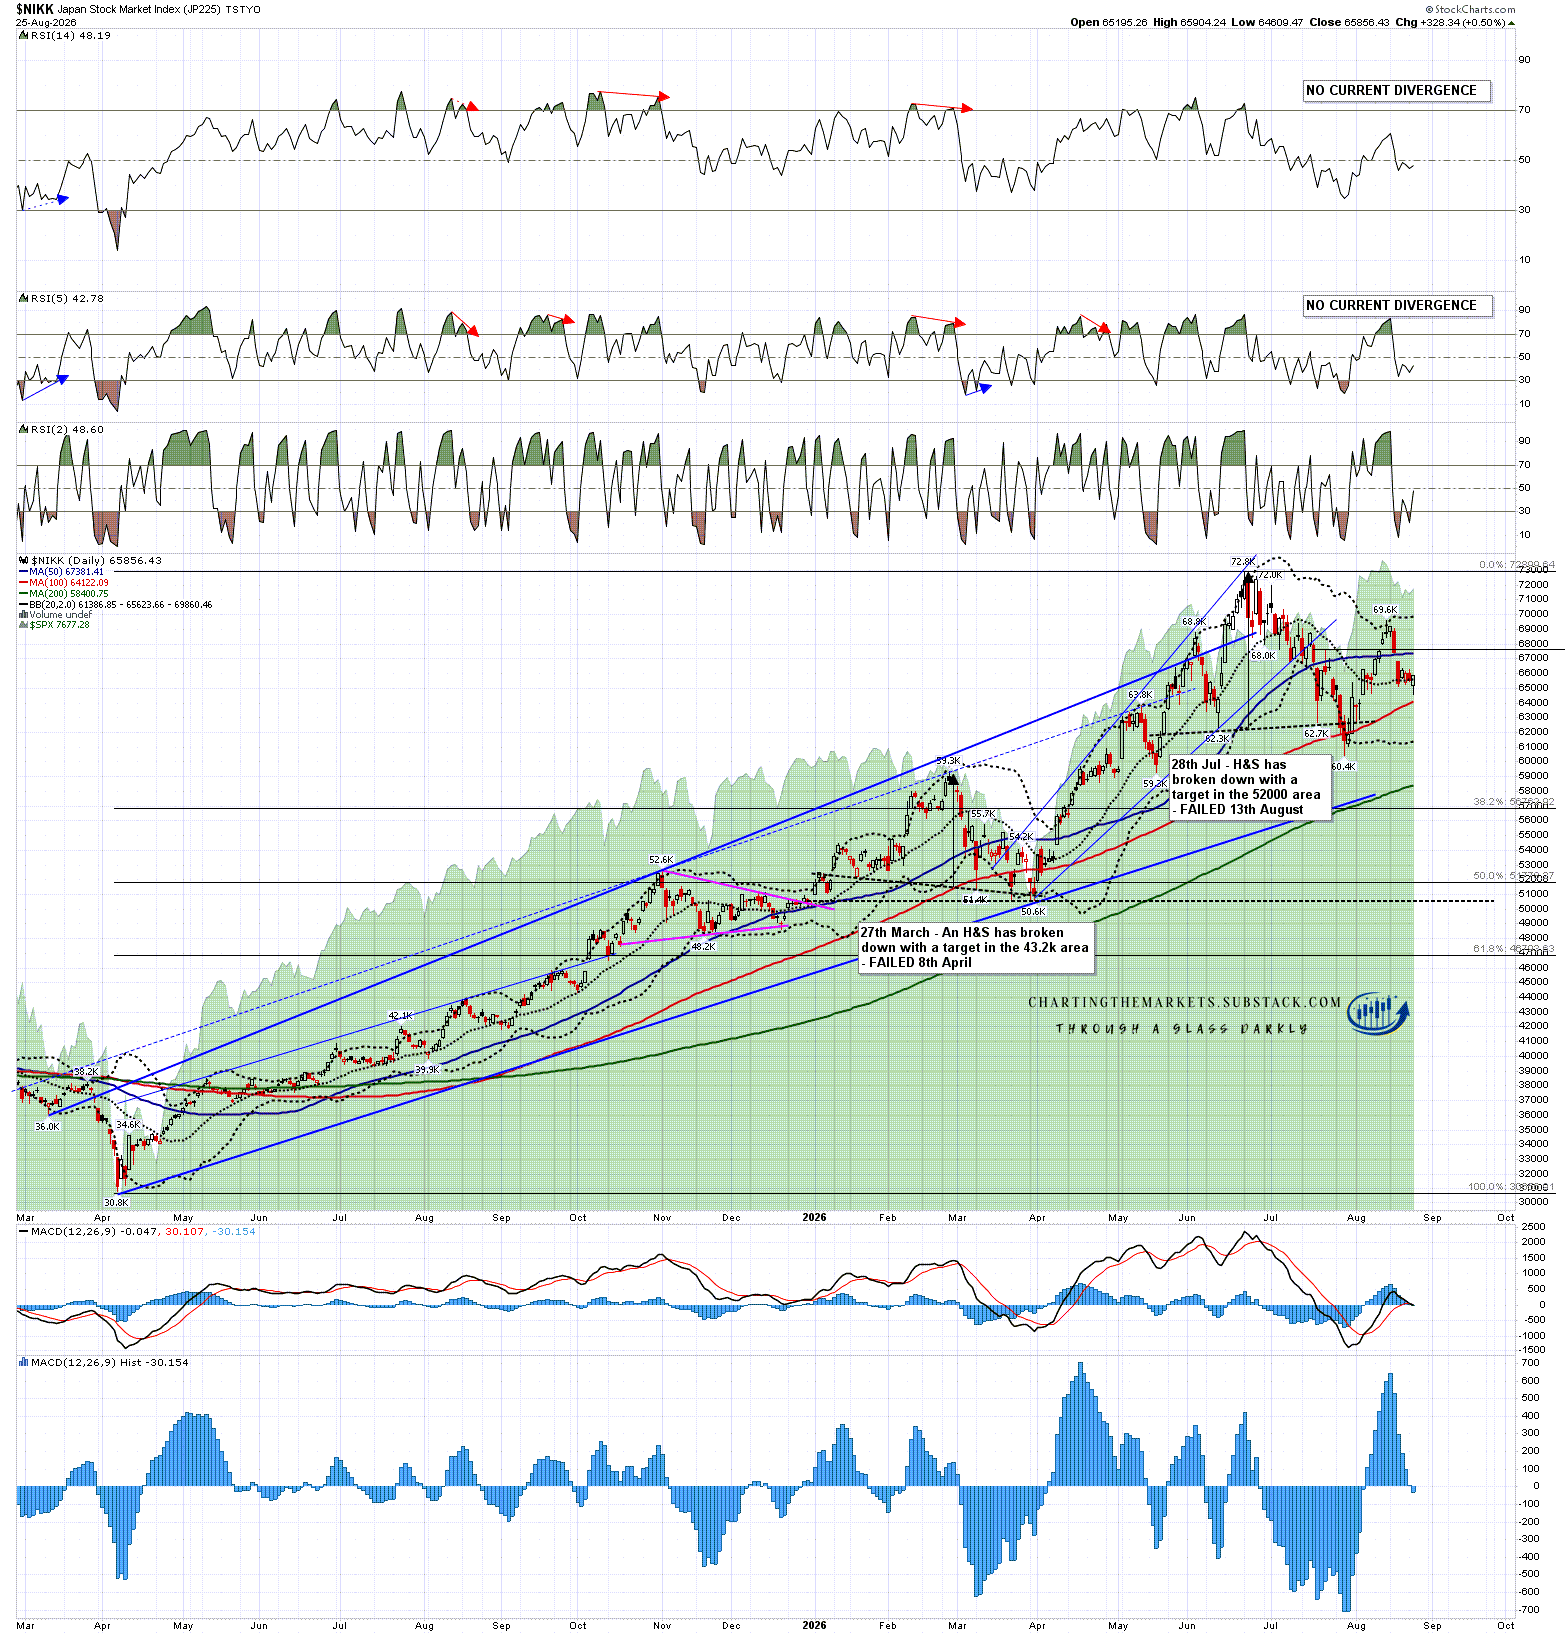
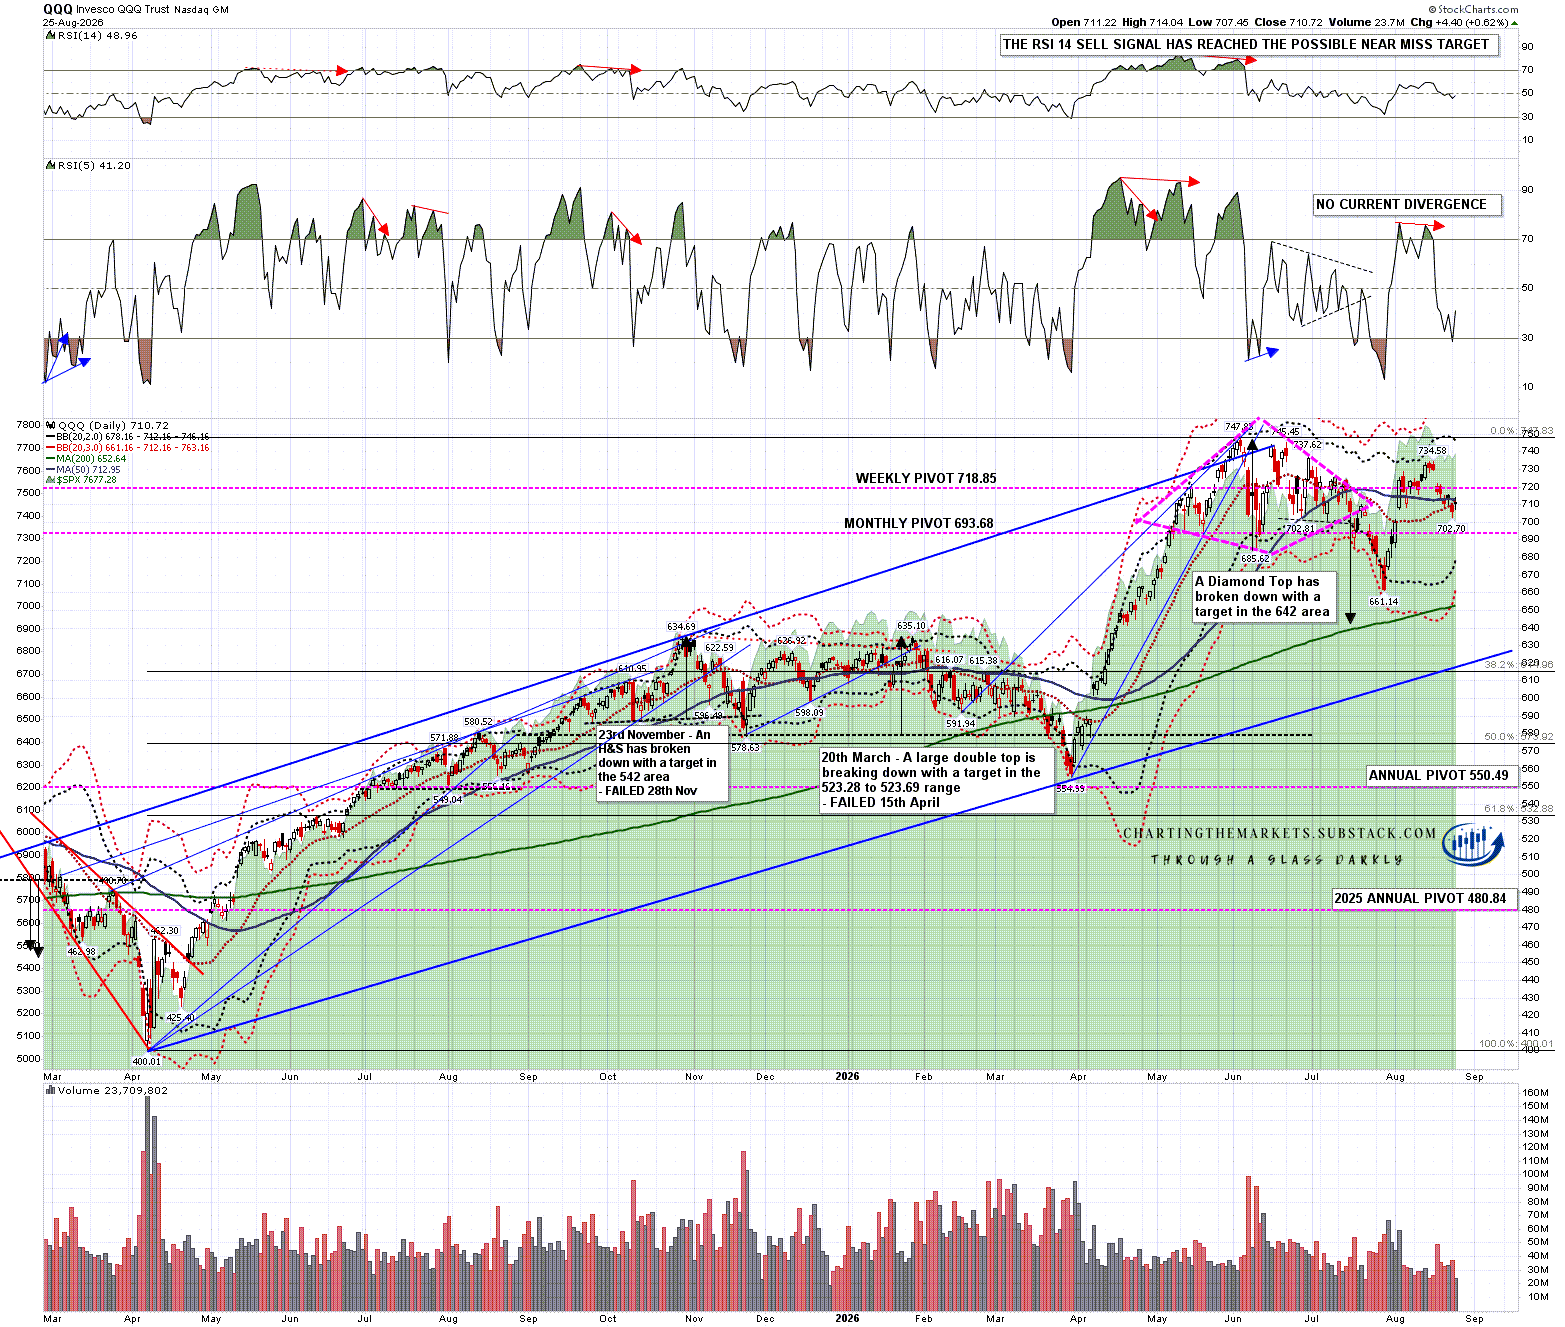
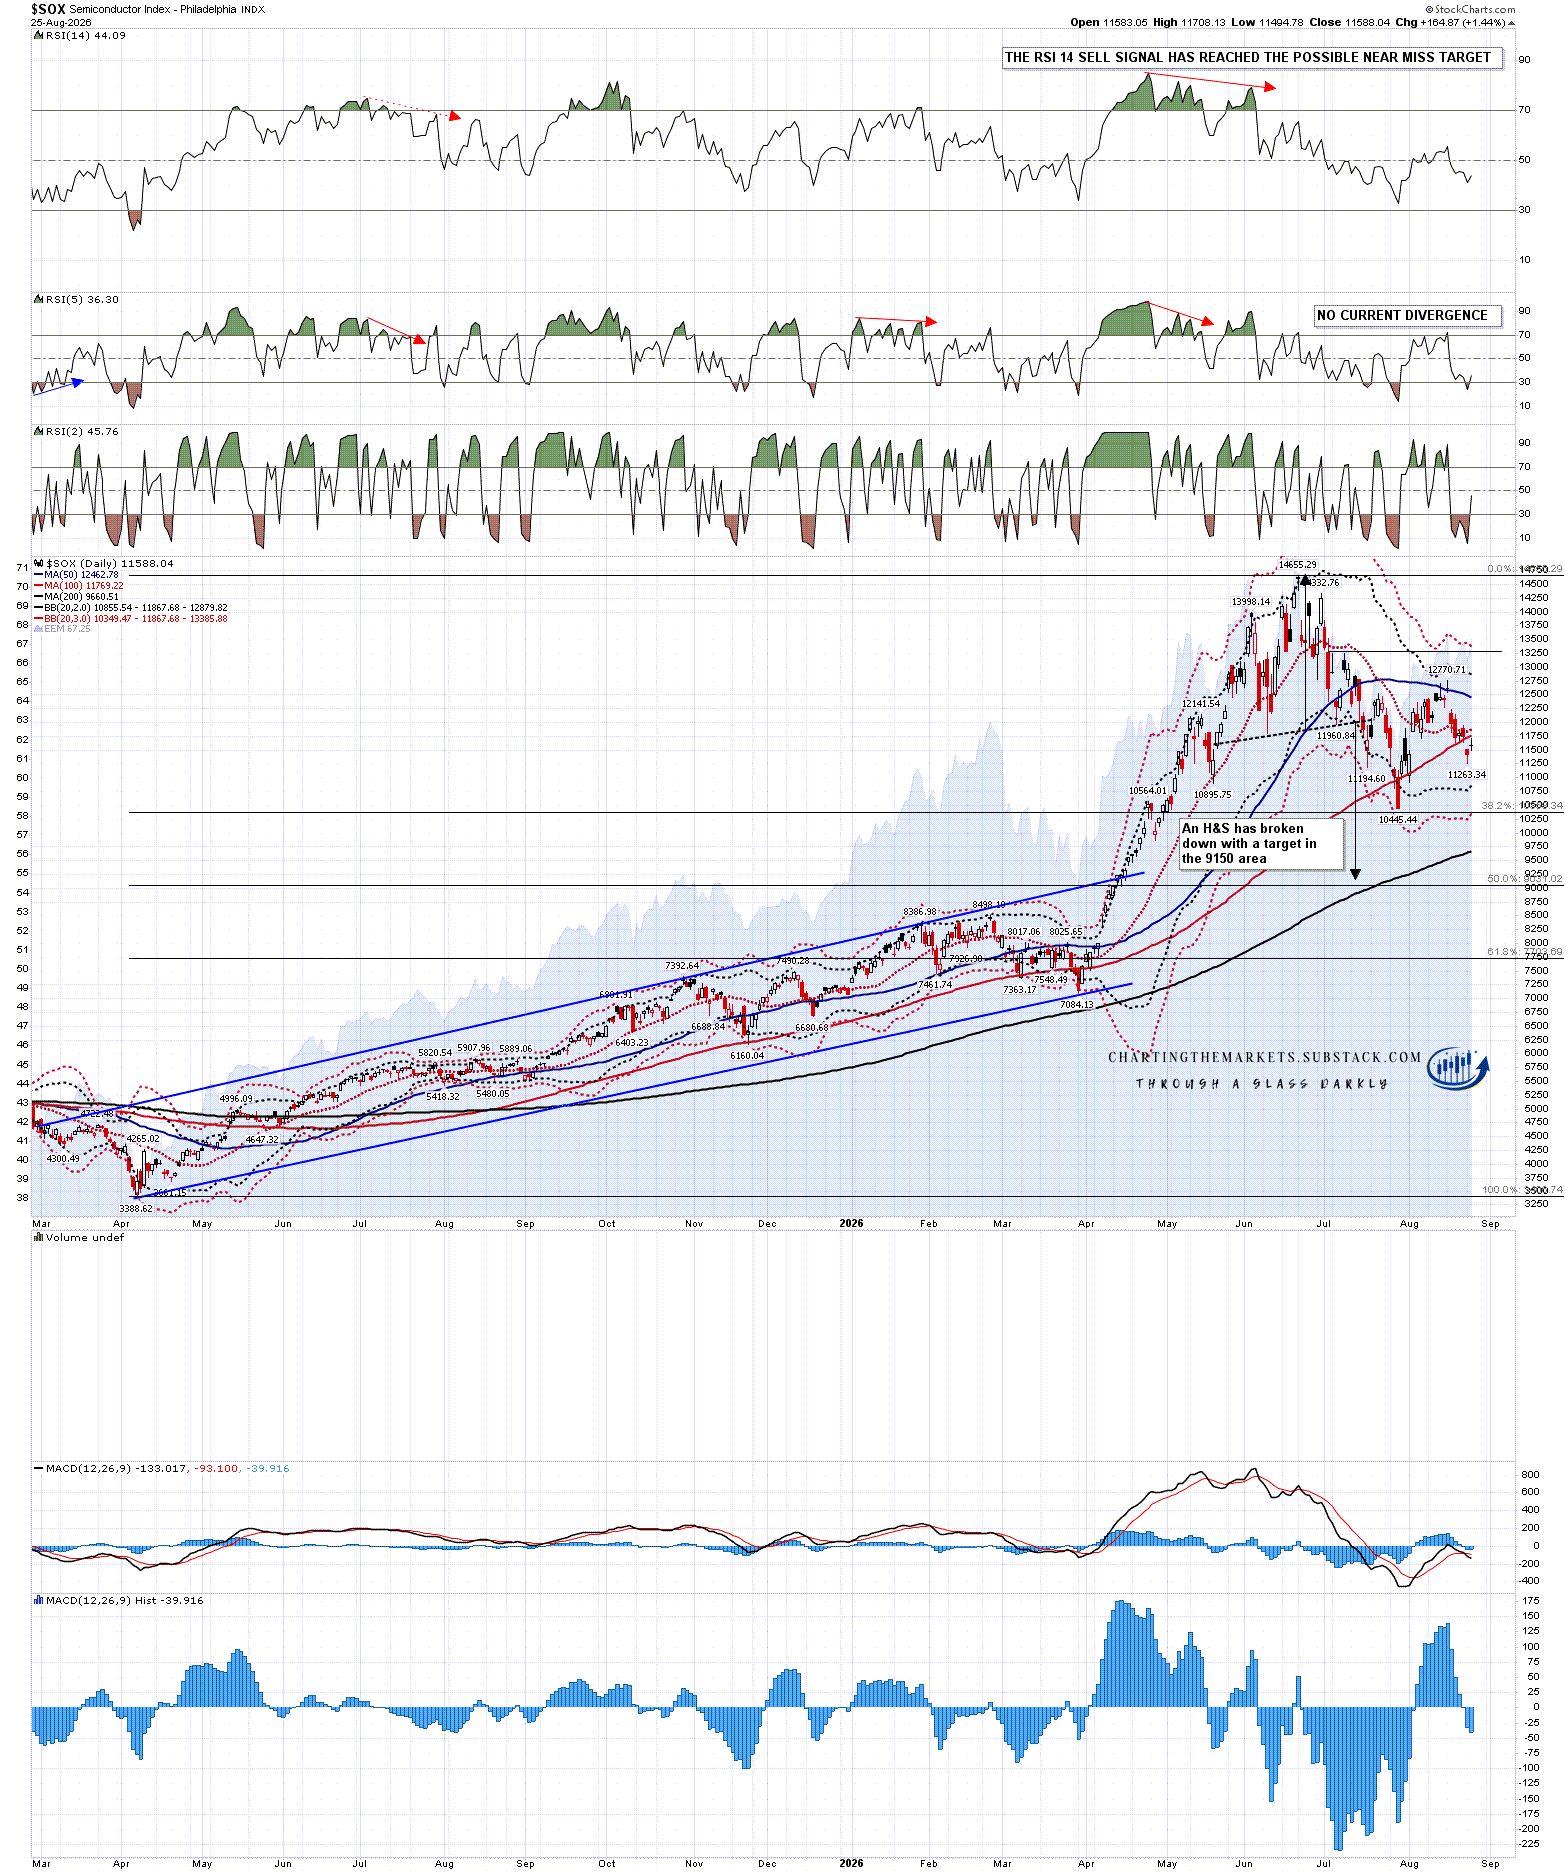
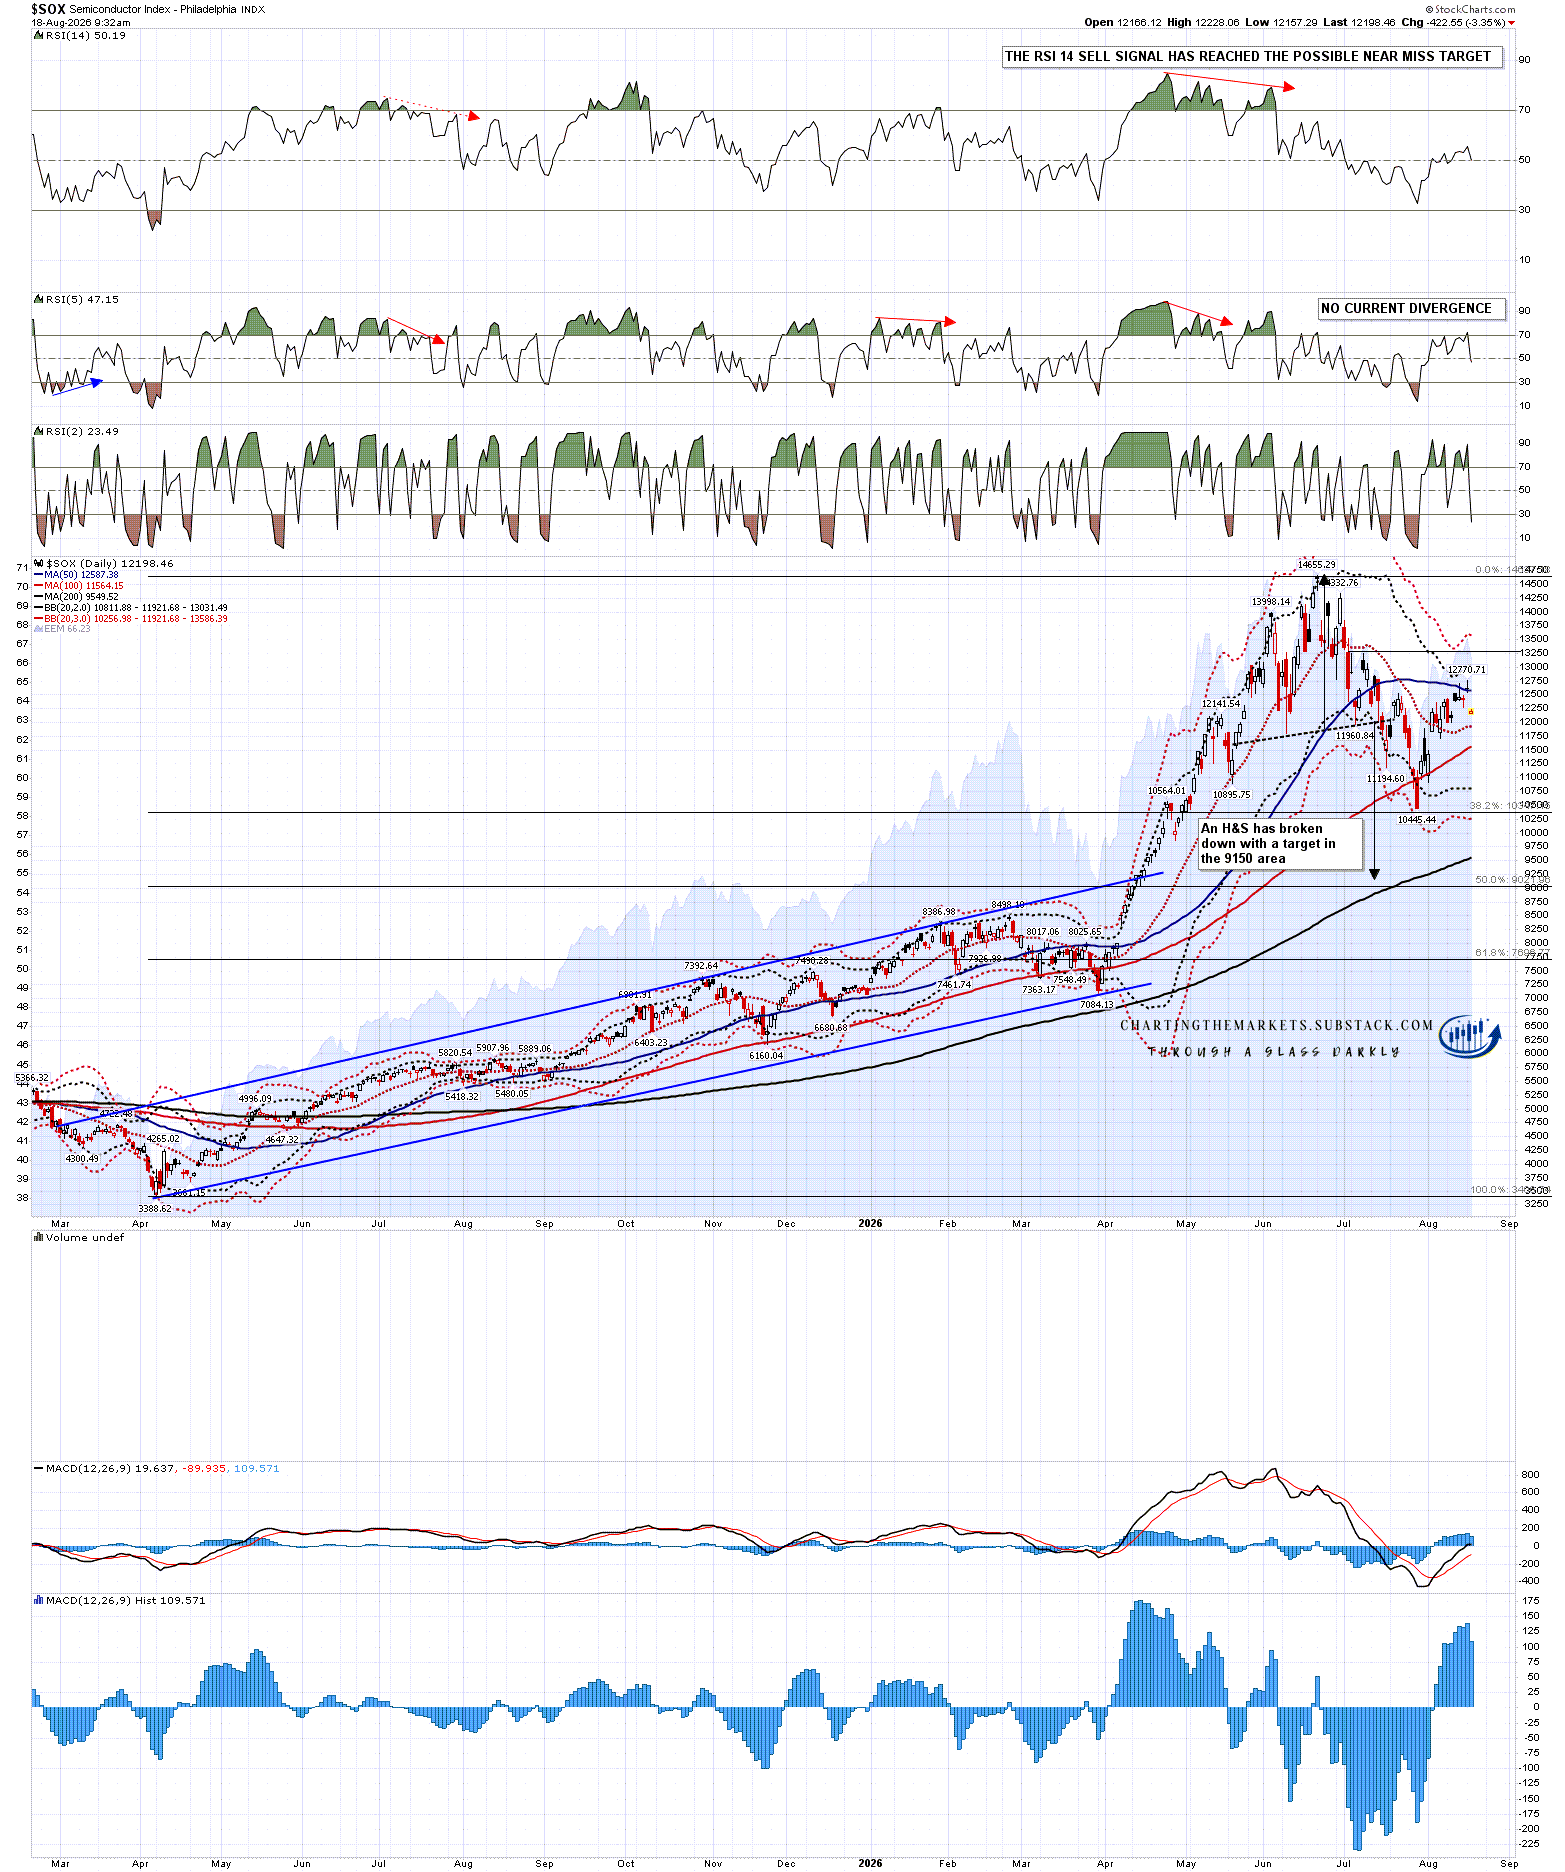
In my last post on Tuesday 4th August I was looking at the ambiguous setup on US indices and the Nikkei after the strong rally into the beginning of August, noting the three good quality topping patterns that were still intact on the Philadelphia Semiconductor Index (SOX), QQQ and Nikkei.

I also noted that SPX was close to the daily 3sd upper band and said that I was looking for a short term consolidation of a week or so to allow time for the daily middle bands to go higher, and for the daily outer bands to expand, opening up further possible upside. We have since seen that consolidation, the daily middle bands have turned up and the outer bands have expanded.

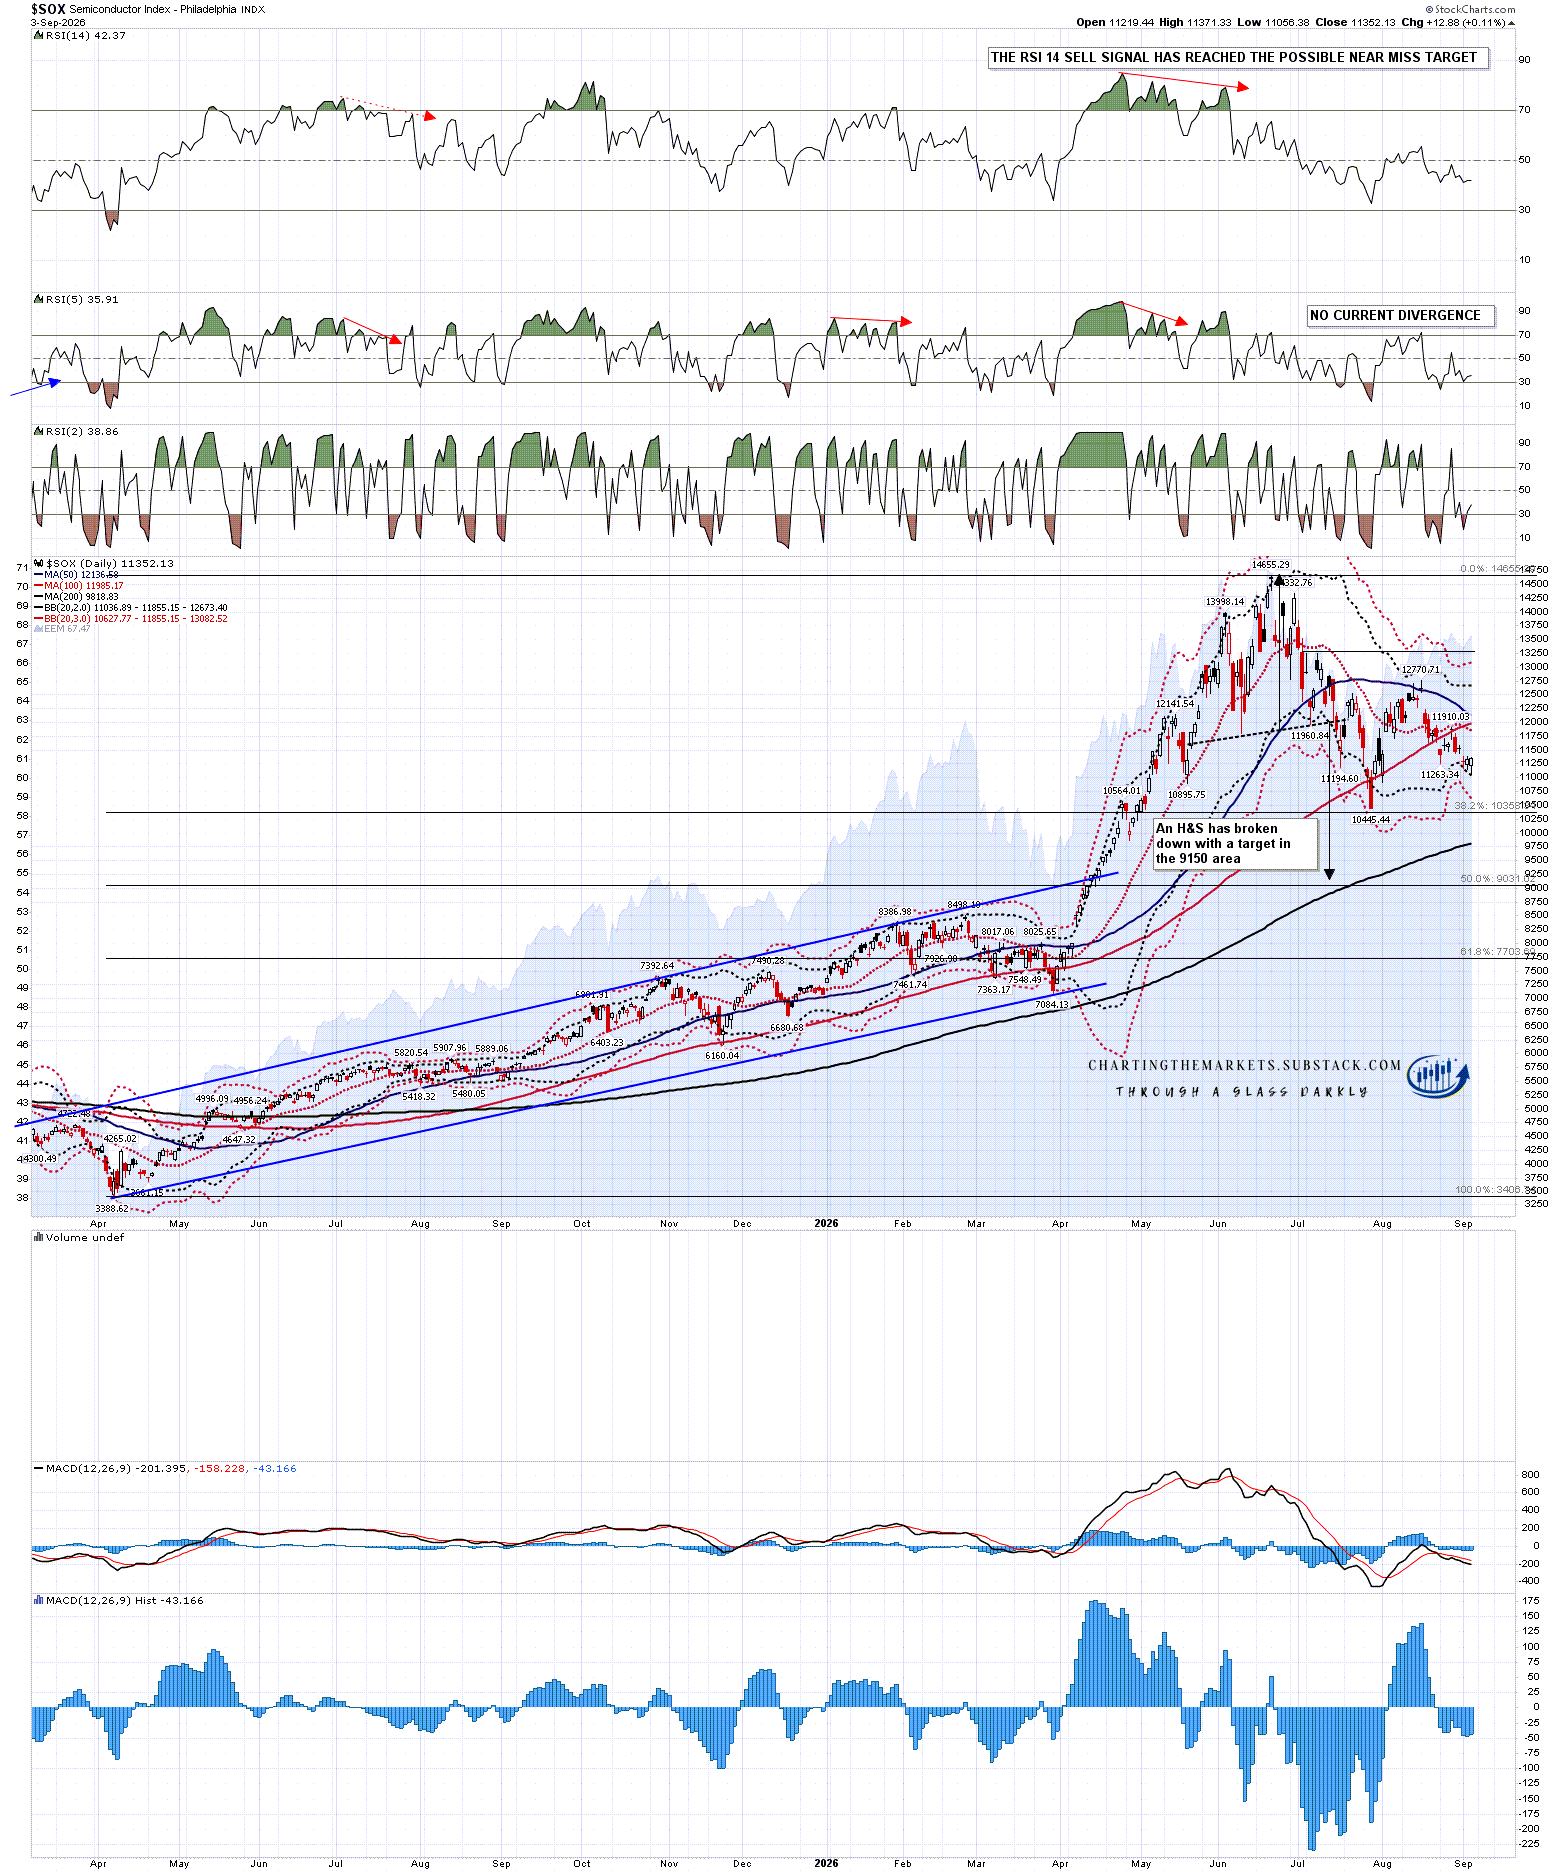
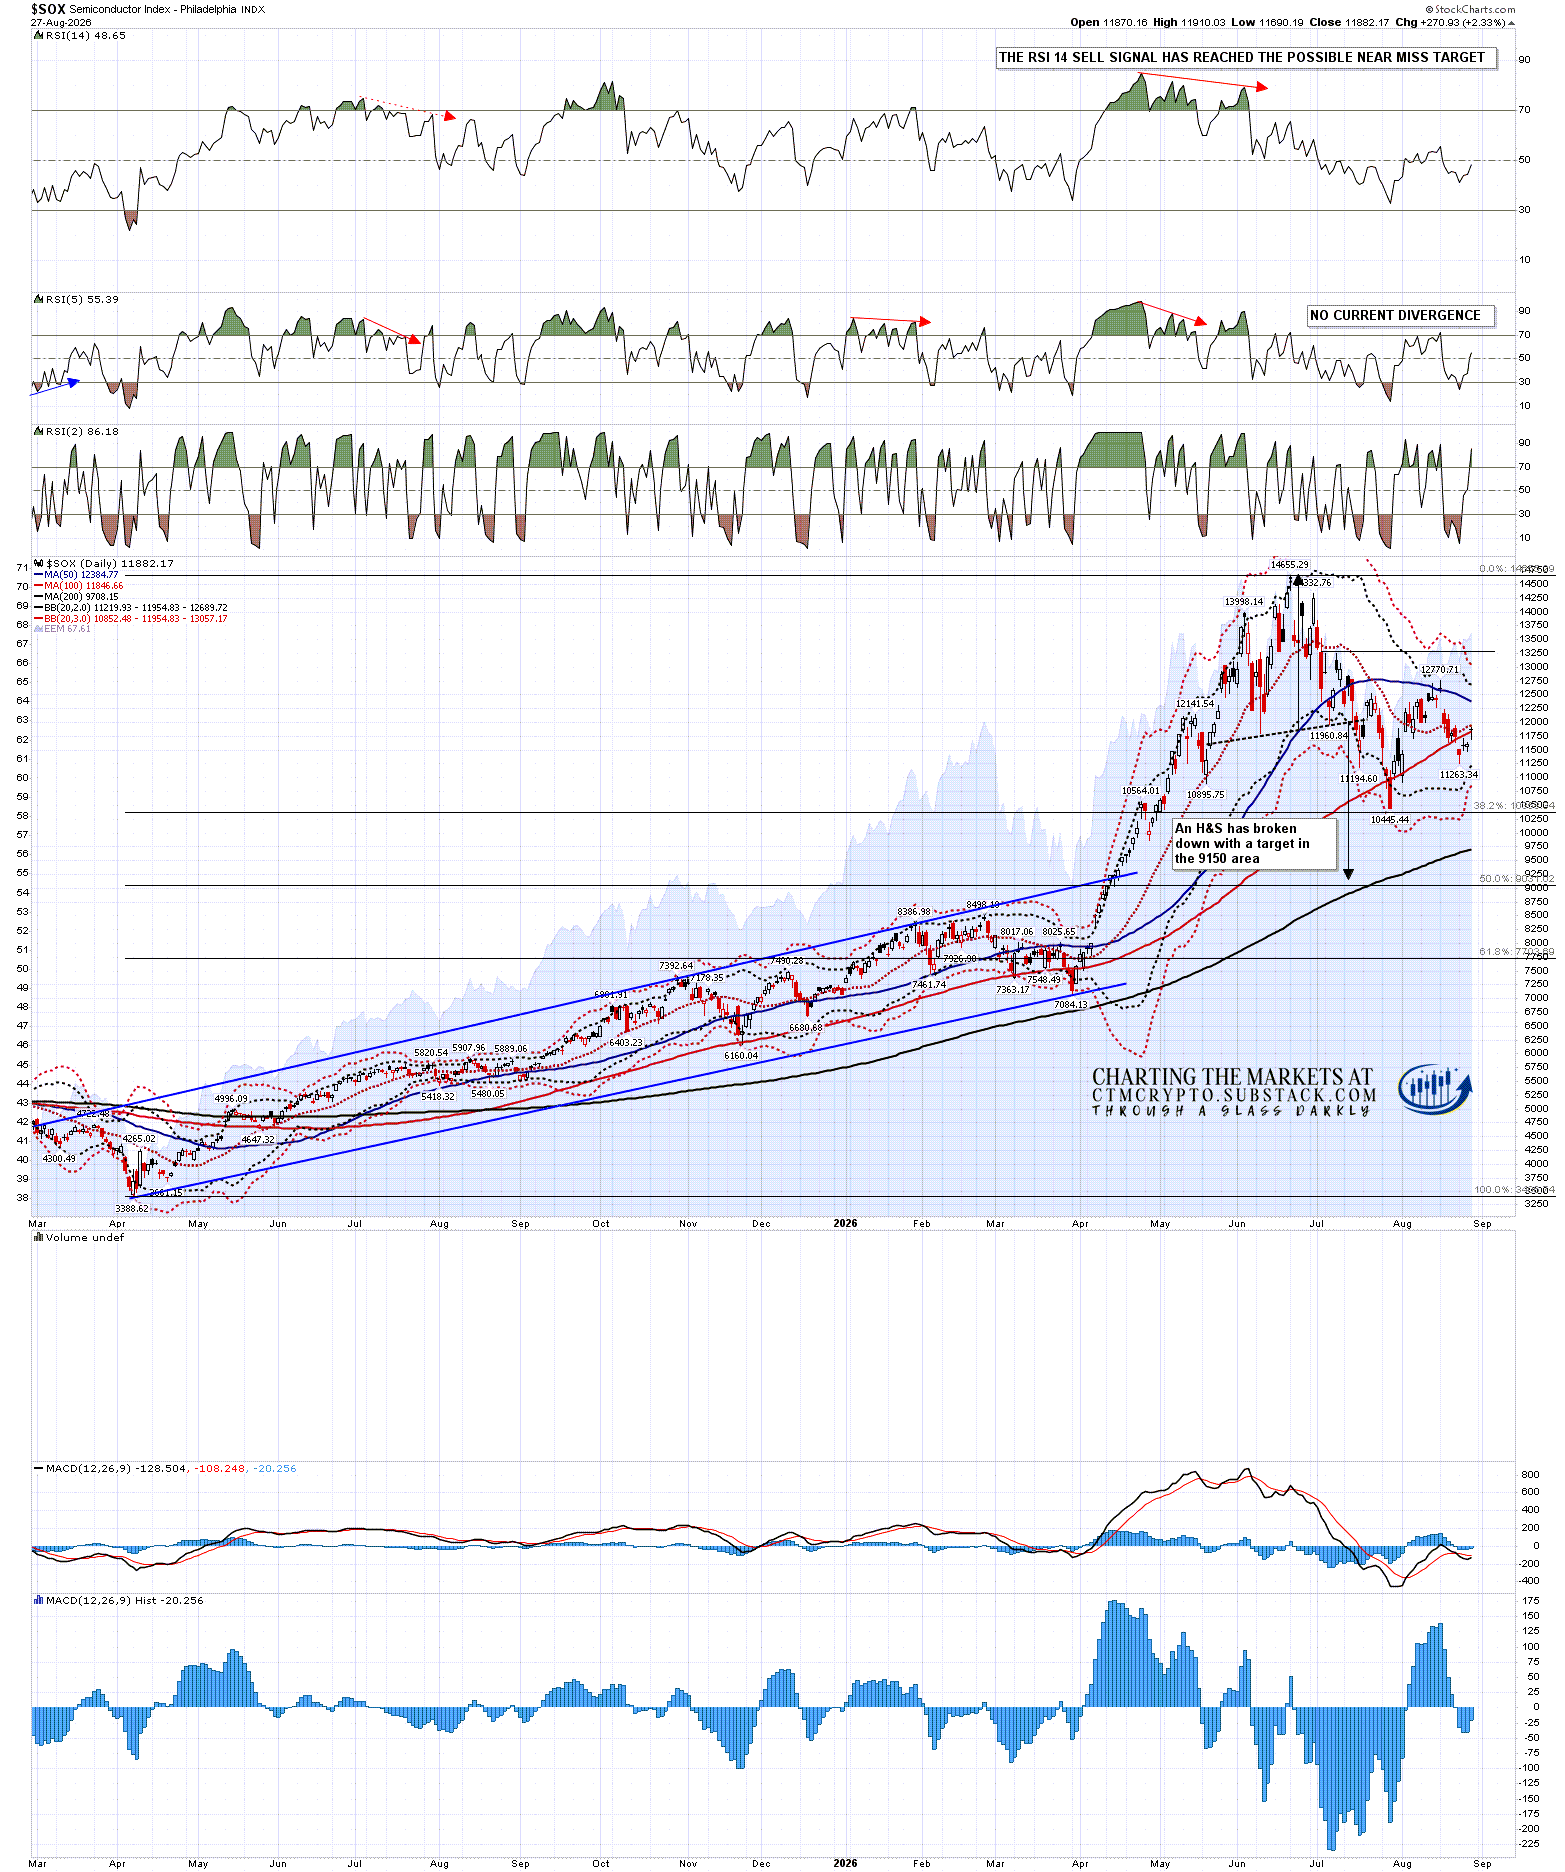
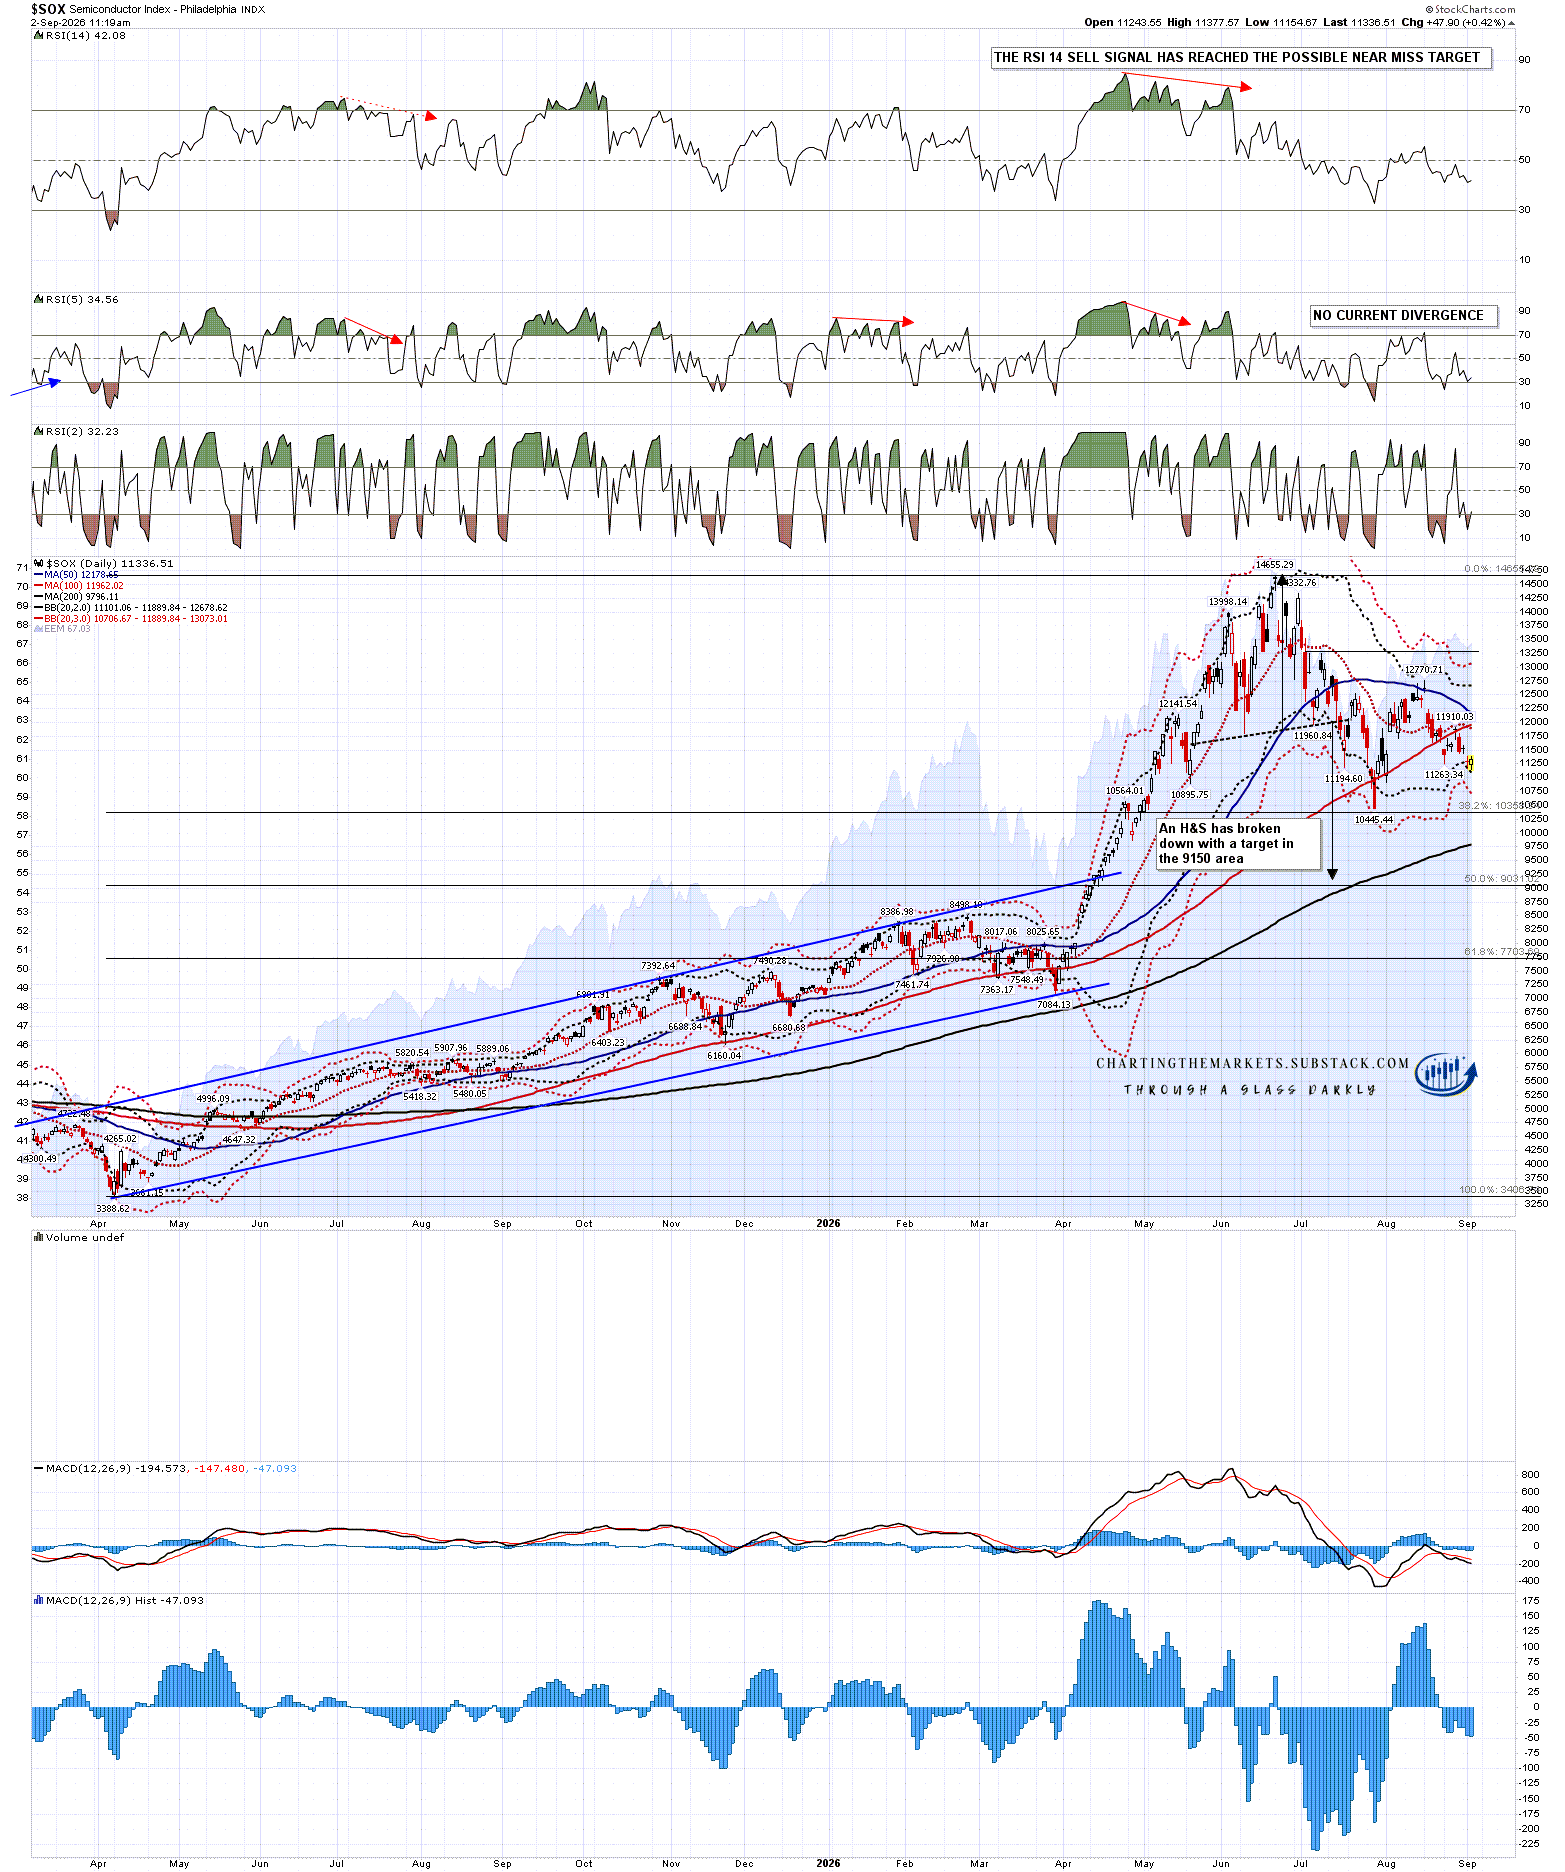
Of those three topping patterns the high quality H&S on Nikkei failed on Friday but the topping patterns on SOX and QQQ remain intact. If we are going to see US indices go higher the obvious driver for that move would be AI & Tech generally so I have been watching SOX with particular interest, and there we have seen a thorough backtest of the 50dma which has held so far. The H&S right shoulder high is at 13,249.07 and if that fails to hold as resistance the target would be an all time high retest but so far that has not been in danger of failing:

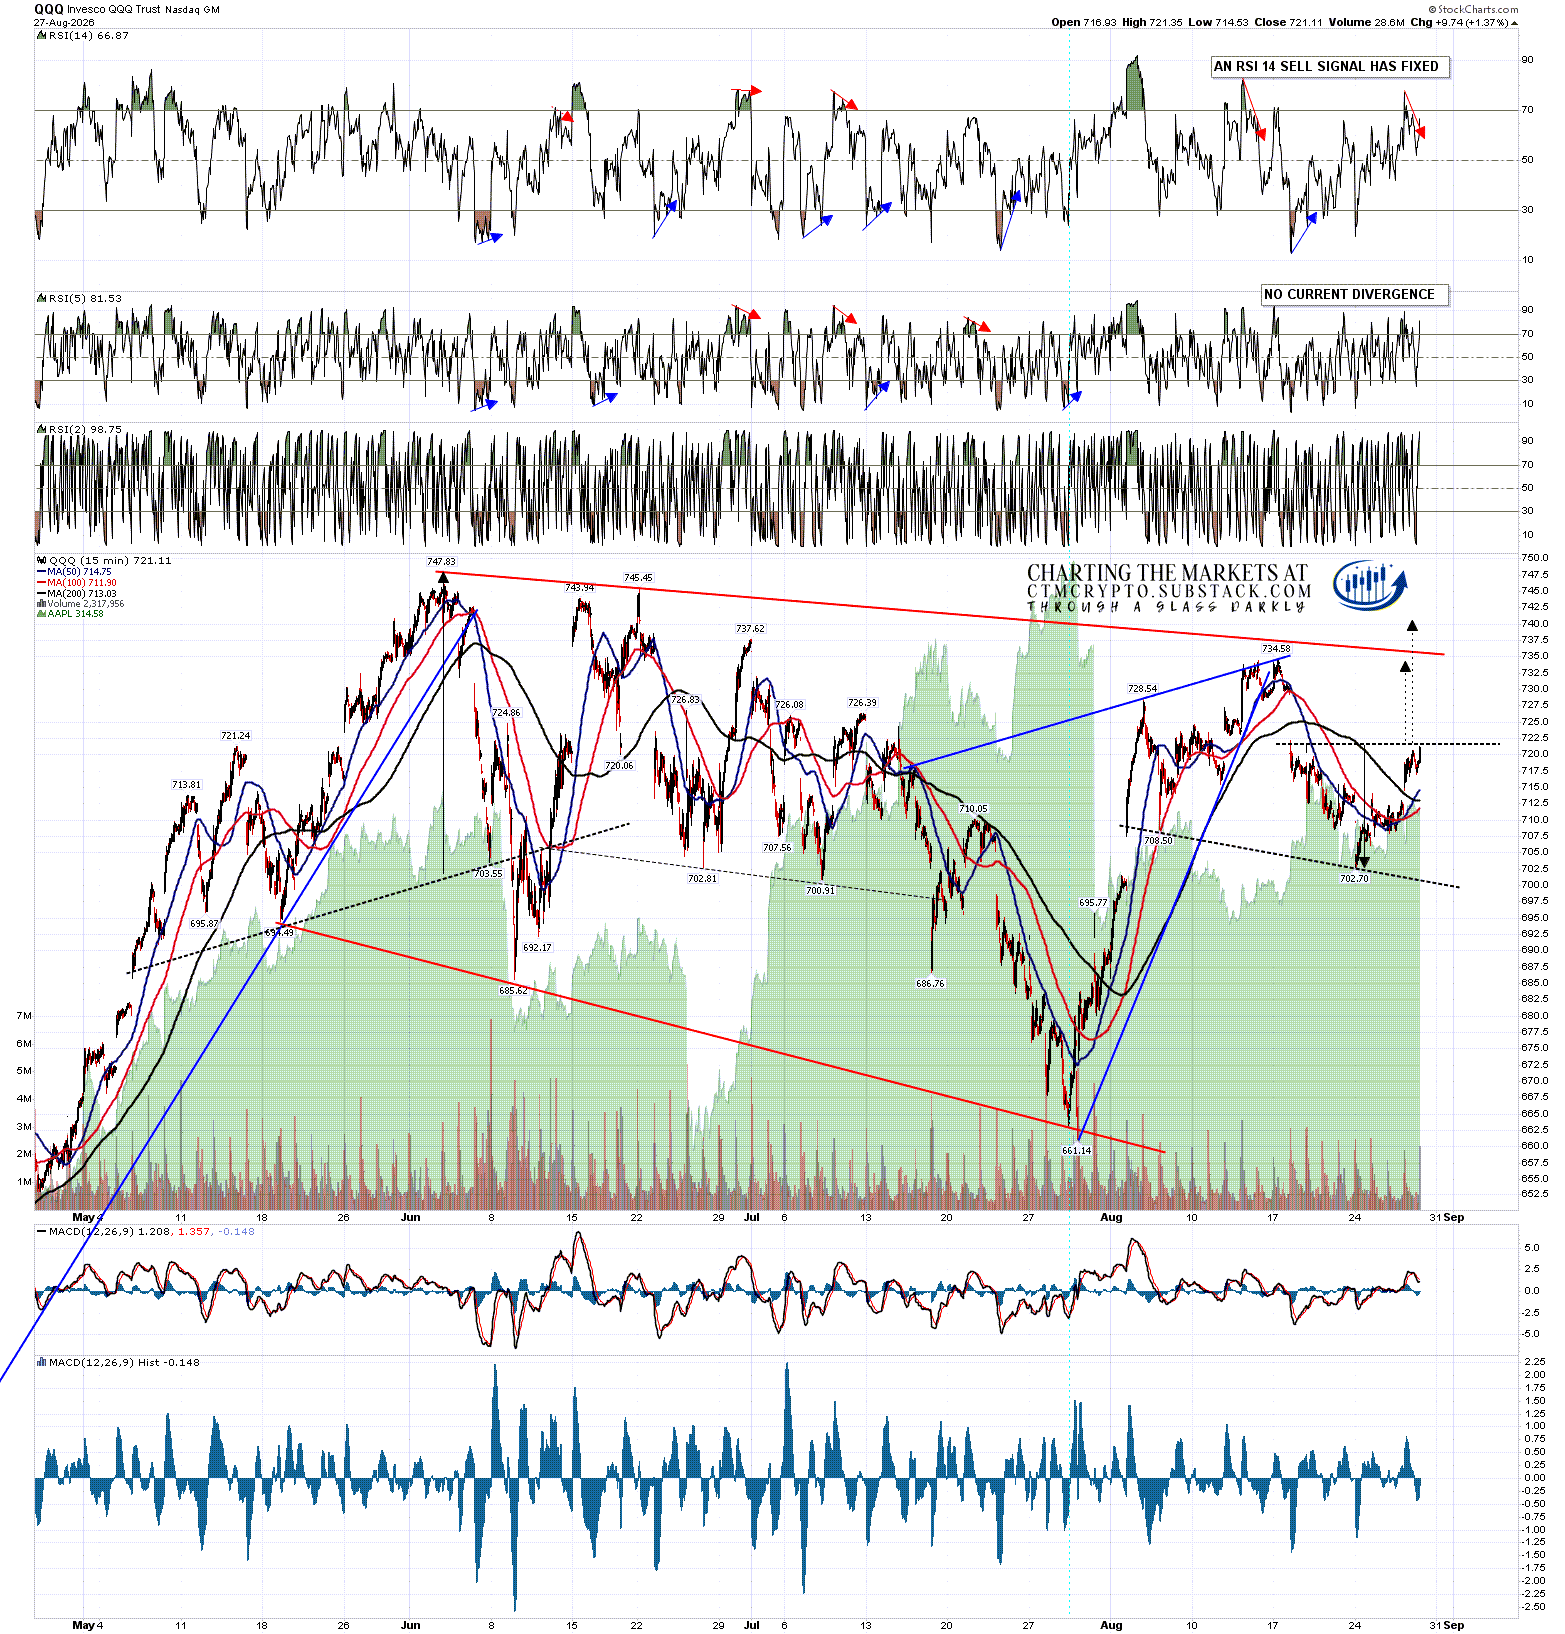
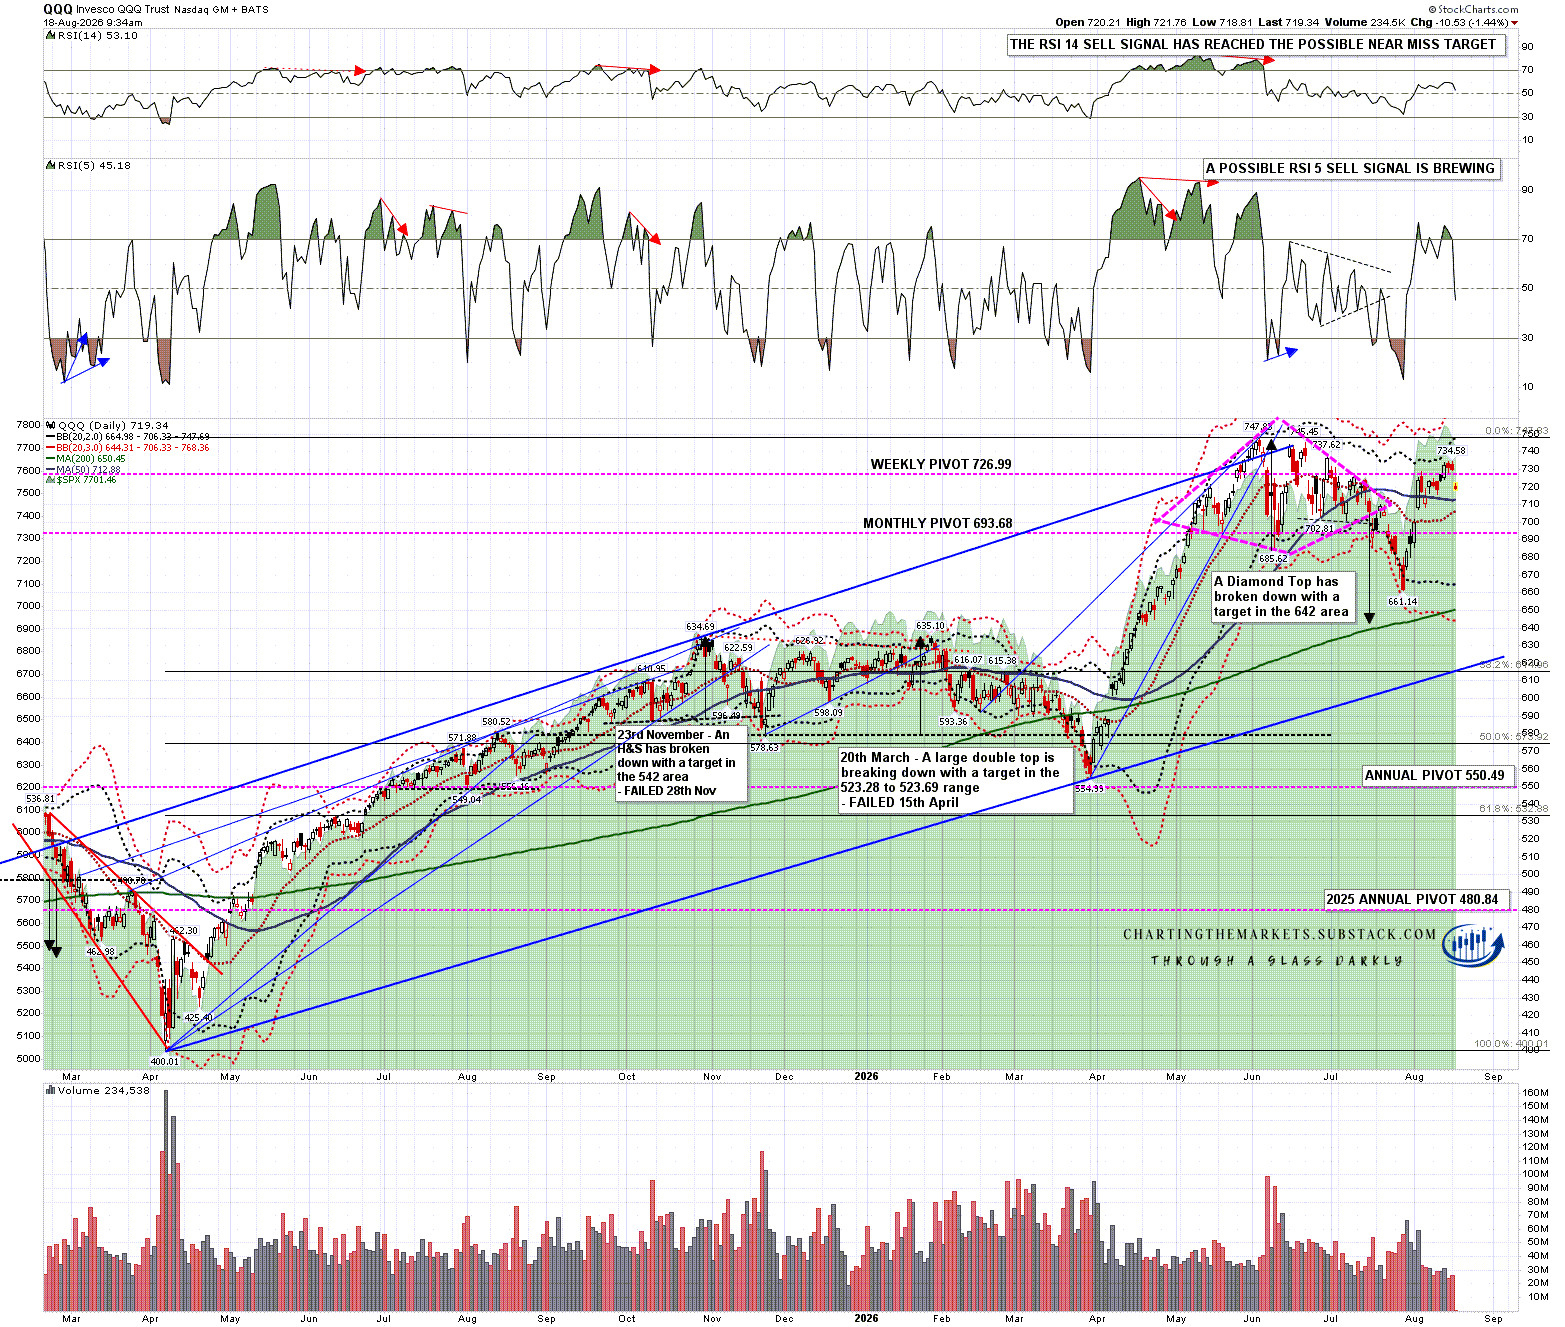
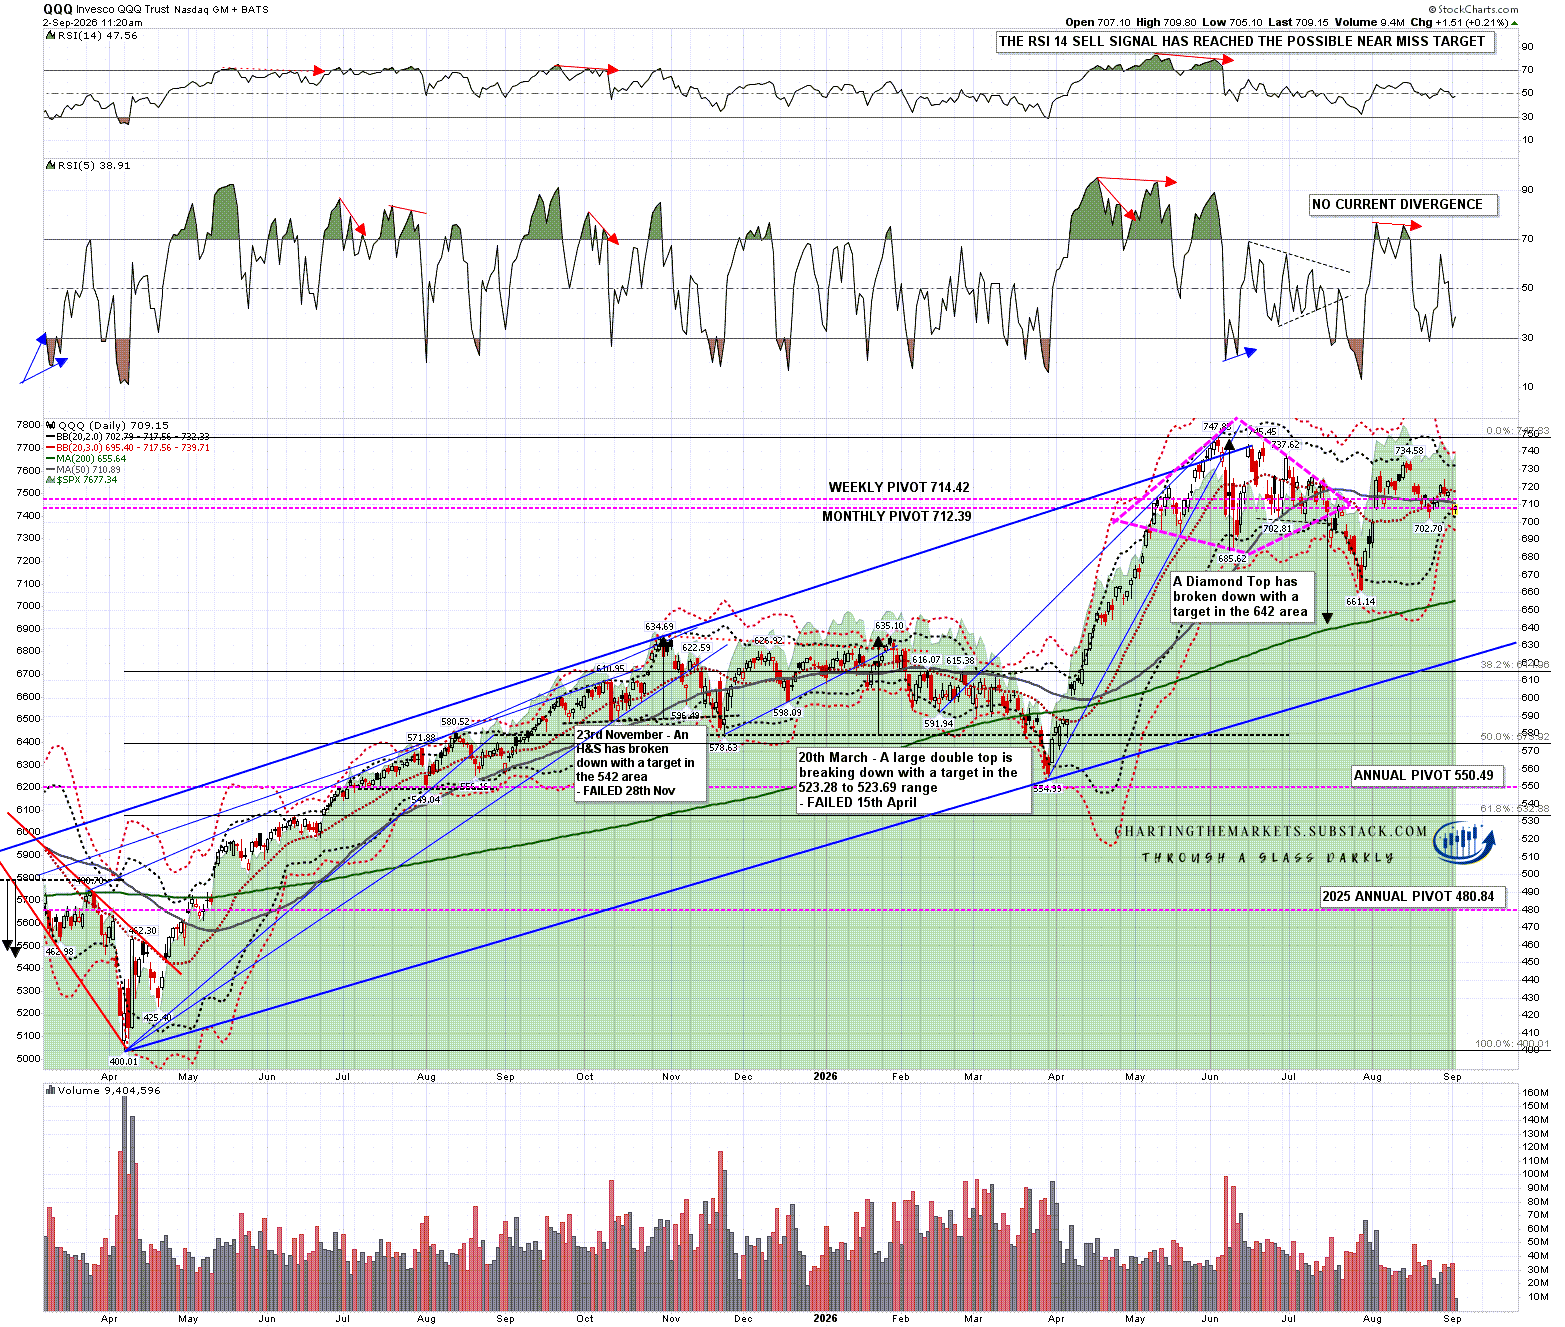
The QQQ diamond top would only fail on the retest of the all time high and has not come that close to that yet. This isn’t as important though as a retest of the all time high would initially just set up a possible alternate double top.

QQQ daily chart:

It is DIA, SPX and IWM that are particularly interesting here in terms of a possible further leg up in this seemingly endless bull market. All of these have significant and decent quality resistance trendlines from the April 2025 low that would need to be broken to open up a serious move higher.

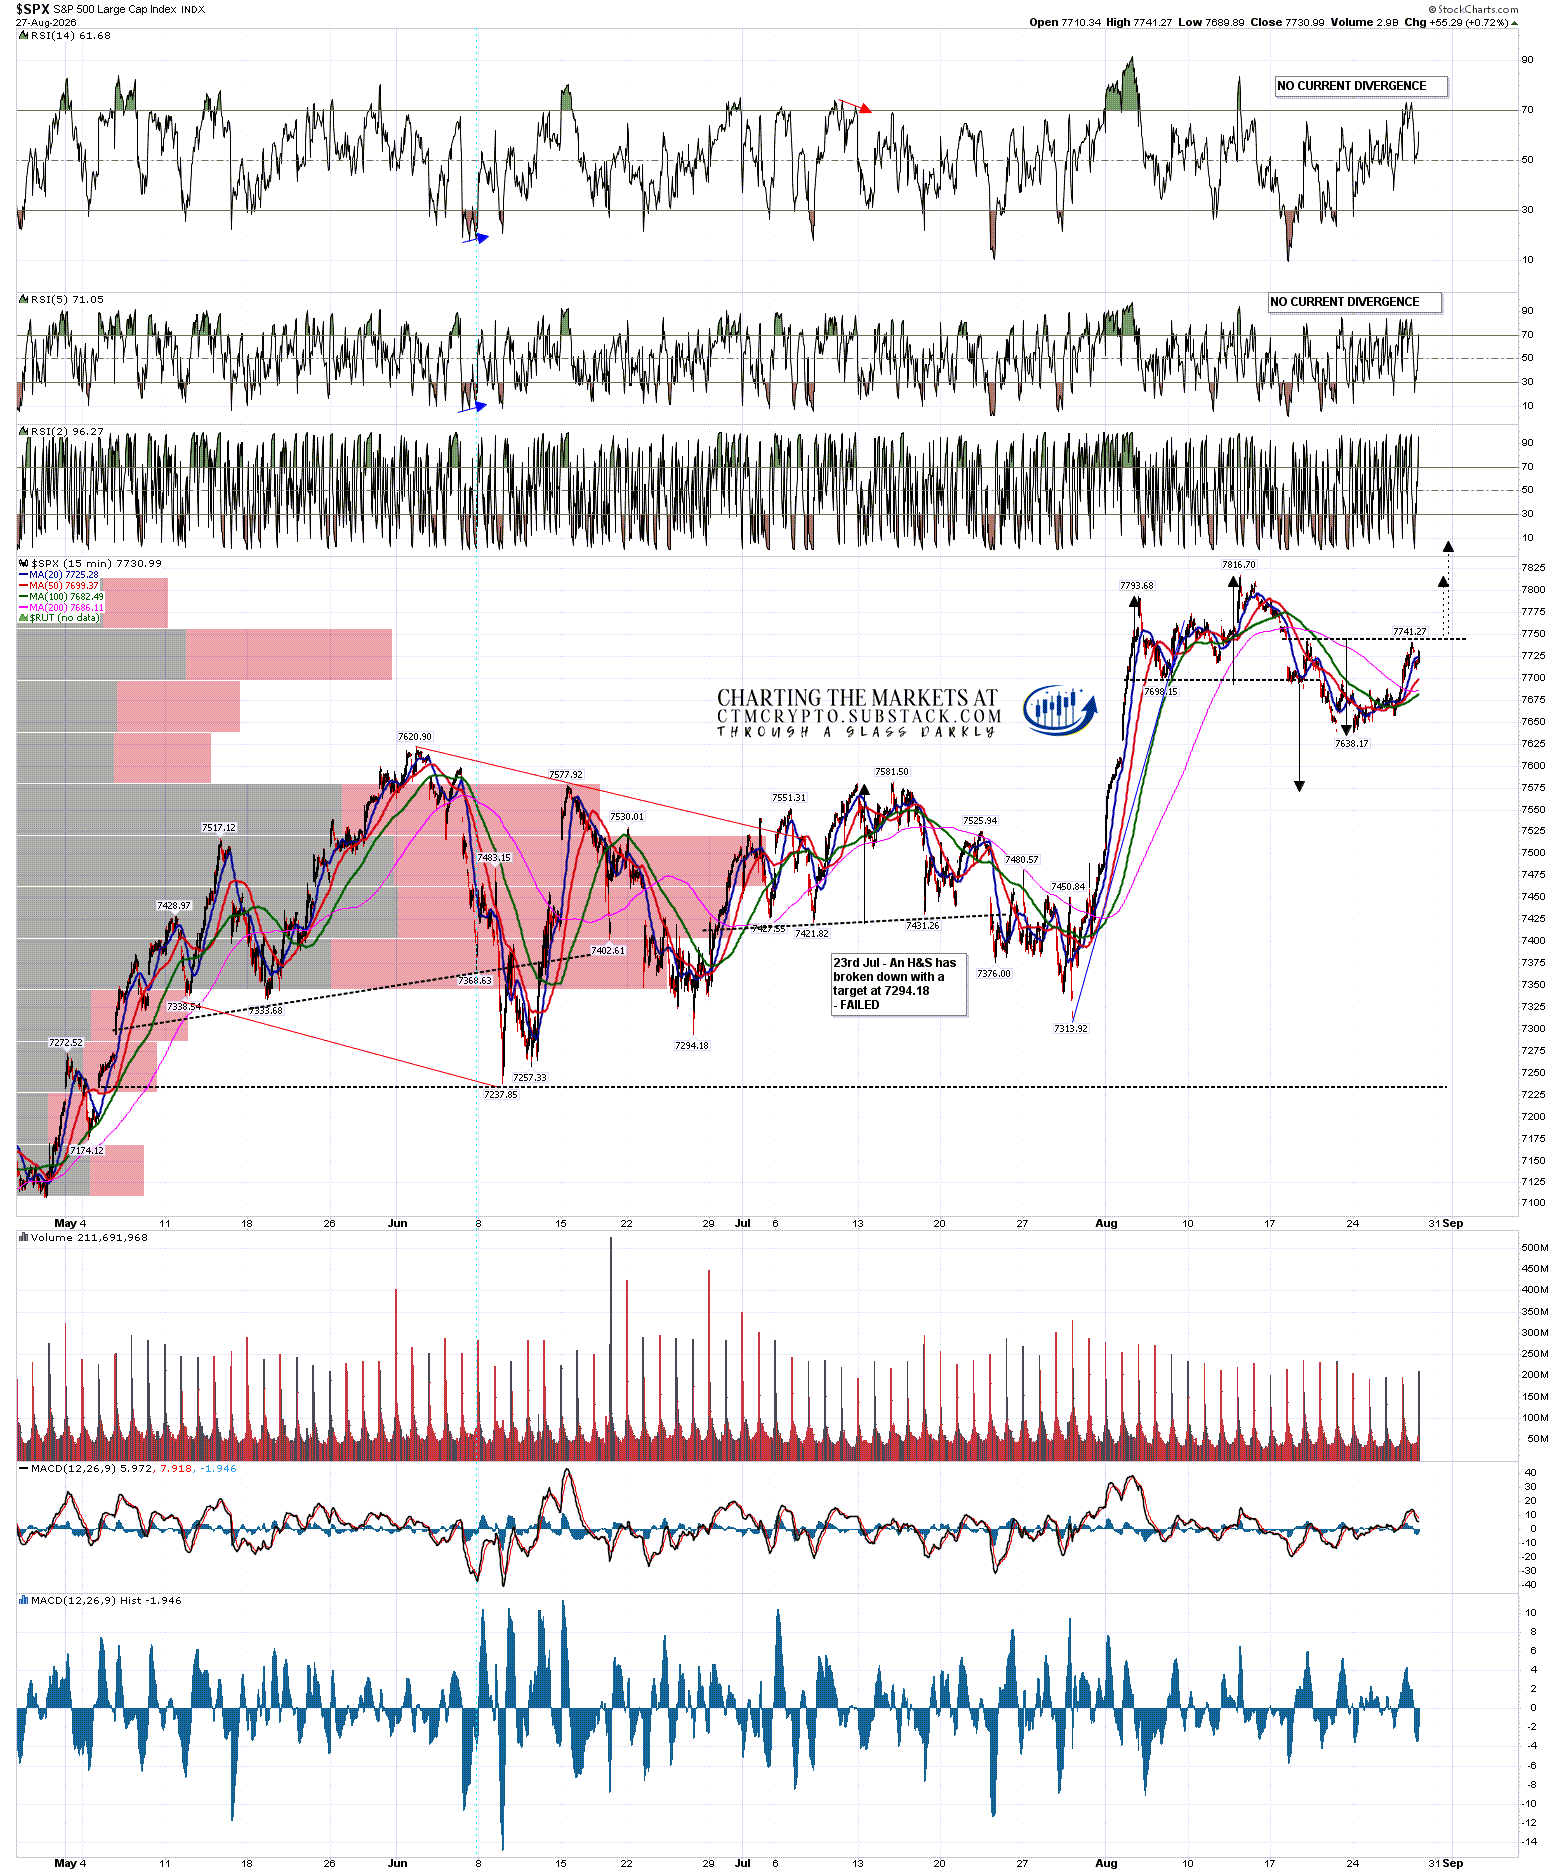
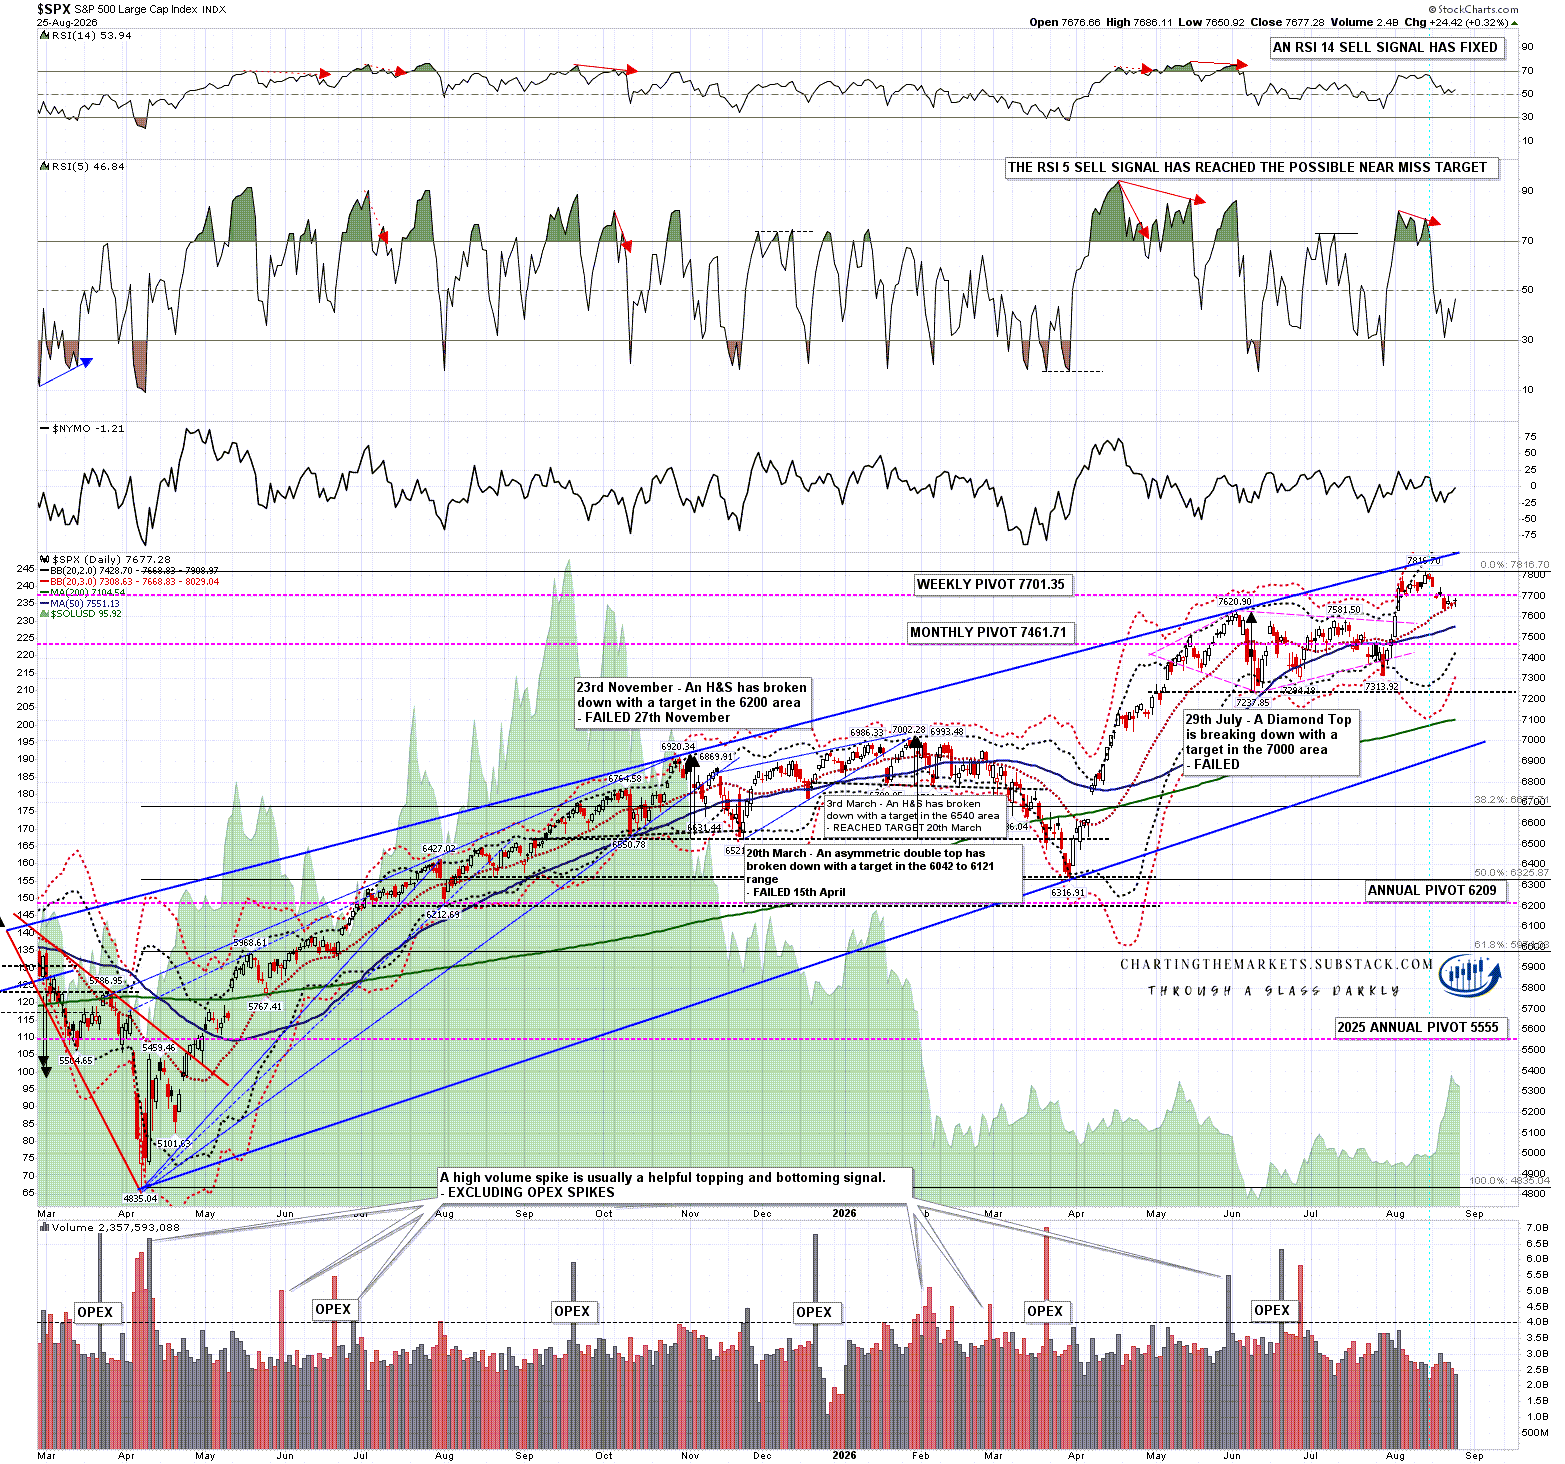
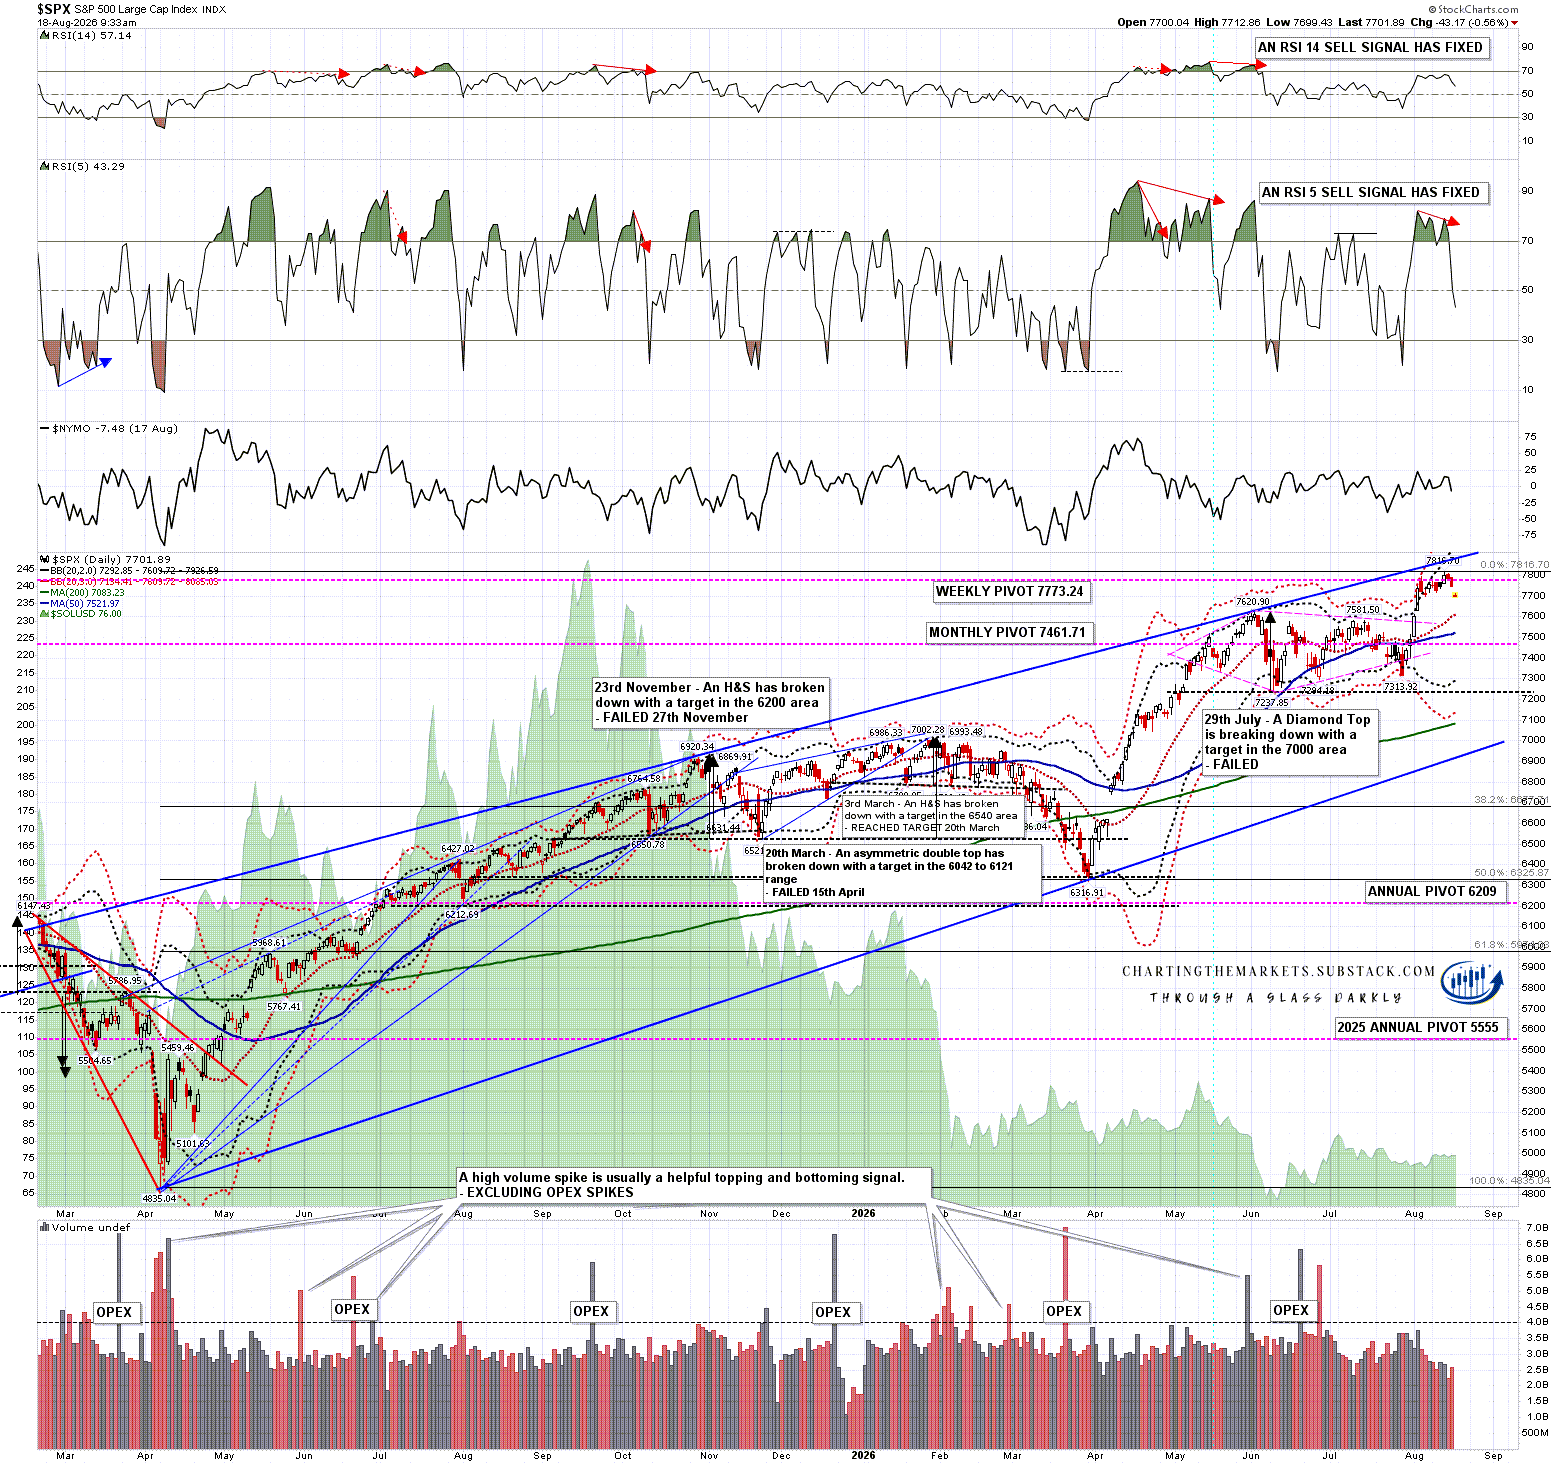
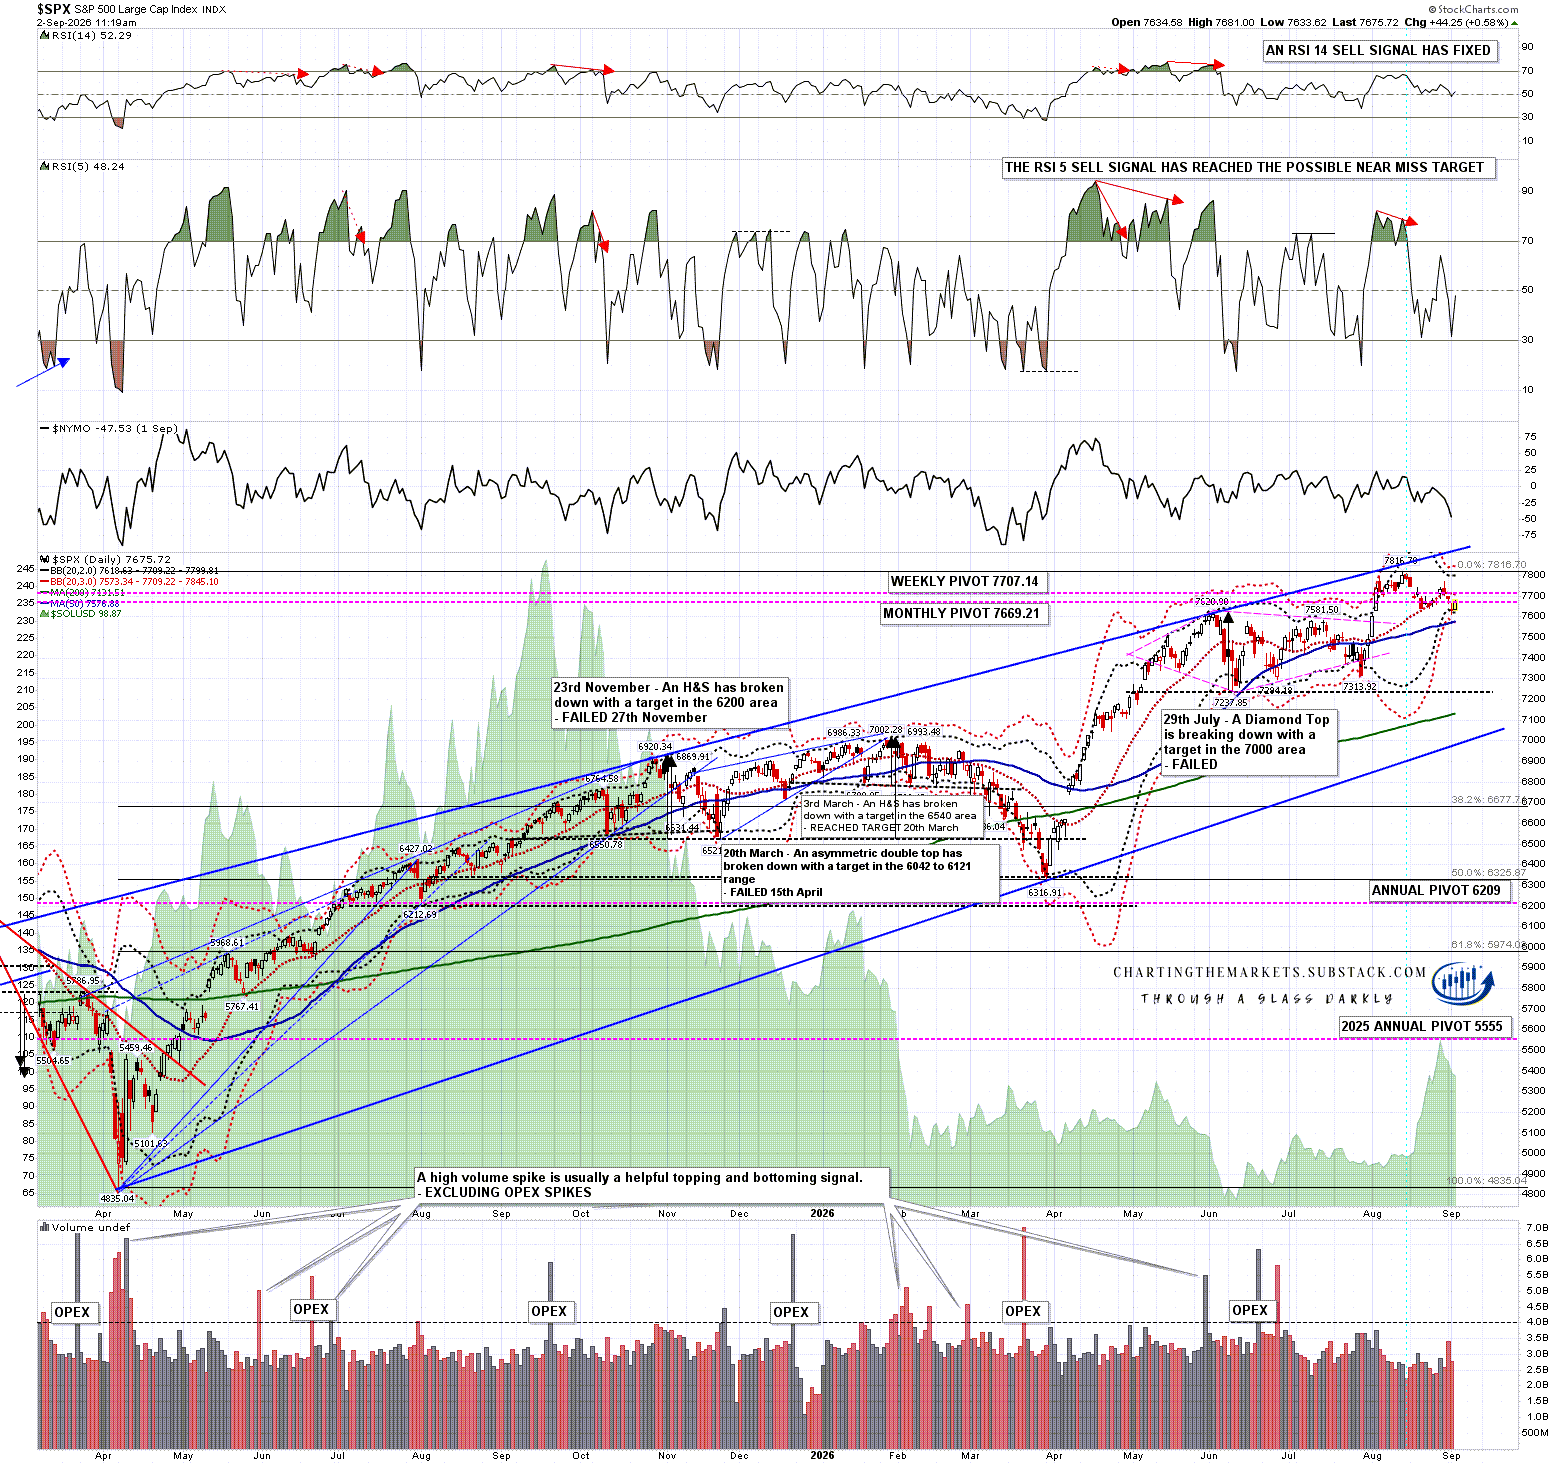
Looking at SPX I have a strong rising wedge resistance trendline currently in the 7860-70 area. If that isn’t going to break then the next obvious target within the rising wedge would be wedge support, currently in the 6930 area.

In the short term a daily RSI 5 sell signal fixed last night, I’m wondering about a possible backtest of the daily middle band currently at 7610, and a small double top is trying to break down with a target in the 7580-7603 range.

SPX daily chart:

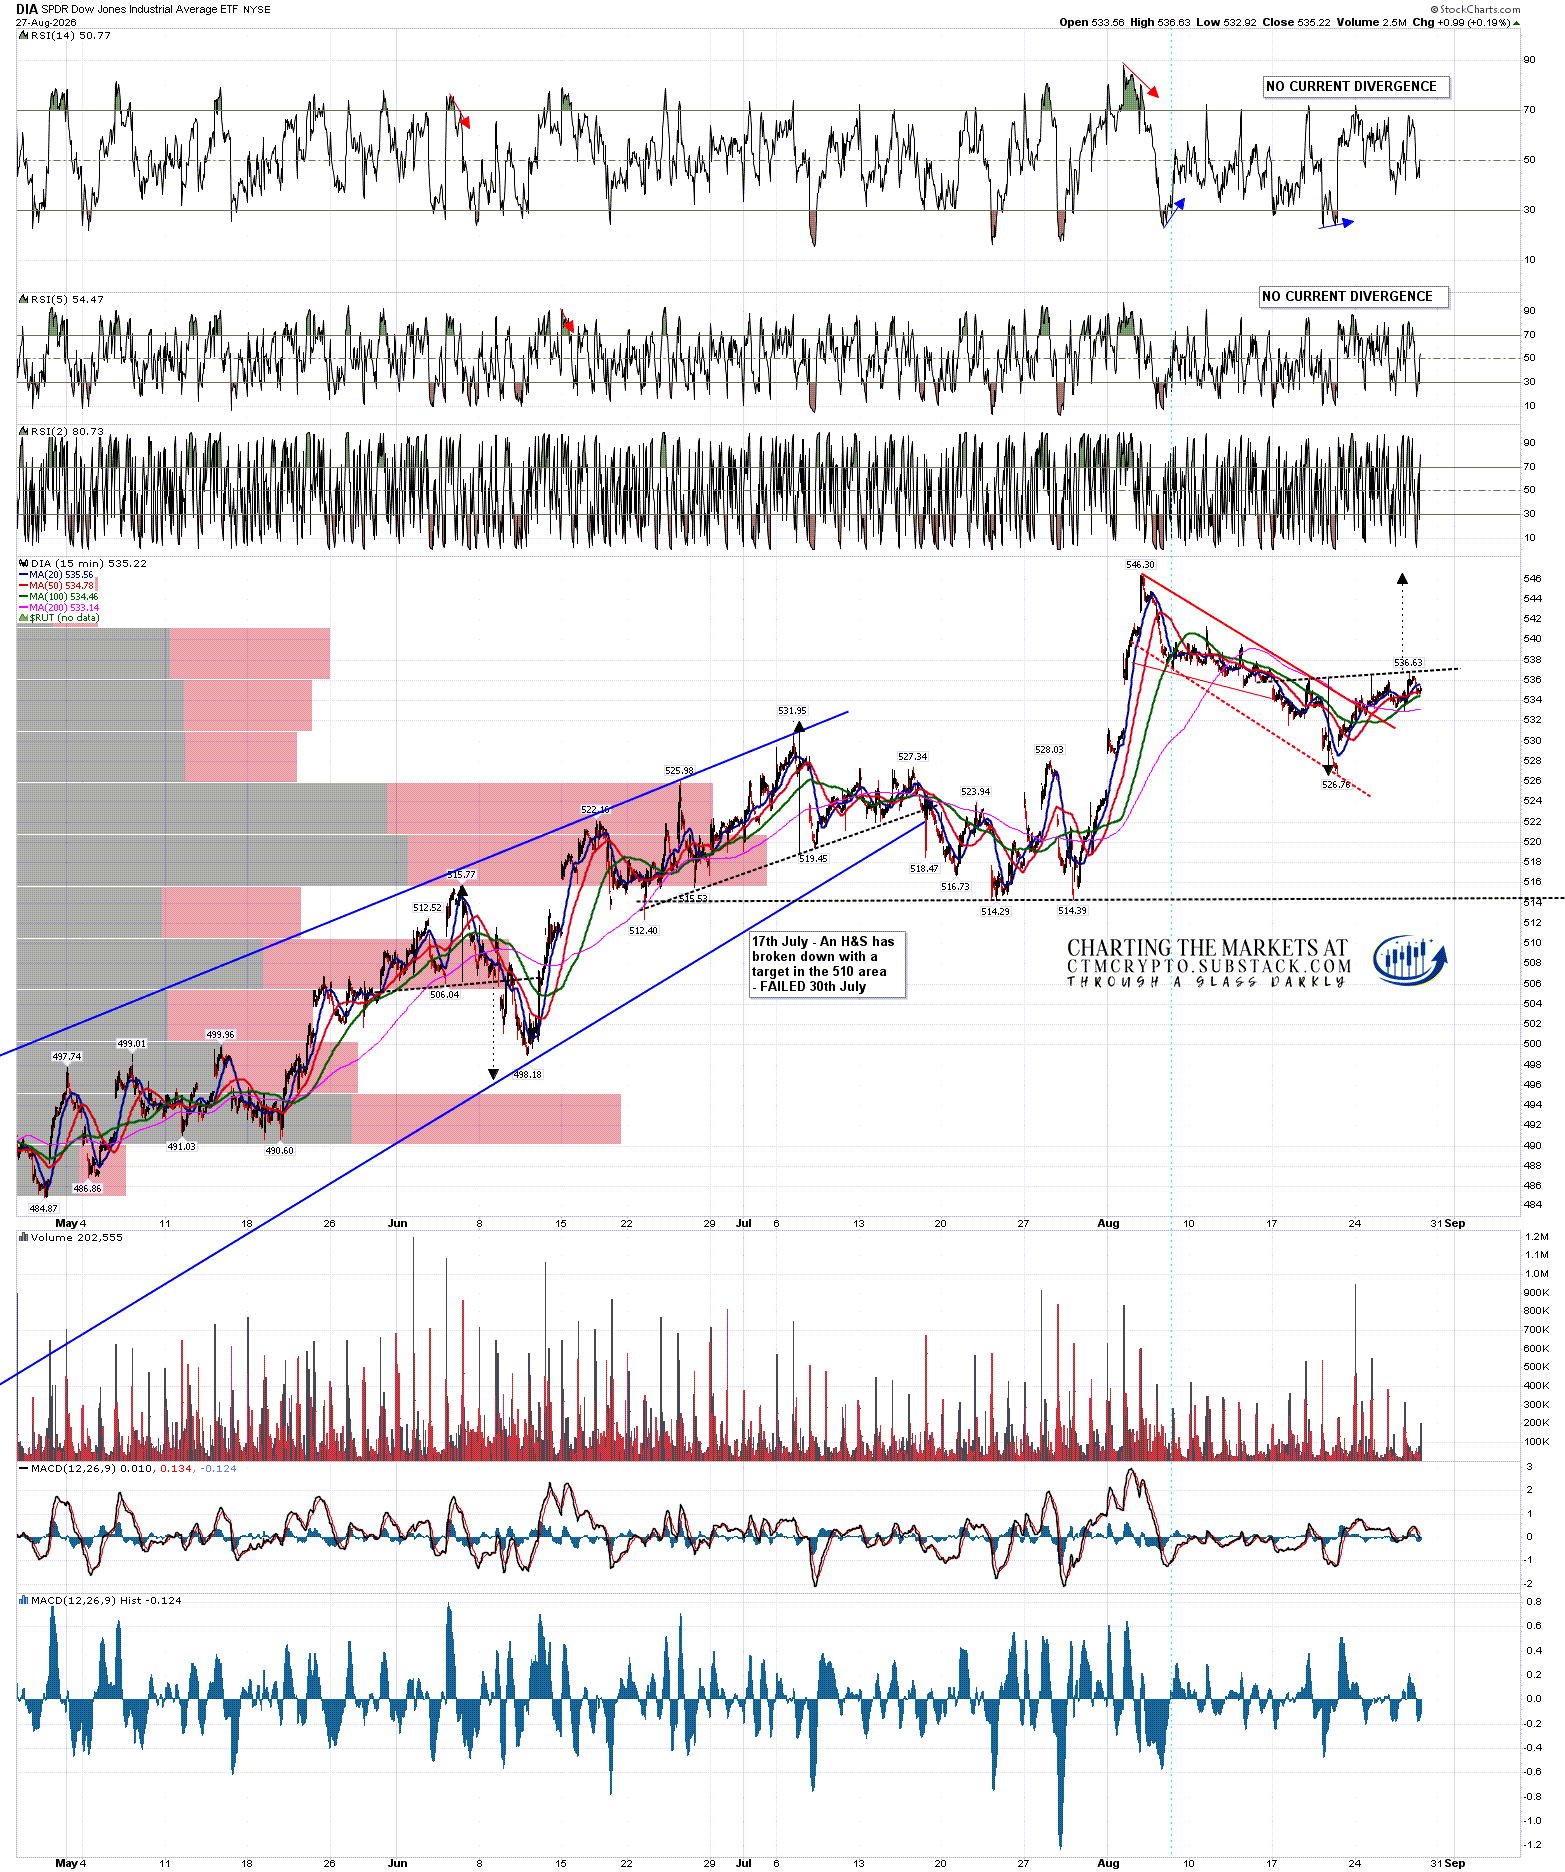
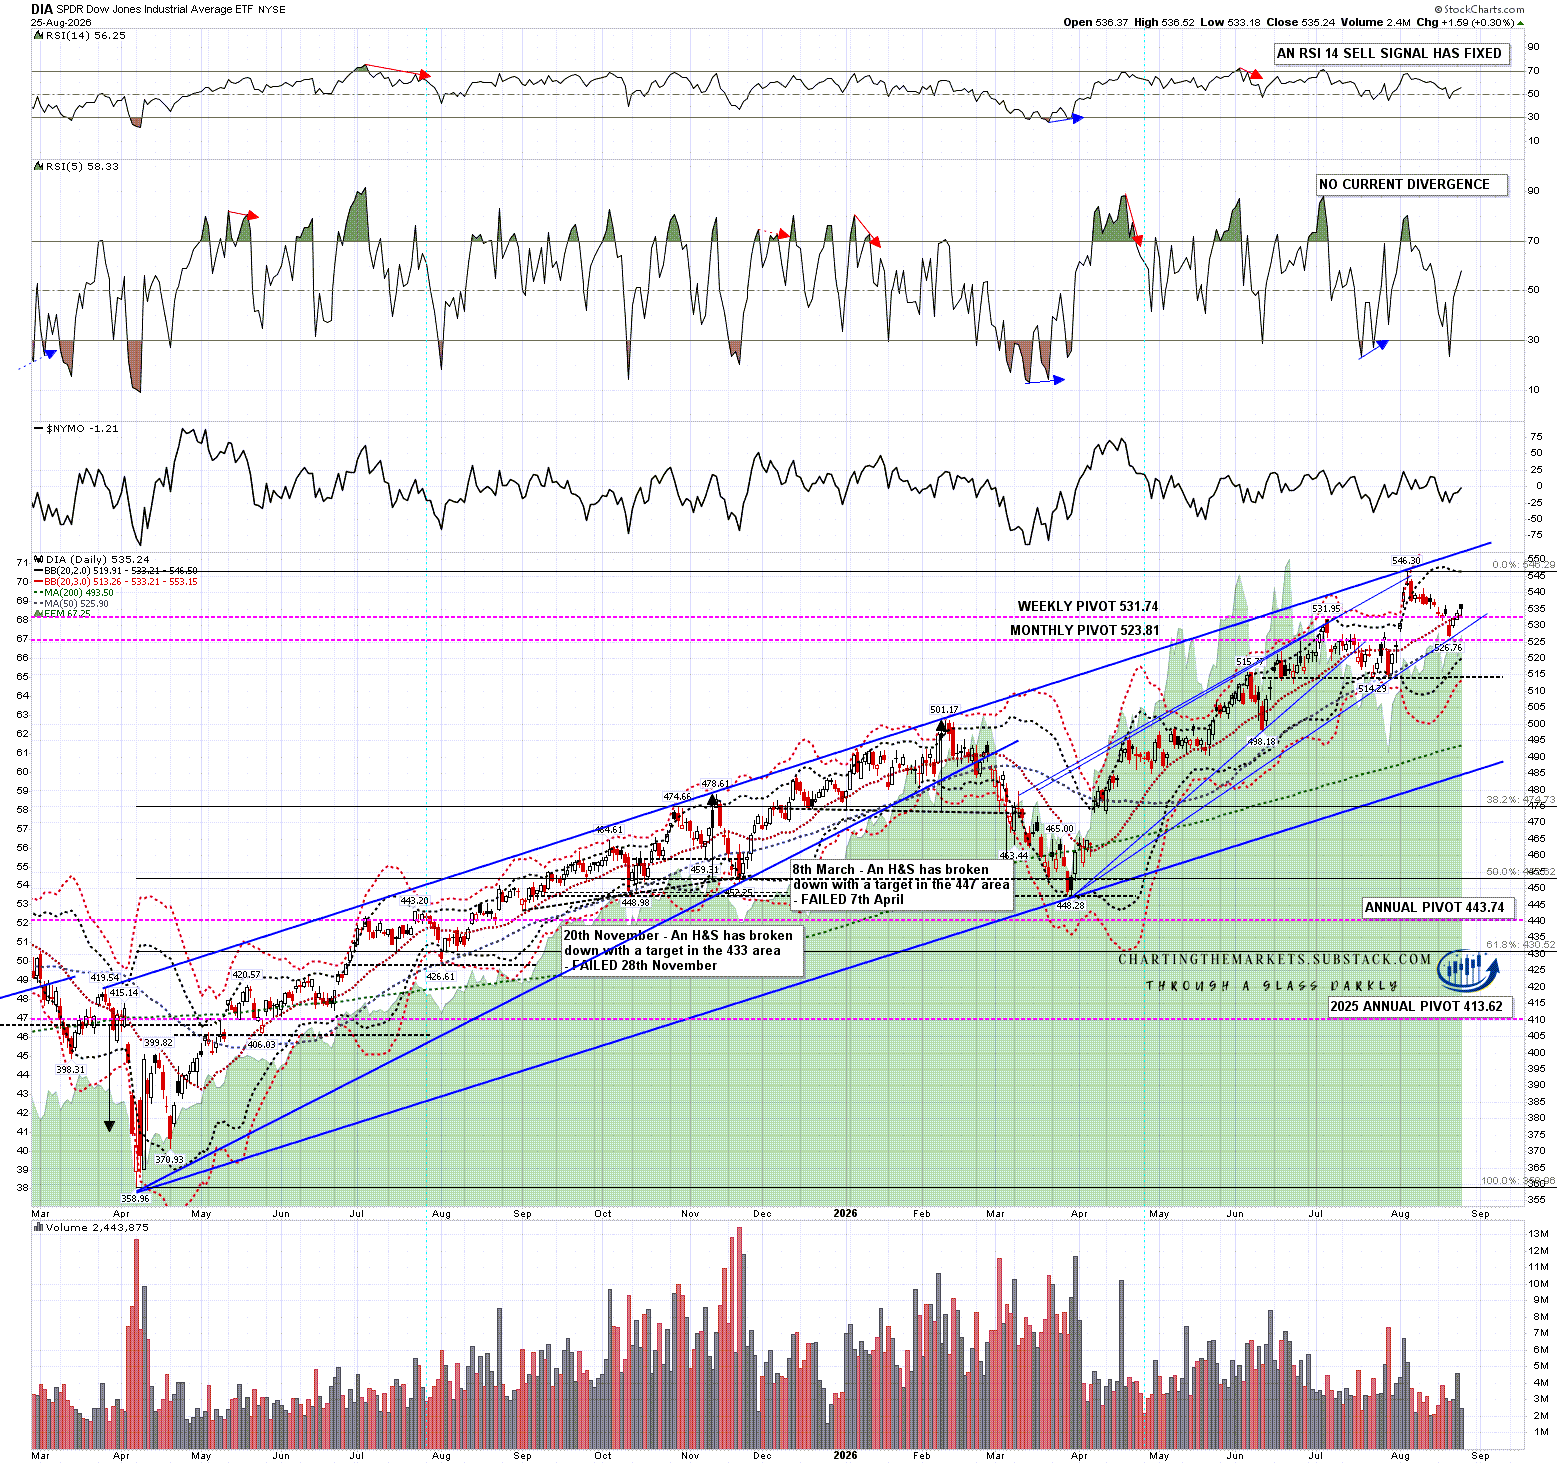
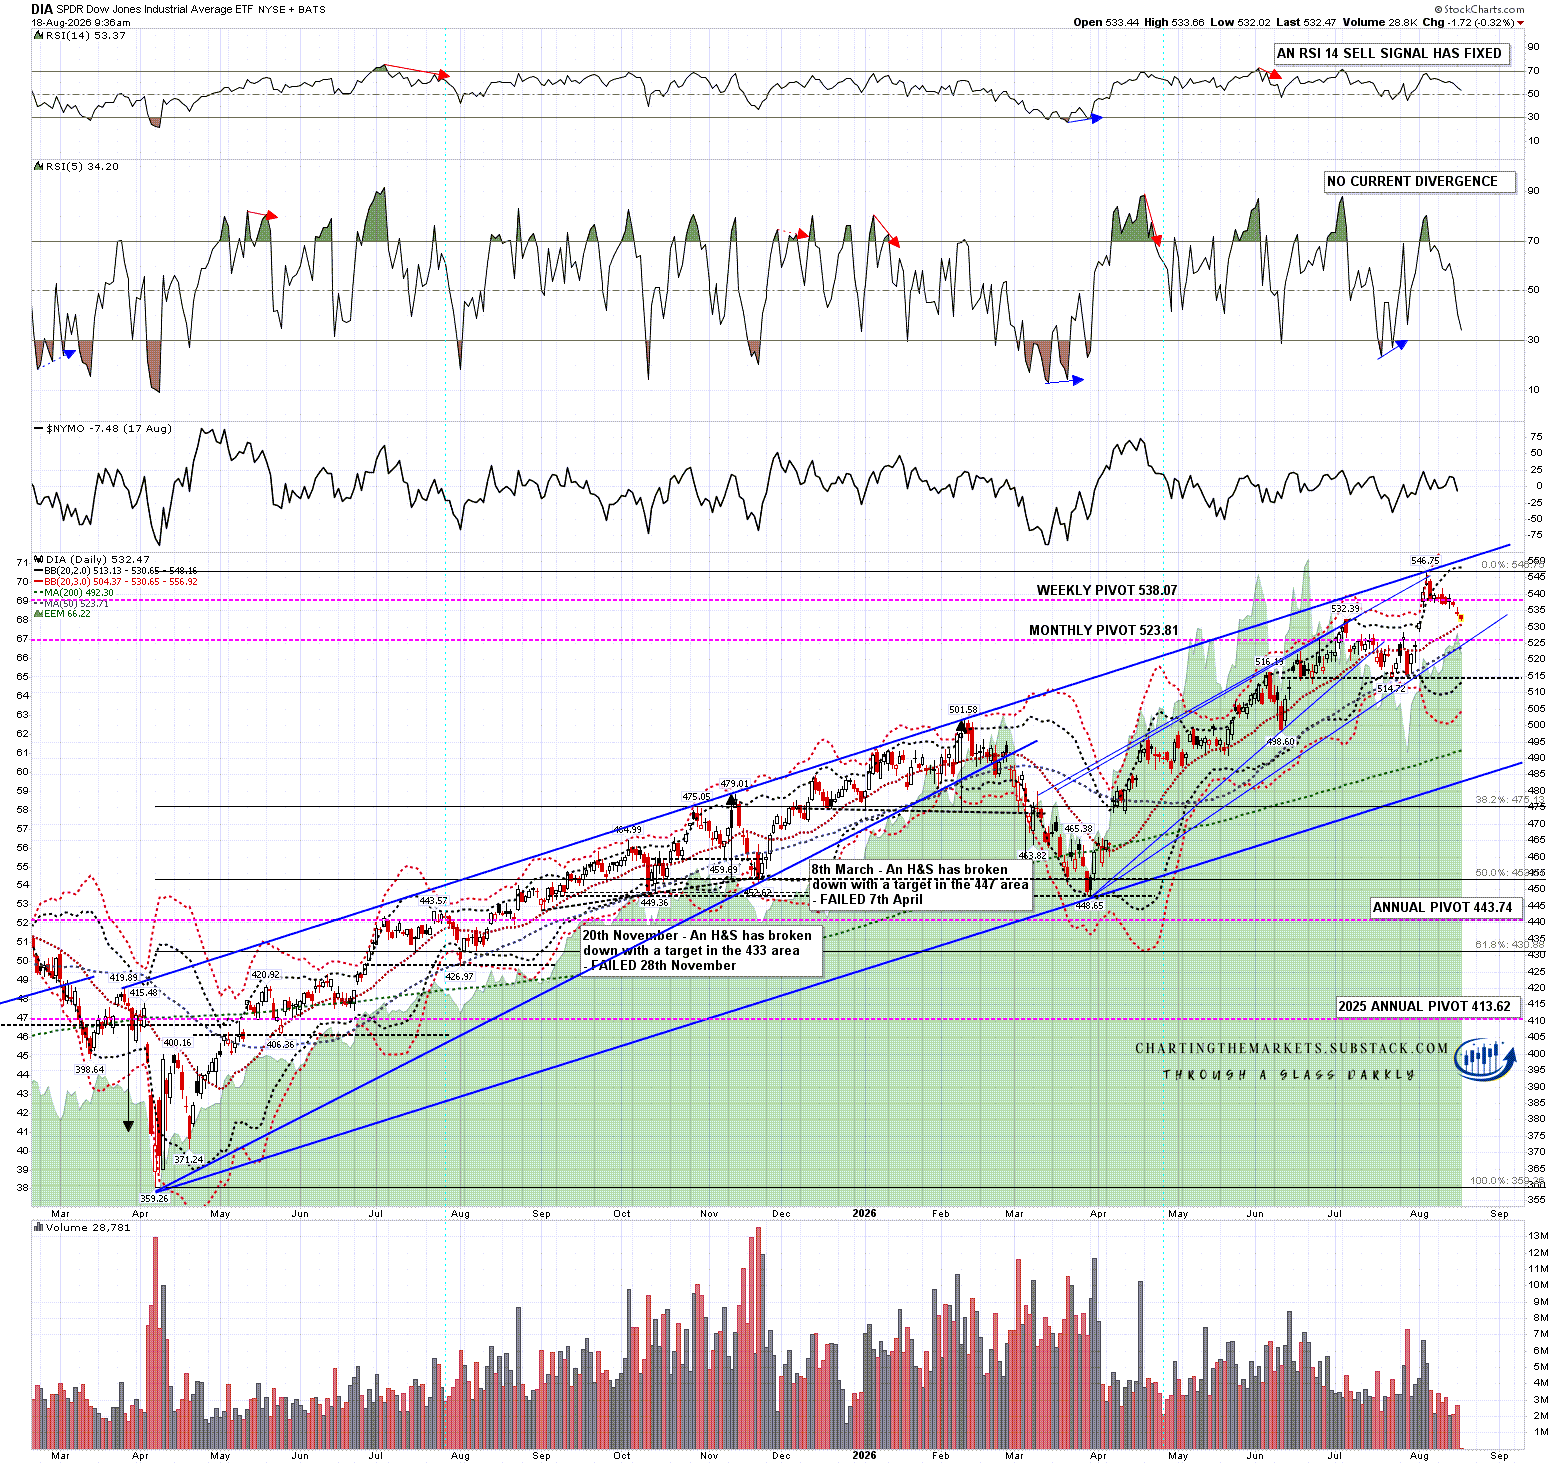
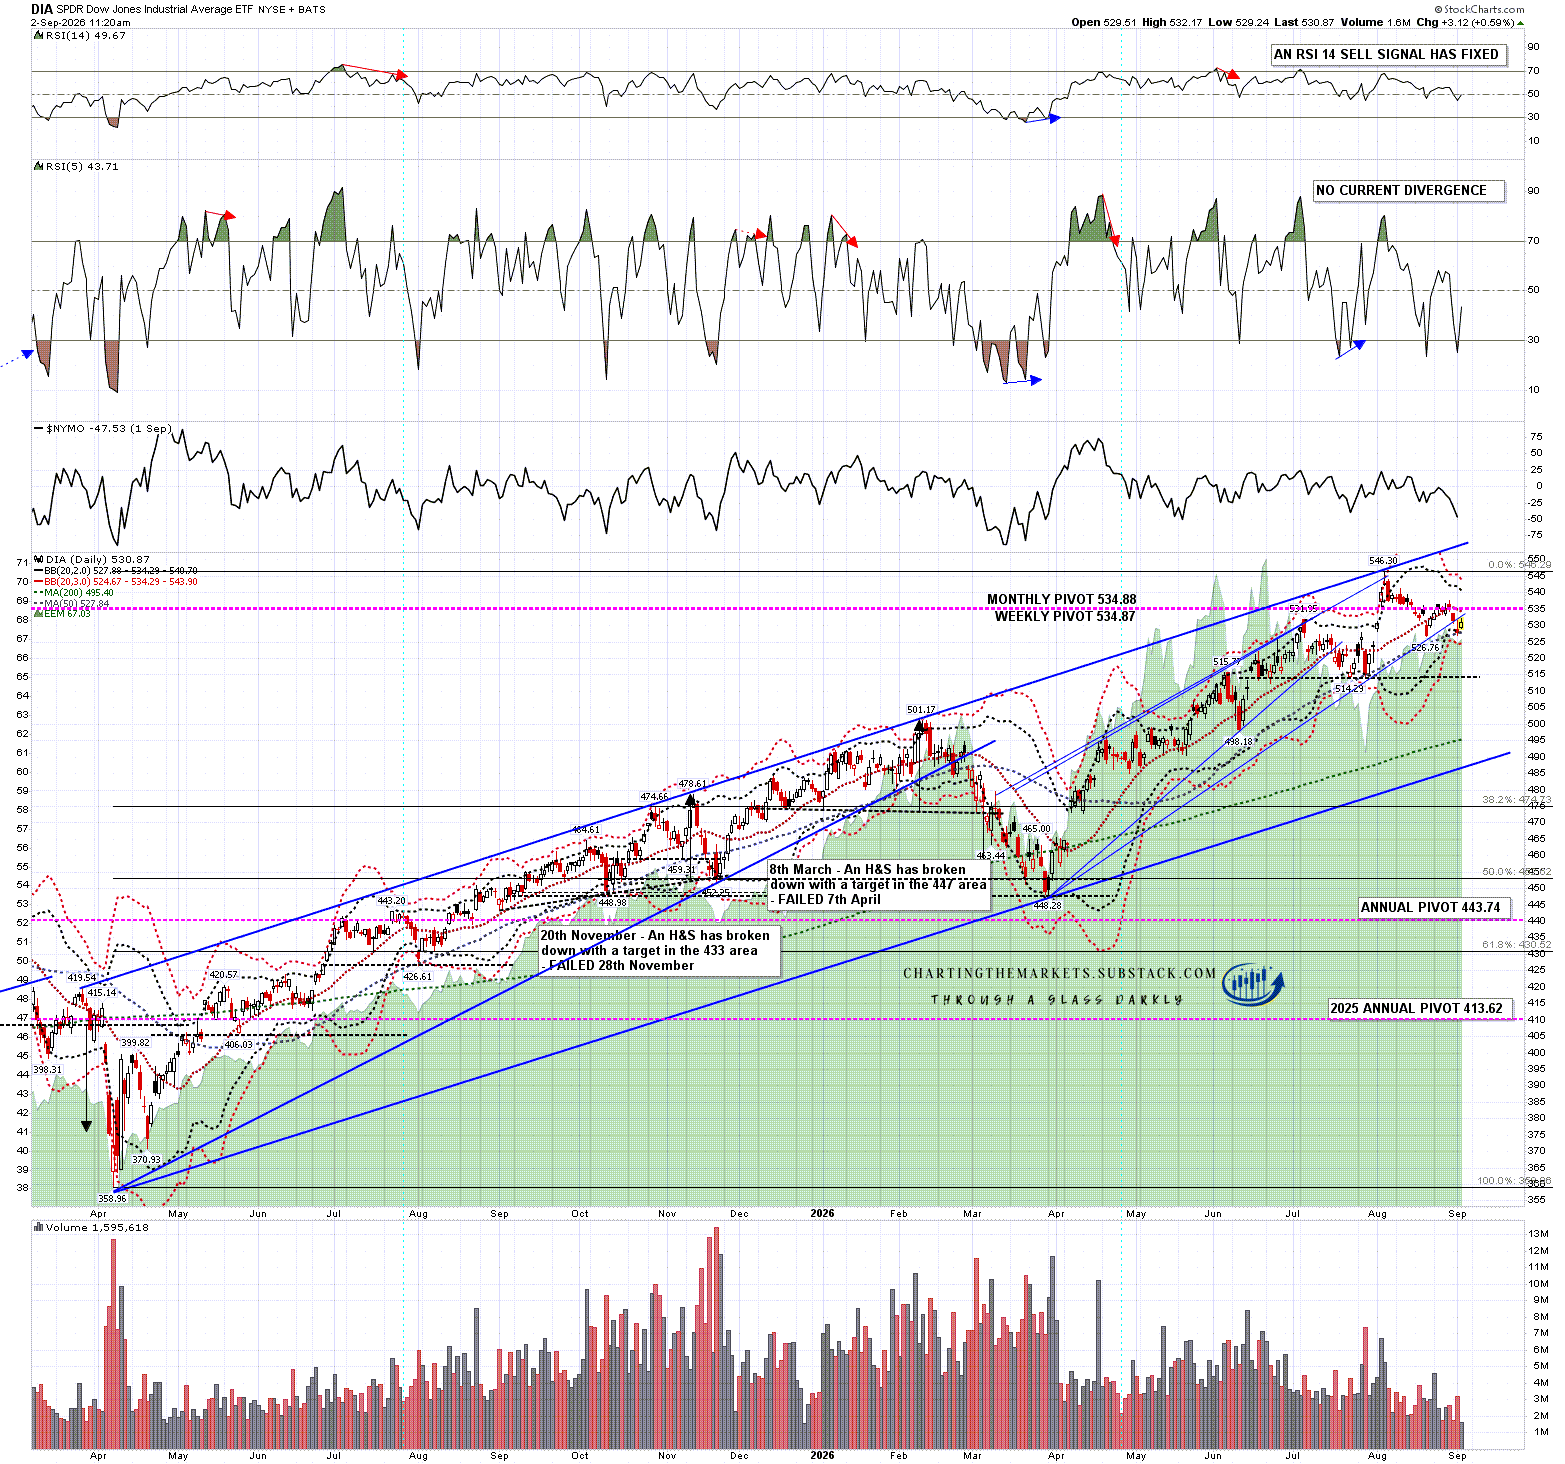
Looking at DIA I have a strong rising megaphone resistance trendline which was actually hit at the latest all time high. If that isn’t going to break then the next obvious target within the rising megaphone would be megaphone support, currently in the 483 area.

In the short term I have support at the daily middle band at 530.65, close to being backtested today, at rising support from the March low, currently at 524, and the 50dma, currently at 523.71.

DIA daily chart:

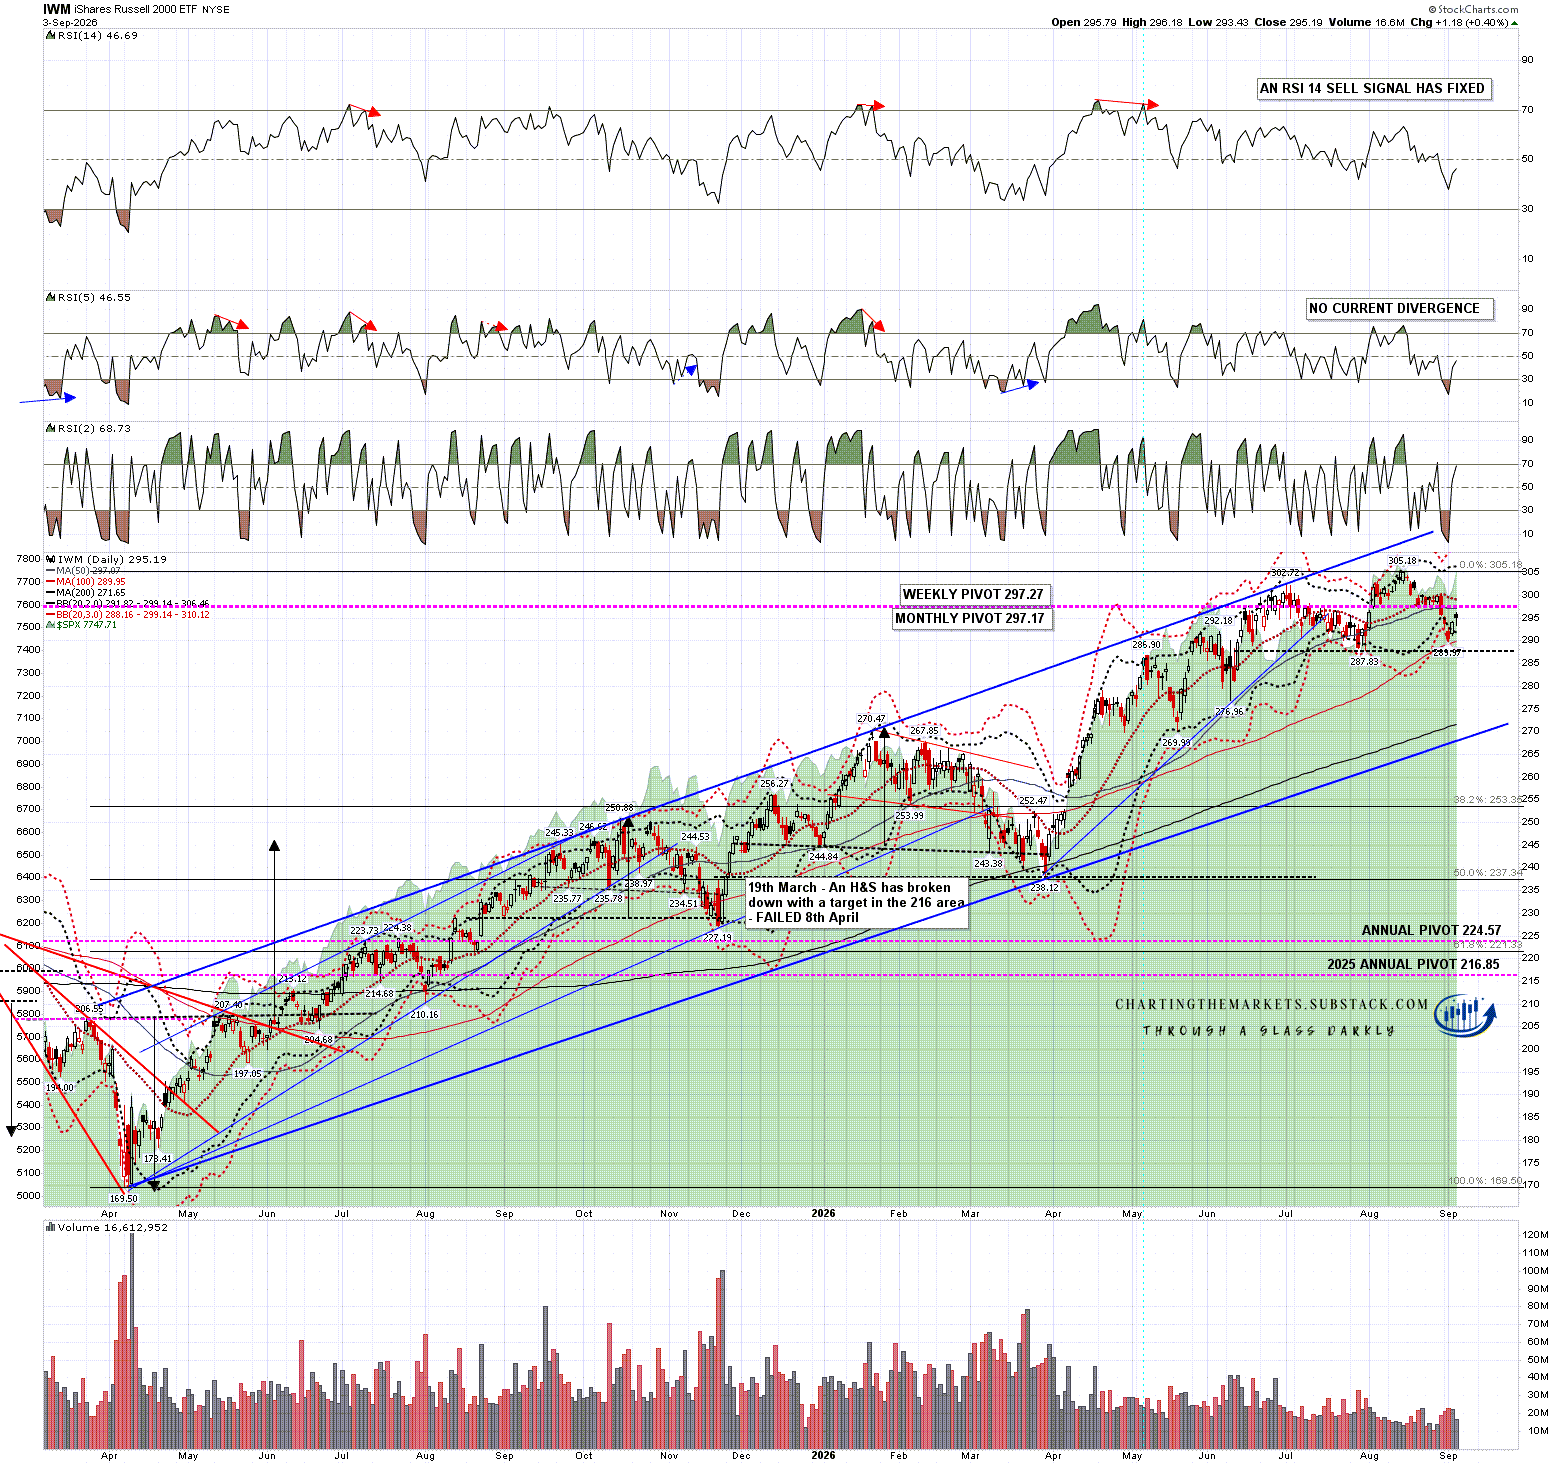
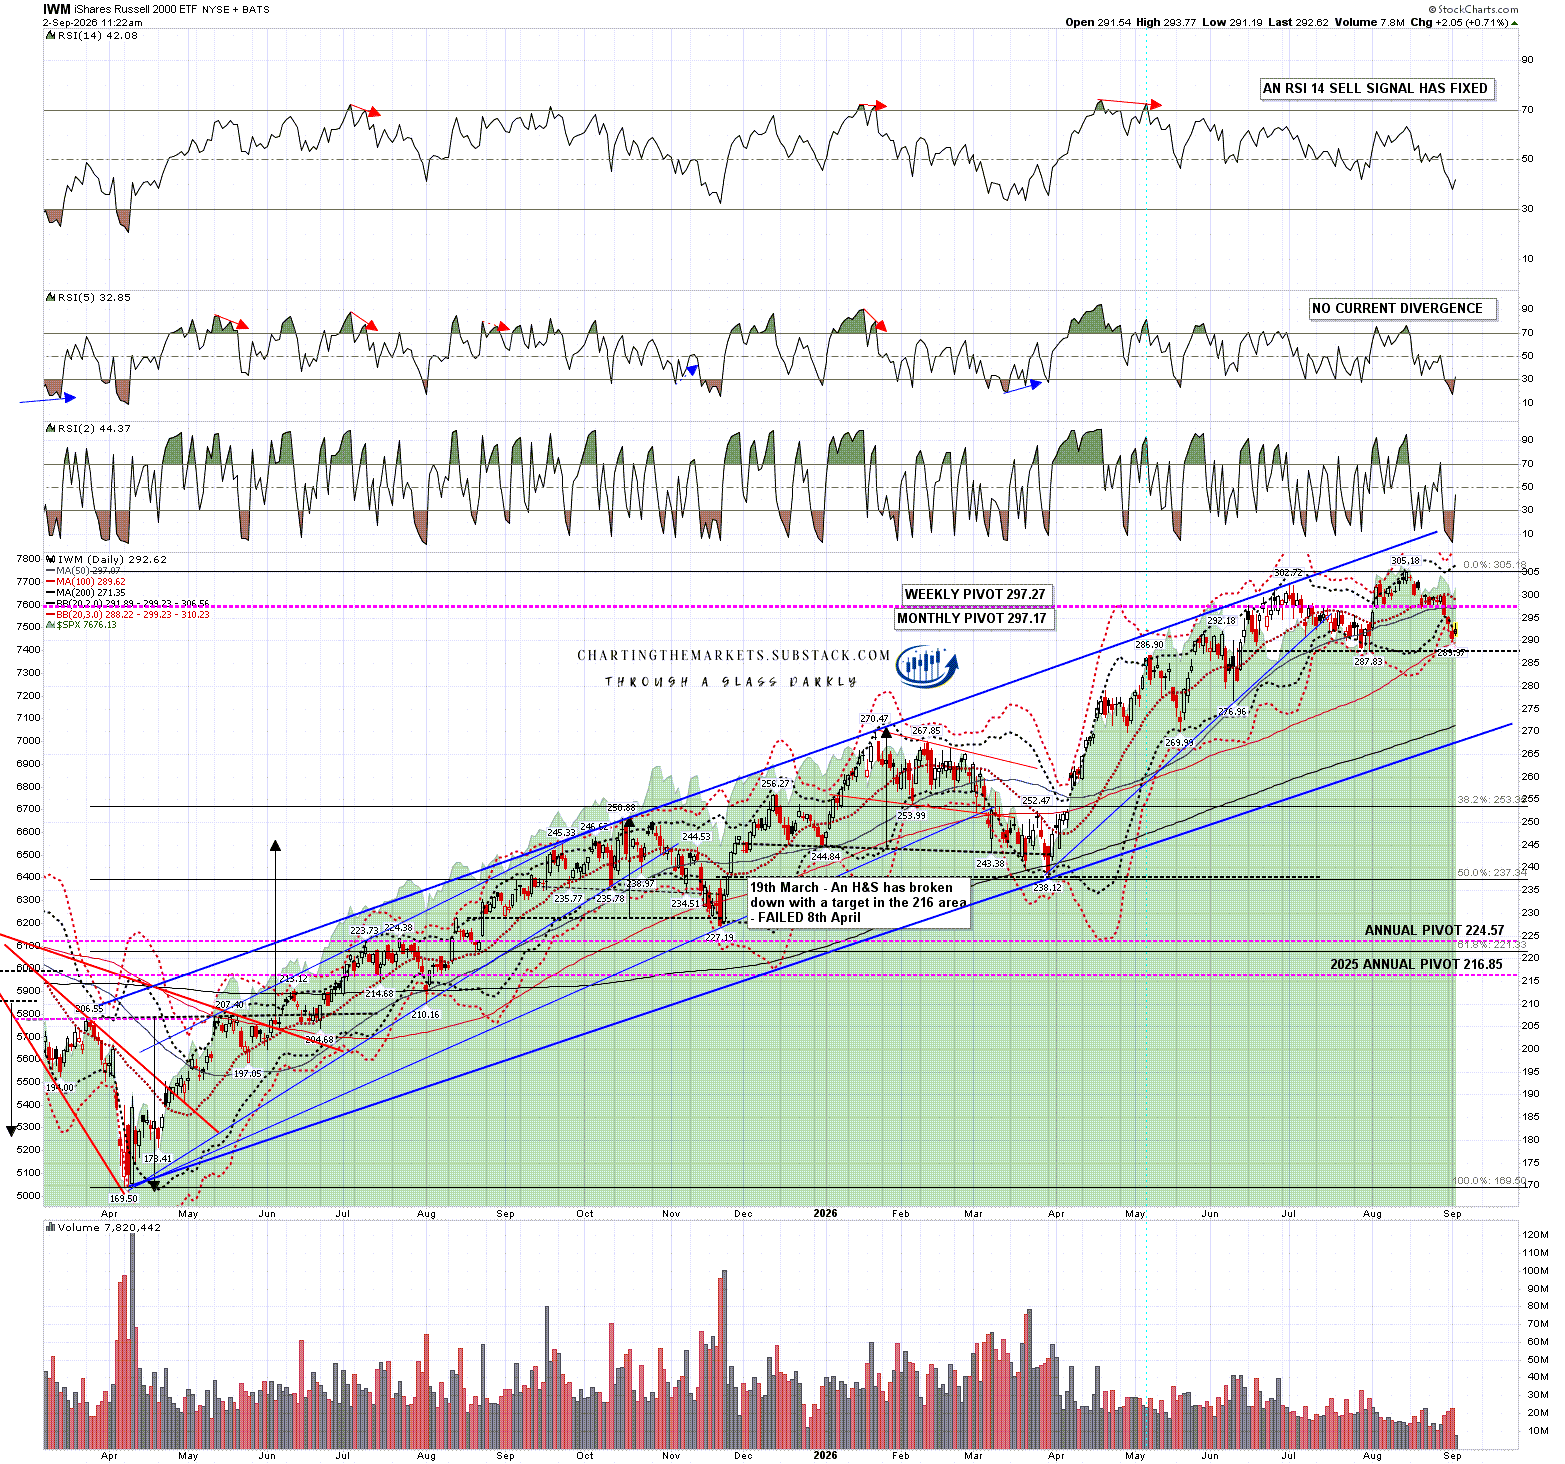
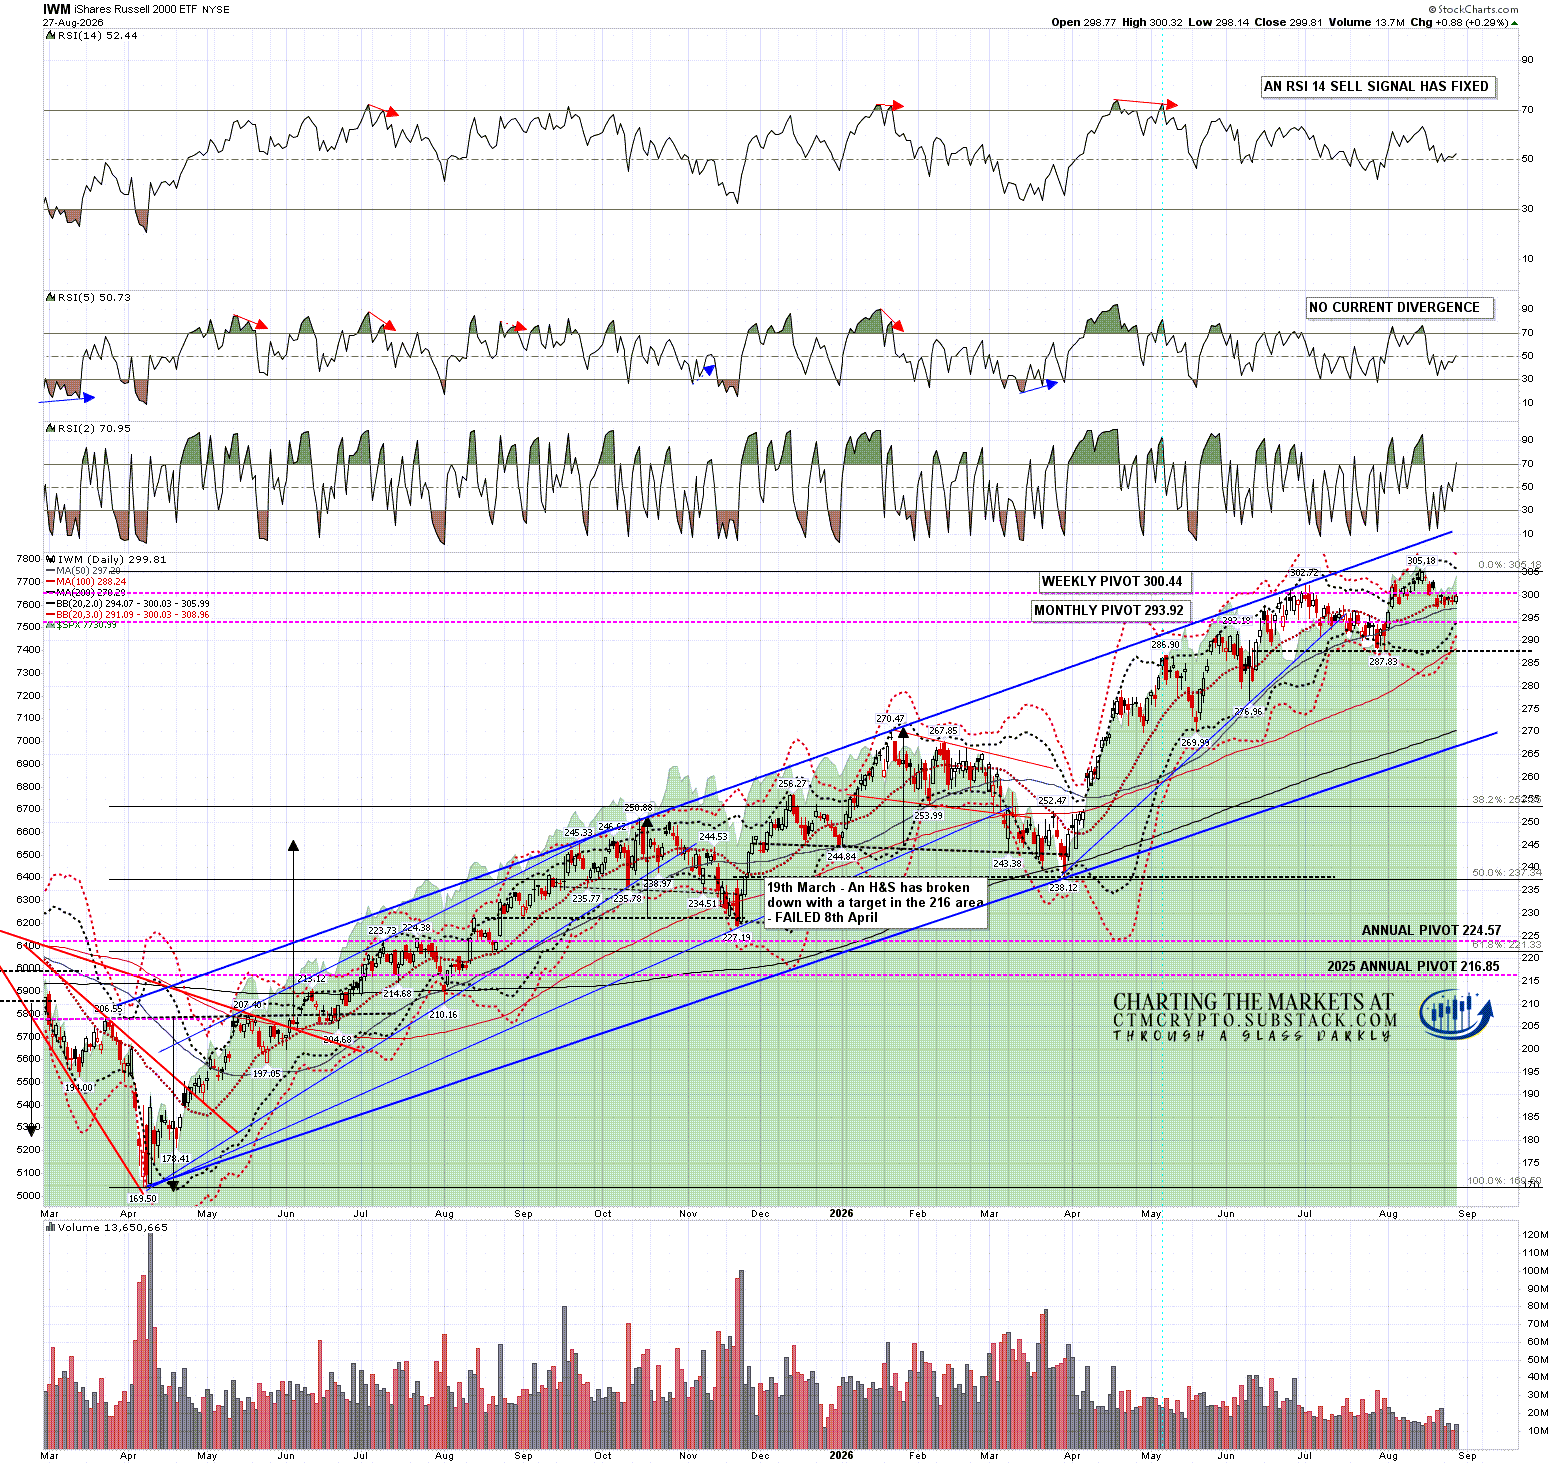
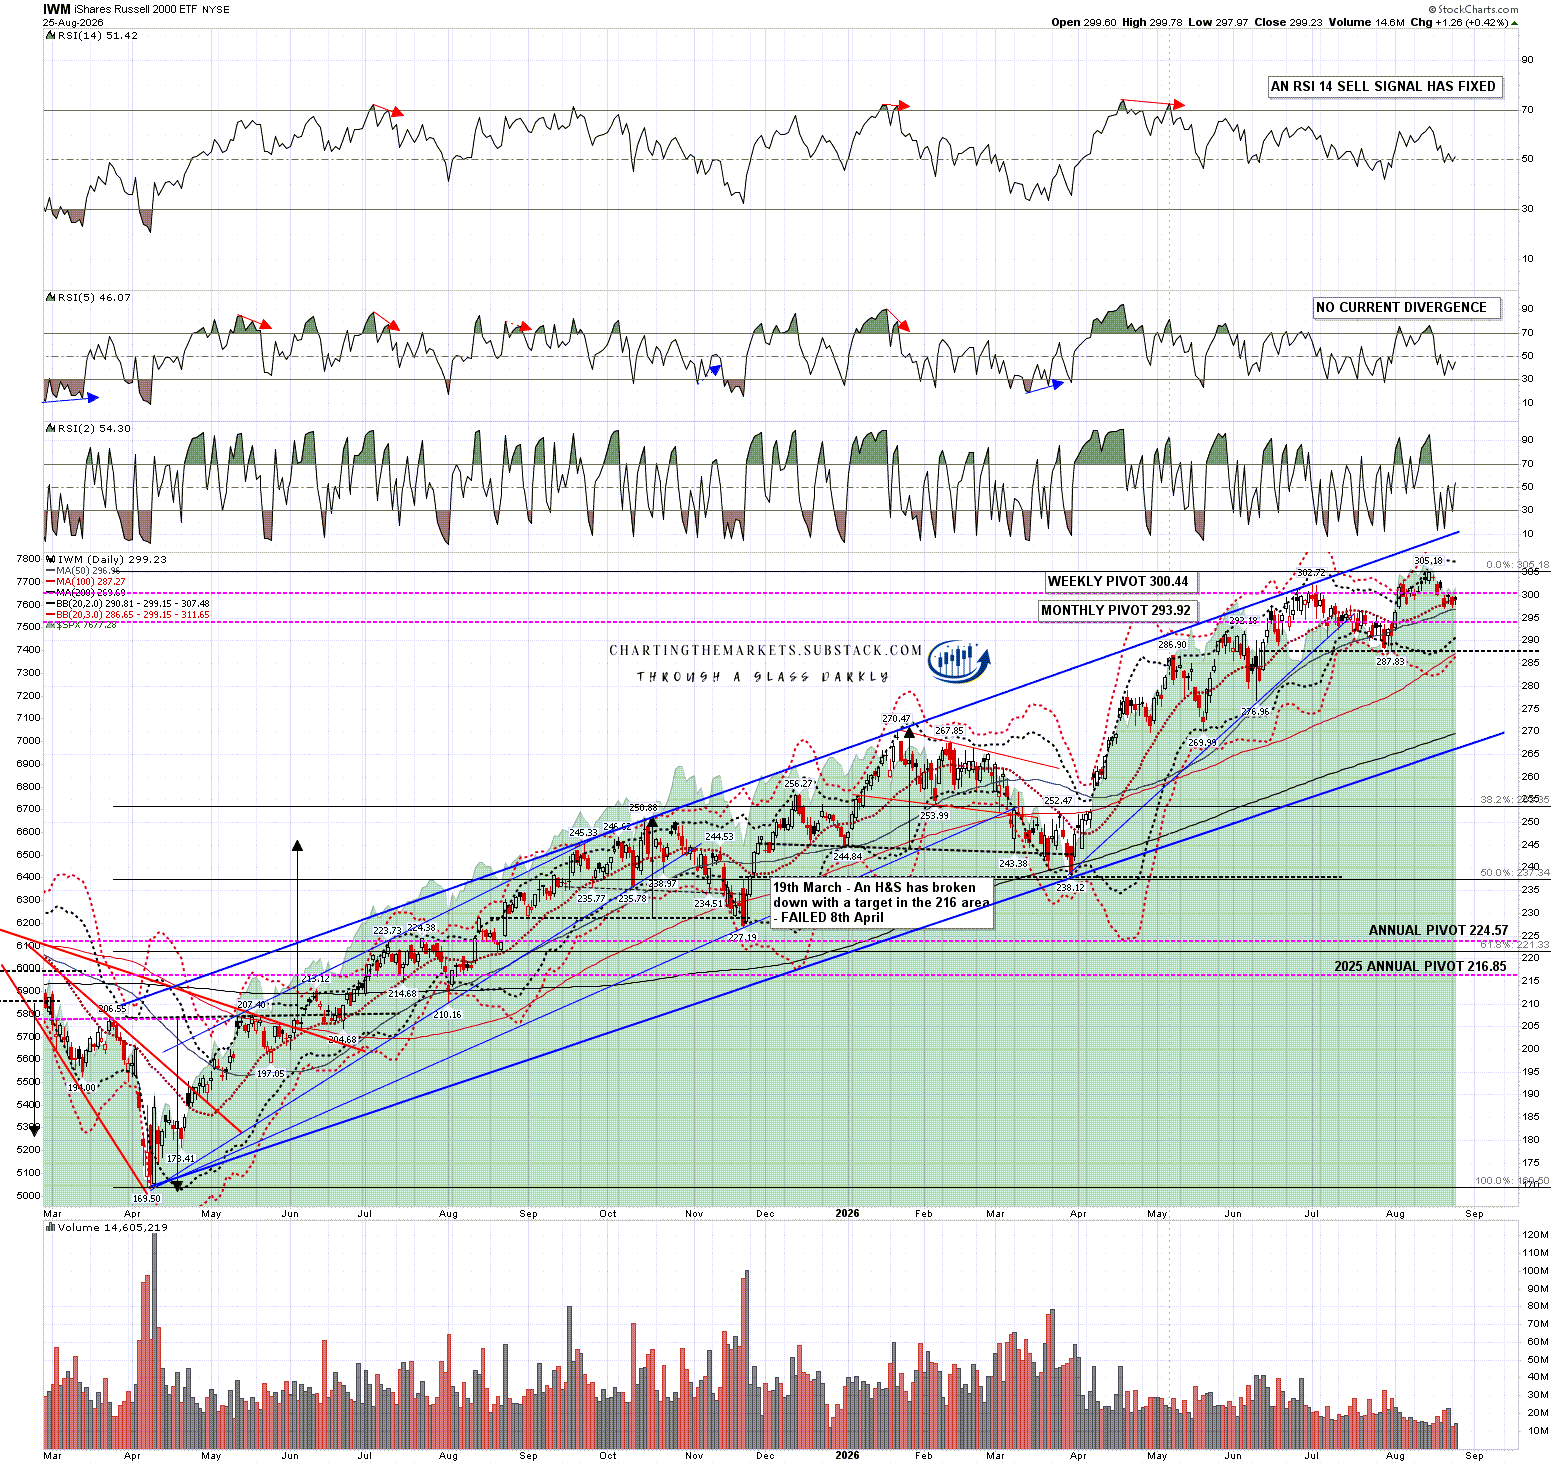
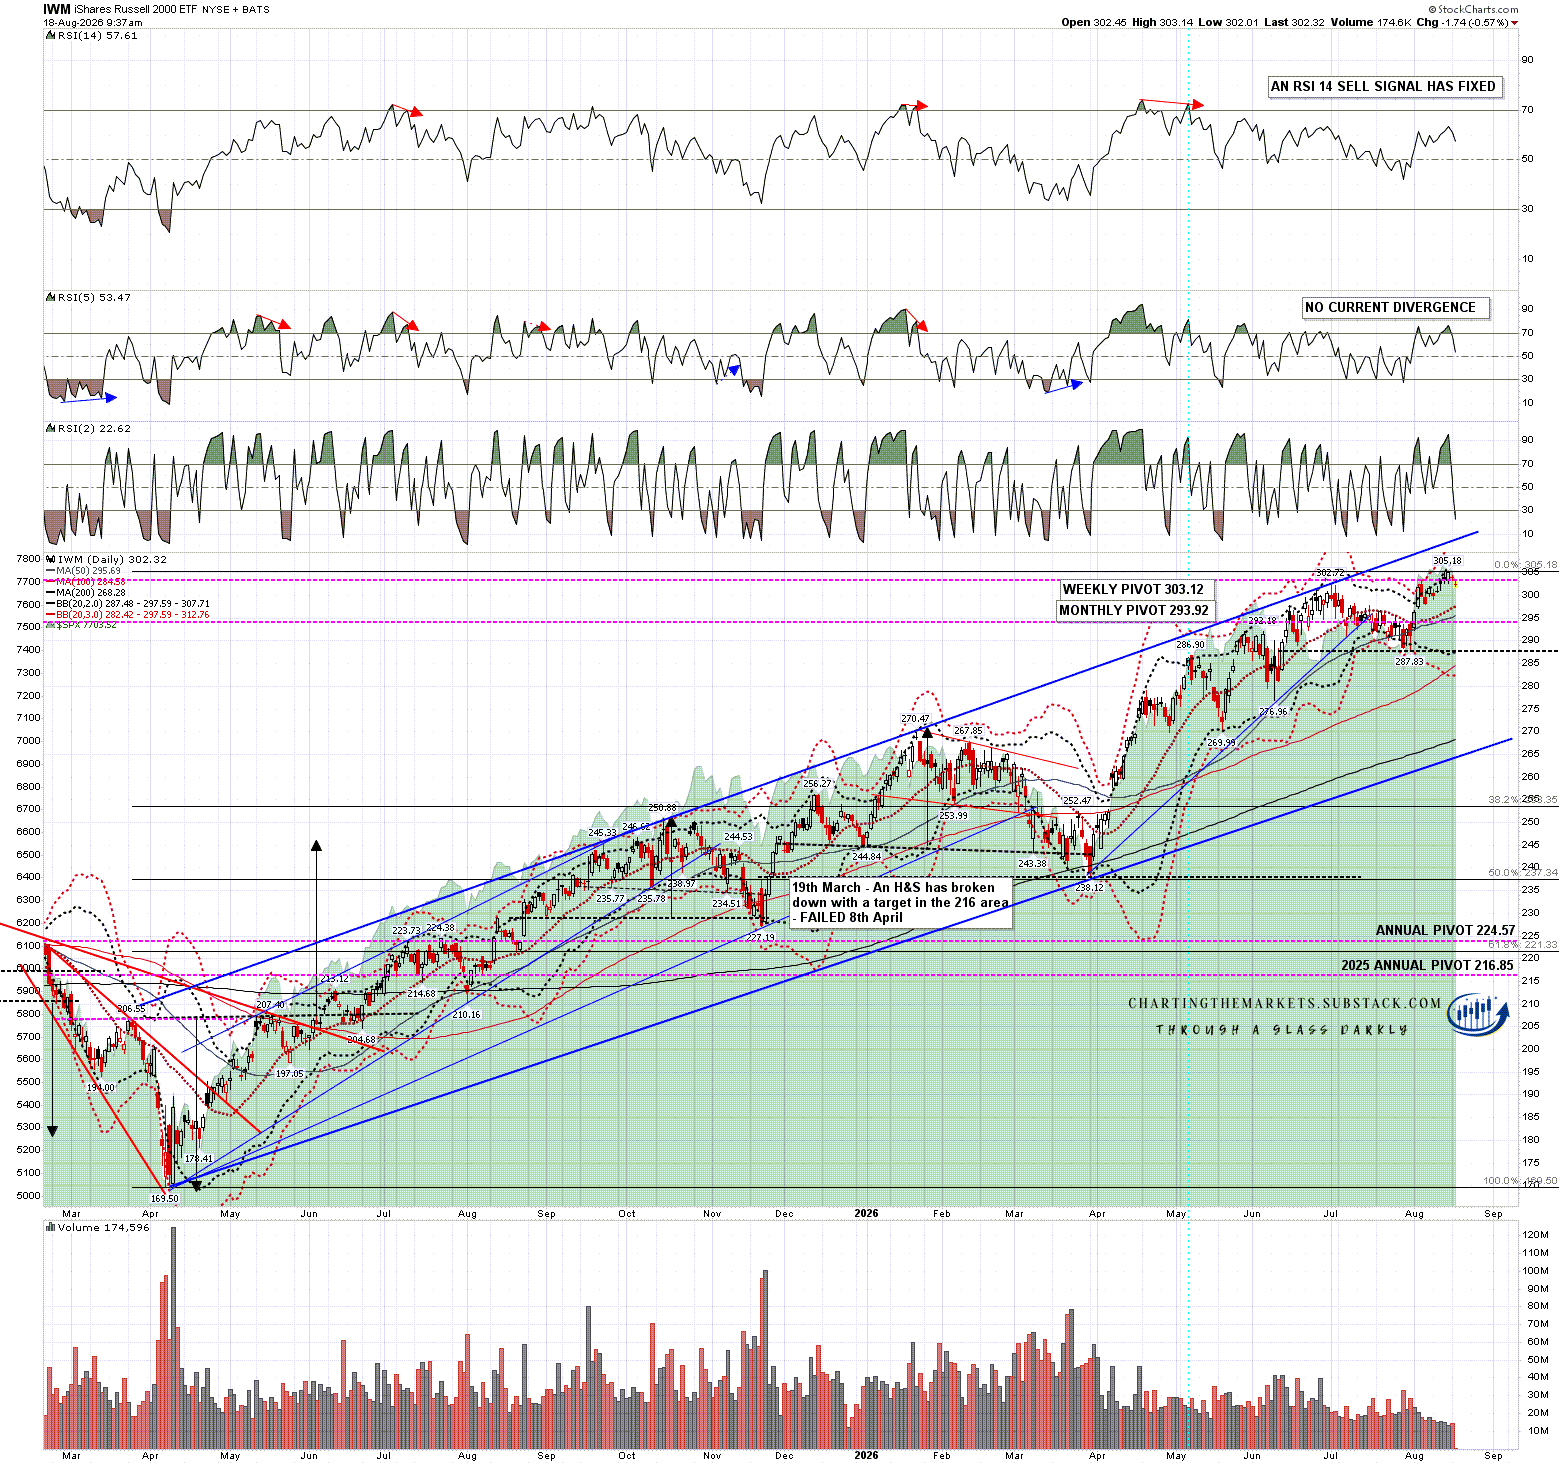
Looking at IWM I have a strong rising megaphone resistance trendline currently in the 312 area. If that isn’t going to break then the next obvious target within the rising megaphone would be megaphone support, currently in the 264 area.

In the short term I’m wondering about a possible backtest of the daily middle band currently at 297-8, and a possible double top has formed with support at 287.83 and, in the event that double top breaks down, a target in the 270.5 to 273 area.

IWM daily chart:

I remain skeptical about another big move up on equities here as Tech has been faltering in recent months for very good reasons, and there are strong and well established resistance trendlines above on all of SPX, DIA & IWM. If we do see that move it would likely be because we were seeing another big leg up on Tech that would drag the other indices higher.

If we are to see that big leg up on Tech, the first real confirmation would be a failure of the H&S on SOX with a move over 13,249.07. That would open a retest of the all time high at 14,655.29, setting up a possible larger double top and another inflection point. If we were to see a strong break up from there then that would likely break all my other resistance trendlines with confidence.

Until we see that, SOX is still pointing firmly down and in the short term there is a decent case that more downside is coming across the board. If we see the US indices go lower I’ll be watching the 7580 to 7620 area on SPX as the next obvious strong support level.

If you like my analysis and would like to see more, please take a free subscription at my chartingthemarkets substack, where I publish these posts first. I also do a premarket video every day on equity indices, bonds, currencies, energies, precious commodities and other commodities at 8.45am EST, but only for paying subscribers. Other places to find me are my page on the platform previously known as twitter, and my YouTube channel.

Tuesday, 4 August 2026

A Tale Of Two Markets

In my last post on Thursday 30th July I was looking at the downside targets on all the topping patterns on the main US indices and since then we have seen a very strong reversal back up, with those downside patterns failing into new all time highs on SPX and DIA, and failing today on IWM. This is now another big inflection point where US equity indices could turn down hard or continue higher, and I’ll be looking at that today.

Part of the reason for this has been the Iran War news where yet another imminent deal was announced on Sunday, though yesterday Iran denied any imminent deal or current ceasefire and underlined that by attacking the US base in Kuwait last night.

This morning Trump is back to issuing bloodcurdling threats to force Iran back to the negotiating table, and talking about a deal that might be concluded tomorrow, but unless he is now threatening a nuclear strike it’s hard to see that being any more successful than the previous ten or eleven times this has happened since March. Even in that case Iran would clearly appeal to their allies China and Russia and I suspect China at least would intervene to deter any use of nuclear weapons in this war.

I wrote in early May that both the US and Iran had been waiting for the other to concede defeat since March. That remains the case and it seems a long shot to think that Iran will now concede their control of the Strait of Hormuz as that has been a very clear red line for them since the start of the war. We’ll see what happens next but at the moment this looks like a Mexican standoff with the US threatening to devastate Iran, while Iran promises to respond by devastating oil and gas infrastructure in the rest of the Persian Gulf. The short term options for the US appear to be to resume the hot war on a similar limited basis to previous unsuccessful bombing campaigns, or to concede that Iran controls the Strait of Hormuz and try to spin that as a win.

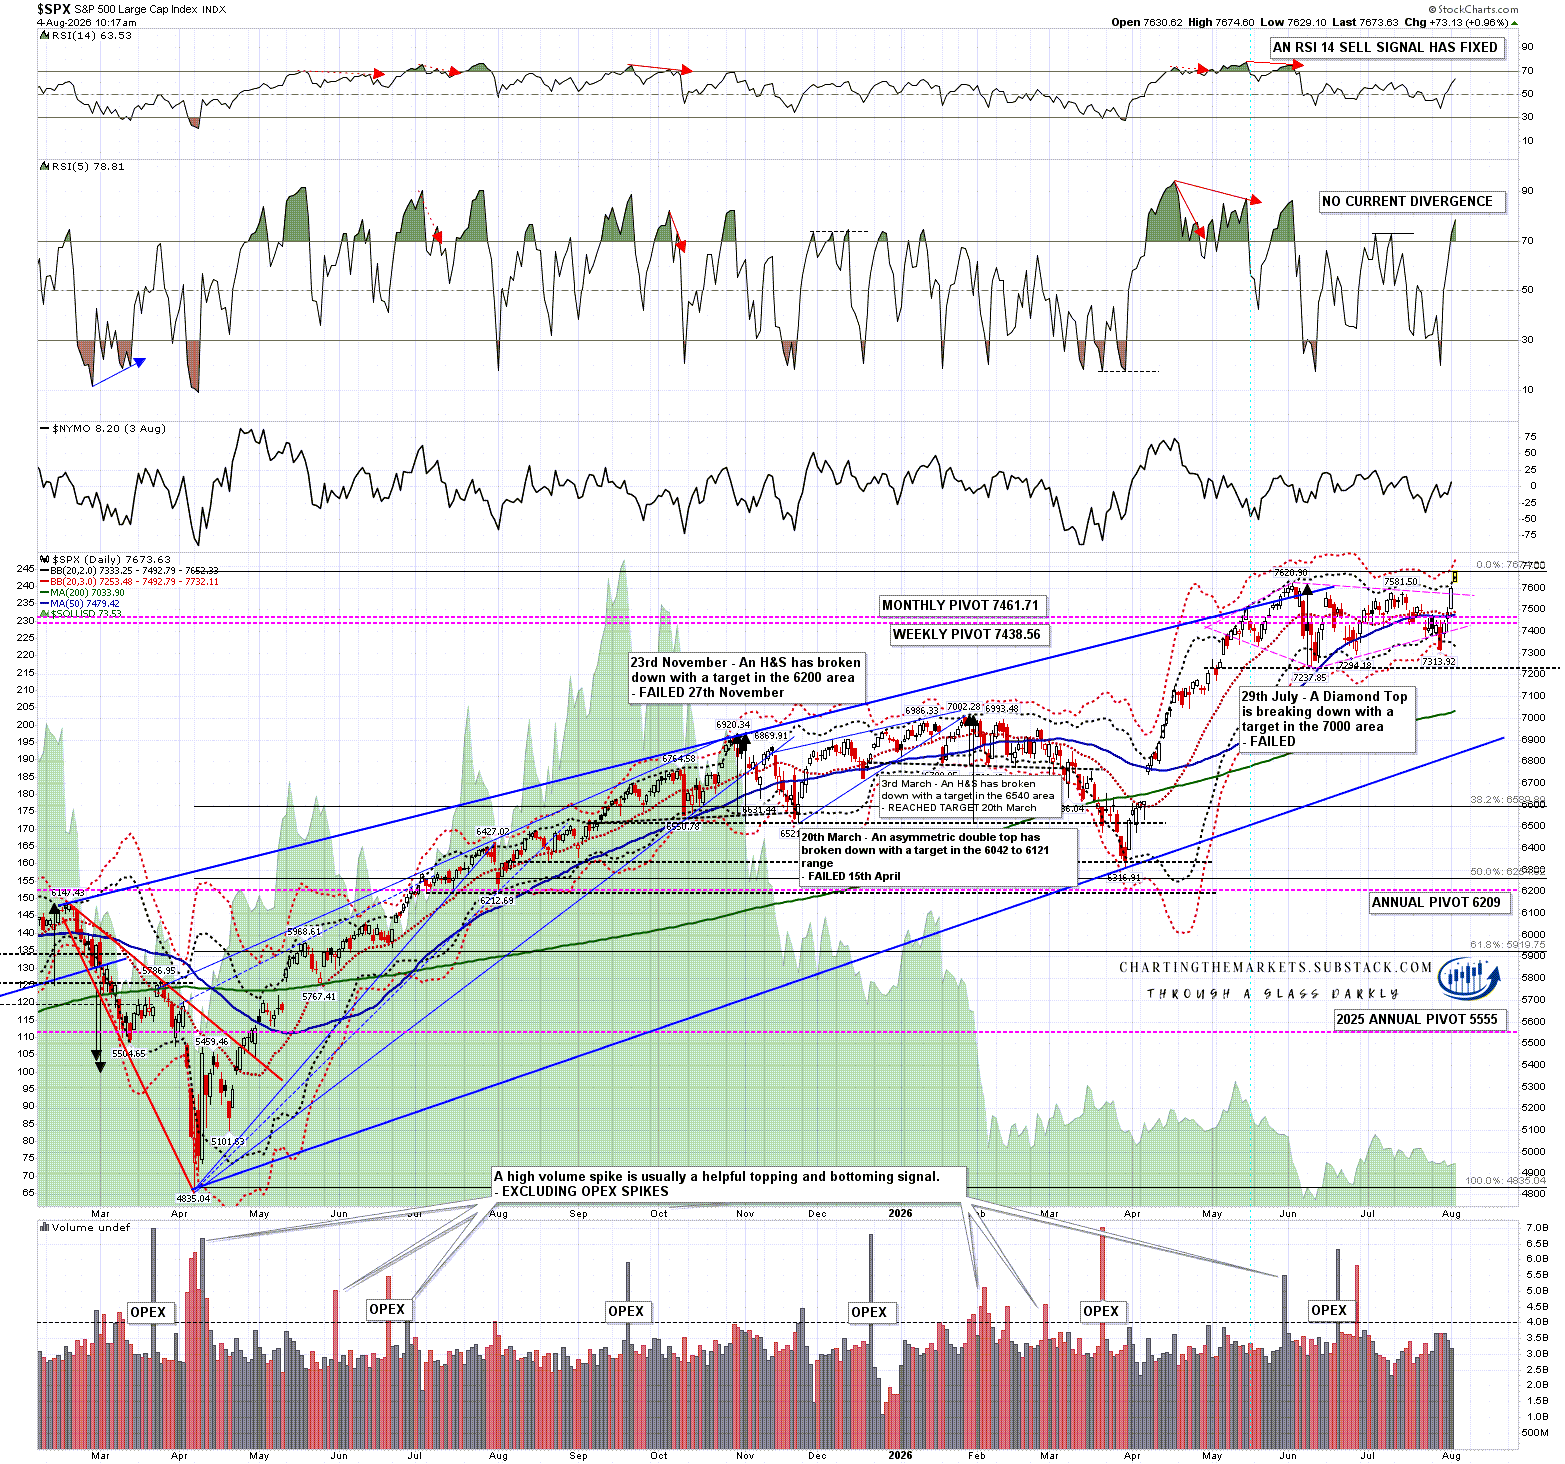
Looking at the US equity markets SPX made a new high today and could go higher. I’ll be doing another post in a day or two looking at that. Short term though SPX is close to the daily 3sd upper band and at minimum I’d be looking for a consolidation in this area for a week or so to allow the daily middle band to turn up more, and for the daily bands to expand to allow more room under the daily 3sd upper band.

On the bear side there is now a high quality double top setup on SPX.

SPX daily chart:

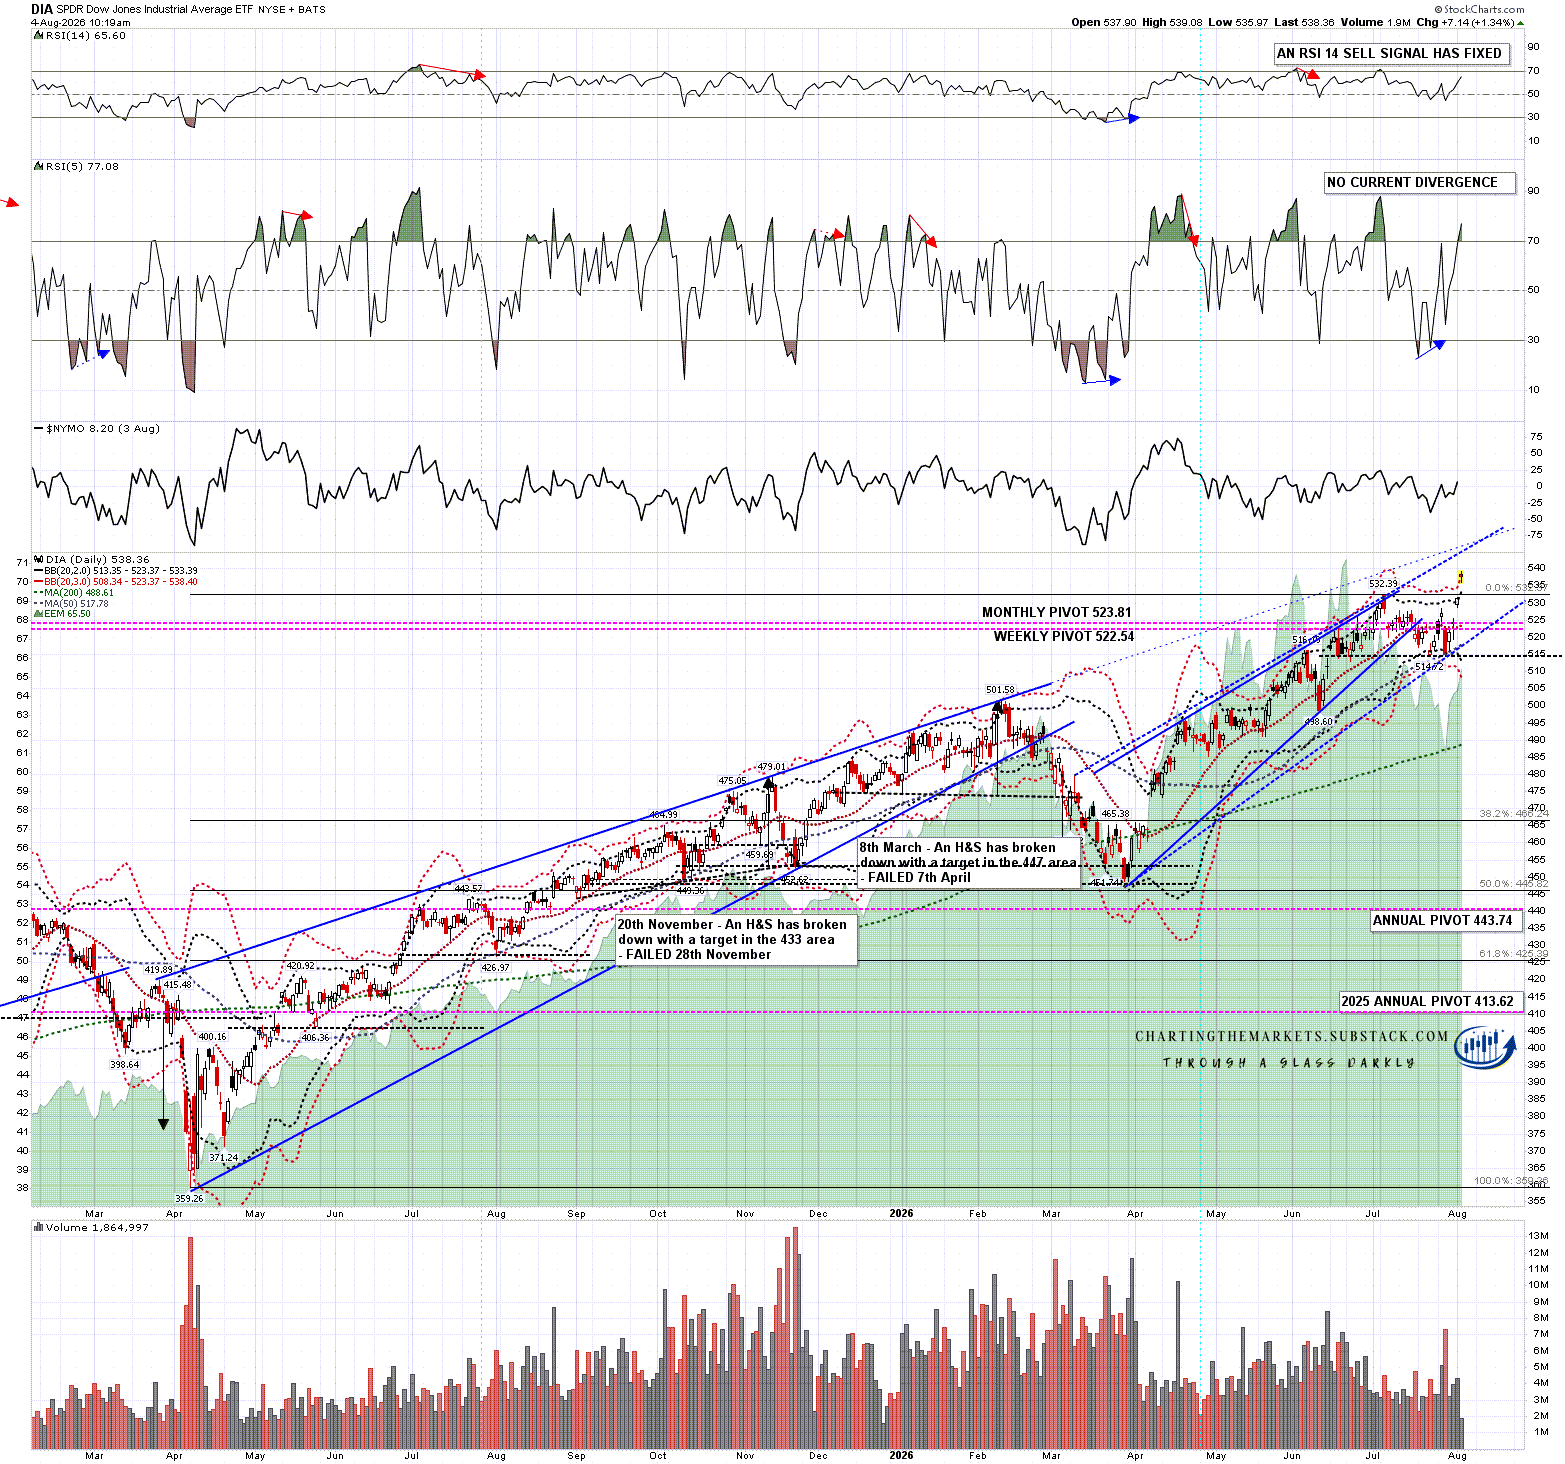
The H&S on DIA failed yesterday and DIA made a new all time high today. DIA was hitting the daily 3sd upper band as I capped the chart below and this also likely needs another week or so to consolidate if DIA is heading higher. Again I have a possible upside target and that is getting close in the 547 area.

On the bear side there is now a high quality double top setup on DIA.

DIA daily chart:

The H&S on IWM failed today and that gives IWM a possible target at a retest of the all time high.

On the bear side there is also a possible alternate H&S right shoulder forming so that ATH retest need not necessarily be seen.

While the three indices above all had their topping patterns fail, the three remaining topping patterns on the charts below still look just fine and are the key to the current inflection point.

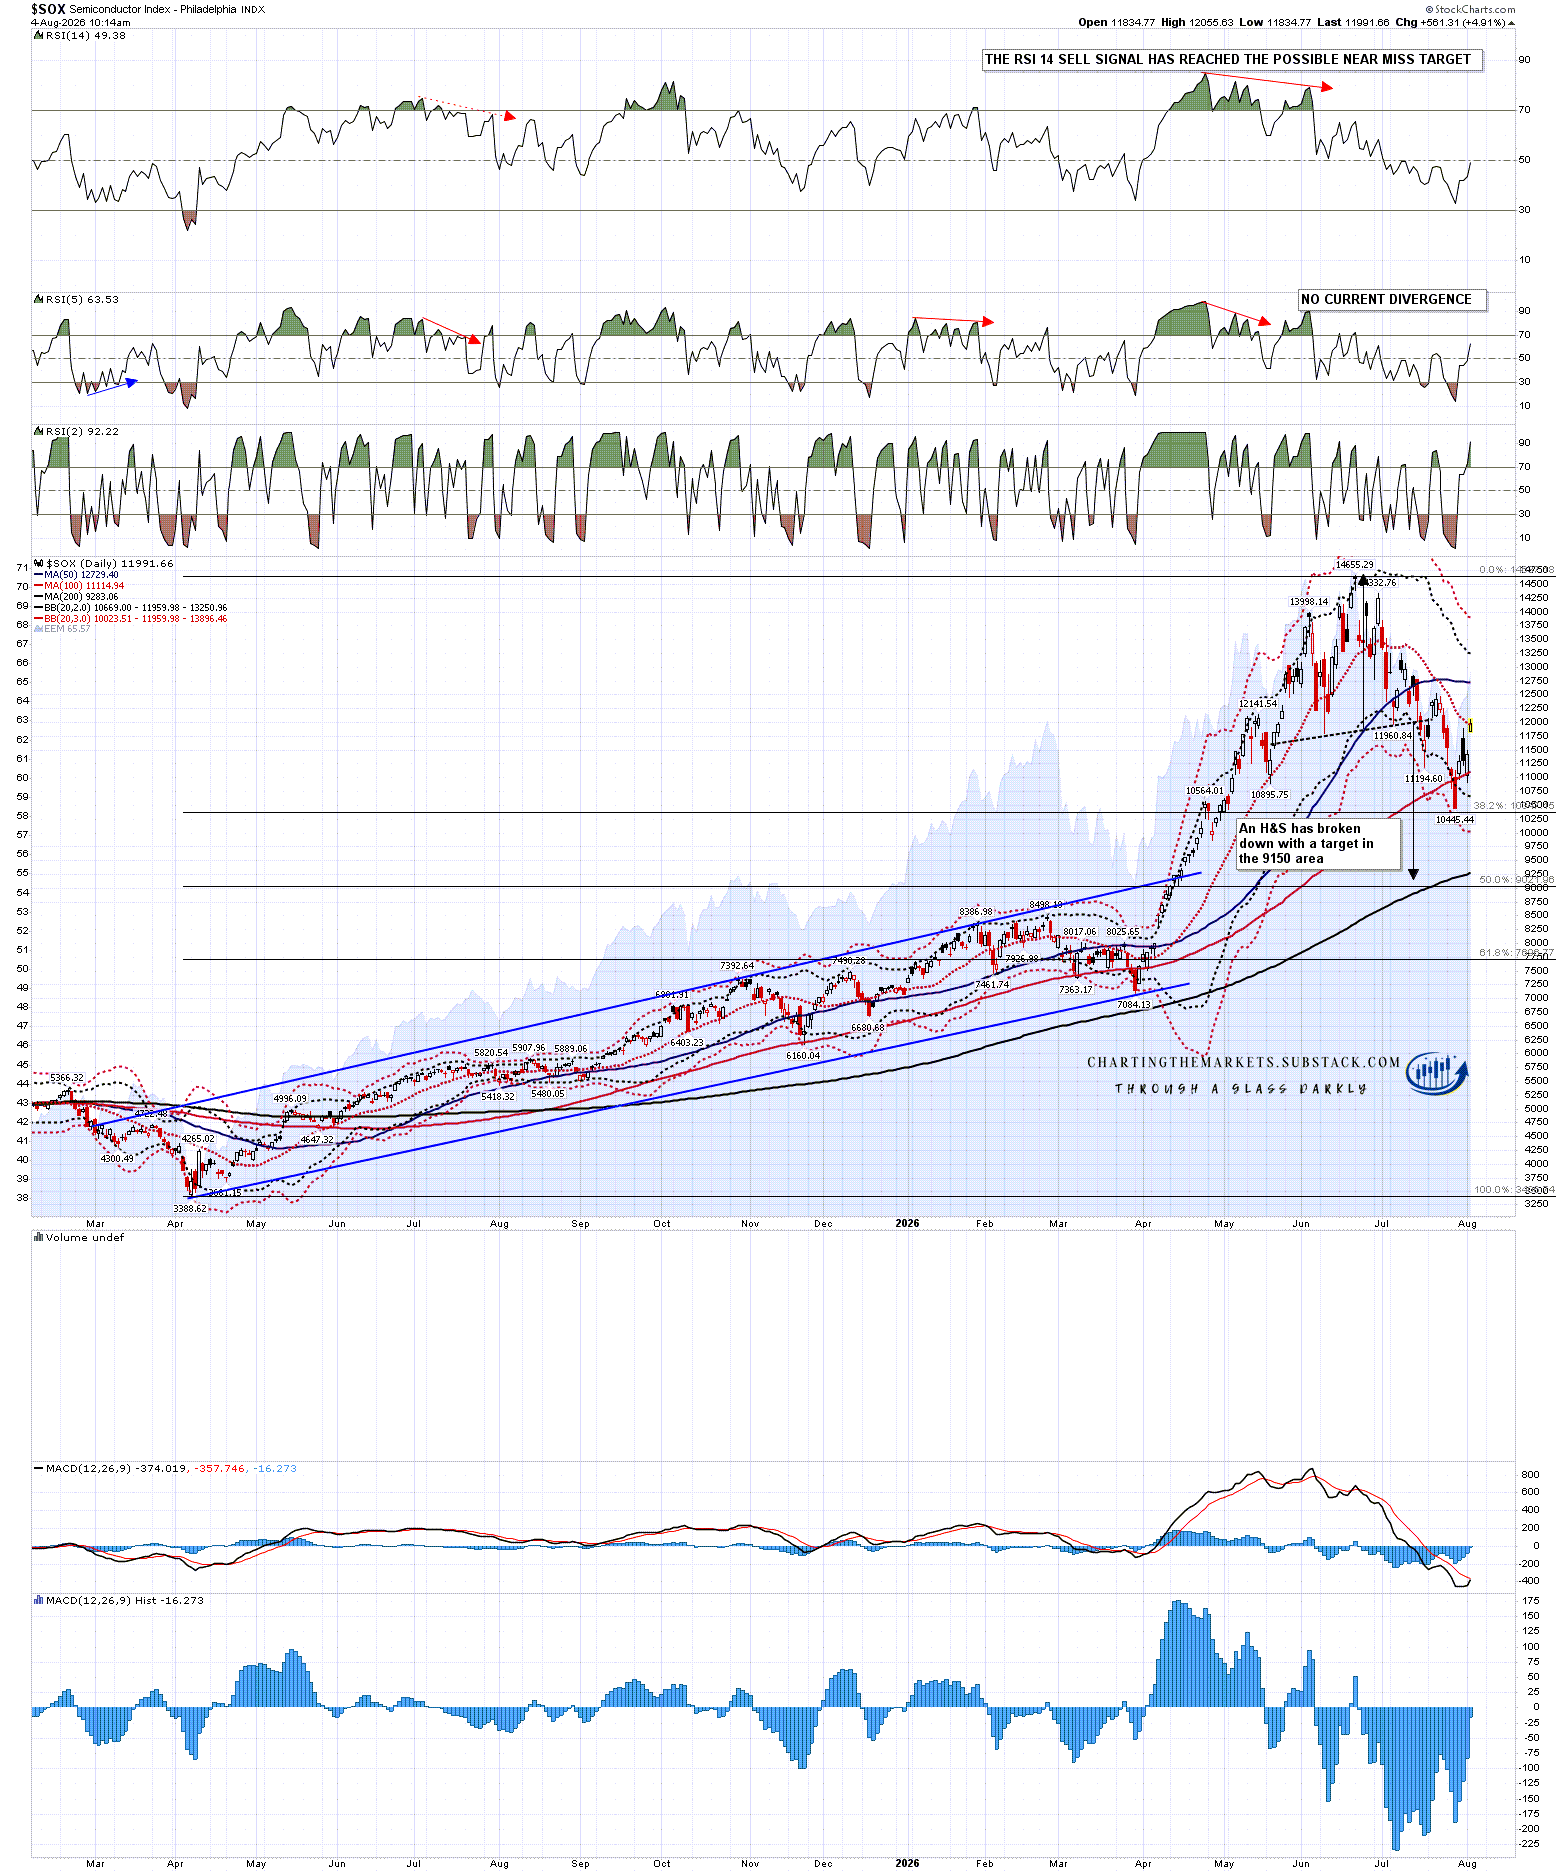
On the Philadelphia Semiconductor Index (SOX) an H&S has broken down with a target in the 9510 area and that currently looks fine. SOX is testing the daily middle band and on a break above I’d be watching for a possible move over the right shoulder high in the 13,249.07 to invalidate the H&S. If we see that, and Tech stops lagging the rest of the market, we might see a genuine break up. That test isn’t close yet though.

SOX daily chart:

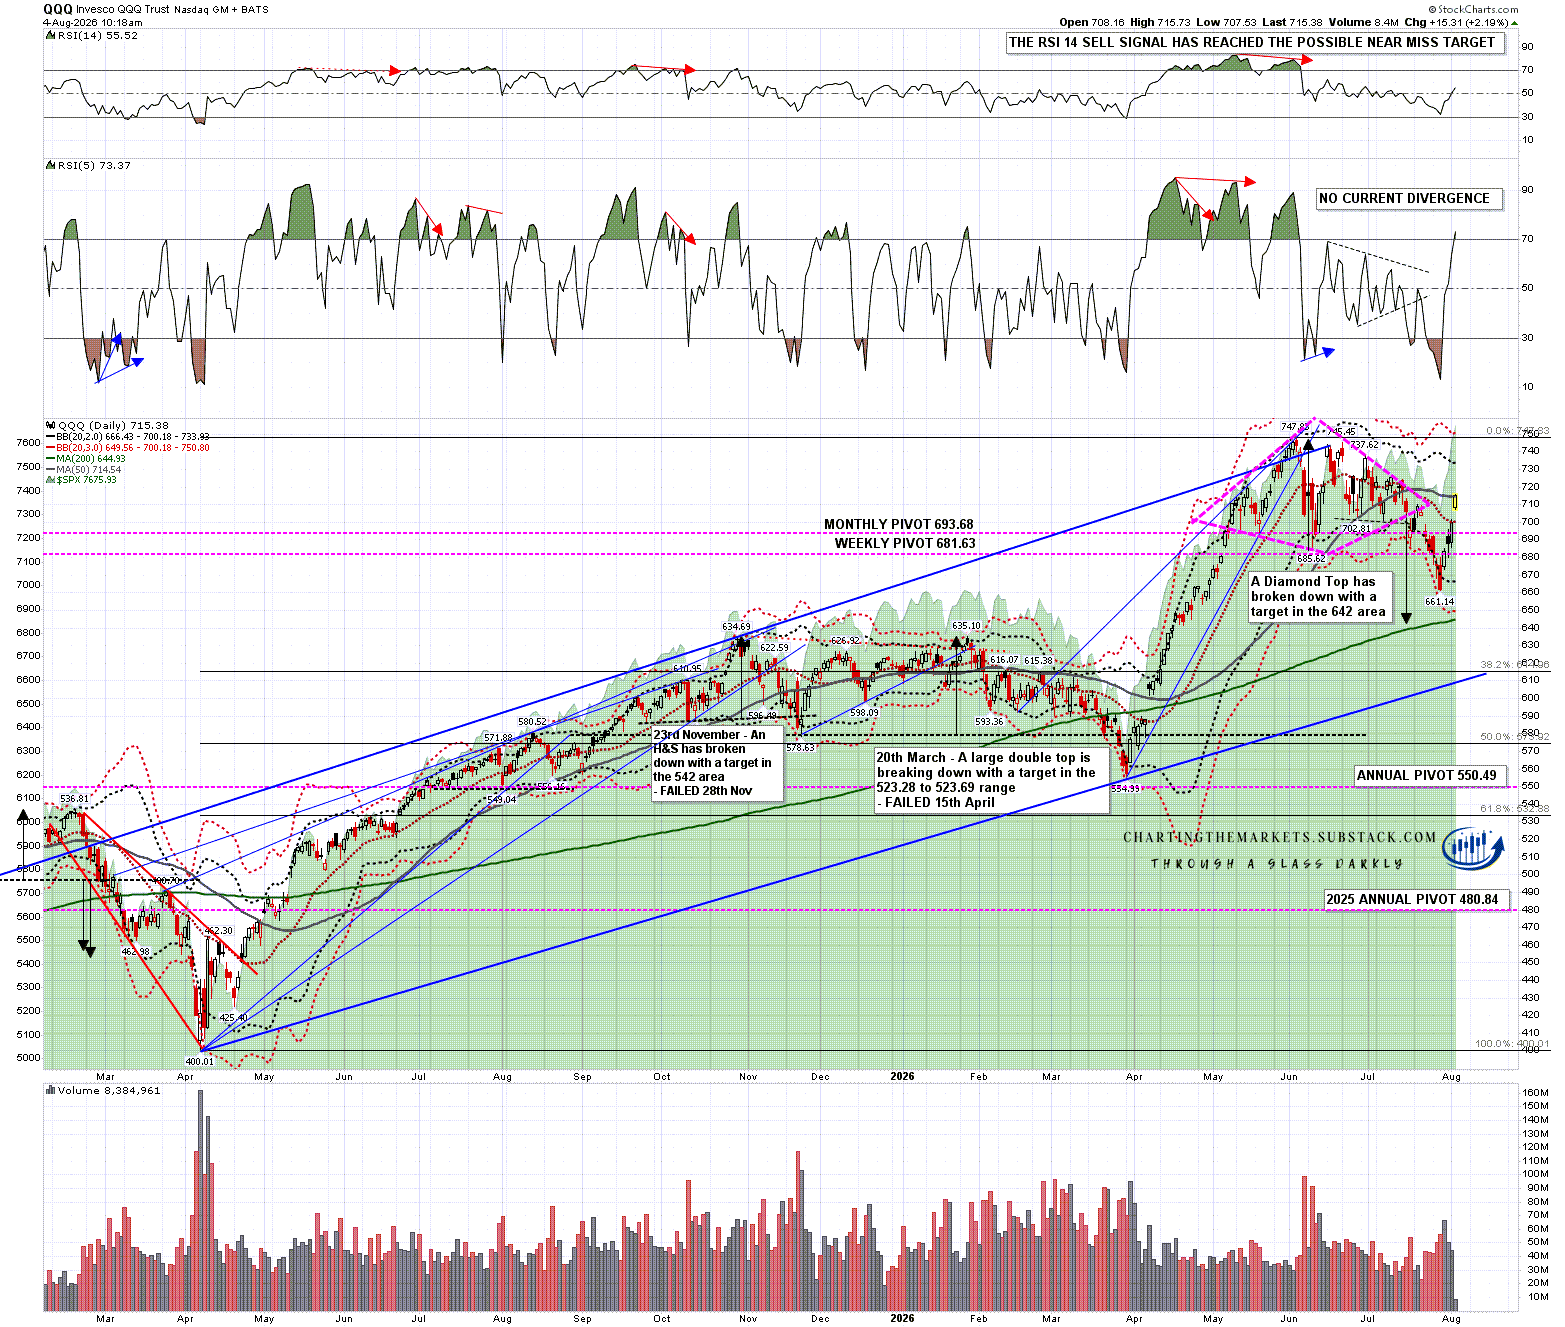
Looking at QQQ we saw a decent break back over the daily middle band this morning into a backtest of the 50dma. A diamond top has broken down with a target in the 642 area and that topping pattern still looks fine. As with SOX, if Tech stops lagging the rest of the market, we might see a genuine break up, so we will see what happens next.

QQQ daily chart:

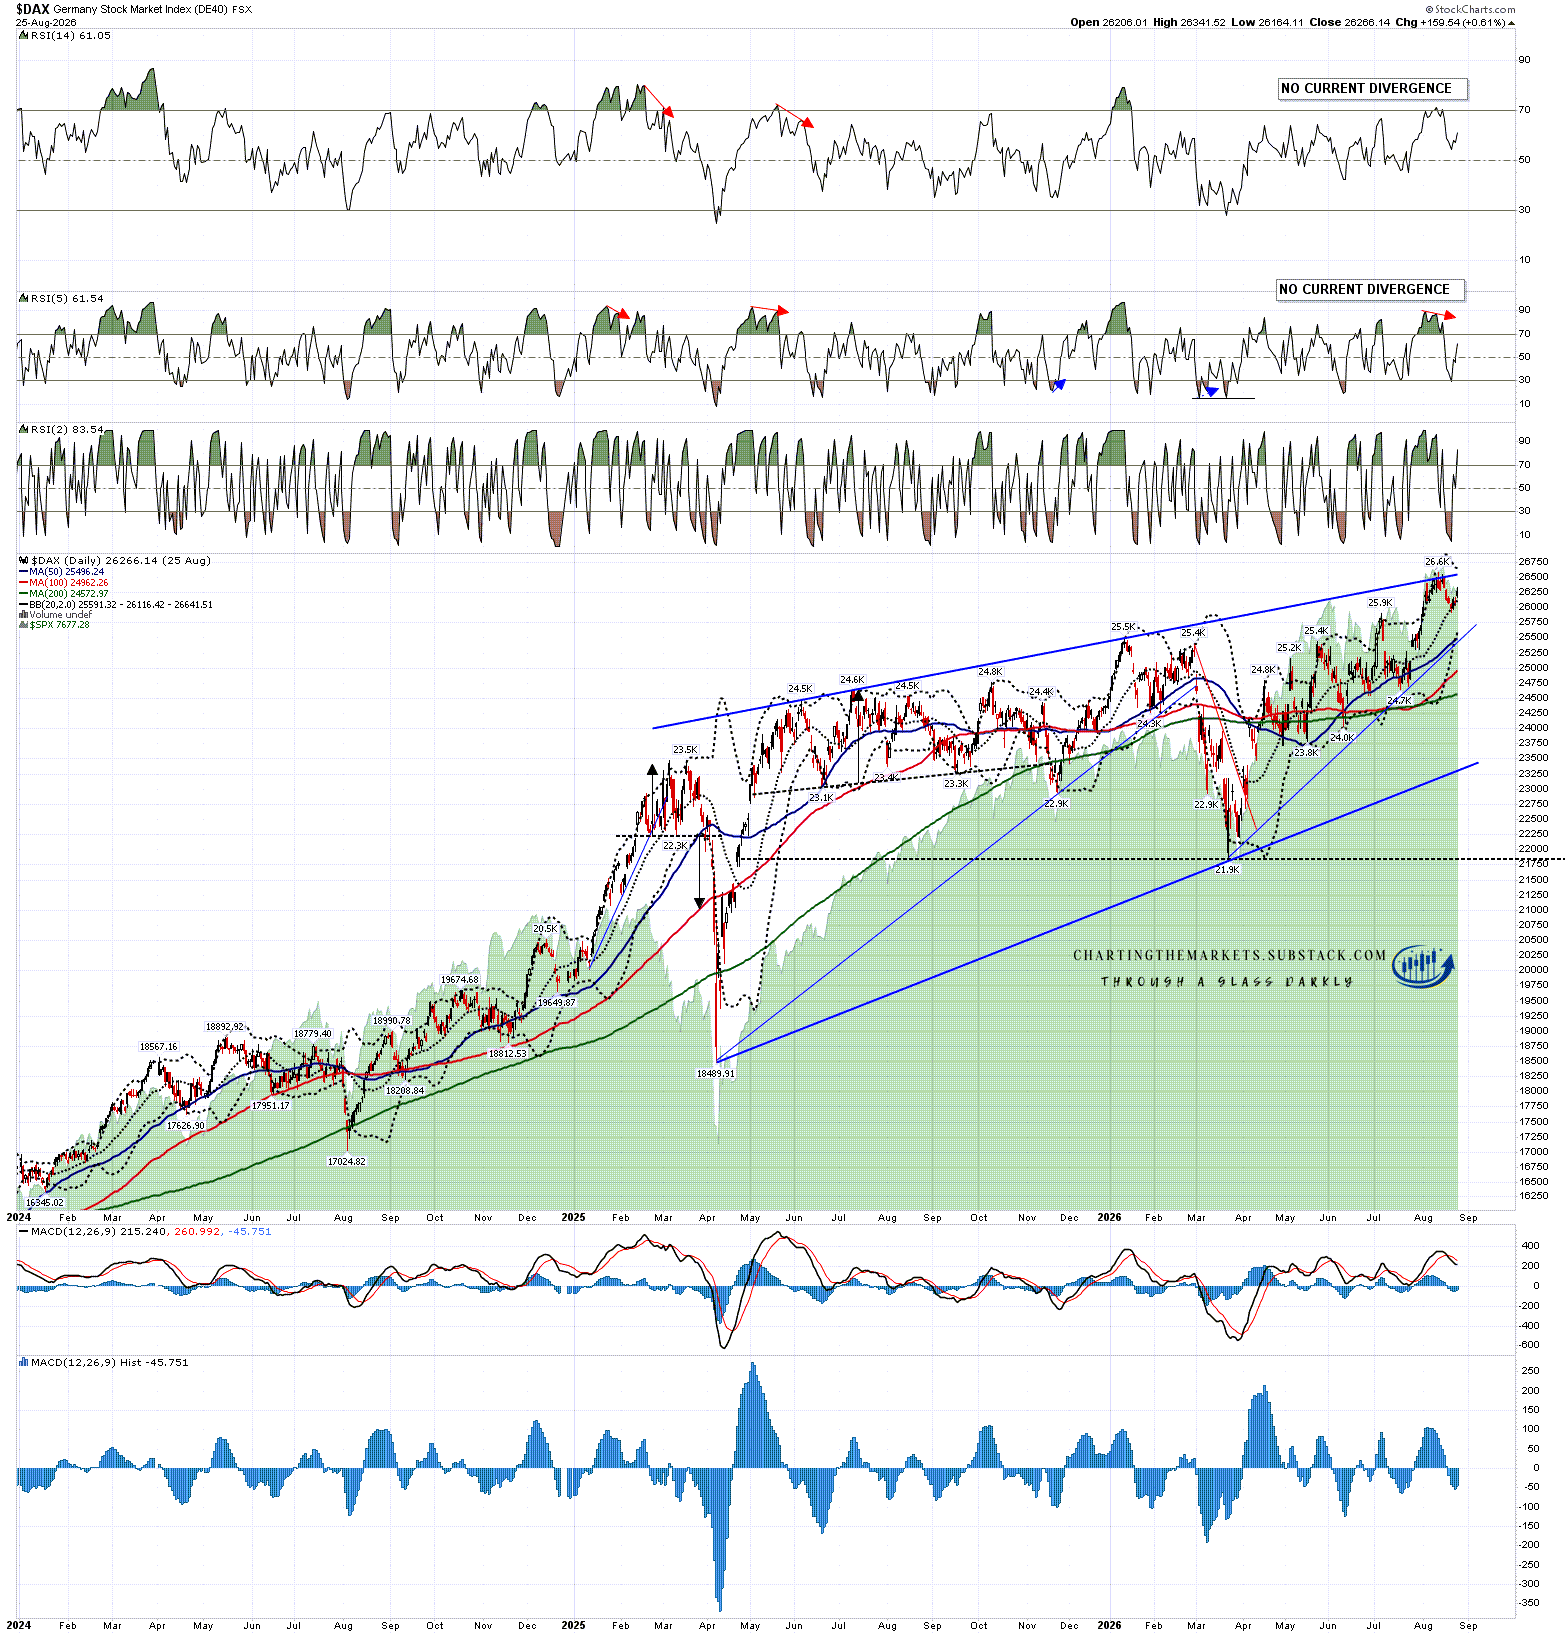
The last chart of the day is the Nikkei 225, looking beyond US markets but it’s worth looking further afield, particularly as DAX and ESTX50 both just retested their all time highs and formed decent quality possible double tops.

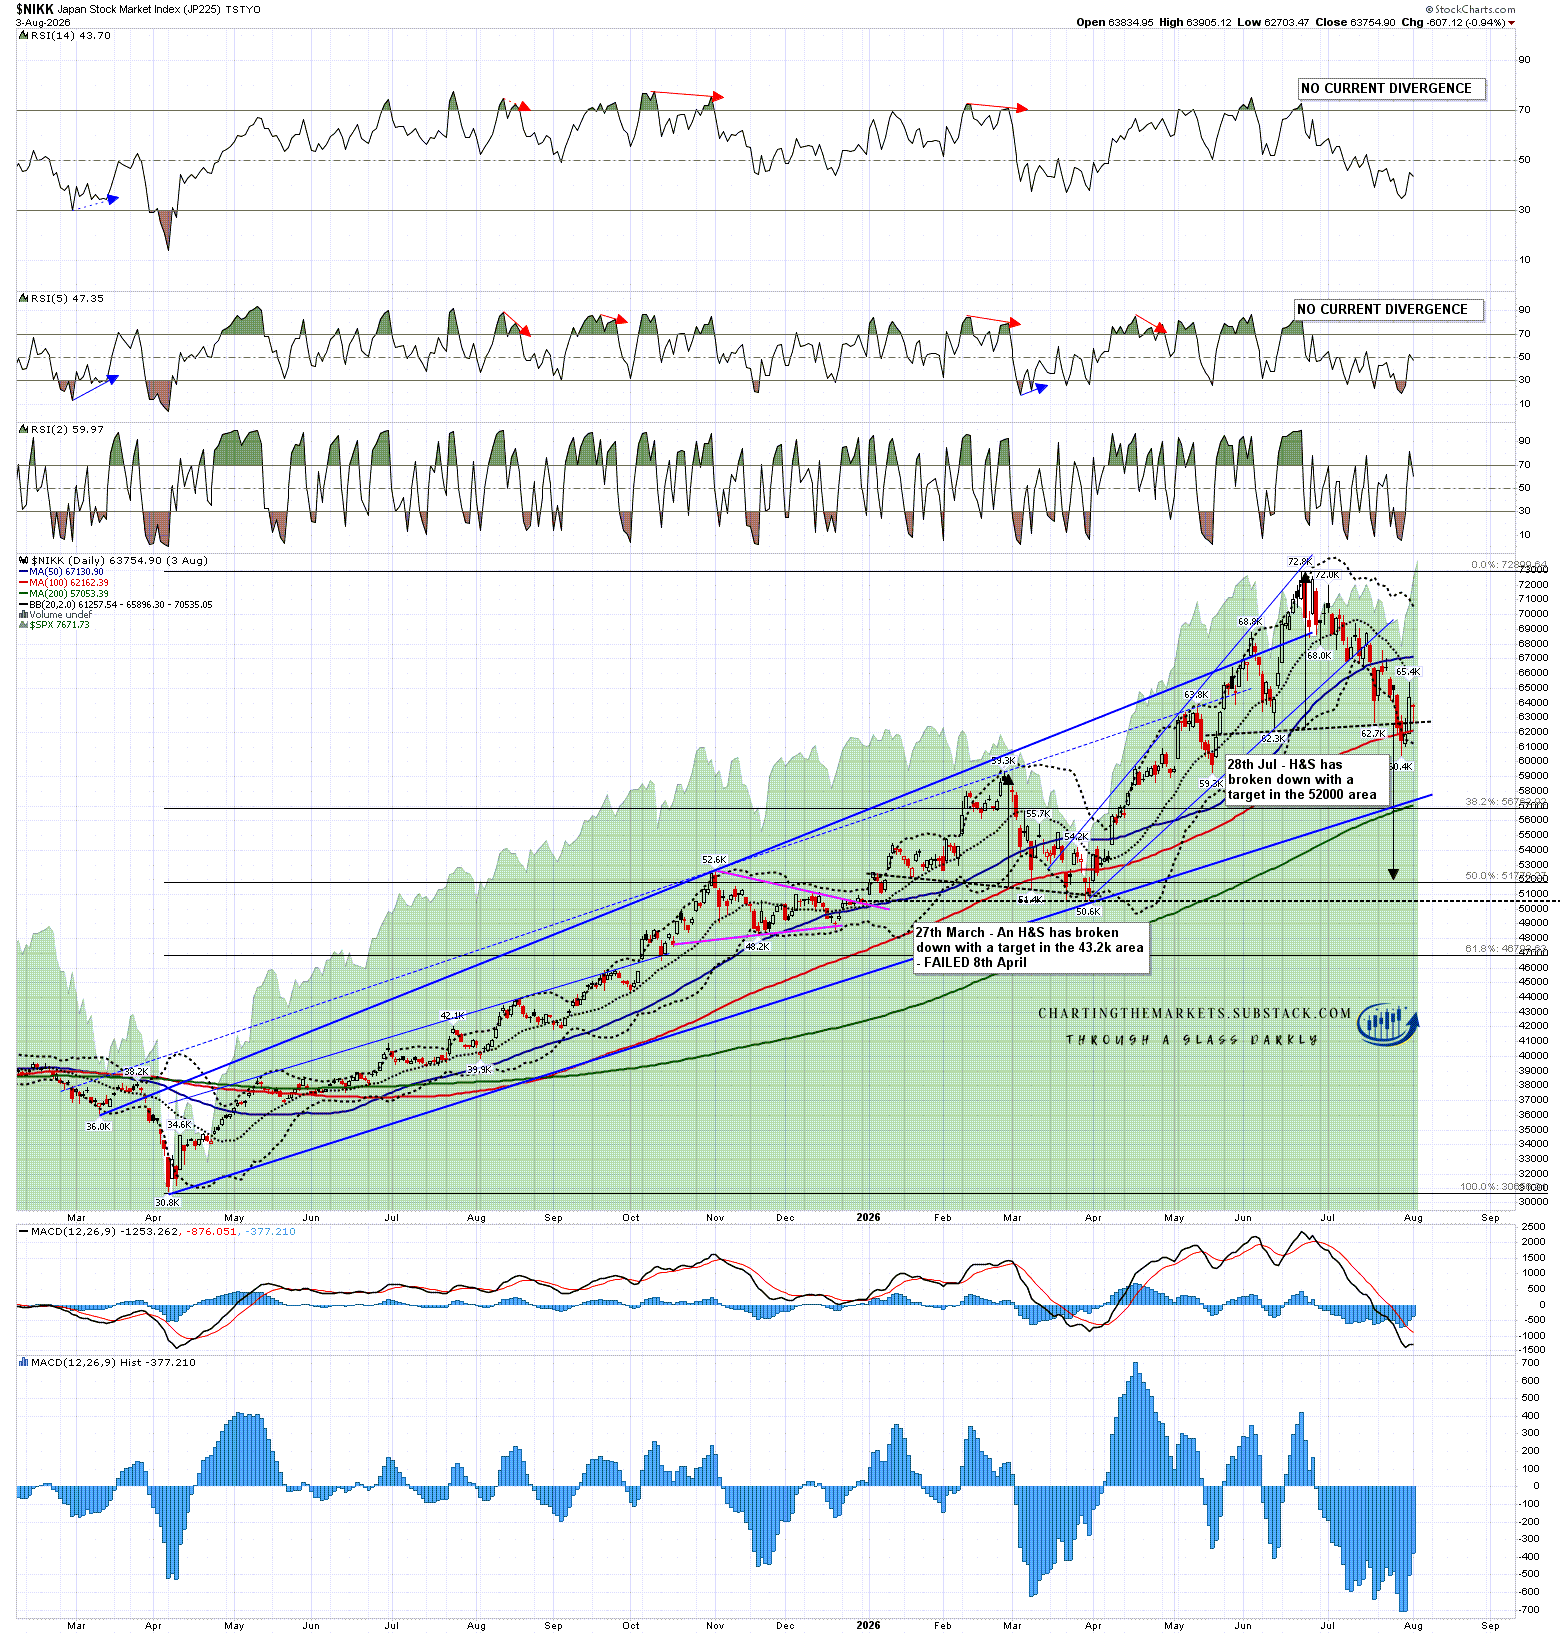
On NIKK an H&S broke down last week with a target in the 52000 area. That H&S still looks just fine as well, with NIKK still well below the daily middle band and 50dma. All of these three charts on SOX, QQQ & NIKK still lean bearish and that may well not change.

NIKK daily chart:

So that is the inflection point here. On the bull side we would likely see a consolidation in the current area on SPX and DIA for a week or two, to give room for the daily 3sd upper bands to rise, and then go higher, likely sustained by a Tech sector returning to retest the current all time highs.

On the bear side the downside patterns on SOX, QQQ and NIKK are just seeing a rally here, and the topping patterns on SPX, DIA and IWM have all been improved by the move up since last Wednesday, backed up by new double top setups on DAX and ESTX50 that have now also now formed and might start playing out.

We will see which way this goes and I’m planning another post for tomorrow looking at possible upside targets on SPX, DIA and IWM in the event that US equity markets go higher.

I have very real doubts about that move higher, as the Iran War for now appears to be an insoluble quagmire, the Tech sector is having genuine issues with Chinese innovations and massive capex plans causing serious market concerns, and US bond yields are on a very clear and sustained bullish track that may go a lot further. As always time will tell.

If you like my analysis and would like to see more, please take a free subscription at my chartingthemarkets substack, where I publish these posts first. I also do a premarket video every day on equity indices, bonds, currencies, energies, precious commodities and other commodities at 8.45am EST, but only for paying subscribers. Other places to find me are my page on the platform previously known as twitter, and my YouTube channel.
Thursday, 30 July 2026

Downside Targets

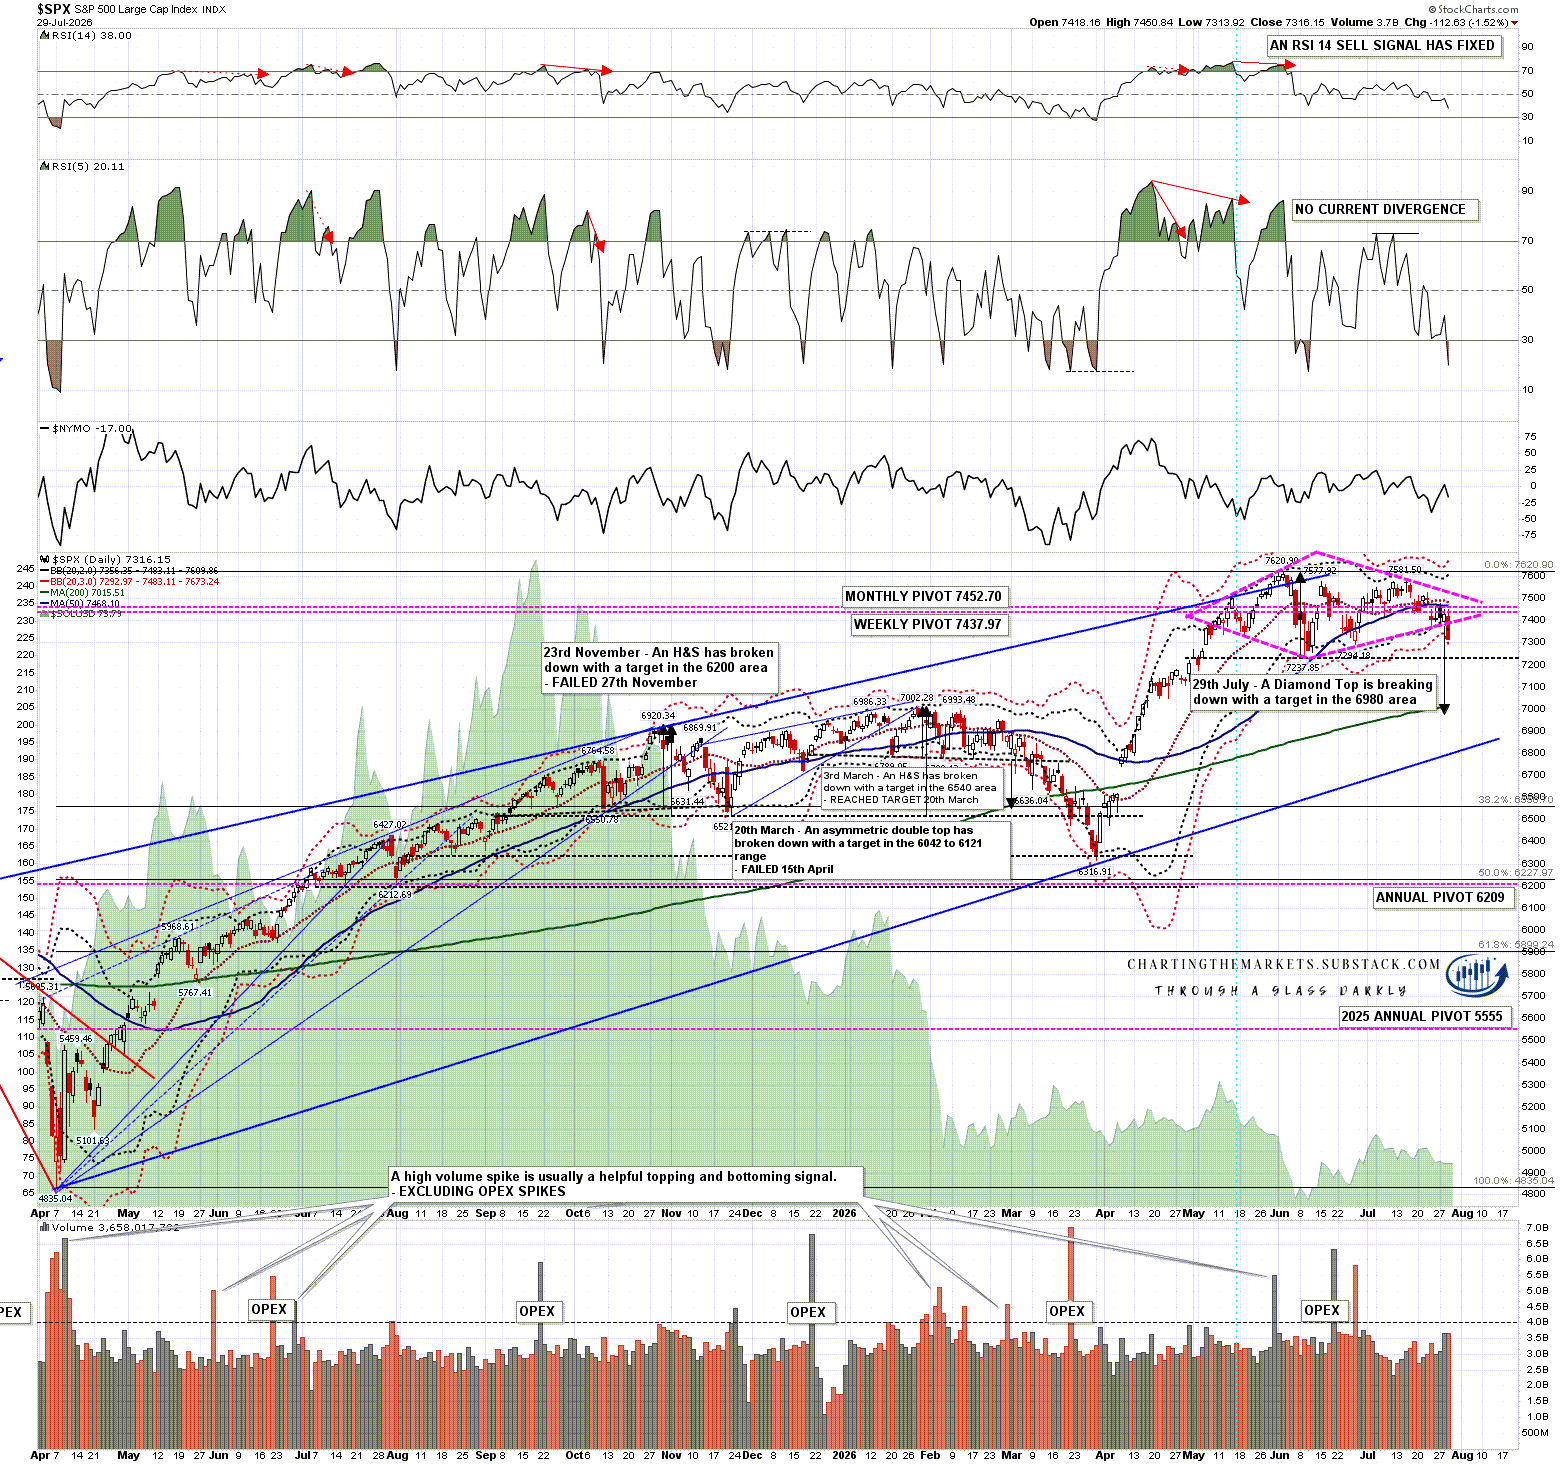
In my post yesterday I was looking at the diamond top on the SPX daily chart which was starting to break down, and then went on to close the day with a clear break below it. The falling and possible bull flag channel on TSLA also broke down by the end of the day. There are now a lot of fixed downside targets on equity indices so today I’m going to lay out all the main ones that I am watching.

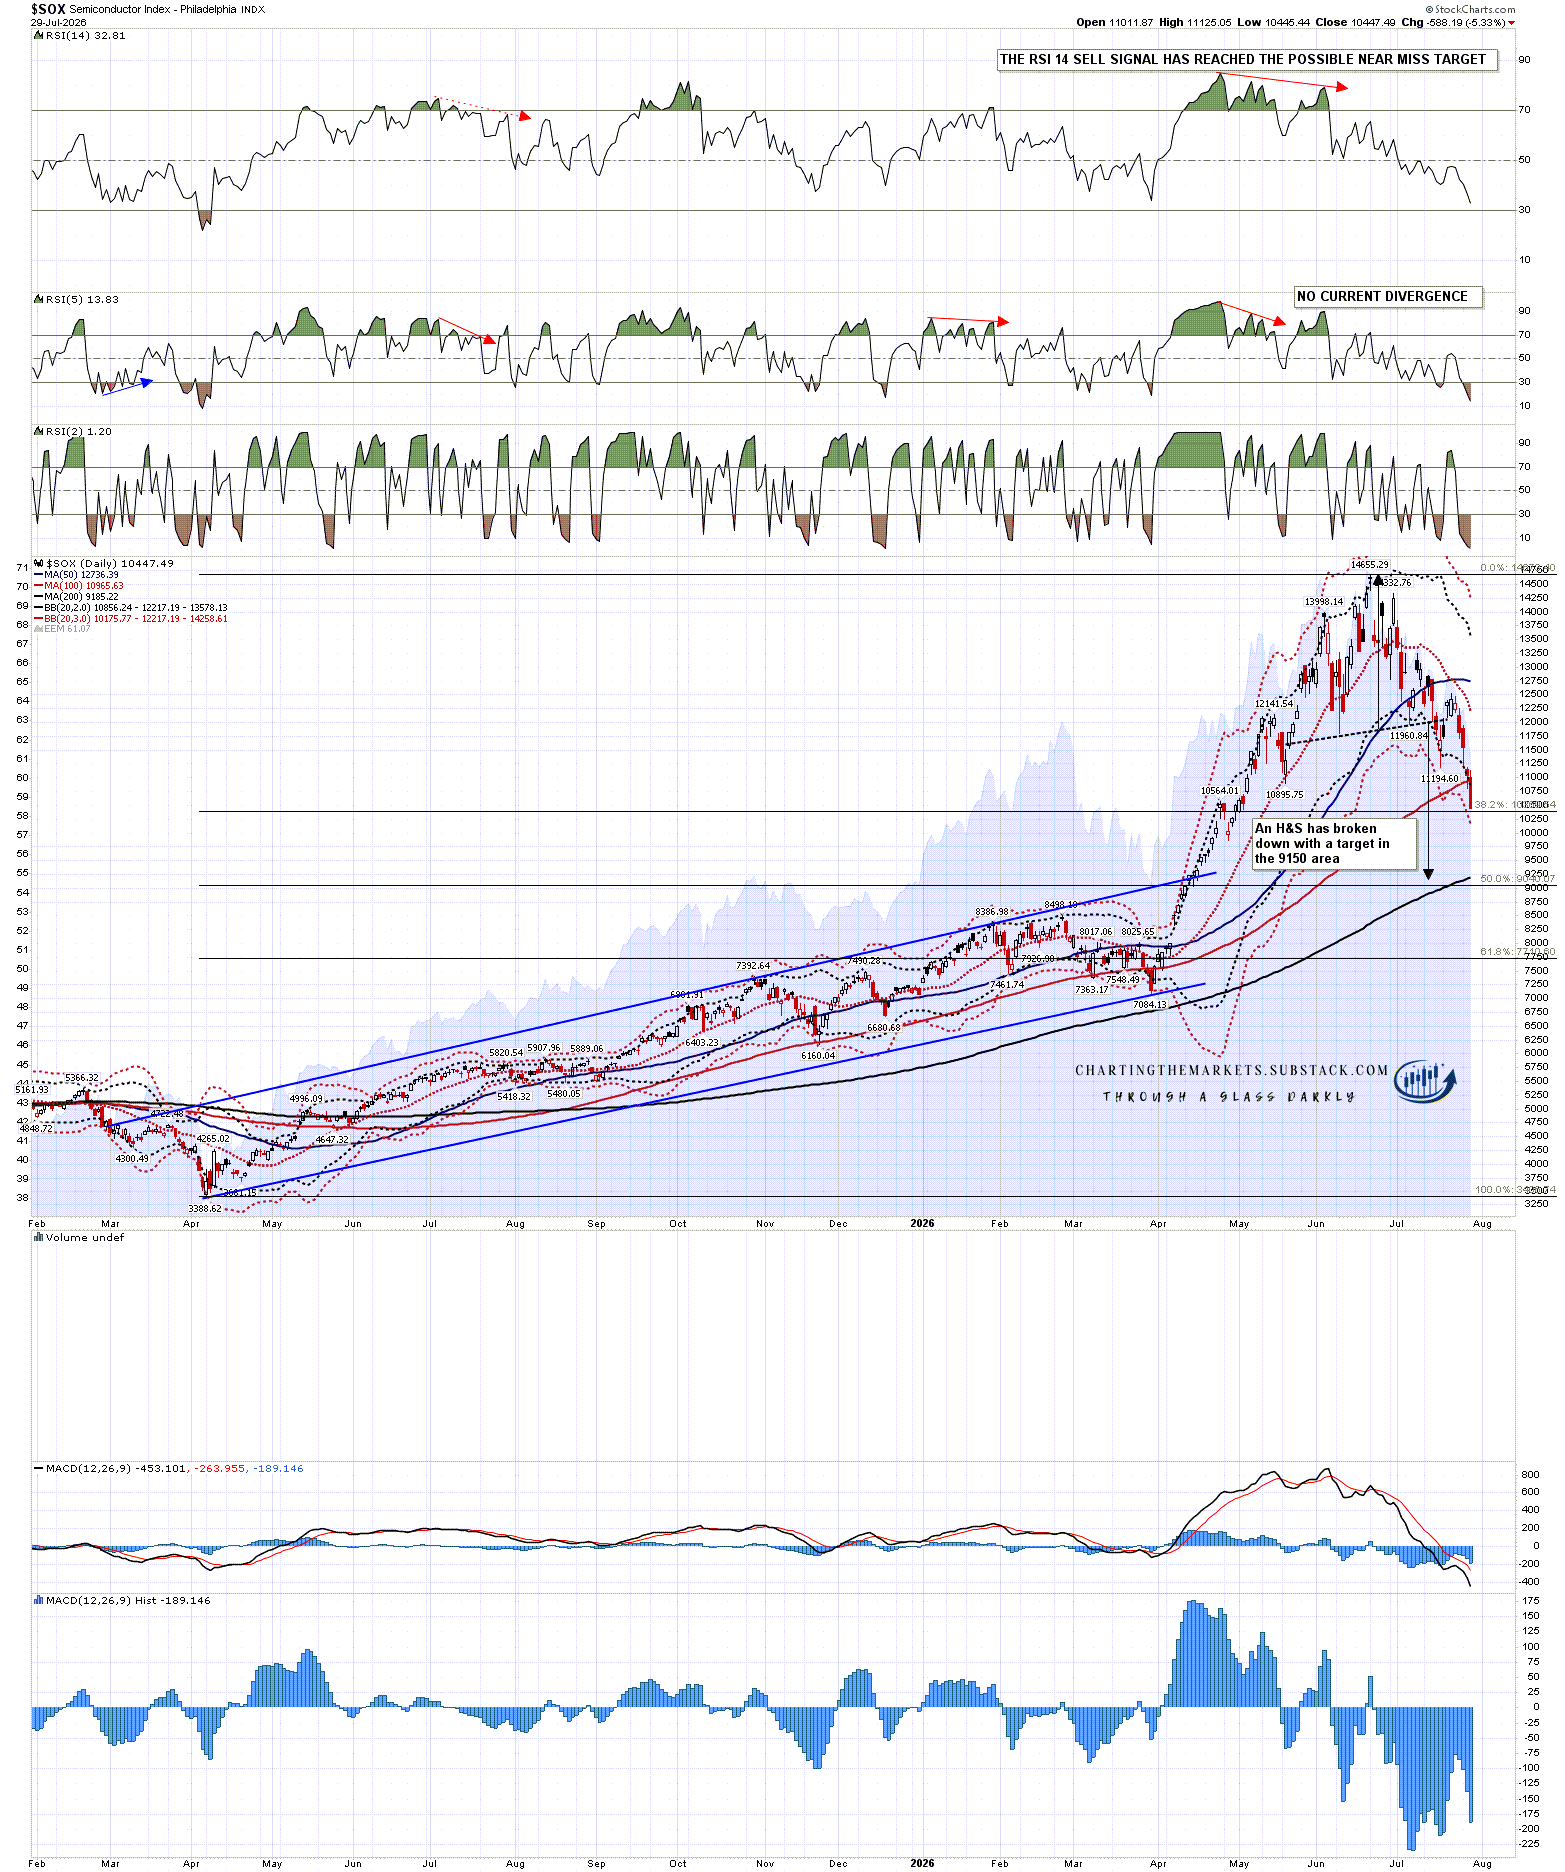
This decline is led by Tech, so the first target is the one the H&S that I have been posting on the Philadelphia Semiconductor Index (SOX). That target is in the 9,150 area, and I can’t see any reason to think that target won’t be reached.

SOX daily chart:

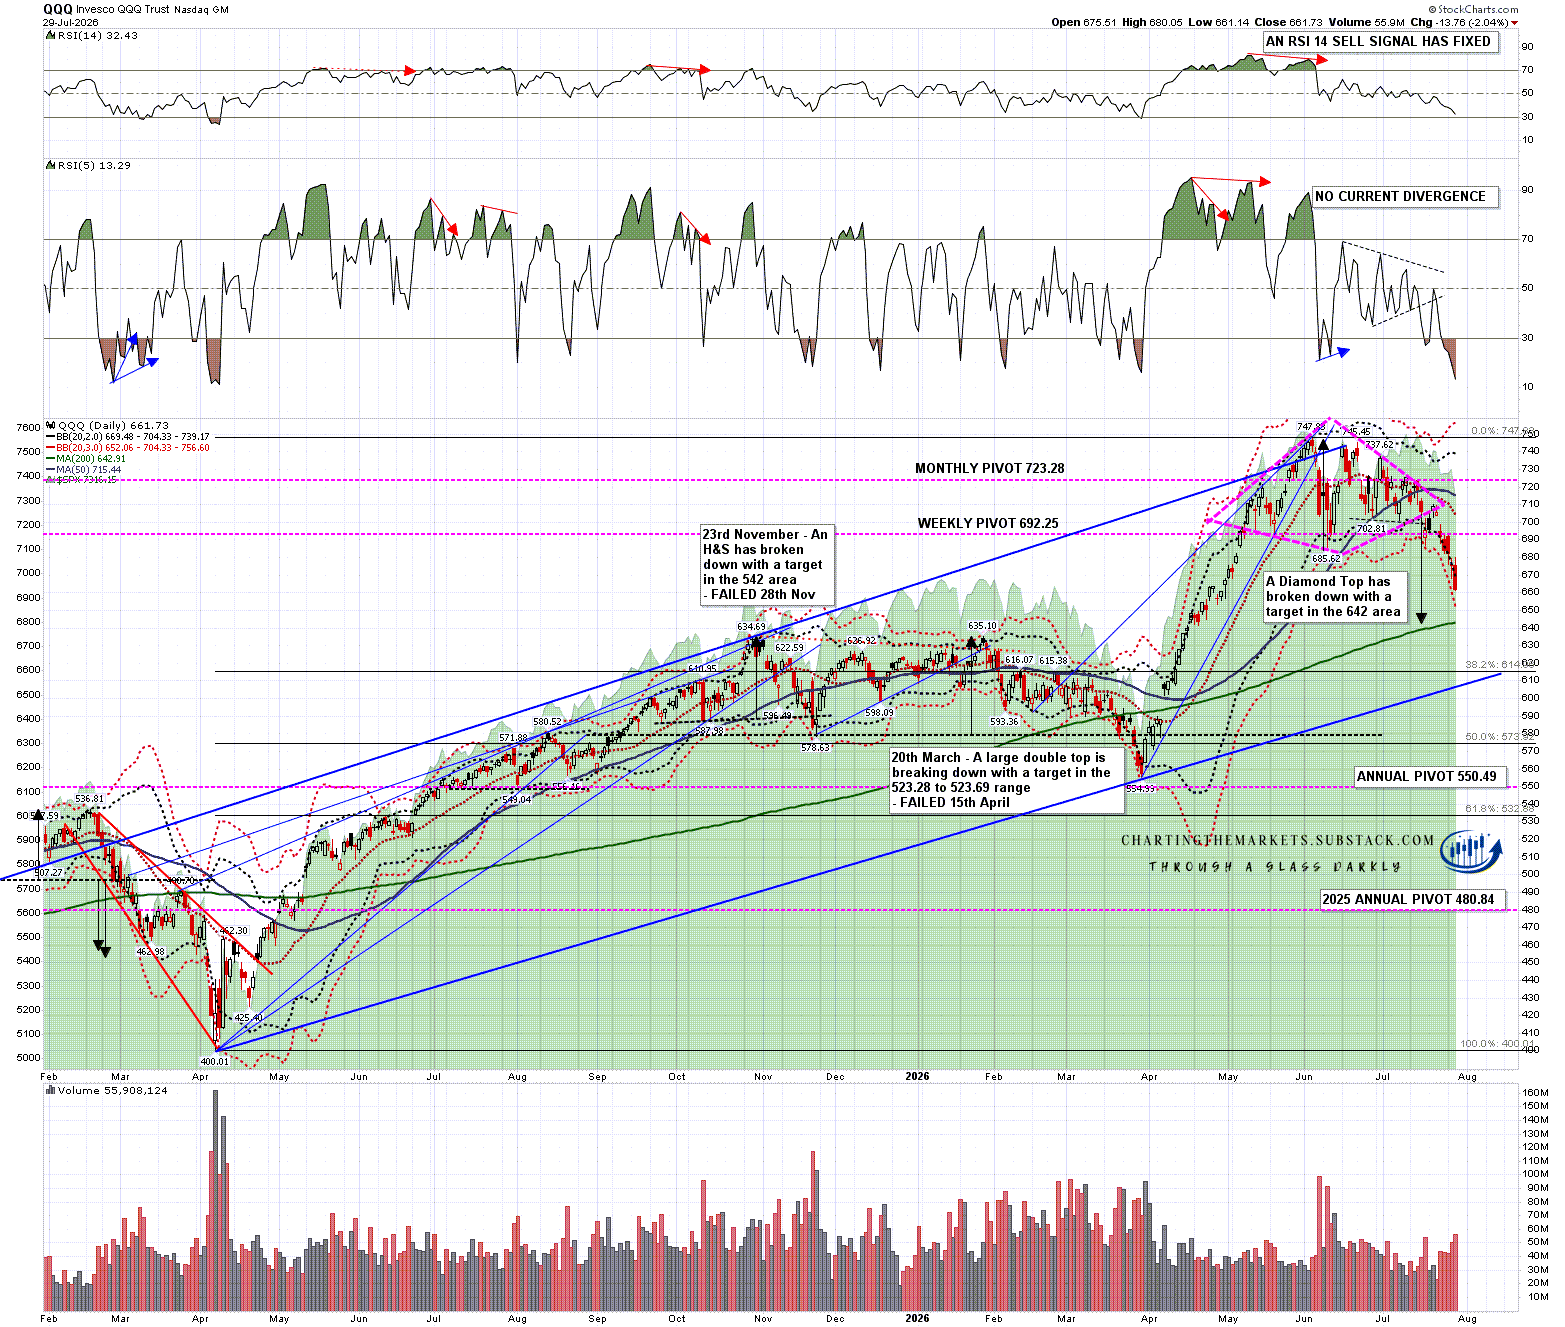
The other main Tech index is NDX if course and on QQQ, the NDX ETF, the diamond top target there is in the 642 area. That’s getting close, and if SOX, SPX and so on are to reach their targets I’d expect QQQ to go lower. The obvious next target would be the rising support trendline from the April 2025 low, currently on the 607 area.

QQQ daily chart:

On SPX, with a large Tech component, the diamond top target is in the 6980 area.

SPX daily chart:

The downside targets on IWM and DIA are more modest, as the Tech component is lower, and I’m showing these on the 15min charts relative to the move up from the late March low.

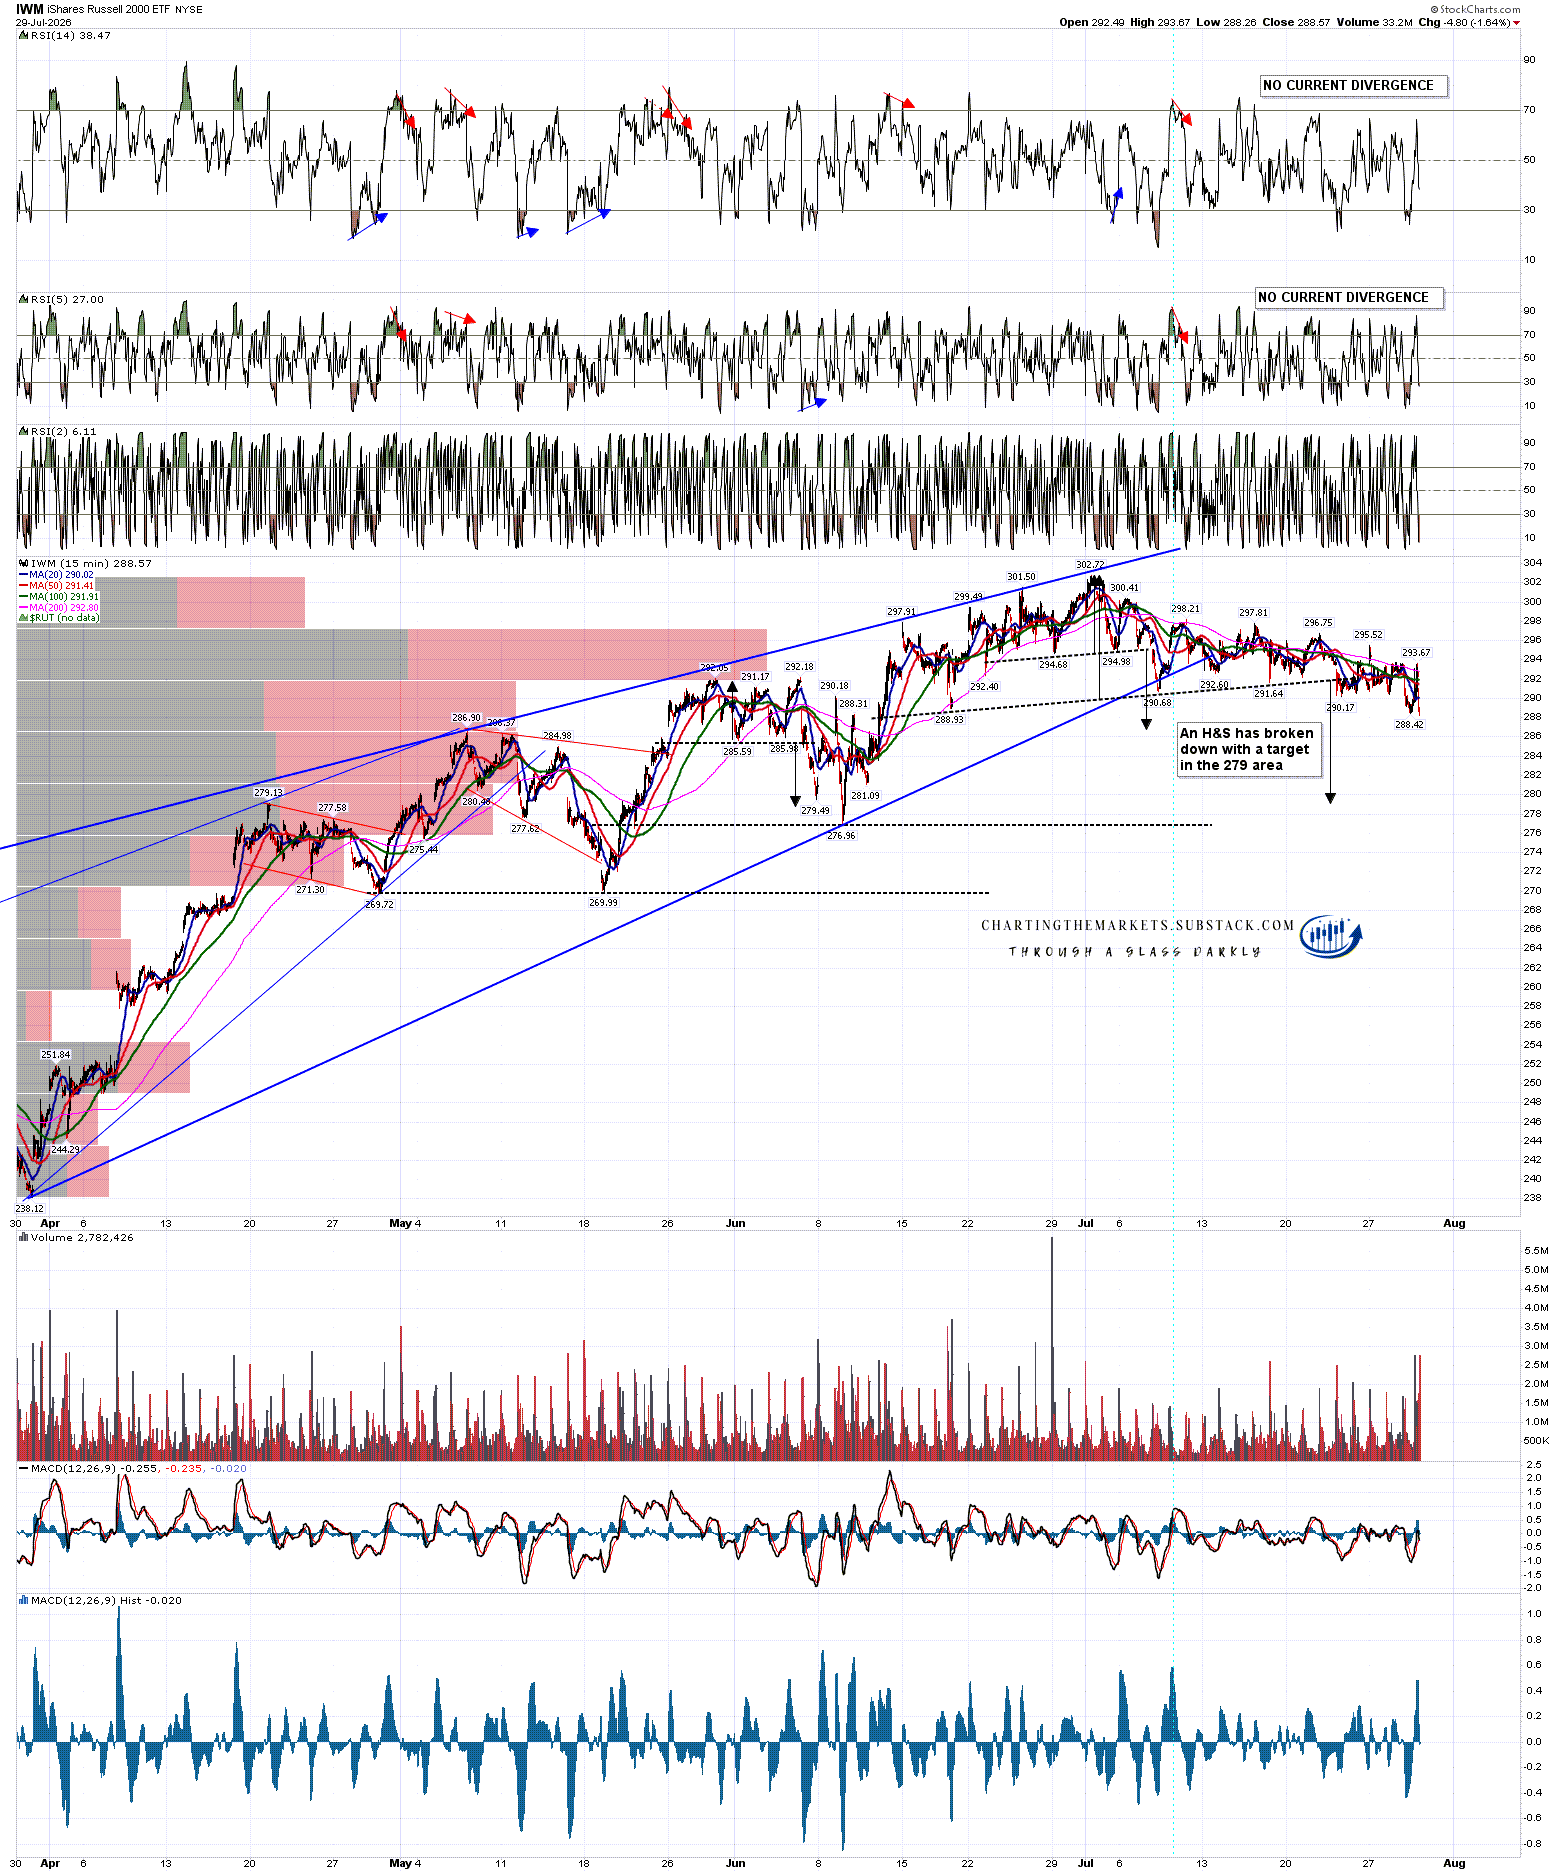
On IWM an H&S has broken down with a target in the 279 area.

IWM 15min chart:

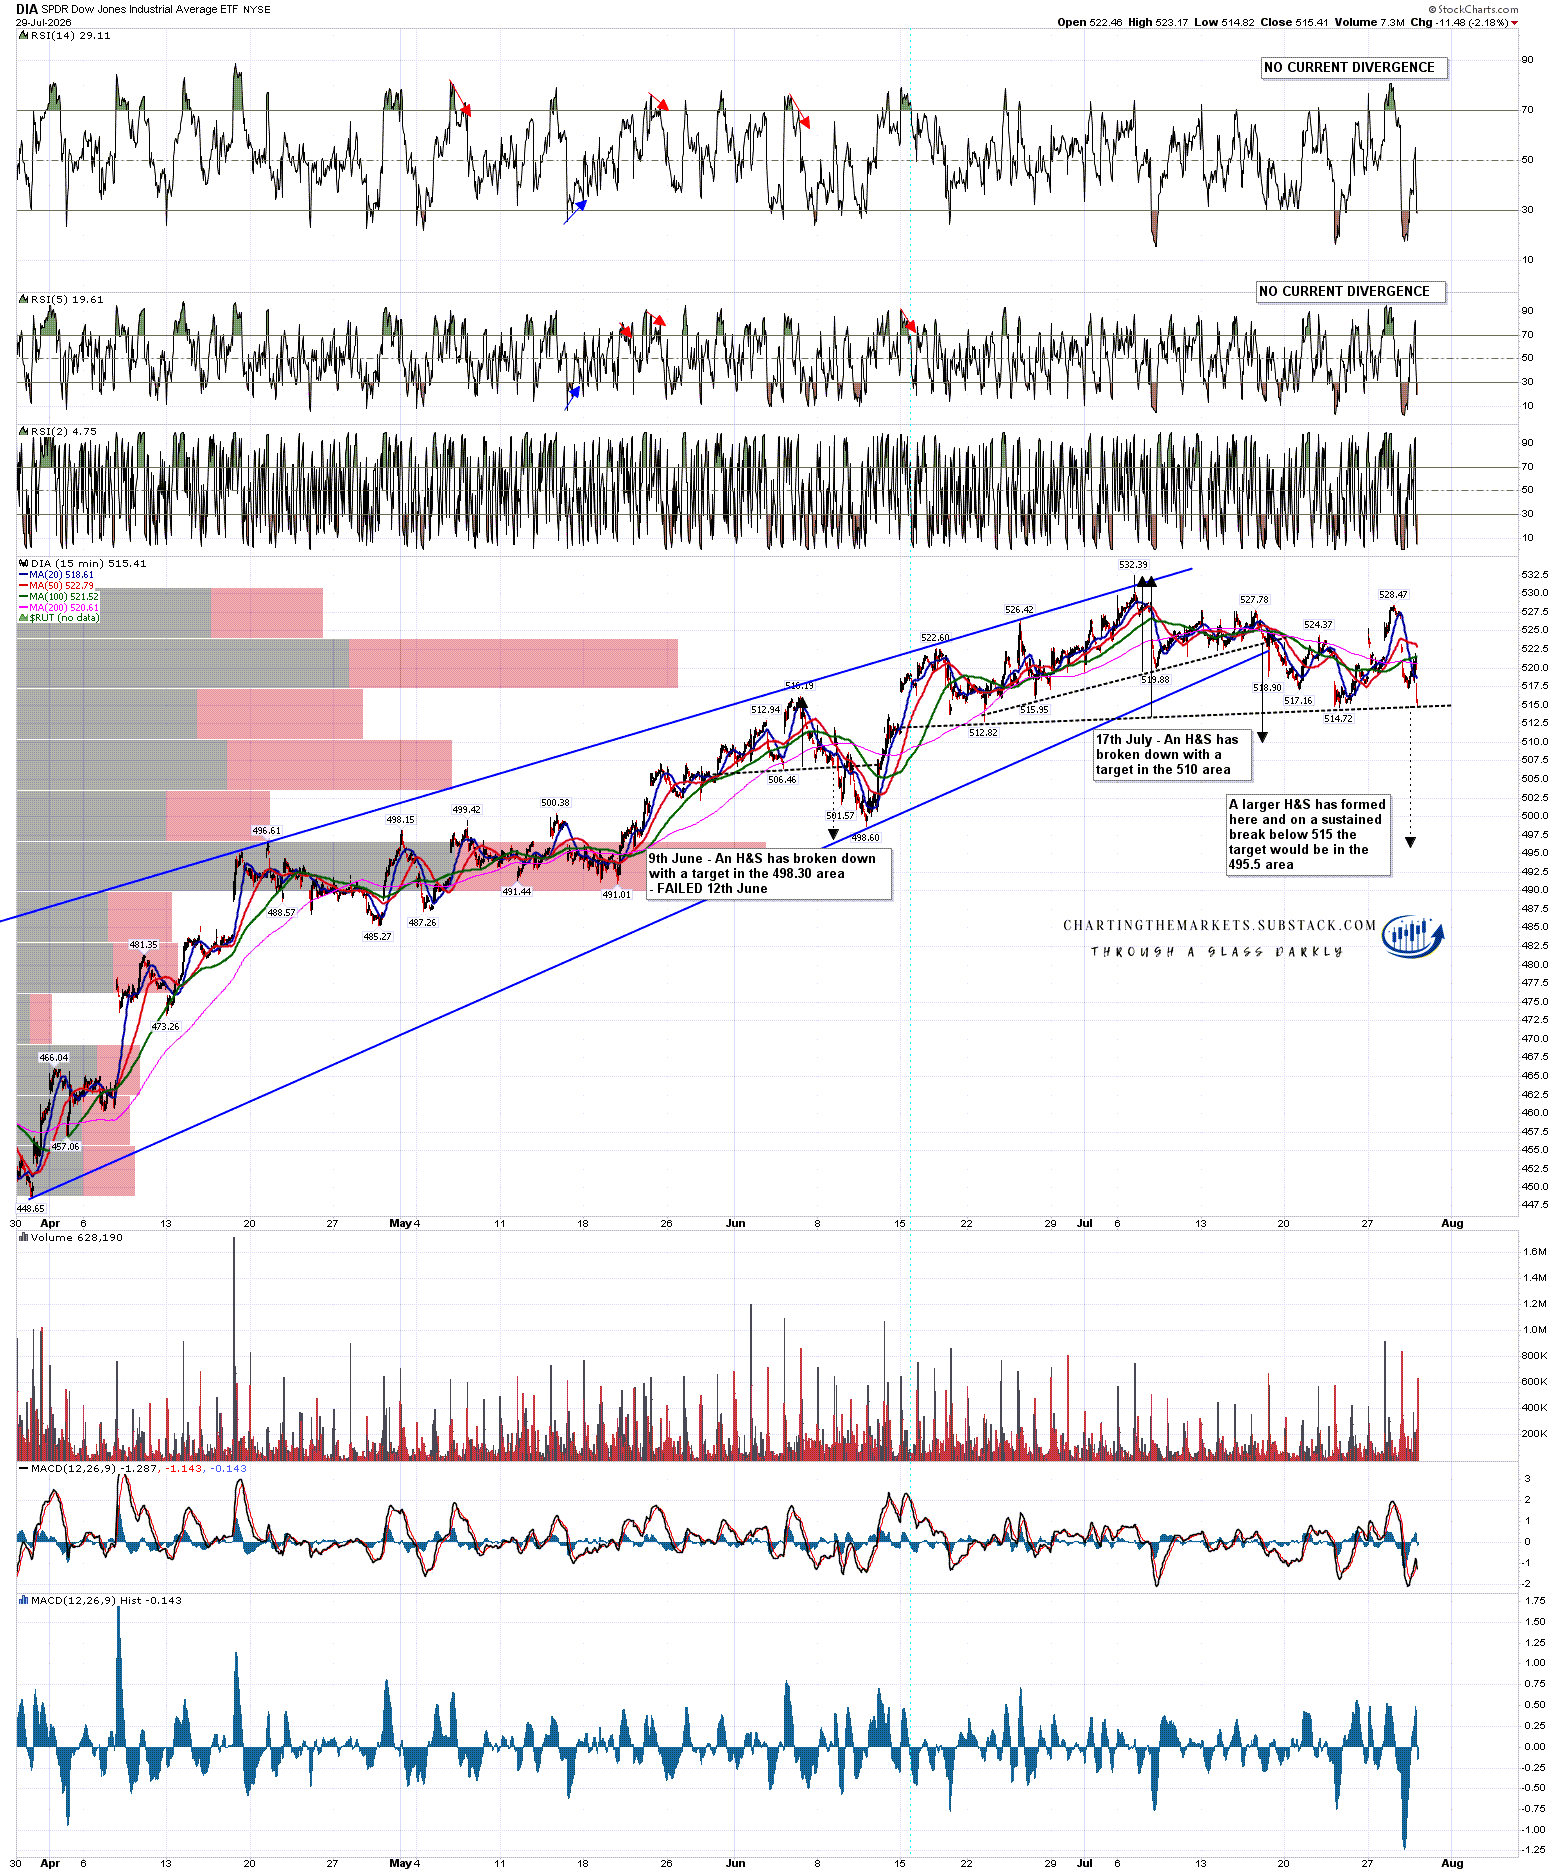
On DIA a small H&S has already broken down with a target in 510 area. A larger H&S has now also formed and was testing the neckline at the low yesterday. On a sustained break below that neckline the larger H&S target would be in the 495.5 area.

DIA 15min chart:

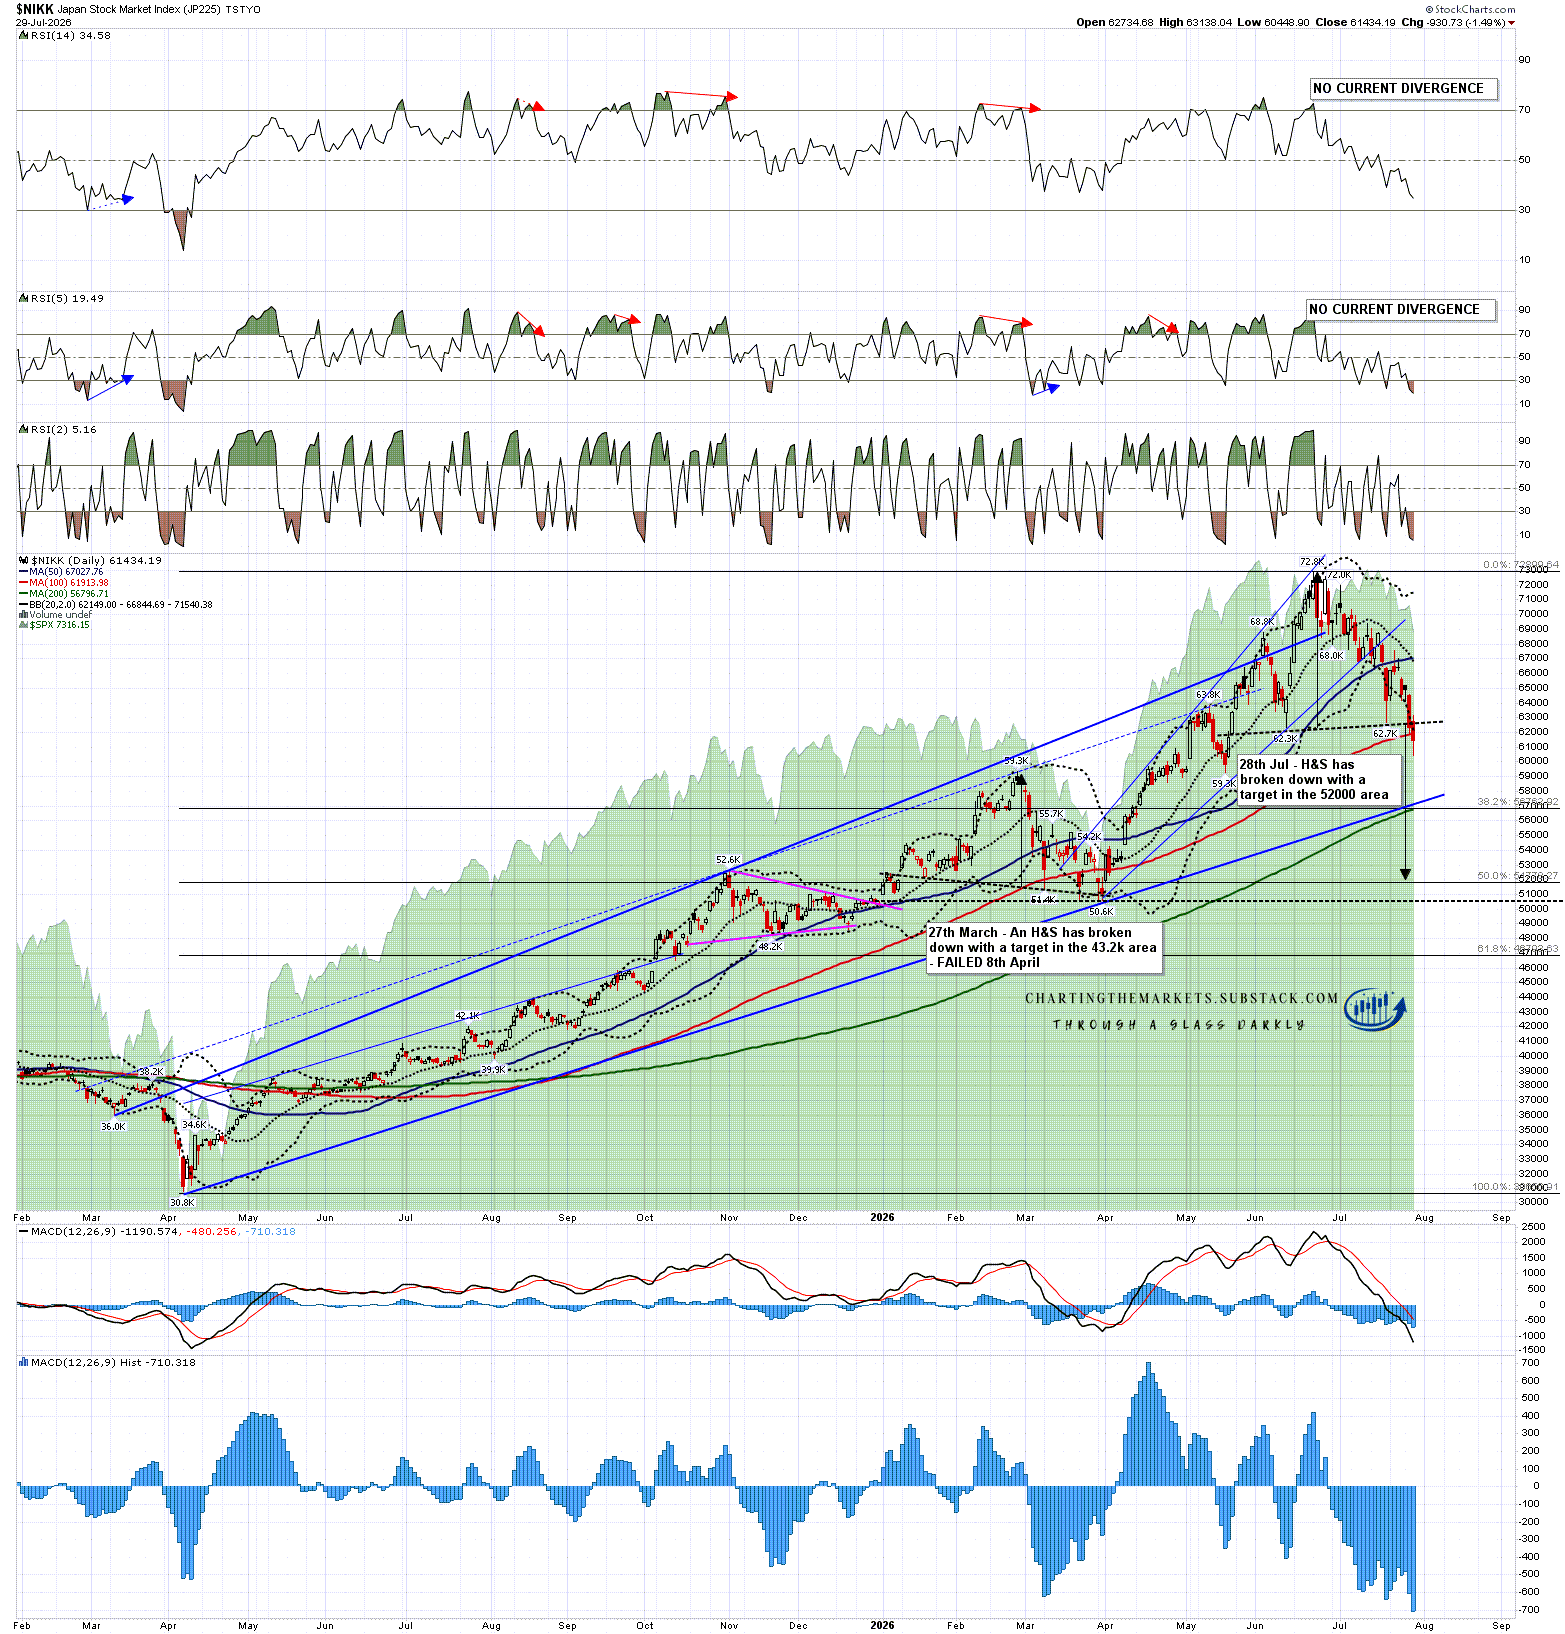
My last chart today is the Nikkei 225, which has broken down this week with a target in the 52,000 area, close to a 50% retracement of the move up from the April 2025 low.

NIKK daily chart:

If you like my analysis and would like to see more, please take a free subscription at my chartingthemarkets substack, where I publish these posts first. I also do a premarket video every day on equity indices, bonds, currencies, energies, precious commodities and other commodities at 8.45am EST, but only for paying subscribers. Other places to find me are my page on the platform previously known as twitter, and my YouTube channel.


Wednesday, 29 July 2026

Diamonds in the Rough

In my post on Thursday last week, among other things, I was looking at the strong rally on the Philadelphia Semiconductor Index (SOX) and looking at the very binary setup there where was (and is) likely either to head down to the fixed H&S target in the 9,150 area or, on a break back over the right shoulder high at 13,249.07, to reject back up to a retest of the all time high.

Since then SOX has given back all of that rally and made lower lows, which is favoring the move to the H&S target in the 9150 area. I would add that this H&S target is also close to the 200dma, currently at 9186.52, a very attractive target area.

SOX daily chart:

In my post yesterday I was looking at various patterns and noting that equity indices might break down from this area. One chart I didn’t post for space reasons mainly, but I have been looking at most days for subscribers, was the possible bullish leaning triangle on my SPX hourly chart. That triangle support trendline is starting to break down this morning.

SPX 60min chart #1:

What does this mean? Well it means that it is likely no longer a bullish triangle and after reading a comment yesterday that I saw on the platform formerly known as twitter, I redrew this as a possible diamond top and it looked pretty good.

SPX 60min chart #2:

Now on the hourly chart there is already a small H&S that has broken down with a target at a retest of 7294.18, but if this is a diamond top breaking down then that top has a target in the 6980 area, in effect a backtest of the 200dma, currently at 7015.85. That is a pretty obvious target area to backtest even in an ongoing uptrend.

SPX daily chart:

So is there any support for this diamond top thesis? Well the suggestion I saw yesterday was actually talking about NDX, so I had a look on QQQ and there is an even nicer version there, which had already broken down and is well on the way to the target in the 642 area, also close to the 200dma, currently at 642.95. If we see an extension lower from there the obvious target would be rising support from the April 2025 low, currently in the 608 area.

QQQ daily chart:

Backtests of the 200dma or key support trendlines are just retracements and if a larger top is forming here I’d be seeing this as part of the topping process, but we may be seeing the start of a break down to really get that ball rolling.

Is there an important support level I’m watching that has not yet broken? Not on an index but I’m watching TSLA closely here.

On the TSLA daily chart an asymmetric double top broke down in March with a target in the 265-290 range and TSLA is currently testing 300, but the very interesting thing that happened on the way down is that a perfect falling channel formed that could be a bull flag. That falling channel support is being tested now and as these don’t tend to under or over throw, a clear break below channel support would kill the channel. Until then though TSLA could hold this support and reverse back up towards falling channel resistance, currently in the 428 area.

TSLA daily chart:

There are a lot of issues with equity markets here. The Iran War certainly isn’t improving confidence and is pushing up both inflation and uncertainty. There is serious talk that the Fed might raise interest rates at FOMC today in response to rising inflation, but the biggest issue short term is the weakness in Tech that I was illustrating with the SOX chart last Thursday. SOX has now more than given back all of last week’s rally and that H&S target is looking good. If that delivers then Tech will likely drag SPX down with it, and deliver some weakness on IWM and DIA too.

If you like my analysis and would like to see more, please take a free subscription at my chartingthemarkets substack, where I publish these posts first. I also do a premarket video every day on equity indices, bonds, currencies, energies, precious commodities and other commodities at 8.45am EST, but only for paying subscribers. Other places to find me are my page on the platform previously known as twitter, and my YouTube channel.
Tuesday, 28 July 2026

Mixed Feelings about Equity Indices

In my last post on Thursday I was looking at the solitary break back over the daily middle band on SPX and considering the possibility that SPX might go higher. SPX then broke back below the daily middle band again.

I was also looking at the strong rally on the Philadelphia Semiconductor Index (SOX) and looking at the very binary setup there where it is likely either to head down to the fixed H&S target in the 9,150 area or, on a break back over the right shoulder high at 13,249.07, to reject back up to a retest of the all time high.

SOX has since given back most of that rally, but is still in that same inflection point, as it may currently be forming a double bottom to go higher. A double bottom setup that forms at the current low at 11,194.60 could deliver a bigger rally or full rejection higher. A sustained break below would look for that 9,150 target.

SOX daily chart:

So as we stand after the failed rally yesterday, with all of SO, SPX, QQQ, DIA & IWM still below their daily middle bands, and all also on fixed daily RSI 14 sell signals, there is a clear opportunity to break lower here, and I’ll be watching for that today and tomorrow. Tomorrow leans bearish and is also FOMC, where the Fed may of course have bad news about inflation and interest rates.

So what are the other pattern targets looking lower here? Aside from on SOX there’s nothing that dramatic to see. On SPX a small H&S has broken down with a target at a retest of the late July low at 7294.18.

SPX 15min chart:

On IWM there is a larger H&S now that has broken down with a target in the 279 area.

IWM 15min chart:

On DIA a small H&S has broken down with a target in the 510 area, though a larger H&S may also be forming.

DIA 15min chart:

Is there a bull scenario here? Yes, though the Iran War news isn’t great and may well get worse. All of these H&S patterns, as with the H&S on SOX, are of course potentially bullish patterns if they fail on a break back over the H&S right shoulders.

There is a good quality daily RSI 5 buy signal that fixed yesterday on DIA, though it is the only one across these five indices and DIA tested but failed to break back over the daily middle band yesterday.

DIA daily chart:

There is also a potentially bullish setup on QQQ here, with what looks like a bull flag formed from the all time high, and possible RSI 14 and RSI 5 buy signals brewing on the hourly chart:

Overall equities are still in the same inflection area that they were in last Thursday but have moved back down to the bottom of that area. There is an opportunity to break lower here and, if we are going to see that happen, a decent timing opportunity to do that this week. This isn’t yet a strongly directional setup, but as long as all five of these equity indices remain below their daily middle bands, the odds lean towards continuation down. If we were to see a strong move higher though, these setups could all turn bullish with targets at retests of their all time highs.

If you like my analysis and would like to see more, please take a free subscription at my chartingthemarkets substack, where I publish these posts first. I also do a premarket video every day on equity indices, bonds, currencies, energies, precious commodities and other commodities at 8.45am EST, but only for paying subscribers. Other places to find me are my page on the platform previously known as twitter, and my YouTube channel.
Thursday, 23 July 2026

A Battle of a Band

In my post on Friday 12th June I was looking at an inflection point on multiple US equity indices where I was expecting to see a number of H&S patterns to fail with targets at retests of the all time highs (ATH). The H&S patterns failed, and we saw ATH retests on DIA and IWM, but never saw those ATH retests on SPX or QQQ.

The main reason we never saw those retests was the weakness on the Philadelphia Semiconductor Index (SOX) which dropped over 20% from the June high into the low last week.

There too we see another H&S, which has broken down with a target in the 9150 area and the main reason we have seen a decent rally attempt on SPX and QQQ this week is that we have been seeing a strong rally on SOX, with a possible target at the daily middle band, currently at 12,785.

SOX too is in an inflection point here, where either that H&S continues down towards the target, or rejects back up to the high. The dividing line for that is at the H&S right shoulder high at 13249.07.

SOX daily chart:

What are the chances that SOX is starting to reject back to the all time highs? Well there is a decent setup on the hourly chart, with a possible alternate bull flag falling wedge formed from the high. On the pattern setup I’d give this 70% odds of continuing down, and 30% odds of rejecting back up to the highs.

SOX 60min chart:

On SPX we saw a break back over the daily middle band on Tuesday, with a confirming close above yesterday. This could be the start of a break up towards towards an ATH retest, but we need to see more evidence of strength from SPX and from the other US indices, as all of DIA, IWM and QQQ are still closing below their daily middle bands.

SPX daily chart:

DIA has been testing the daily middle band over the last two days but has closed both days below:

DIA daily chart:

IWM has been testing the daily middle band over the last two days but has closed both days below:

IWM daily chart:

QQQ has been trailing the others over the last month, in significant part due to the weakness on SOX, and I was talking in my The Bigger Picture webinar on Sunday for paying subscribers on my The Bigger Picture substack (circa 5min mark) about QQQ hitting the 3sd daily lower band on Friday as that is a good level to see a decent rally. We’ve seen that rally but, as with SOX, QQQ is still well below the daily middle band and would need a strong break above it to open a retest of the ATH.

QQQ daily chart:

Is there a setup for SPX to fail here? Yes. On the 5min chart I drew in an ideal bear flag channel resistance trendline on Tuesday and as you can see, that trendline turned out to be the rally high so far. If we don’t see a break up on SPX I’d expect to see a retest of Friday morning’s low soon.

SPX 5min chart:

I’m keeping an open mind here as I still have those targets at retests of the all time highs on SPX and QQQ, and that looks like unfinished business. Overall though I think this setup is still leaning towards seeing a retest of last Friday’s lows next. A stronger and wider break up on US indices could change that, so we’ll see today or tomorrow whether that can be done.

If you like my analysis and would like to see more, please take a free subscription at my chartingthemarkets substack, where I publish these posts first. I also do a premarket video every day on equity indices, bonds, currencies, energies, precious commodities and other commodities at 8.45am EST, but only for paying subscribers. Other places to find me are my page on the platform previously known as twitter, and my YouTube channel.
Friday, 17 July 2026

Oil Update, Market Killing$ & Warning Shots

In my post on Tuesday 7th July I was looking at the setup for a strong rally on Oil starting and we have seen that strong rally since.

In my last post on Tuesday 14th July I was looking at the targets and resistance levels on Brent Crude (Brent) and West Texas Intermediate Crude (WTIC) and noting that both were getting close to their 3sd upper bands, and that the 89-90 area on Brent and 84-5 area on WTIC might well hold on those this week to allow the daily middle bands on both to start turning up, and for the daily bands to start expanding. Both peaked that day, spent two days forming bull flags, and have made higher highs today.

So what now?

Well I would mention that there has been a strong pattern during this war of ‘peace negotiations’ being announced on Sundays just before futures markets reopen. I don’t think that seems a big risk this weekend , as Trump appears to be wanting to escalate the war, and Iran seems disinclined to engage with the US at all, but there do seem to be strong incentives for some in the US administration to conduct talks regularly:

That said, now that Brent and WTIC have had some time for the daily bands to turn and expand, and with more data points from the bull flag lows, it’s time to look at upside targets and resistance levels again.

On the Brent daily chart the middle band has turned up and the bands are now expanding. Brent is close to a test of the 50dma at 89.41, and the 3sd upper band is now at 92.46, up from 89.18 at my post on Tuesday. As the bands expand the 3sd upper band can get to a stage of rising several dollars per day.

BRENT daily chart:

On the Brent hourly chart an RSI 14 sell signal fixed but didn’t make target at the flag low. That’s worth bearing in mind but these regularly fail in strong uptrends. As I mentioned on Tuesday there is some established (potential support turned) resistance in the 89.5 to 90 area, an open IHS target in the 91.6 area and a rising channel has been established from the right shoulder low with channel resistance currently in the 93.25 area.

There are two possible IHS necklines that might be the next big target, with my preferred option in the 98.99 area, and a less good option in the 96.36 area.

BRENT 60min chart:

On the WTIC daily chart the middle band has turned up and the bands are now expanding. WTIC is close to a test of the 50dma at 85.21, and the 3sd upper band is now at 86.03, up from 84.36 at my post on Tuesday. As the bands expand the 3sd upper band can get to a stage of rising several dollars per day.

WTIC daily chart:

On the WTIC hourly chart an RSI 14 sell signal fixed but didn’t make target at the flag low. That’s worth bearing in mind but these regularly fail in strong uptrends. As I mentioned on Tuesday there is some established (potential support turned) resistance in the 86 area, an open IHS target also in the 86 area and a likely rising wedge has been established from the right shoulder low with wedge resistance currently also in the 86 area.

There are two possible IHS necklines that might be the next big target, with my preferred option in the 96.98 area, and a less good option in the 93.65 area.

WTIC 60min chart:

In terms of how far all this goes, that is to a large extent dependent short term on the status of the Iran War, though I think enough supply chain damage has already been done that even if the war was to end this weekend, oil might well be impressively volatile for another year or two.

In terms of how the war goes it could get a whole lot worse. I’ve been mentioning the worst scenarios regularly in recent months, and mentioned it again in my equities post this morning on my main substack. On the less bad scenario Iran may attack oil and gas infrastructure in Gulf neighbours and extensive damage could be done that might take years to repair. On the disaster scenario Iran attacks water desalinisation infrastructure in Gulf neighbours and all the Gulf states apart from Iran and Iraq might become semi to mostly uninhabitable until that infrastructure was rebuilt.

Iran has been clear that they won’t do that unless the US starts attacking their civilian infrastructure and this week the US has started attacking their civilian infrastructure. In response Iran attacked oil infrastructure in Bahrain yesterday and a water desalinisation plant in Kuwait overnight in what appear to be warning shots to the US to change direction. We’ll see how that develops this weekend but further escalation has the potential to send oil prices into uncharted territory, which would be over $225 per barrel on both Brent and WTIC, adjusted for inflation.

Are the Trump administration insane enough to risk this disaster scenario in the Persian Gulf? Yes, in that they have already started down that road this week despite clear warnings from Iran. We may find out whether they are prepared to continue risking that this weekend. I’ll be watching with interest & everyone have a great weekend. :-)

If you like my analysis and would like to see more, please take a free subscription at my thebiggerpicture substack, where I publish these posts first and for members (from next week) also bi-weekly videos looking at equity indices, bonds, currencies and commodities. Those videos are posted on my Youtube channel after a seven day delay. Links to all my posts from my charting substacks are also always posted on my twitter.

Washing the Windows

It has been a few weeks since I wrote a post about the US equity markets and in large part that has been because while the short term patterns and setups are still important, and I’ve still been looking at those in detail in my daily premarket videos for subscribers, the background to this market, while generally ignored, has been becoming increasingly obvious and divergent from what we are watching on the surface.

I was talking to a friend about this yesterday and compared it to washing the windows on a house that was burning down. I said that as this happened the person washing the windows would either be unaware that the house is burning down, or didn’t yet see why that might be important. Only when that perception changed would he/she stop washing the windows.

Donald Trump signed the MOU with Iran at Versailles twenty nine days ago, and said then that he had to sign it as the world was three or four weeks away from a major economic crisis if the Strait of Hormuz was not reopened. I thought that assessment was reasonable. The peace lasted two or three weeks, a lot of oil cleared through the Strait, but not enough to change more than the timing of that major economic crisis. Since then the war resumed ten days ago, the Strait is closed again, and the war is escalating.

World oil stocks are at low levels not seen in decades, the US has started bombing civilian targets in Iran and Iran is starting in response to bomb civilian targets in the territory of US allies in the Gulf, who have themselves started to get more involved directly in this war. This is a huge powder keg, the fuse is lit, and the world economy is sitting on top of it. If Iran starts large scale attack on oil infrastructure in the Gulf or, worse, water infrastructure, that powder keg will explode, and the effect on the world economy may be devastating.

So I’m going to be looking at the surface of the markets while this continues, but also this background to this market that may at any point become much more prominent in market sentiment.

In terms of the surface of the markets I was writing in my last post on 12th June that I was looking for new highs on US equities and we saw those on IWM and DIA. We didn’t see those on SPX or QQQ, mainly because Tech has been lagging other US indices for several weeks now and dragged SPX down with it. That’s not because of the Iran War and may well continue and get worse. I would still very much like to see an all time high retest on SPX and on the daily chart SPX is holding up well and came within 40 handles of an all time high retest this week.

SPX daily chart:

The picture on QQQ is not encouraging though, with QQQ failing to hold above the daily middle band in recent weeks, though an overall bull flag may be forming here.

QQQ daily chart:

IWM has also lost the daily middle band in recent days, and has also broken down yesterday below the rising support from the late March low.

IWM daily chart:

I’ve been watching possible topping patterns on the hourly futures charts this week and overnight ES broke down from a high quality double top with a target in the 7430 area.

ES Sep 60min chart:

If this break down on ES is sustained today then I have two other topping patterns that I have been watching form on US indices this week.

The first of those is on RTY, where a good quality possible H&S has been forming that on a sustained break down would look for the 2820 area.

RTY Sep 60min chart:

The second of those is on YM, where a decent quality possible H&S has formed that on a sustained break down would look for the 50,500 area.

YM Sep 60min chart:

This is a fragile market, and if confidence cracks we could see a fast move downwards. Is today the day that starts? Possibly, we’ll see. Everyone have a great weekend. :-)

If you like my analysis and would like to see more, please take a free subscription at my chartingthemarkets substack, where I publish these posts first. I also do a premarket video every day on equity indices, bonds, currencies, energies, precious commodities and other commodities at 8.45am EST, but only for paying subscribers. Other places to find me are my page on the platform previously known as twitter, and my YouTube channel.