- WE'RE JUST RANDOM SPECKS OF DUST IN A TORNADO TO THE MARKETS .......
- CHARTISTS MUST PUT ALL BIAS ASIDE AND LET THE CHARTS DO THE TALKING OR WE'LL SEE ONLY WHAT WE WANT TO SEE
- This blog has a copy of all header posts that I publish anywhere, so that those interested in seeing what my thoughts are on the markets can find them easily.
- I will be answering questions and responding to comments, so feel free to respond to any posts and I will see your comment even if it is not on the most recent post.
- If you're interested in seeing any intraday charts I post, I do that on twitter, and my twitter handle is @shjackcharts.
- The charts in the posts are as large as I can practically make them. if you would like to look at one more closely, click on it, and the link will take you to a larger version at screencast. If you click on that again, you will get a full page version, and can use the resizing function on your browser to enlarge parts of interest further.

Friday, 28 August 2020

SPX Approaches Main Resistance

 SPX has gone through a lot of trendlines and divergence on this amazing move up, with the last lot breaking on the move over the 3350 area including the negative divergence on the daily RSI.

SPX is very stretched here, has punched 100 handles over the monthly upper band, touched an amazing 7.1% above the 45dma when I last annotated that chart yesterday, and is now close to testing the last and largest resistance trendline on the chart.

That trendline starts at the March 2009 low, held support at the 2010 low, and then was touched as resistance at highs in 2011, 2012, 2014, 2017/8, 2020 and is now close to being tested as resistance again. That trendline hasn't broken as resistance since SPX crossed below it in 2011, and I have it in the 3510-20 area at the moment, though that is an approximation on a trendline that is now more than eleven years old. At the time of writing SPX has reached a new all time high at 3508.07.

Is this trendline going to hold? Well we'll see, this really has been an amazing move, but that really should hold as resistance.

SPX Monthly chart:

That's a decent match with a shorter term trendline on the SPX 15min chart below so we may be seeing that test soon and I'll be watching that with great interest.

SPX 15min chart:

On the bigger picture SPX reached an eye-watering 7.1% above the 45dma. That's only been exceeded once at a high in the last eight years and that was in June this year. A return to the mean move cannot be far away. and might well start at a test of the main resistance trendline now only slightly above.

SPX daily vs 45dma 2017-date:

Just as an aside this last phase up of the move from June has been a very narrow move based on tech and large caps.That's very clear on the hourly SPX equal weighted chart which has not yet retested the June high, and is still a good 10% short of a retest of the all time high.

SPXEW 60min chart:

This is a very important test for SPX, and if resistance holds then the return to the mean retracement should start next week, and SPX may make a major high. If it does hold then I'd note that the obvious next target on the monthly chart would be a return to the rising megaphone pattern support for which that trendline is the resistance trendline. That's currently slightly under 2300 of course.

Everyone have a great weekend :-)

Thursday, 20 August 2020

Degrees Of Separation

 My apologies for my being unusually quiet over the last few days, My wife of 23 years and I are starting the process of getting divorced and I have been distracted by that. It's definitely for the best, and likely this would have started a year ago if she had not been diagnosed with cancer then. She is now clear and largely recovered, and the reality that we really shouldn't still be married to each other any longer has been brought into very sharp focus by COVID-19 and the quarantine this year, as I suspect it has for quite a few couples, so we are starting the process of correcting that. Our children are old enough now, are supportive of the split and it is just one of those things.

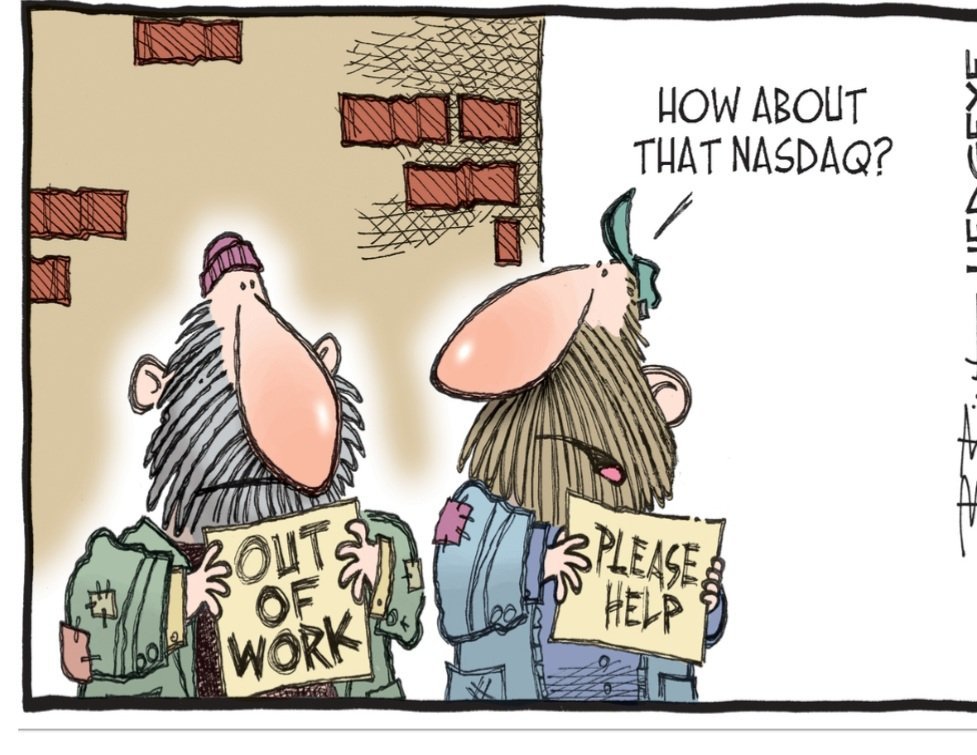
On to the markets where SPX has made the new all time high that seemed likely and where stock markets seem very disconnected from the real economy of eye-wateringly high unemployment, social distancing and sagging consumer demand. Is this sustainable? Well as always time will tell but I suspect not. We'll see.

I'm not sure who drew this outstanding cartoon below but many thanks to the artist for expressing the quiet satisfaction that US Main Street must be feeling now about the Nasdaq and the S&P 500 hitting new all time highs : -)

SPX isn't any more stretched than it was at the time of my last post, but it is still very stretched and there is a good argument and setup for thinking that the next retracement to the mean is starting here. The minimum retracement to the mean for me would be a backtest of the 45dma, currently in the 3238 area.

SPX chart vs 45dma:

Would that retracement to the mean move stop at the 45dma? No, historically it would often then continue down to the 200dma, currently in the 3072 area and the obvious next target on a break and conversion of the 45dma to resistance. Decent quality daily RSI 14 and RSI 5 sell signals are now brewing but need more downside to fix.

SPX daily chart:

On the SPX hourly chart an RSI 14 sell signal has now fixed and rising wedge support from the March low has broken. I haven't marked it in but there is a decent quality double top setup that would be targeting the 45dma area on a break down.

SPX 60min chart:

On NDX there is now a really very nice overall rising wedge from the March low and NDX may be topping out for a significant high here. A daily RSI 14 sell signal has already fixed, as well as this hourly RSI 14 sell signal on the chart below and I'm watching that rising wedge support, currently in the 11150 area, for a possible break down. 

NDX 60min chart:

Stan and I are doing our monthly big 5 and sectors free public webinar at theartofchart.net tonight and if you'd likely to attend you can sign up for that on our August Free Webinars page or the direct link that I will be tweeting on my twitter shortly after I publish this post.