- WE'RE JUST RANDOM SPECKS OF DUST IN A TORNADO TO THE MARKETS .......
- CHARTISTS MUST PUT ALL BIAS ASIDE AND LET THE CHARTS DO THE TALKING OR WE'LL SEE ONLY WHAT WE WANT TO SEE
- This blog has a copy of all header posts that I publish anywhere, so that those interested in seeing what my thoughts are on the markets can find them easily.
- I will be answering questions and responding to comments, so feel free to respond to any posts and I will see your comment even if it is not on the most recent post.
- If you're interested in seeing any intraday charts I post, I do that on twitter, and my twitter handle is @shjackcharts.
- The charts in the posts are as large as I can practically make them. if you would like to look at one more closely, click on it, and the link will take you to a larger version at screencast. If you click on that again, you will get a full page version, and can use the resizing function on your browser to enlarge parts of interest further.

Thursday, 8 October 2020

Mundane Objects

 Well I tried to talk about face masks and COVID-19 in my last post and that was my least popular post in years. I would note from the responses that wearing a mask is primarily for the protection of others from those infected with COVID-19, so wearing one is not so much a matter of personal courage as consideration for others. In response to a couple of questions I was asked I would also add that I'm happy to say that I am in a low risk age group, and that the only member of my family in a high risk group has already had and survived the virus so personally I'm not too concerned. Be all that as it may it seems that I should abandon trying to talk about COVID-19 until after the presidential election.

In the meantime, and on the theme of otherwise mundane objects attaining a strange symbolic significance I have a lovely little clip from Blackadder Series 4 to share with one of my favorite ever comedy monologues on the origins of British humor from a german perspective. That part is from 55 to 90 seconds in but the rest of the clip is also excellent. Enjoy :-)

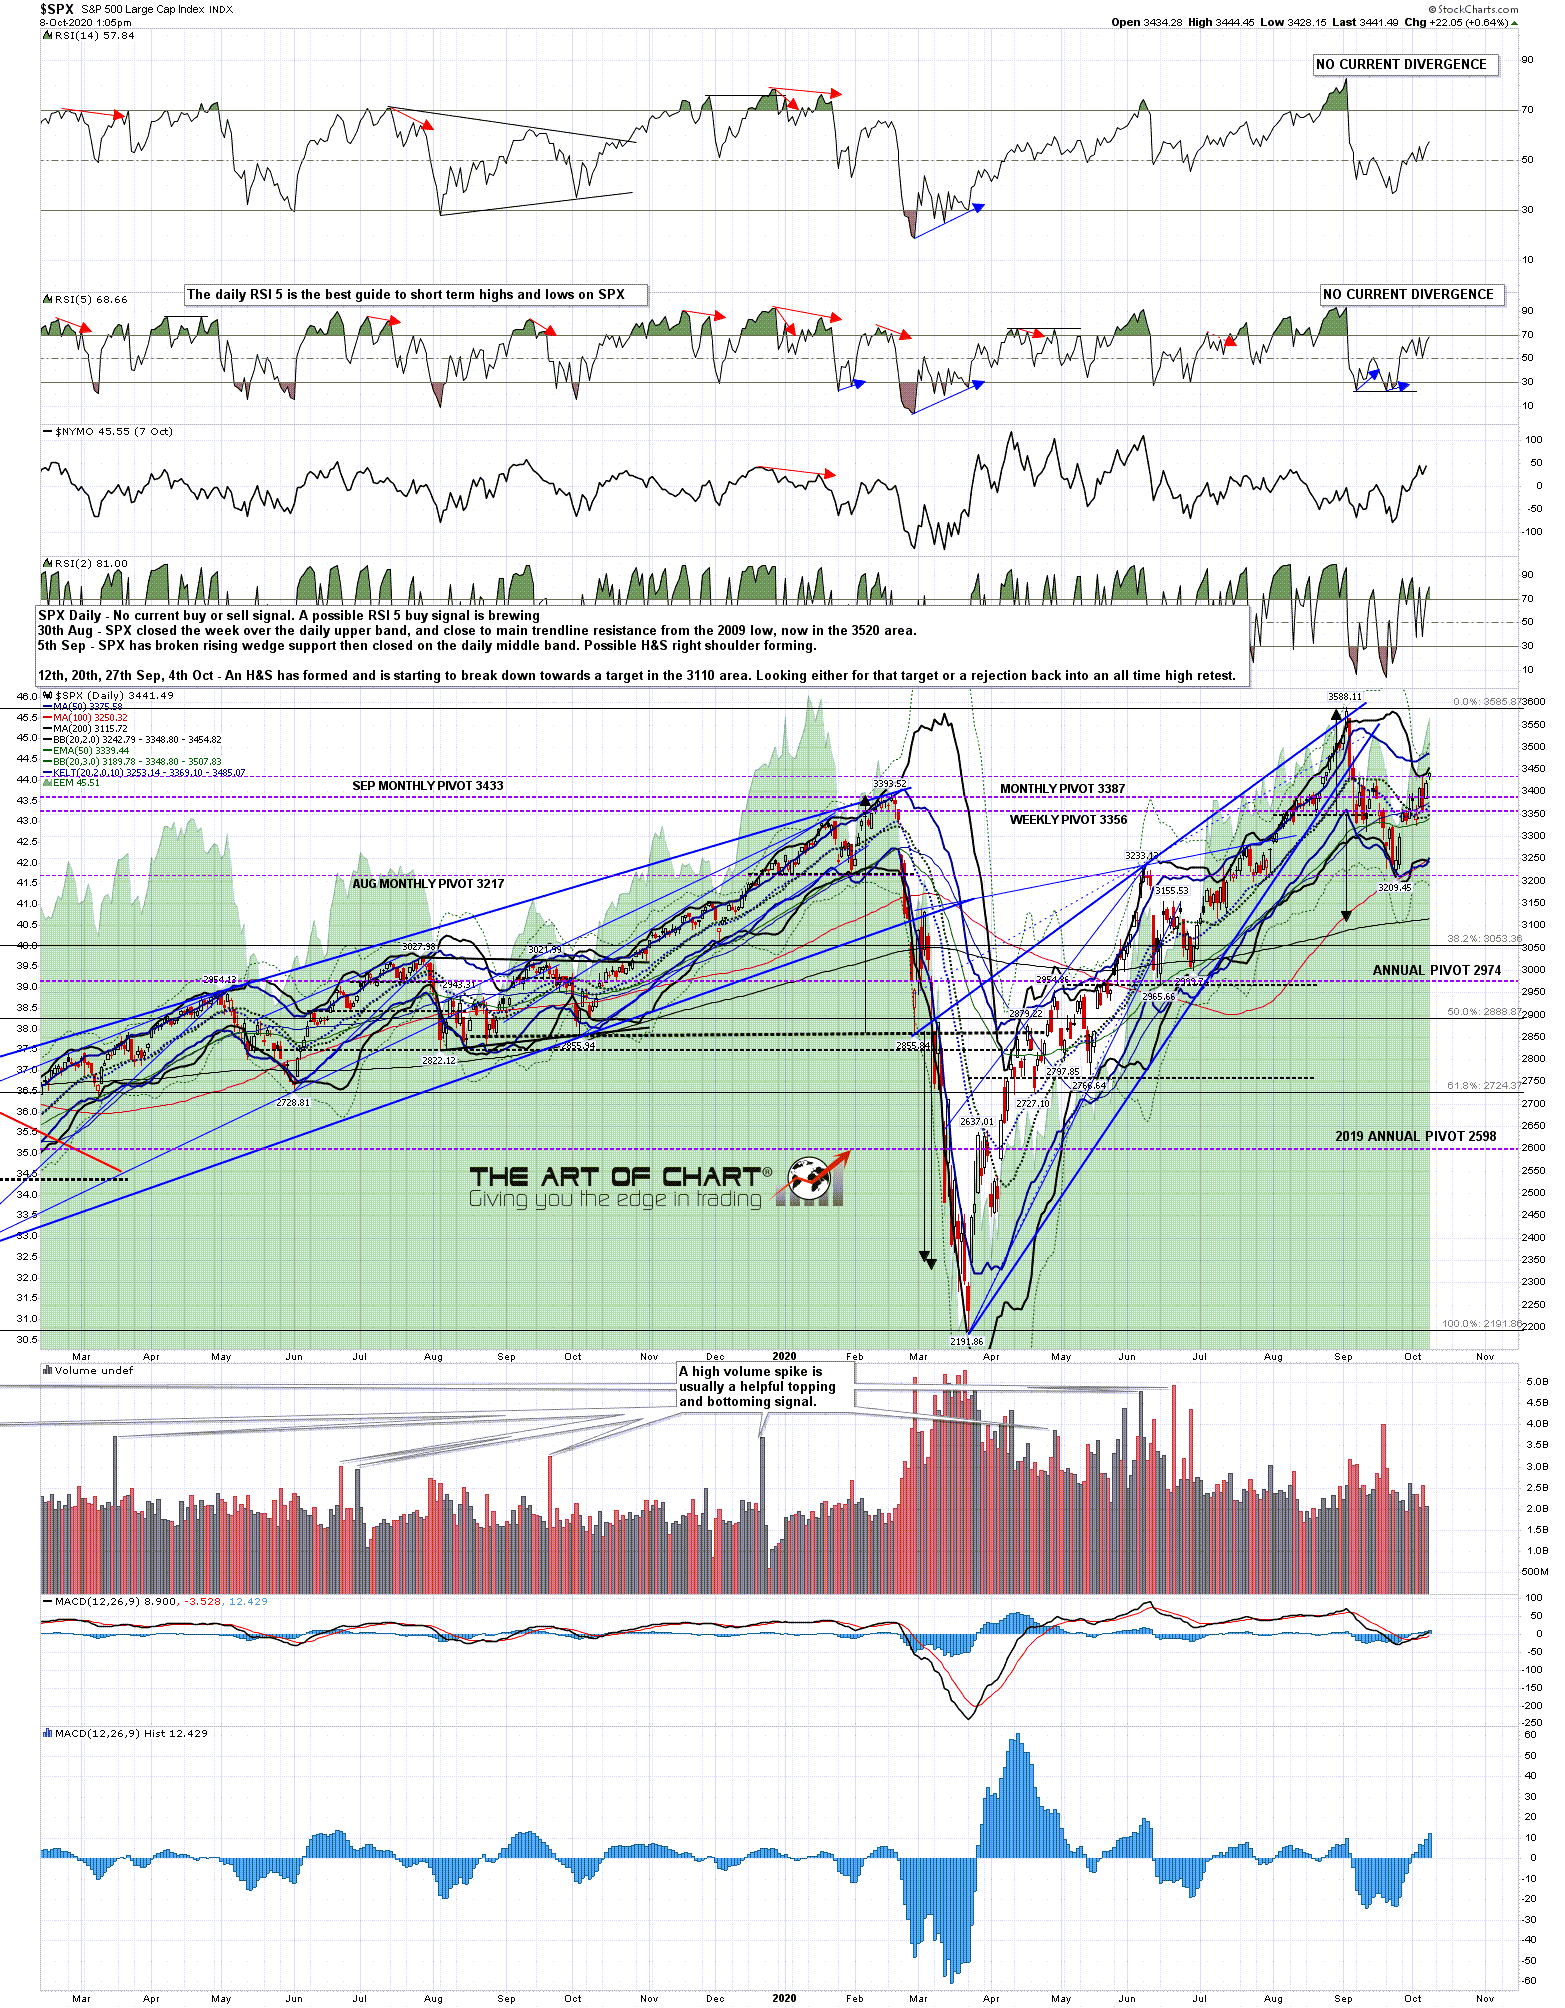
On to the markets where last week SPX broke back over the daily middle band and converted it to support, and may be on the way back to a retest of the all time high, but there is a significant hurdle on the way at the same time that SPX is testing the daily upper band, currently at 3438, with the high today at the time of writing at 3444. The daily RSI 5 buy signal has reached target.

SPX daily chart:
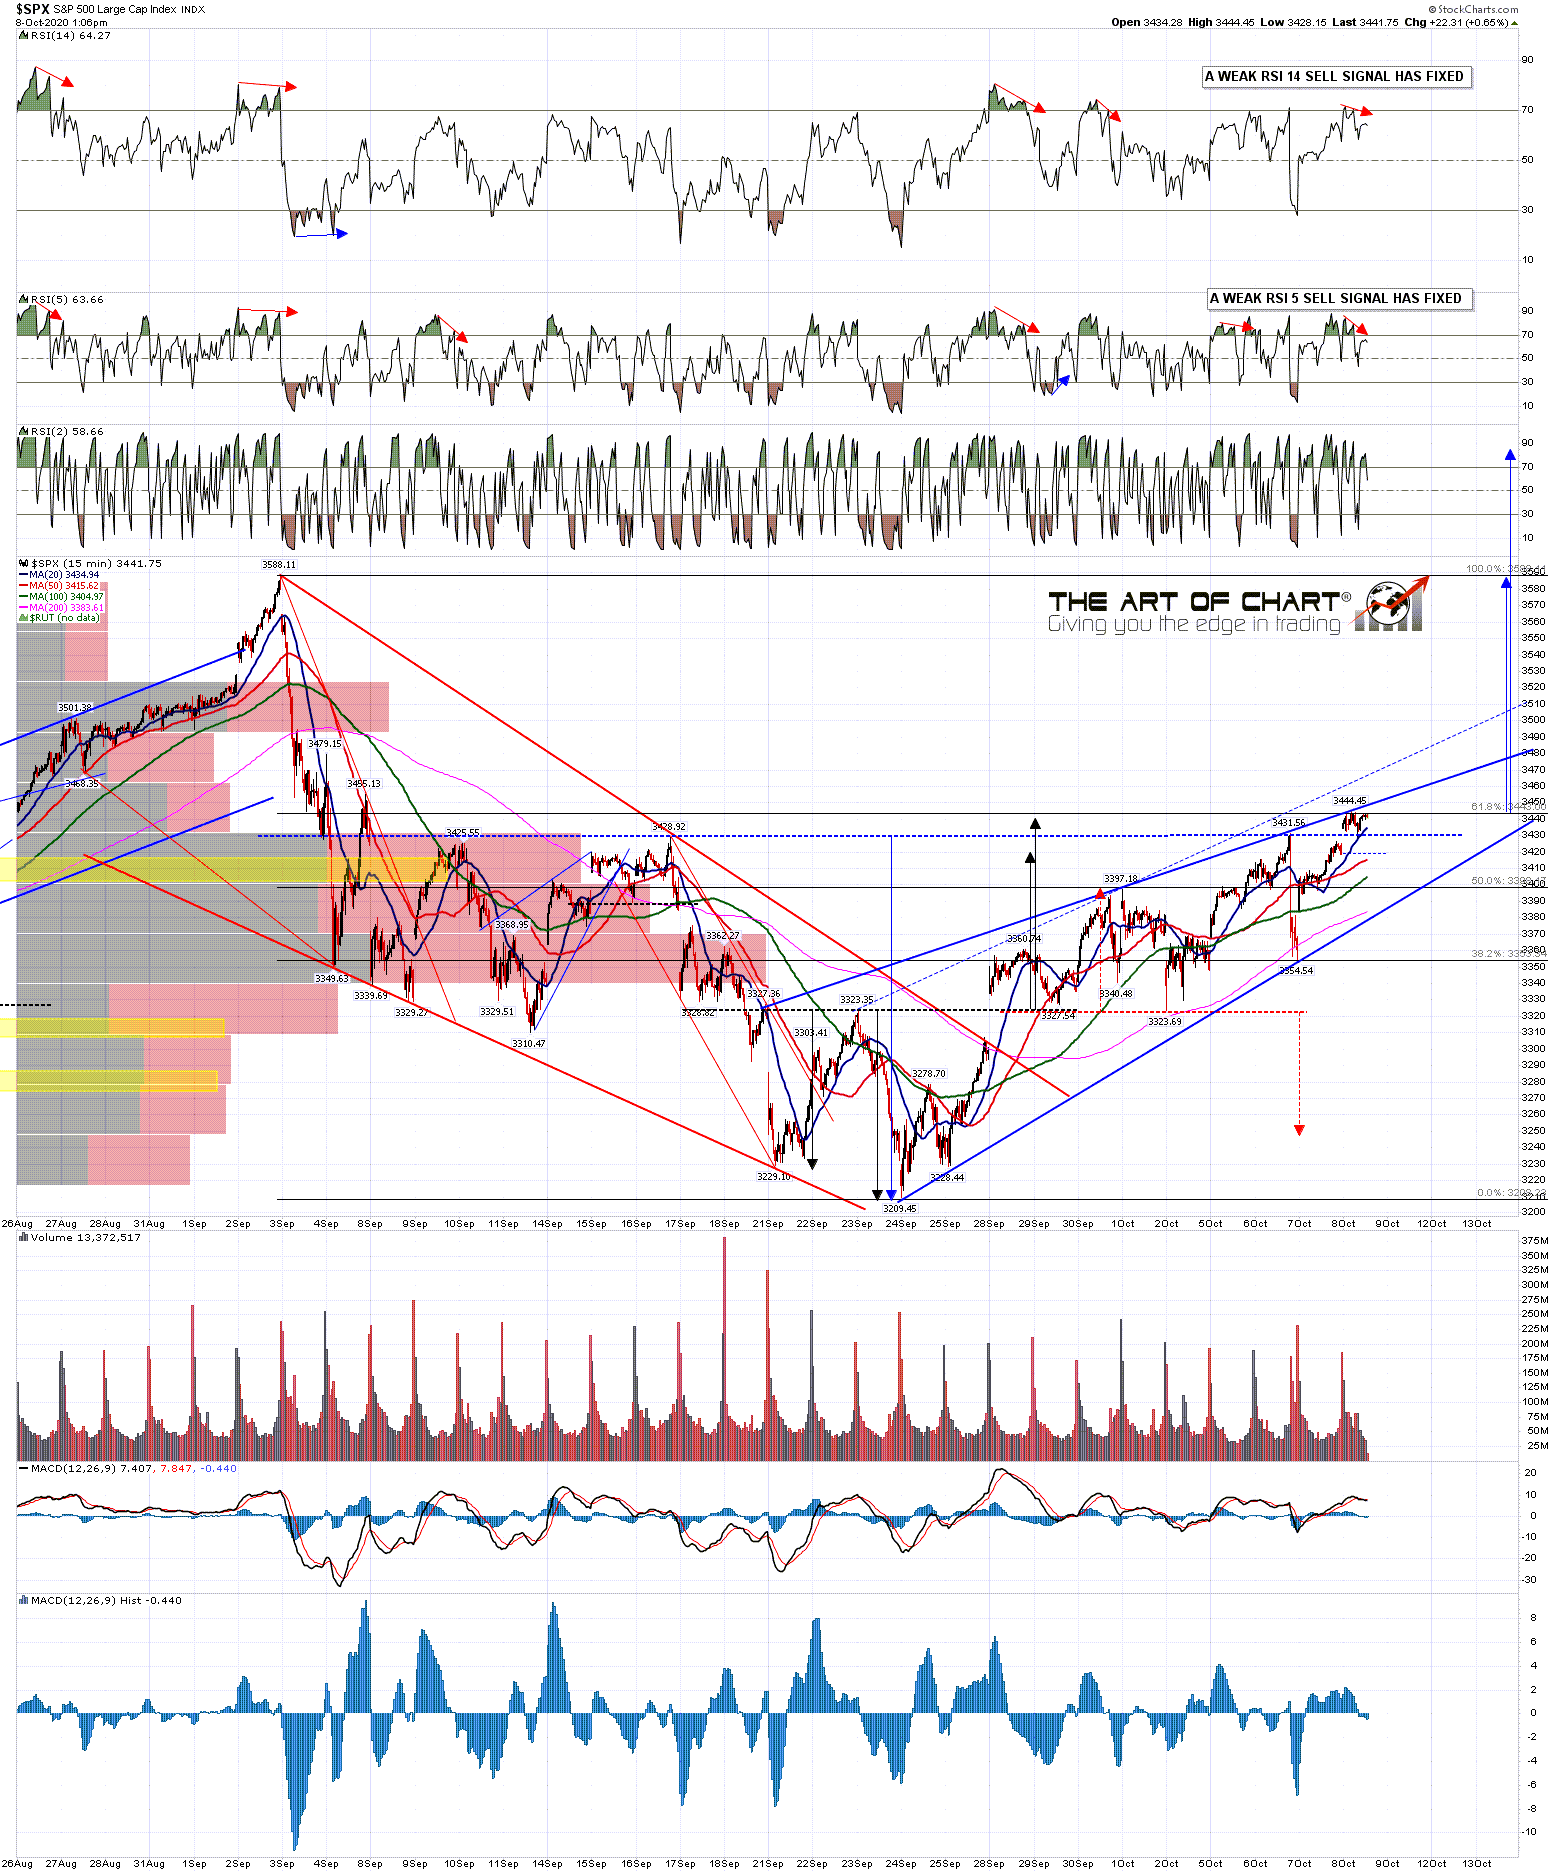
On the 15min chart you can see that SPX has reached both the alternate double bottom targets that I was looking at a week ago, and with the kind assistance of President Trump and twitter on Tuesday night (77 point decline on tweet that stimulus negotiations delayed until after the election), and Wednesday morning (complete reversal on tweet that stimulus negotiations back on again), the right shoulder formed on a decent quality IHS that has now broken up with a target at a retest of the all time high.

As ever with these patterns there are now two likely outcomes, and the chances are that we will see one of those play out. Either that IHS heads to the target, or we see a fail soon that delivers a retest of the retracement low at 3209.45, and likely at least somewhat lower. At this stage the H&S setup looking for the 3110 area has already failed of course, though the 200dma is still in that area, currently at 3116.

If we are going to see a fail then that could be from here, as the obvious rising wedge resistance trendline from that low has now been tested though I'd be leaning a bit higher based on the NDX chart, which I'll be coming to. If SPX should break below wedge support, currently in the 3380 area, that would be a significant sign of weakness, and a break below the right shoulder low at 3354.54 would invalidate the IHS. Main support is at the daily middle band, currently 3349, which would need to be broken and converted to resistance to open the downside.

SPX 15min chart:
On the NDX daily chart the RSI 5 buy signal reached target and on a retest of the last high at 11606 a possible RSI 5 sell signal would start brewing, but the main pattern setup is on the 15min chart:

NDX daily chart:
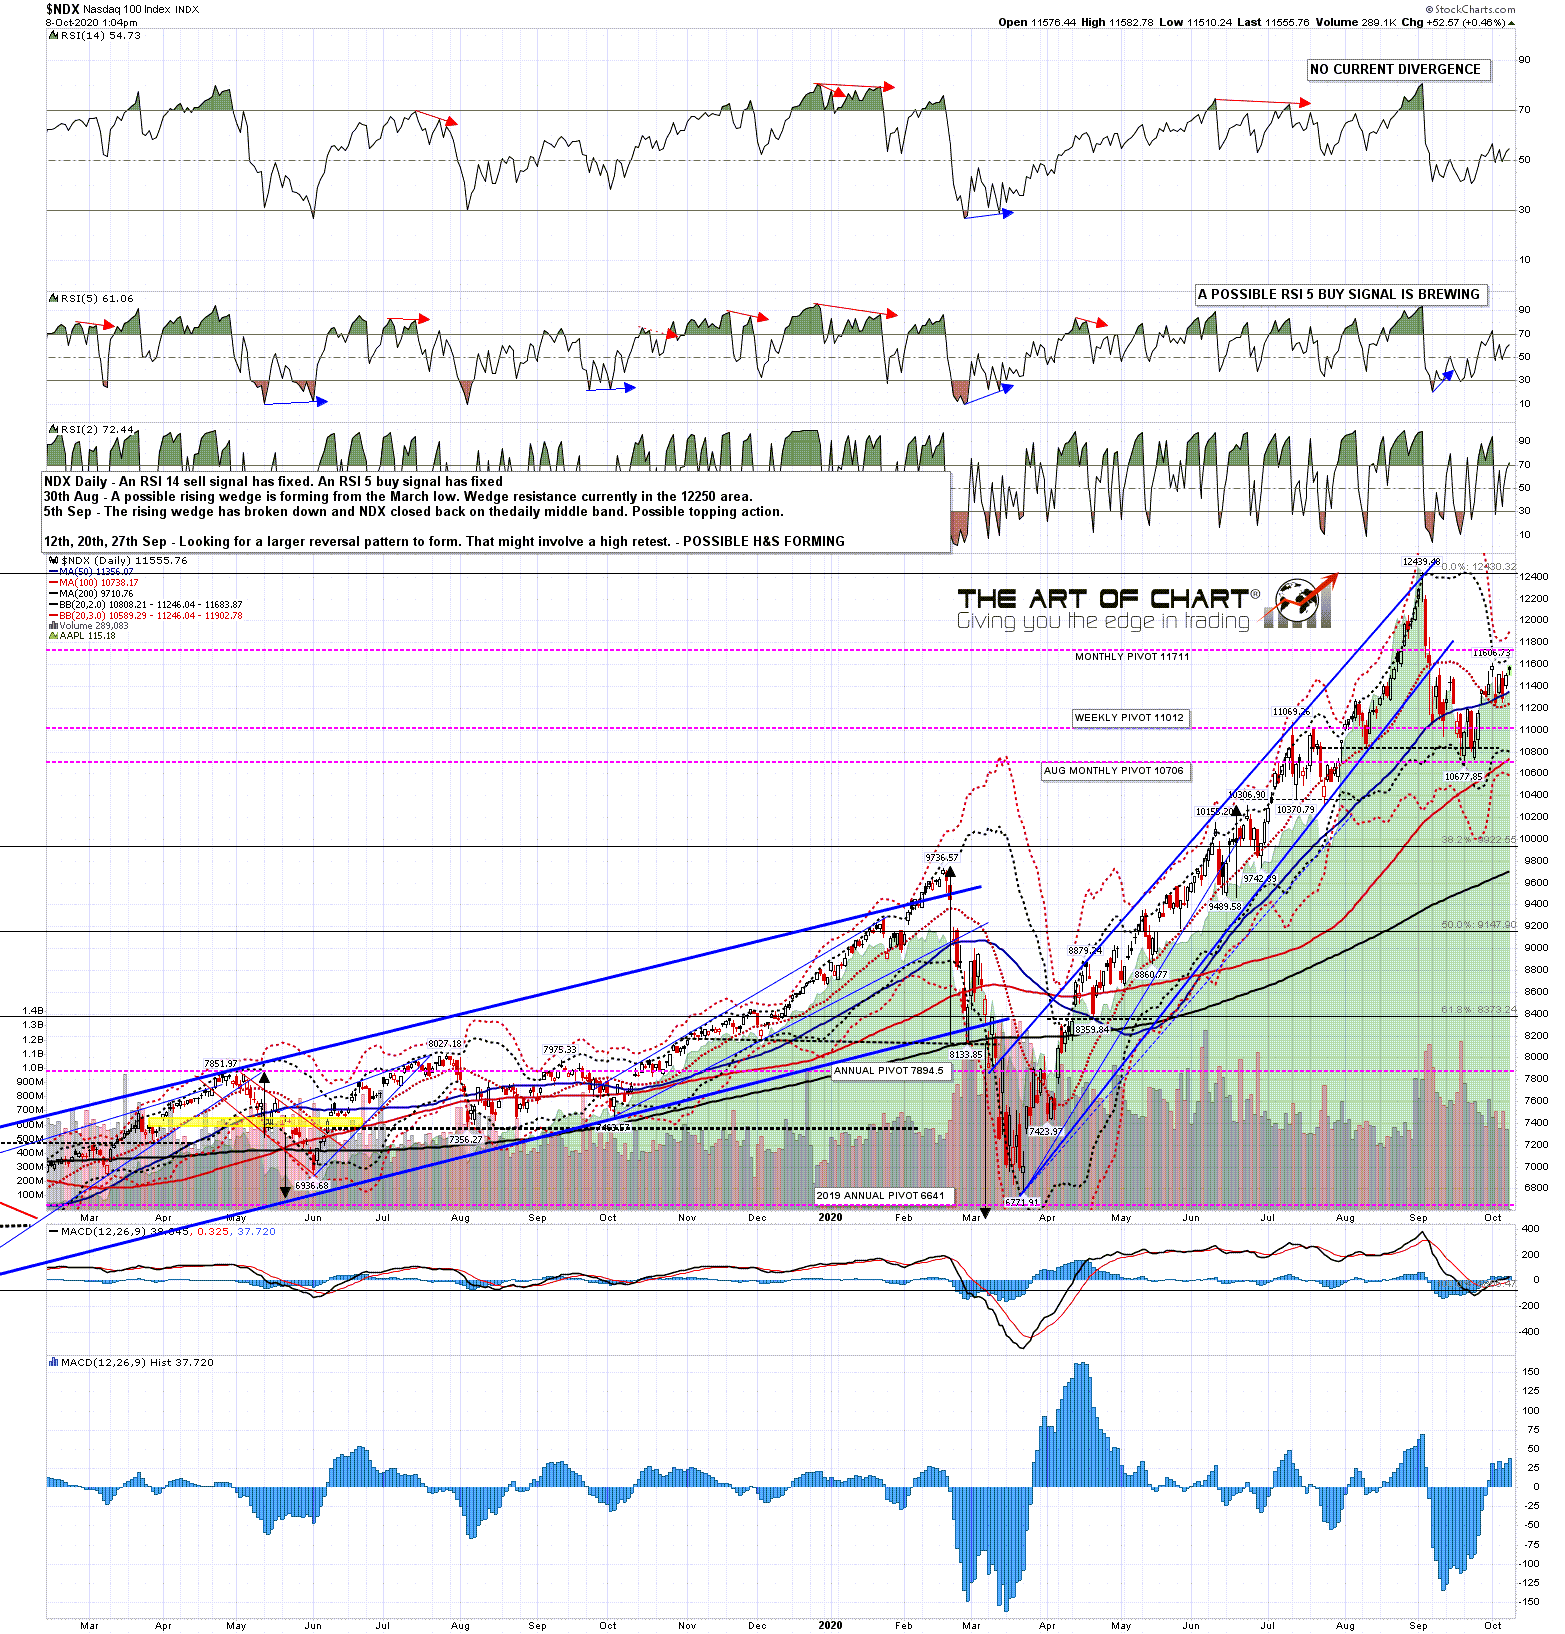
The setup on NDX important because more than any other index I think NDX is driving the equities bus here, and it is notable that on this current leg up NDX has been lagging. The setup here is similar to the setup on SPX except that the pattern from the low is a clear rising channel which would make an excellent bear flag channel.  There is also an IHS forming that has not yet broken up. A sustained break above the IHS neckline in the 11620 area would look for another all time high retest, and usually we would at minimum see that IHS break up even in the event of a subsequent fail. If we see that break up and then the channel breaks down then the odds are decent that NDX will be on the way back to the lows, though the IHS would not be invalidated until a move below the IHS right shoulder low at 11225.20.

NDX 15min chart:
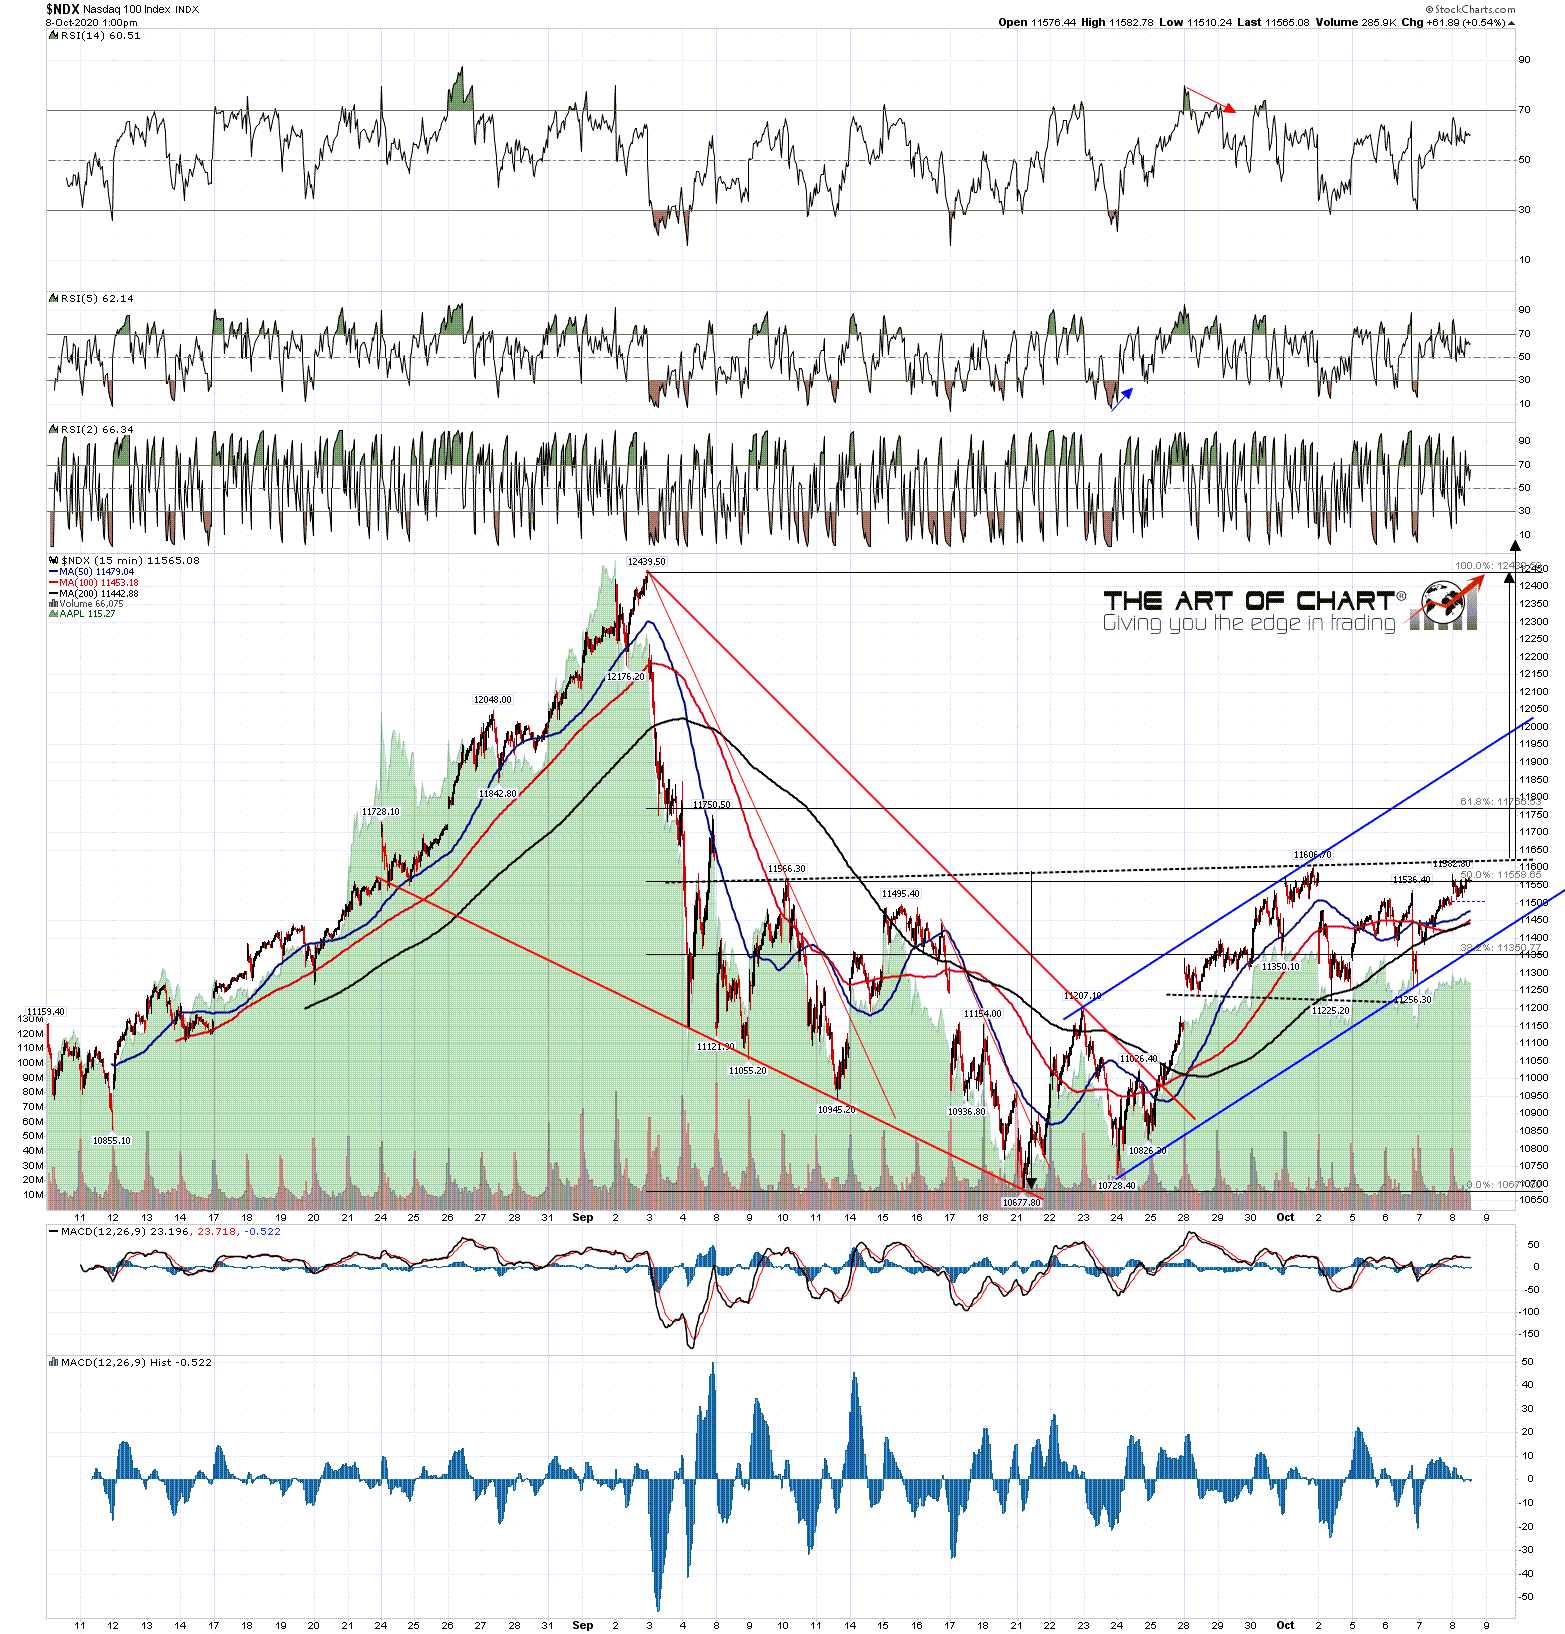
If we see a firm break up from here then I'd expect all time high retests on SPX and NDX, but in the meantime there is a decent possible setup for a fail here.

If you aren't already aware, access to the Chart Chat service and educational video library at theartofchart.net is free this week but only until the close on Sunday. Check those out if you're interested. We did a Chart Chat video yesterday and will do the next one on Sunday, and there are a lot of excellent educational videos that we have recorded over the last five years in the library. Worth a look IMO.

Thursday, 1 October 2020

The Masks We Wear

 I'm planning to drop some COVID-19 info and updates into some of my posts, hopefully in a way that won't get people thinking that I'm taking a position in the US election, as it is of vital interest for the economy going forward, and there was a time when that mattered for stock markets too, though that seems less certain at the moment.

I was giving the best guess mortality stats for the virus on Tuesday, and just wanted to break those down a bit further. The bottom line really is that, subject to some variations depending on race, sex and existing co-morbid health conditions, and in the event that anyone is actually infected, as many may well never be infected, then the death rate for those in the 12 to 40 age range is about 0.01%, or one in ten thousand, the death rate for people in the 41 to 60 range rises to about 0.1%, or one in a thousand, and the mortality rate rises sharply for those 60 or over to about 2%, or one in a fifty. That last stat is heavily weighted towards the oldest and least healthy in the population, to the extent that the average age of death from COVID-19 among white people in the Indiana study I was referring to was 78.9, with over half of all COV-19 deaths in Indiana among nursing home residents.

What does this mean? Well it's actually very good news, with this pandemic being relatively mild and normally distributed compared to a really bad pandemic like the one in 1918-20. With this information the math is pretty simple and it's obvious that with some masks and social distancing to slow the spread and protect the more vulnerable while a vast and likely to be ultimately successful search goes on to develop a vaccine. I was initially sceptical about that yielding much in any useful timescale but with the vast resources being put into this I suspect that a workable vaccine may well be ready by the middle of 2021, so with those precautions ensuring that infections don't run away and risk overloading health systems the world should be about ready to get back to work, but ..............

There seems to be a lot of resistance to wearing masks and maintaining sensible distances, and I've been seeing a lot of this first hand in the UK. A lot of people just aren't wearing masks either at all or are wearing them in a way that makes them ineffective. People are aware of what they should do but here many just can't be bothered to take basic precautions for the general public welfare, or indeed for the welfare of their more vulnerable family members.  That said, this seems to have been taken to a whole new level in parts of the US, with the anti-masker movement apparently seeing masks as a a civil rights rather than public health issue. I have been watching videos like the one below with disbelief. Wow.

What does this mean? Well with both the UK and US considering further partial or full lockdowns to slow the spread of the virus, it seems that lazy and stupid people may have the clout to deliver the further economic damage that the virus, on the merits of the infection curves and mortality stats, do not. Any economic damage from further lockdowns on these stats is an economic self-inflicted gunshot wound. This has really not been a good year for the ongoing search for intelligent life on earth.

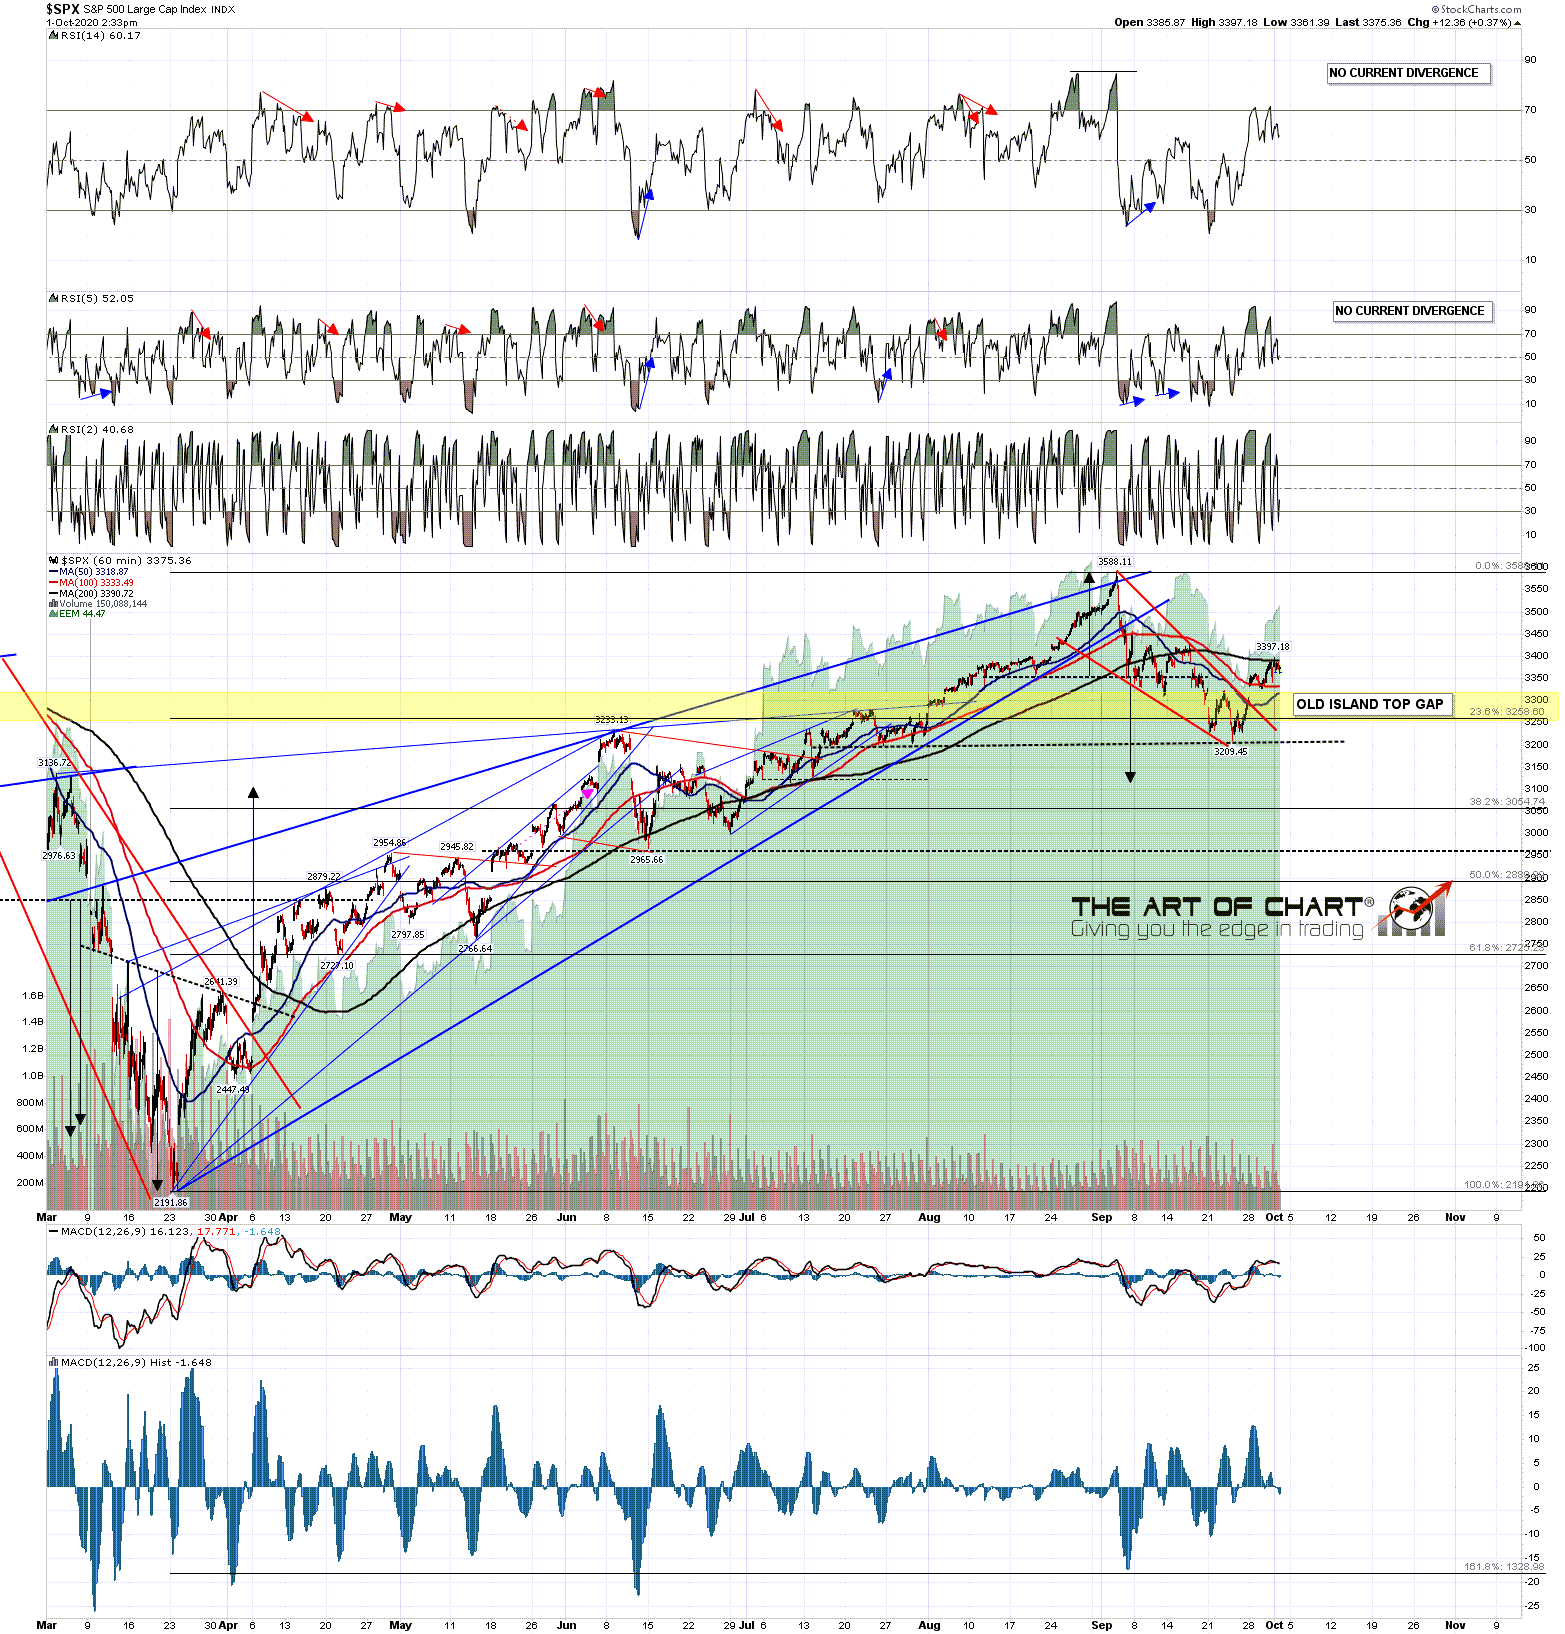
On to the markets, where so far the bulls have been slowly winning the battle at this inflection point. SPX closed slightly over the daily middle band yesterday and has traded above it all of today at the time of writing. That is starting to be converted to support and, if that continues, my next targets are in the 3420-50 area.

SPX daily chart:

In terms of the hourly chart there is no current negative divergence on the SPX RSI 14 though bulls need to break up through the 200 hour MA now at 3390 as that has been holding as resistance yesterday and today. A sustained break above should deliver at least 3420-30.

SPX 60min chart:

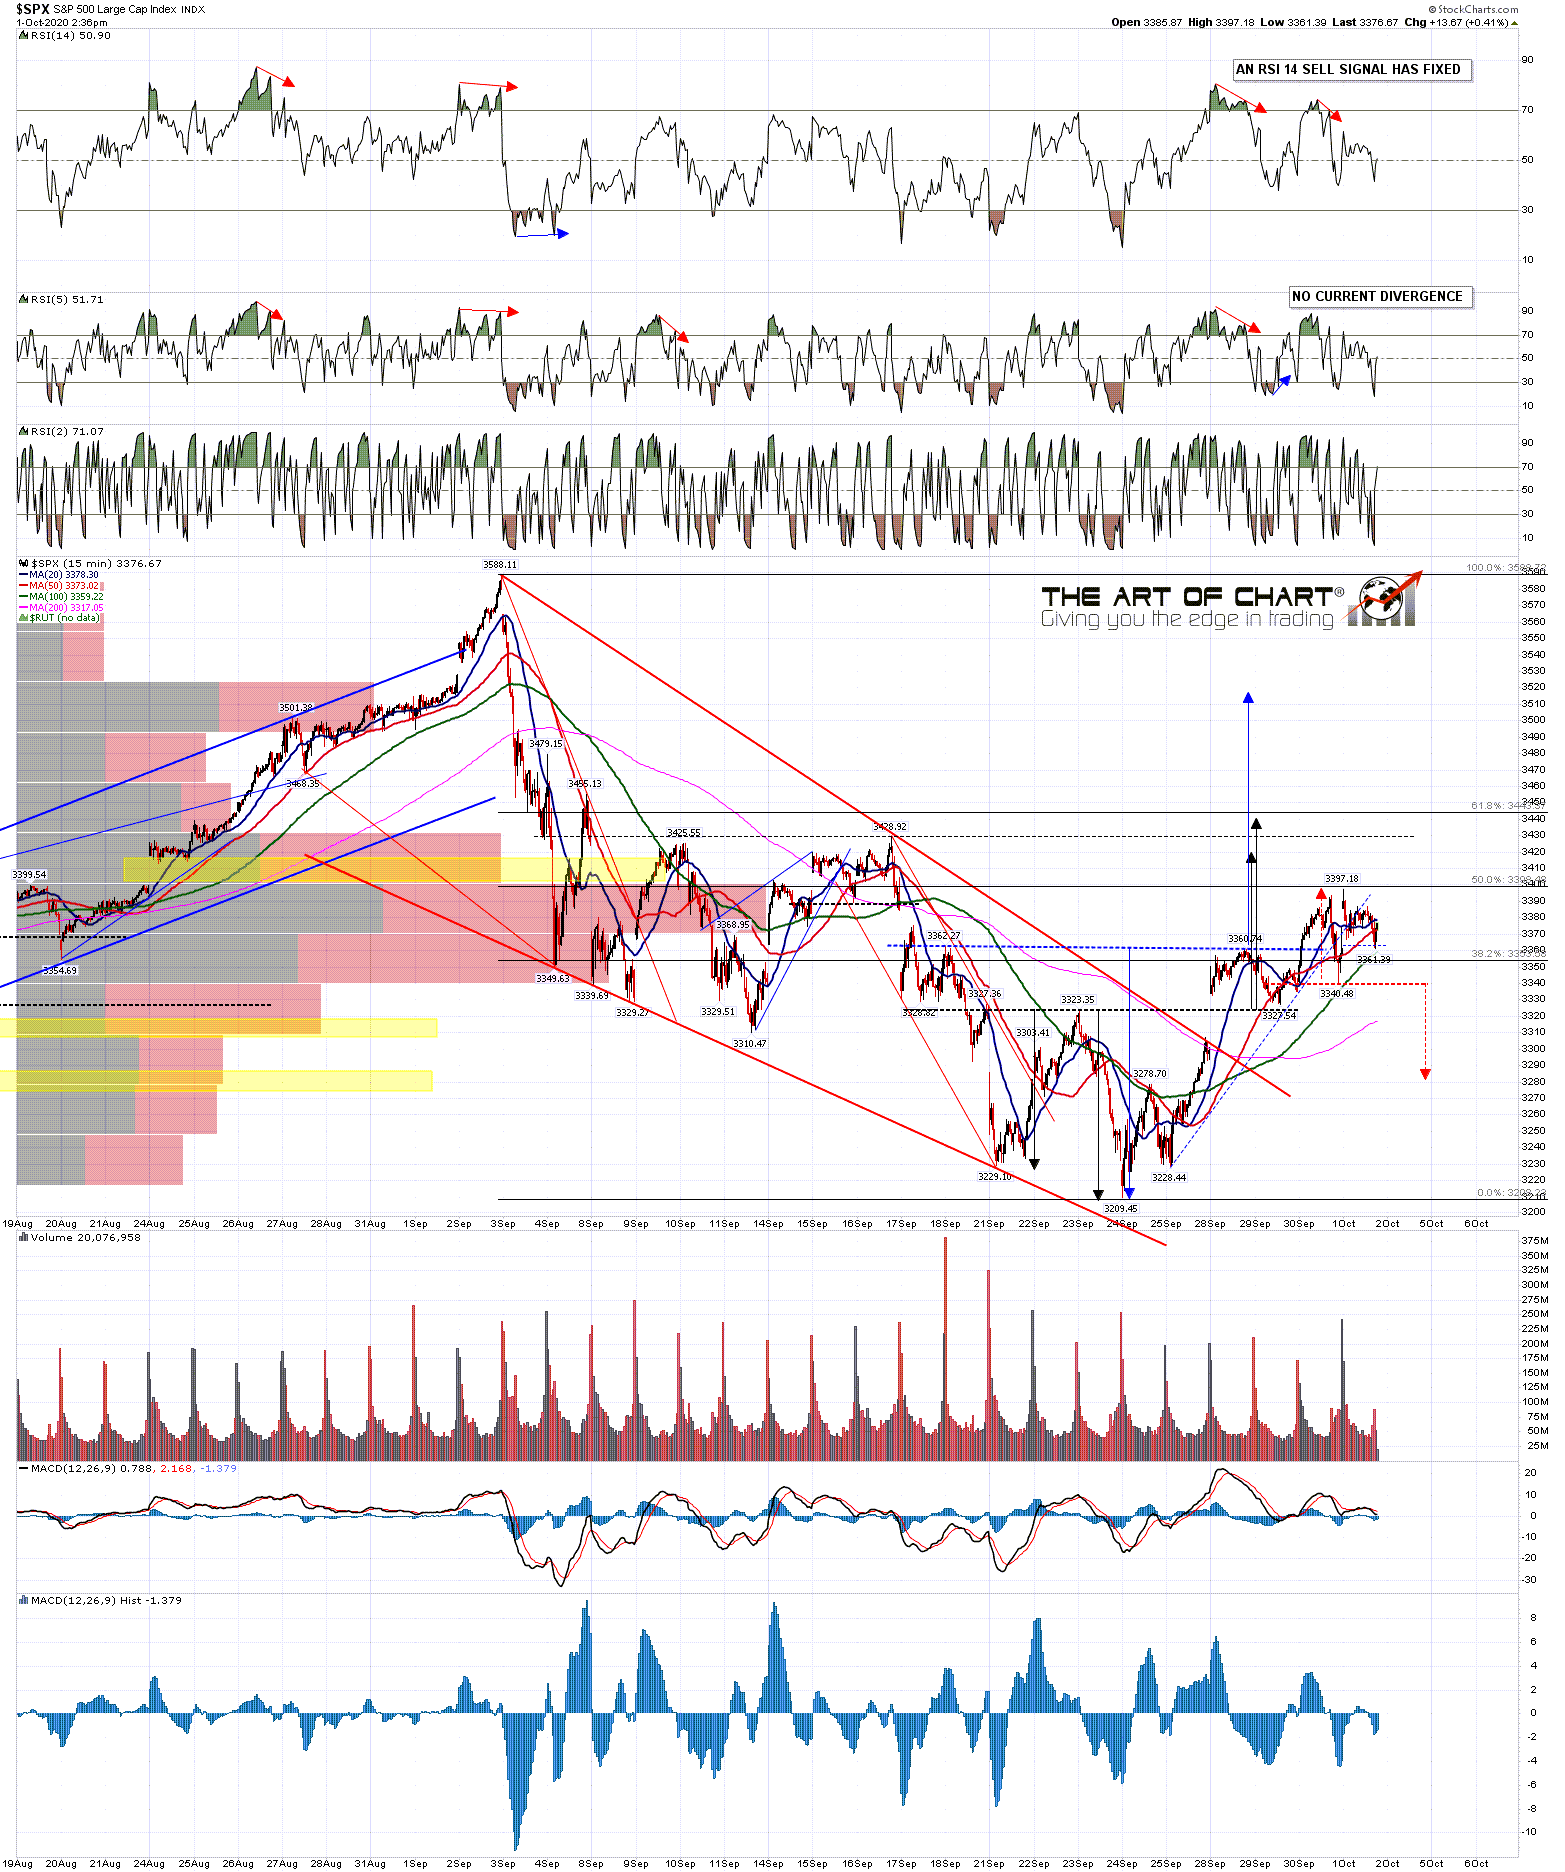
There is a decent case here for an IHS here that has formed and broken up with a target in the 3520 area. A break back over 3455.5 would invalidate the open H&S target in the 3110 area. If we see SPX test 3520 I'd be looking for the all time high retest, very possibly to make the second high of a larger double top.

SPX 15min chart:

SPX spent the day mainly just consolidating over the daily middle band, and may well be waiting for the non-farm payroll numbers due an hour before the RTH open tomorrow. If those numbers are good then the path may be open for SPX to retest the all time high. If they disappoint then this rally may well just end suddenly, and on a hard rejection I have some H&S patterns forming on tech stocks that suggest that SPX might then head for the 3000 area. We'll see how that goes.

Stan and I are doing our monthly free public Chart Chat at the artofchart.net at 4pm EST on Sunday (4th Oct). We'll be looking at the usual very wide range of instruments and markets and if you'd like to attend, then you can do that on our October Free Webinars page. Be there or be unaware. :-)