In my last post on 24th November I was saying that the bull market on Crypto was likely over, that the bear market has likely started, and was looking at the next likely downside targets in the first big decline of that bear market.
I was also talking about a rally that might be starting, and we have been watching that rally on both Crypto and equities since then.
The rally on equities has been powerful and some all time highs have been retested but on Crypto the rally has been muted and modestly sized bear flags have been forming.
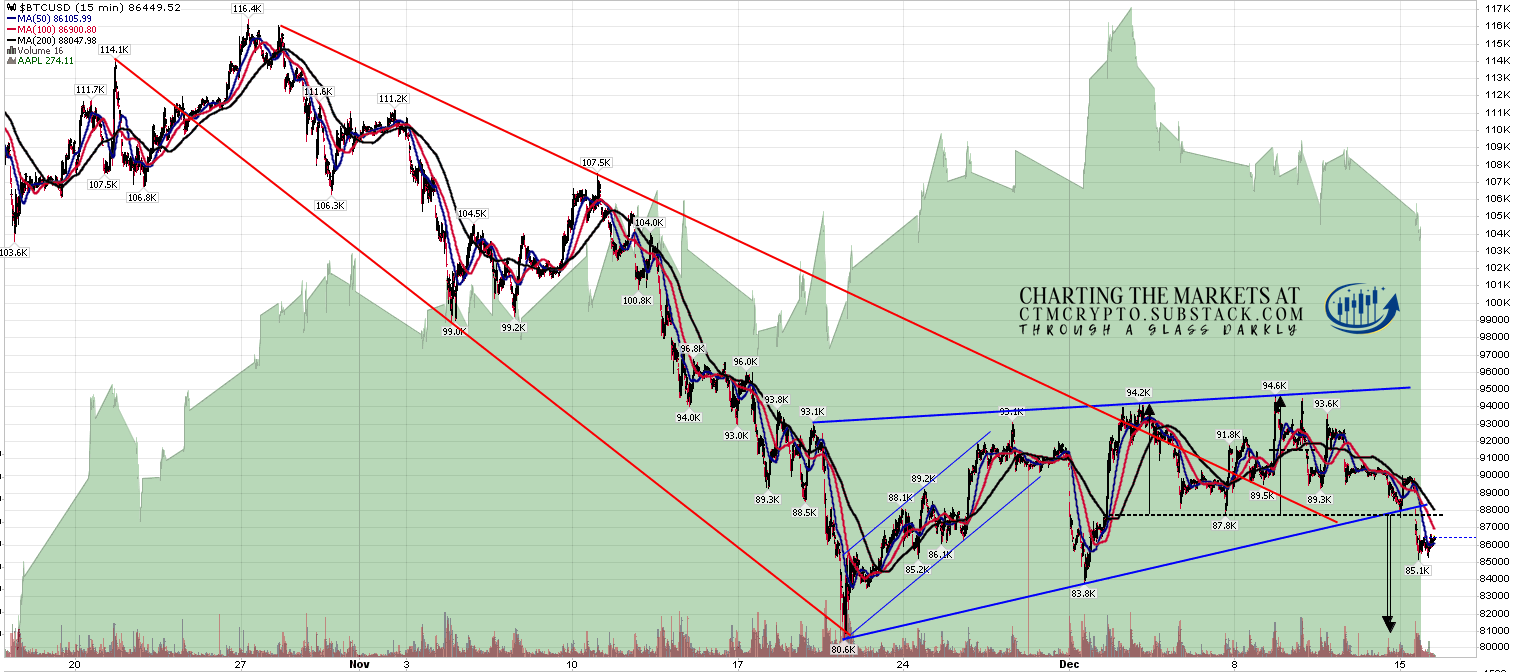
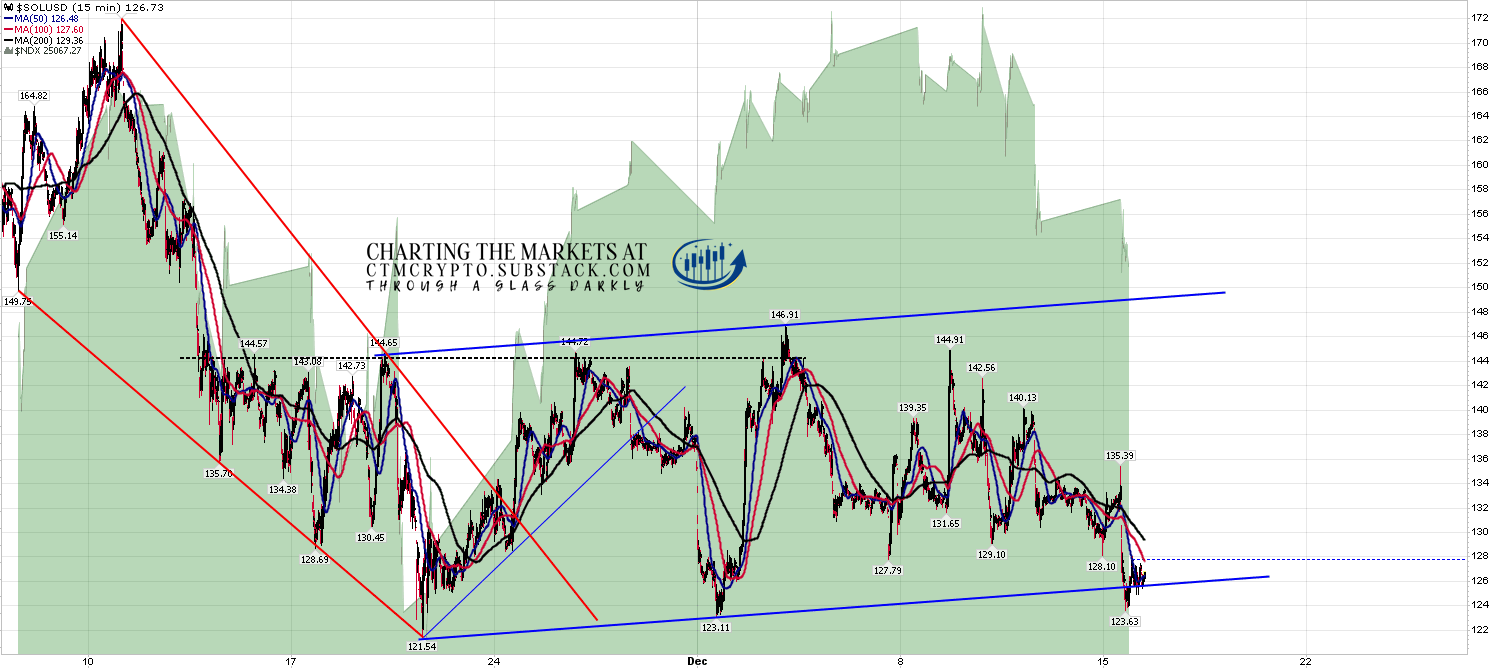
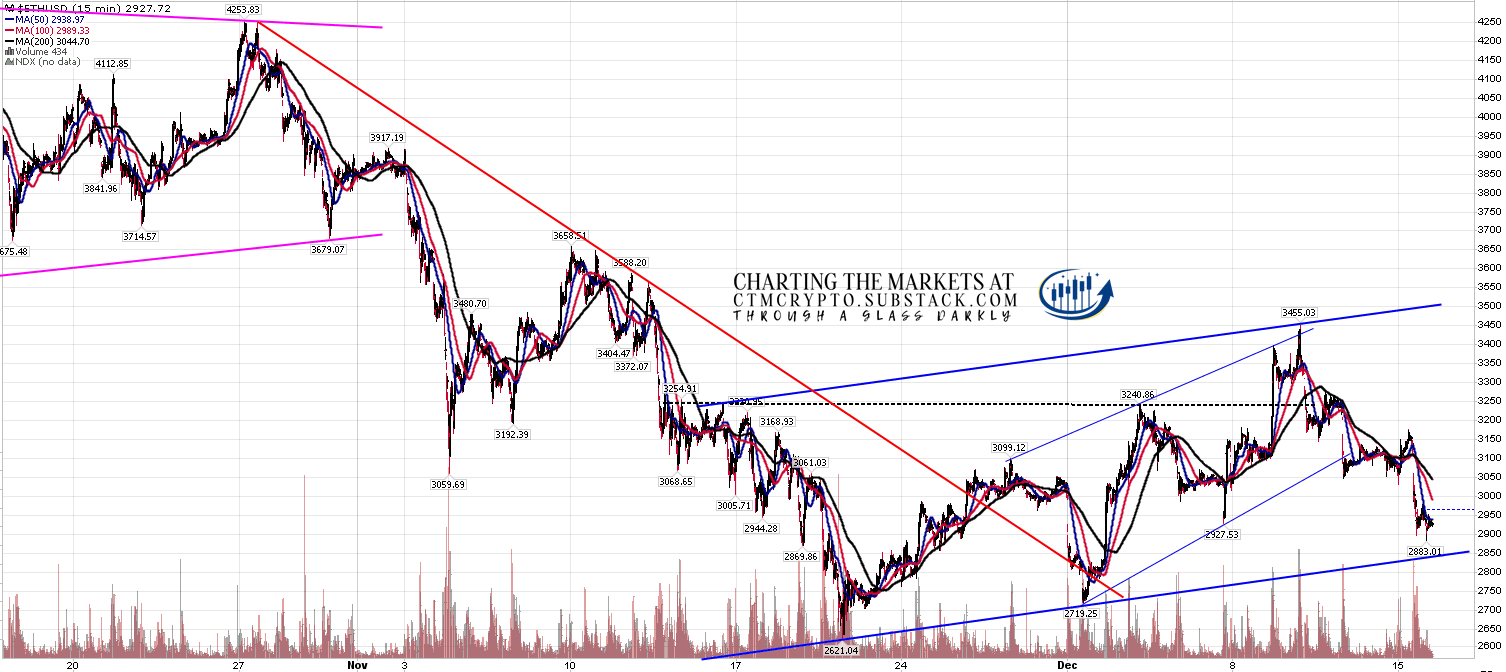
I’ve been talking about these bear flags every day in my premarket posts and, as is often the case on Crypto, these have been very nice examples of bear flag patterns. By my premarket video on Thursday 11th December these had reached their likely final forms as shown below.
On BTCUSD (Bitcoin) that bear flag is a high quality rising wedge and started breaking down yesterday with a target at a retest of the November low at 80.6k. This kind of flag could evolve into a larger flag with a higher high:
BTCUSD 15min chart:
On SOLUSD (Solana) that bear flag is a channel and broke down yesterday with a target at the November low at 121.54. This kind of flag does not generally evolve into an alternate larger flag:
SOLUSD 15min chart:
On ETHUSD (Ethereum) that bear flag is also a channel and the flag has not yet broken down. The rally has been the strongest on Ethereum but I’m expecting Ethereum to follow the others soon and when it does the flag target will be a retest of the November low at 2621.04.
ETHUSD 15min chart:
The targets of all three of those flags would of course be retests of the November lows. So what are the options after that?
There are two main options and my view of the odds on those are influenced significantly by the timing of this break down.
Just to pull back a bit, what does it mean when we see correlated markets like Crypto and equity indices behave relatively to each other in the way that we have seen since this rally started in late November? This is something I have seen regularly in the past, particularly on the inversely correlated gold and USD.
When you see one of those correlated markets reverse strongly while the other consolidates sideways then it usually indicates that the strong trend on the sideways market (the downtrend on Crypto) is pausing while the other rallies, and that the strong trend will likely resume when that rally ends.
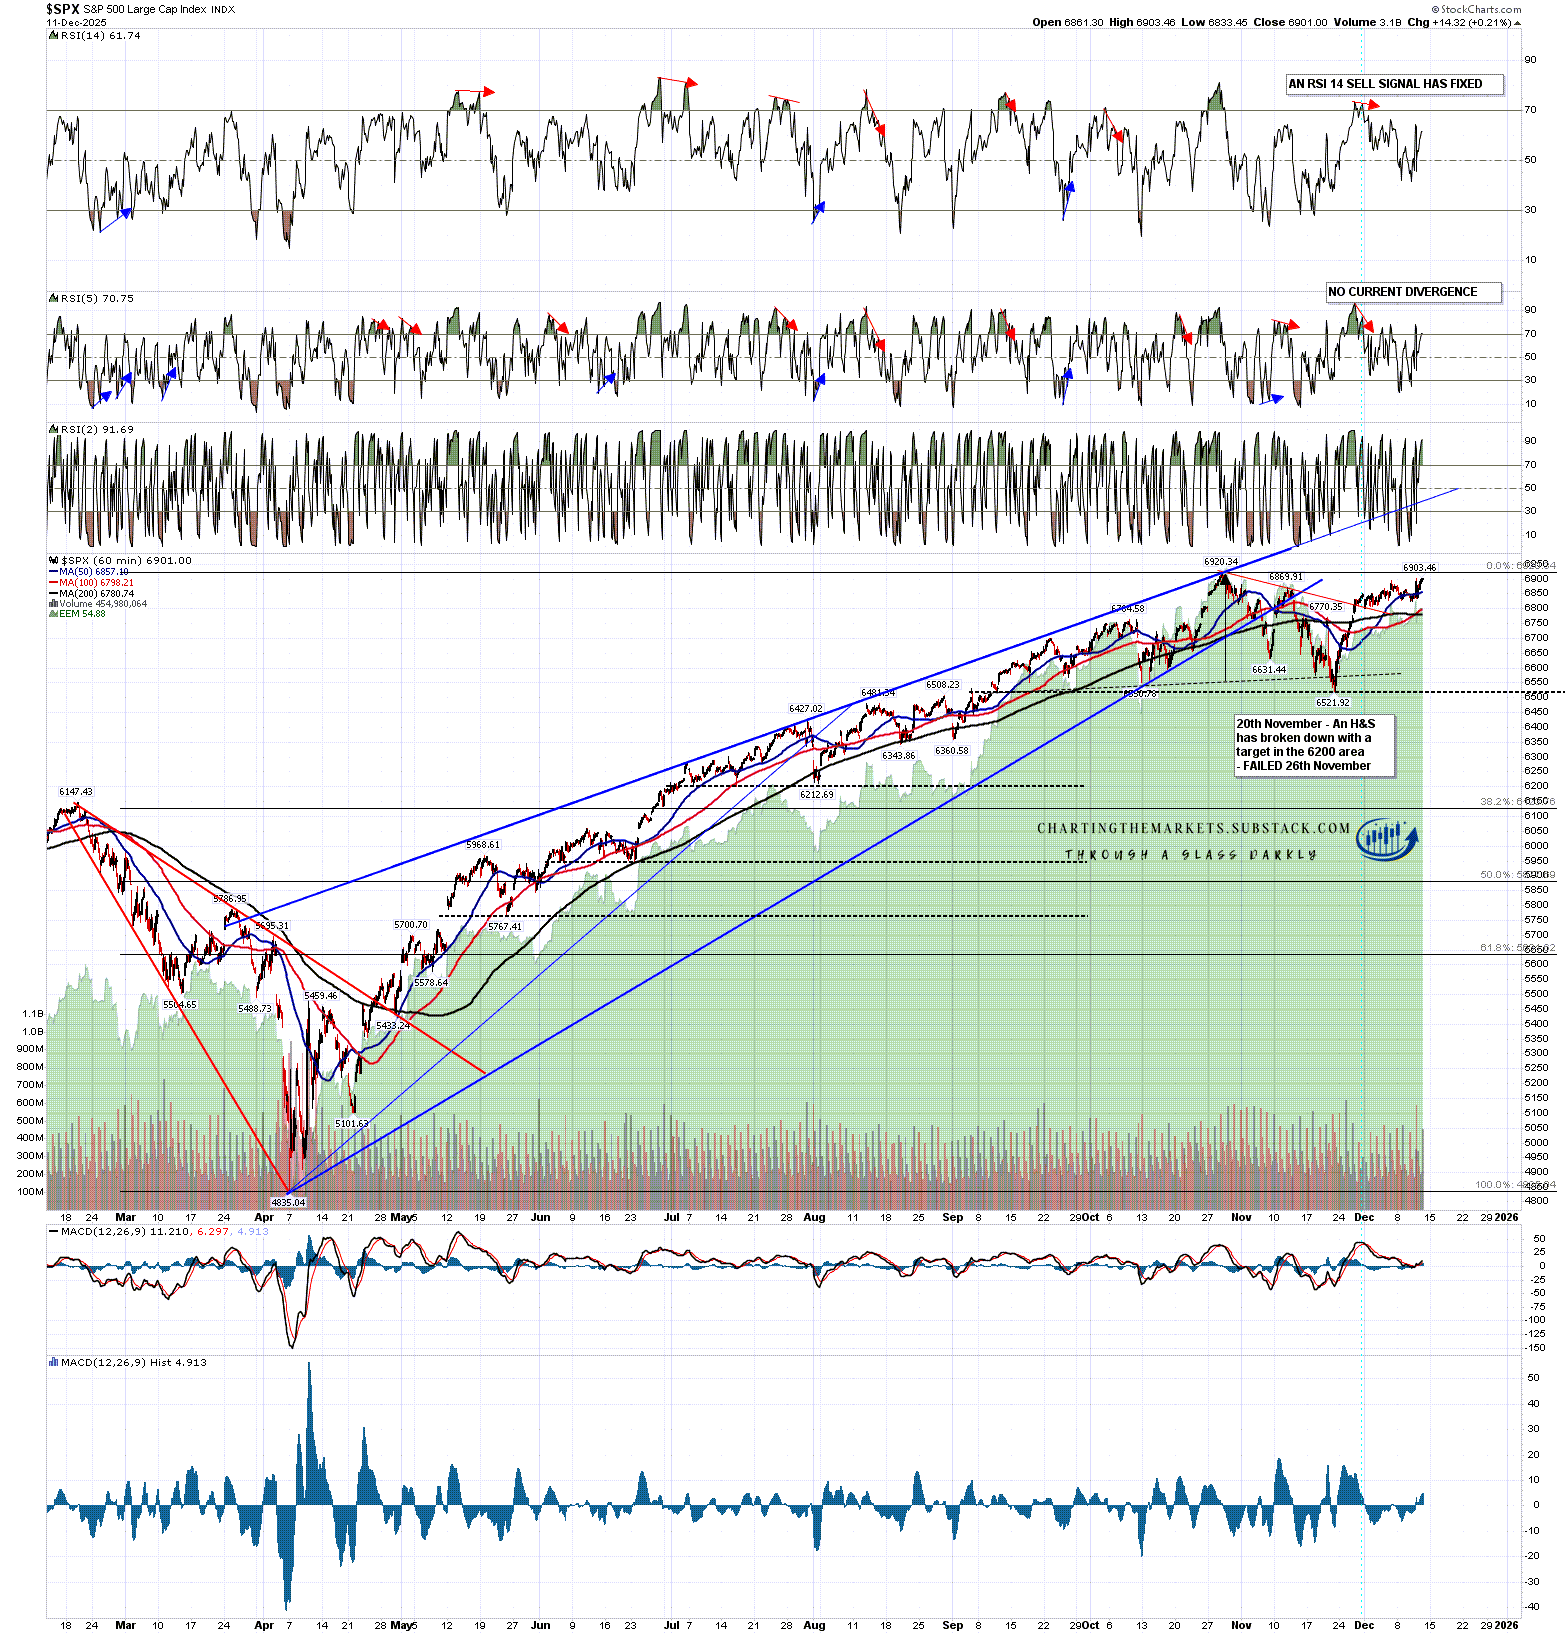
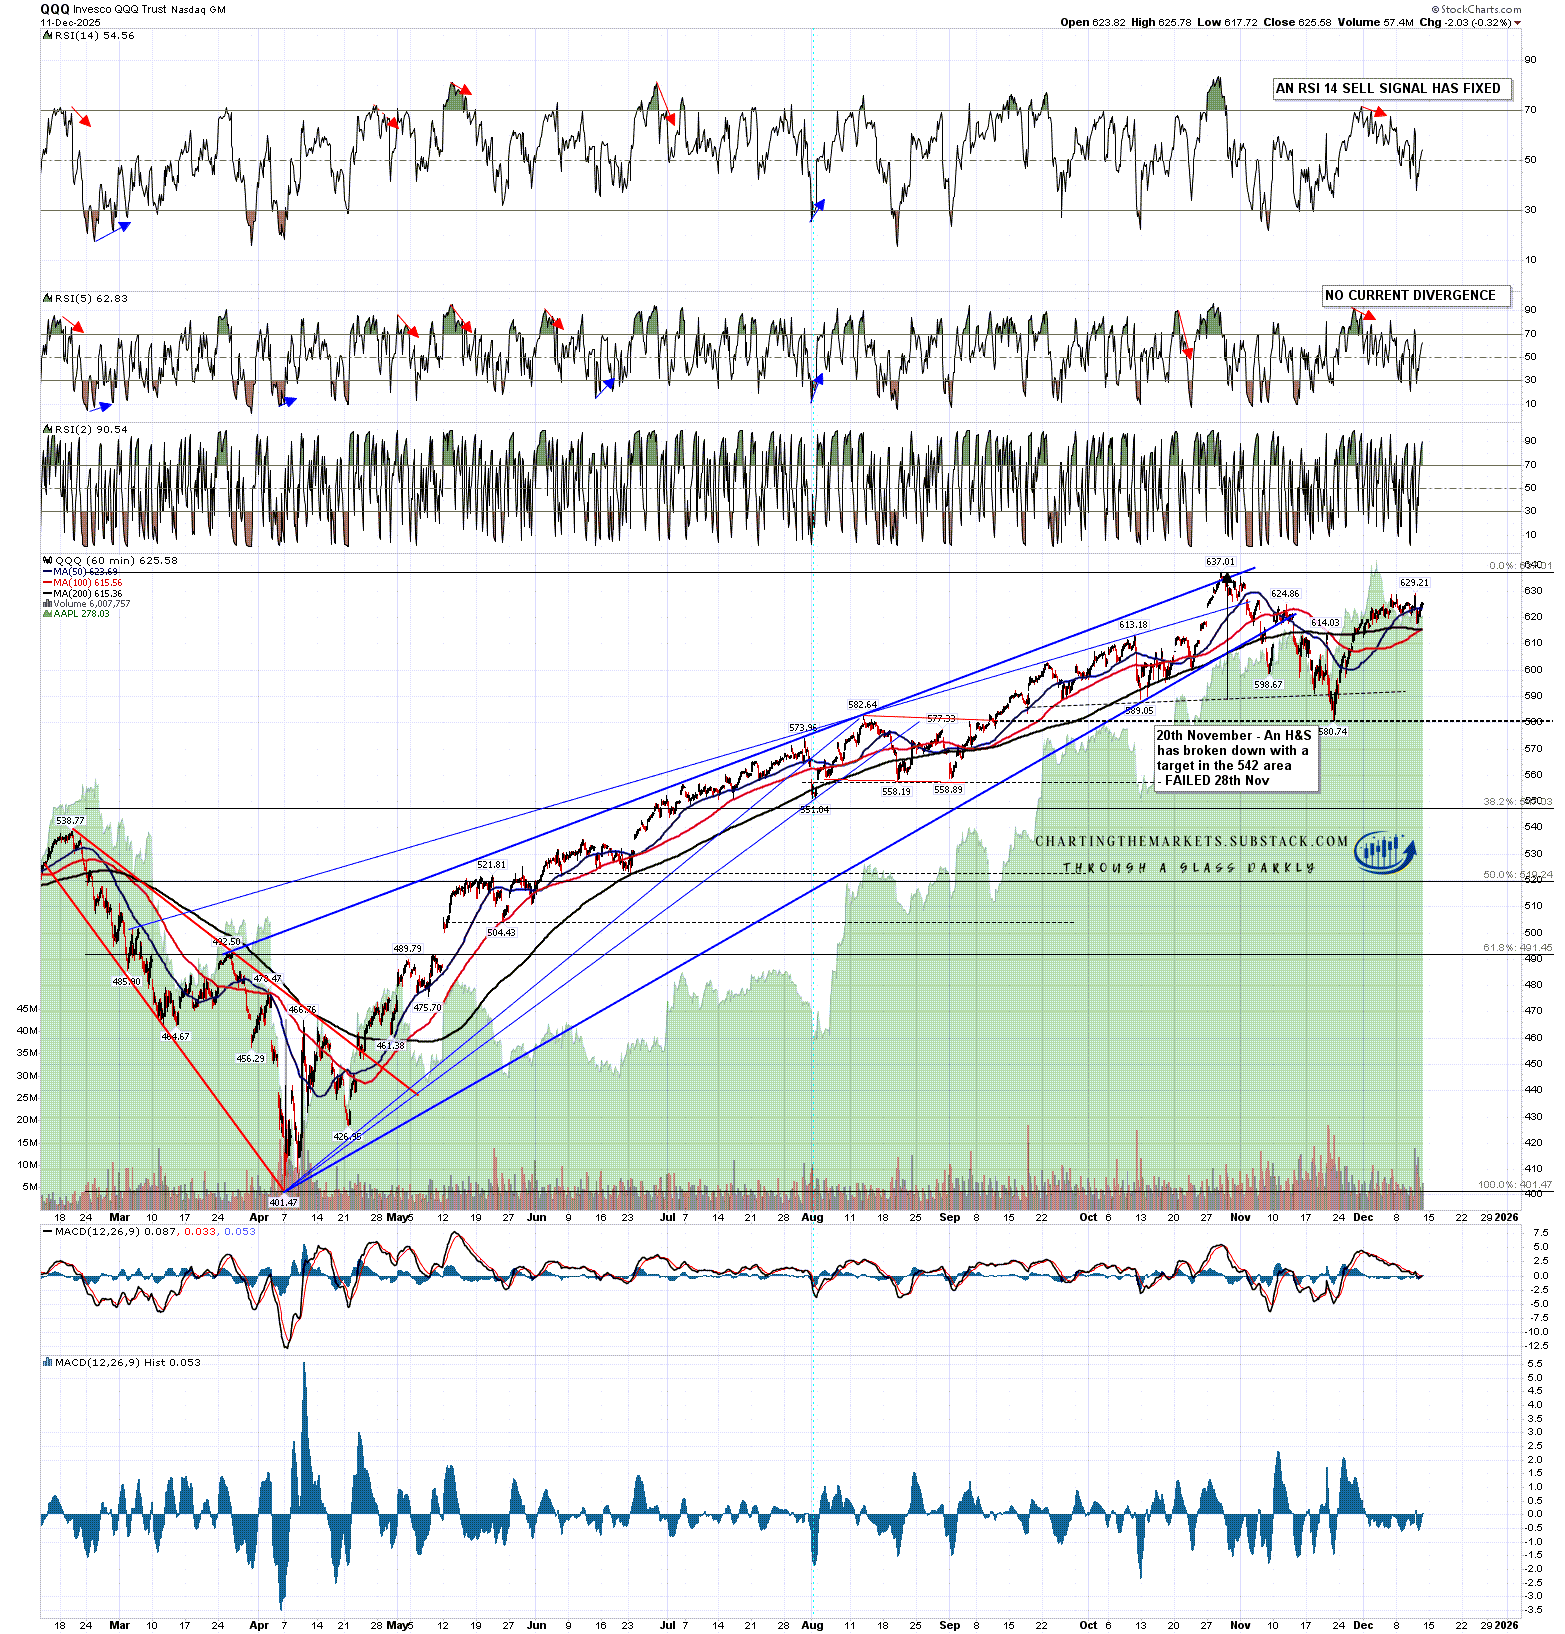
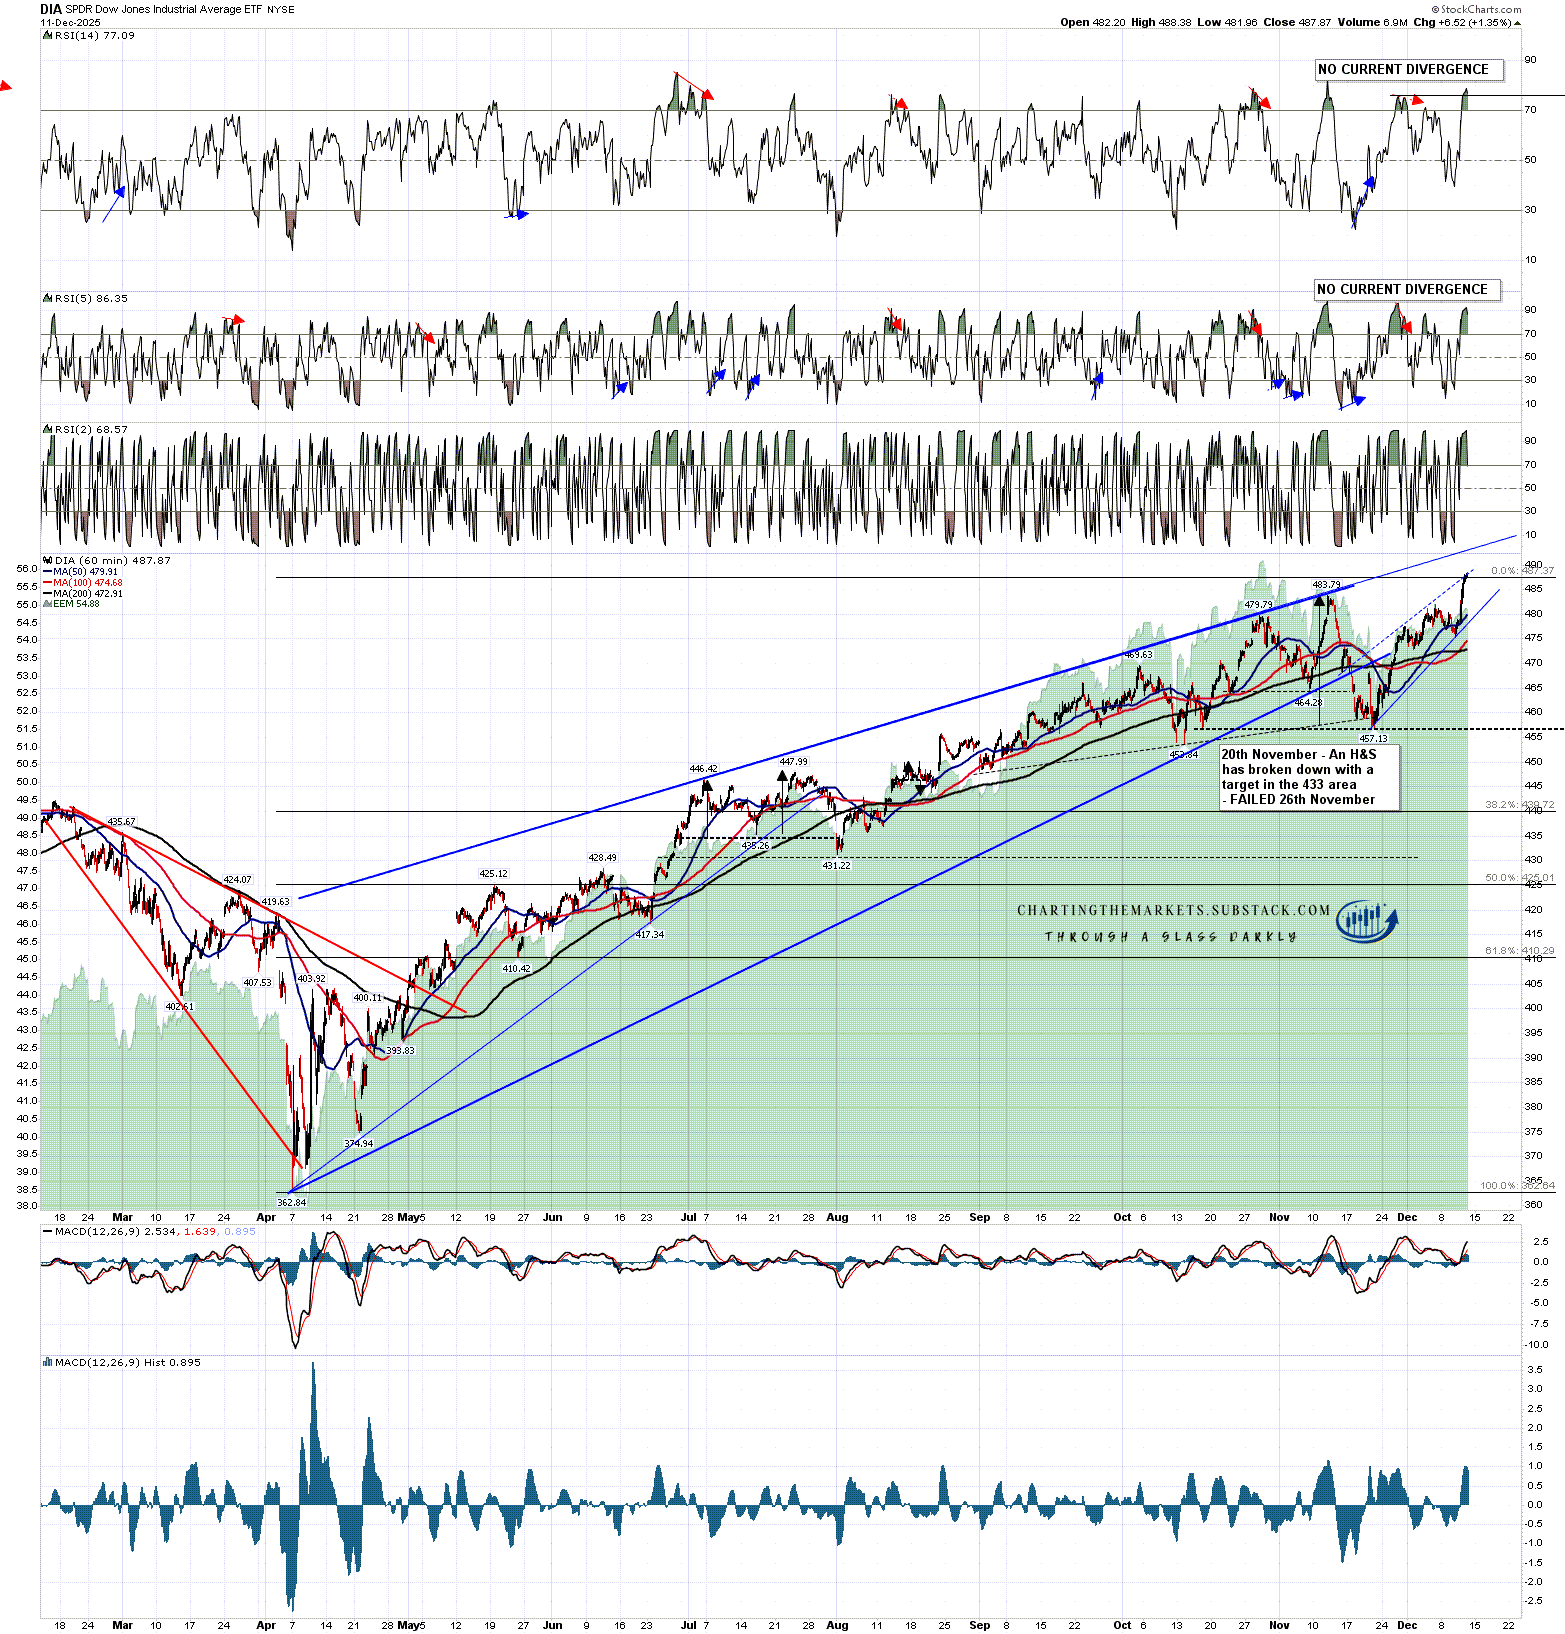
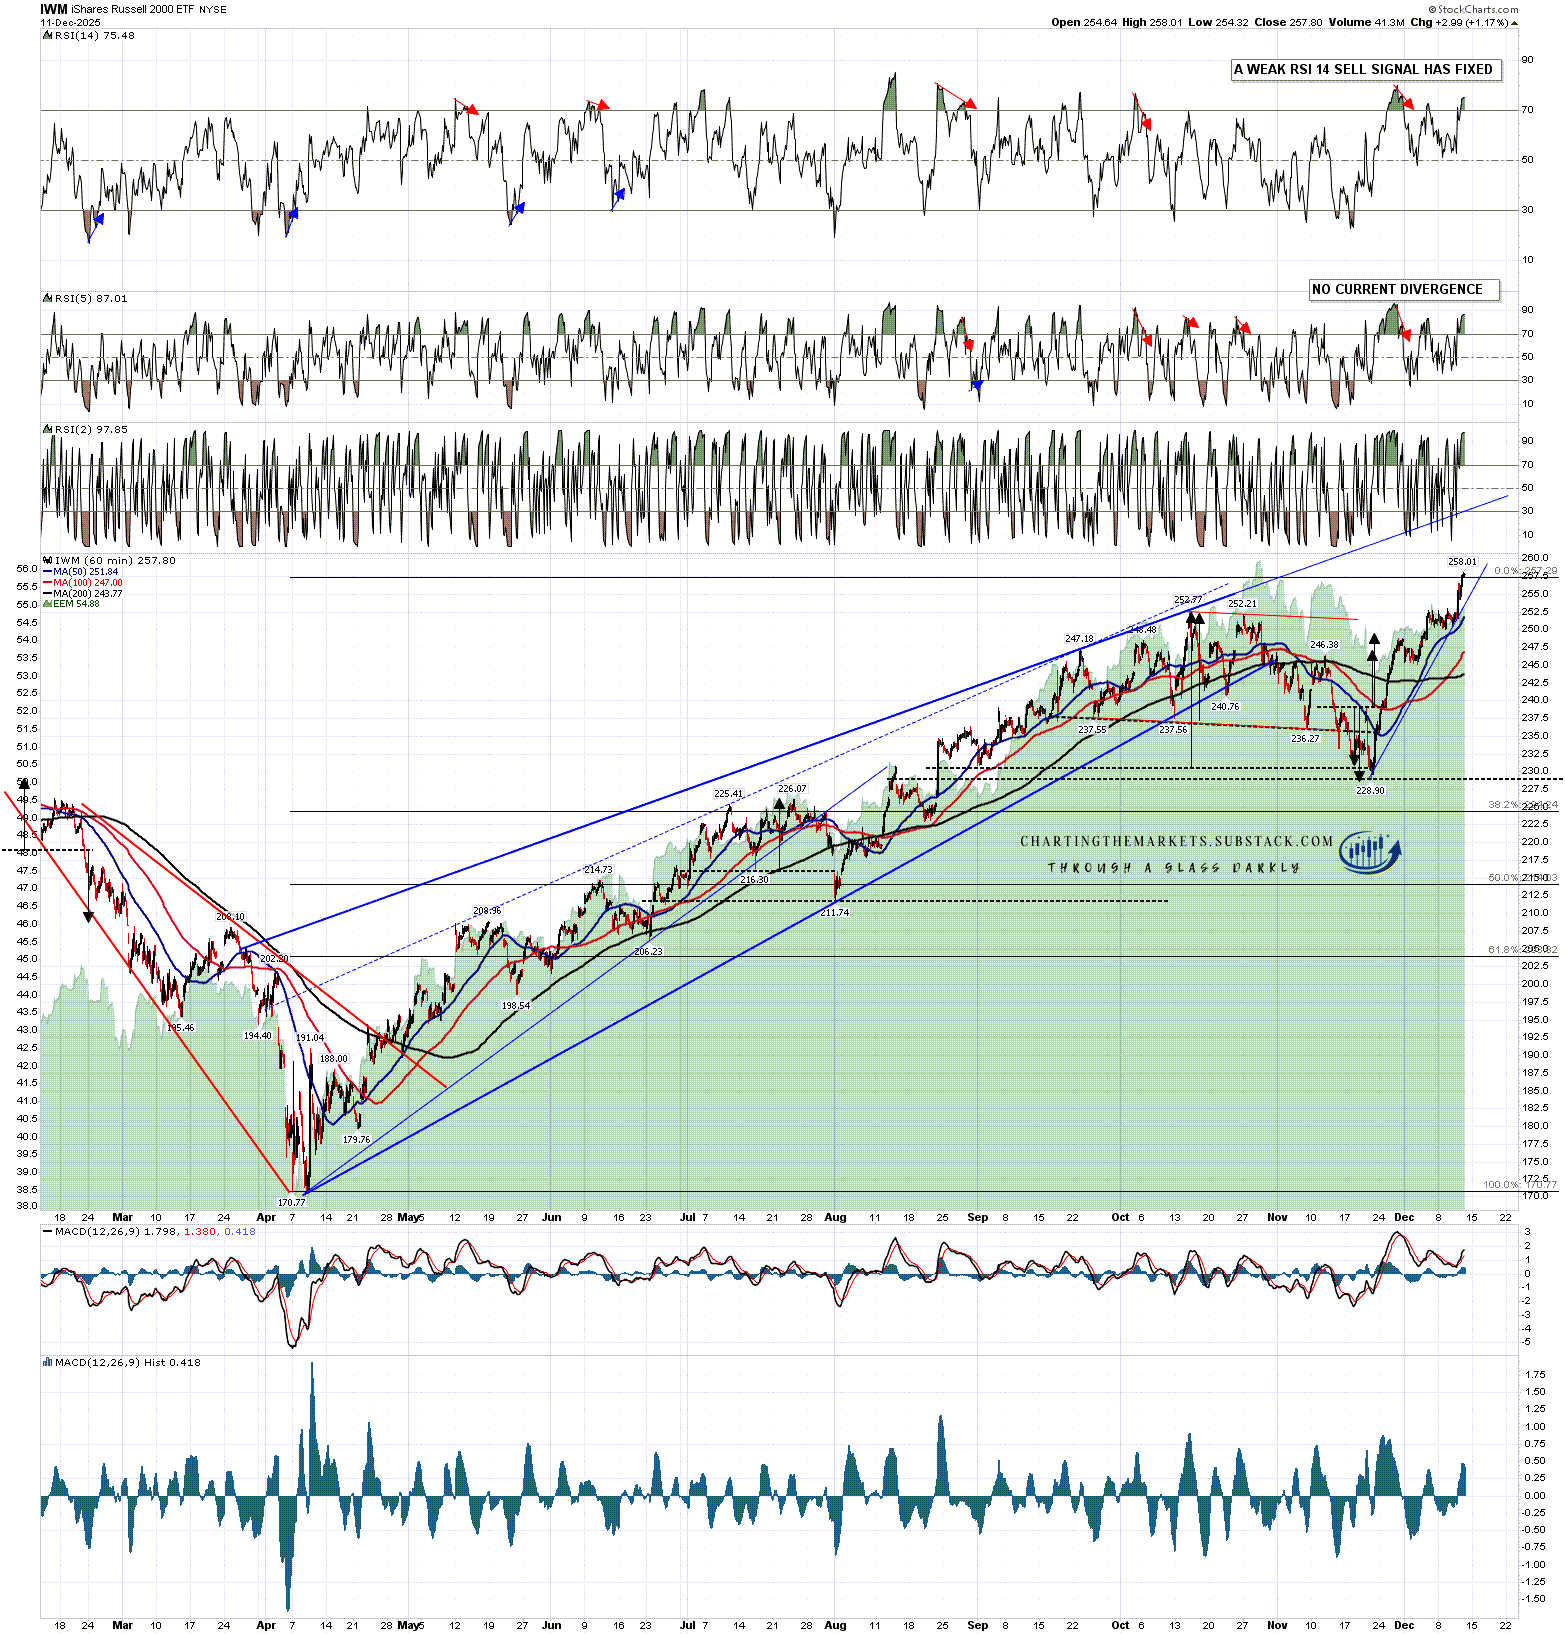
Has the rally on equity indices ended? Probably not, I’m still expecting all time high retests on SPX and QQQ as I was talking about in my post on Friday 12th December. The timing also looks early, with Xmas next week, so this is not a period where I would expect to see big declines on equities. If those are coming, and I think they may be, I’d be expecting those to start after next week.
This opens up the possibility that retests of the November lows on Crypto this week would be the start of a second phase of a rally while equity indices finish off the current move up over the next couple of weeks. If so the obvious options would be as follows:
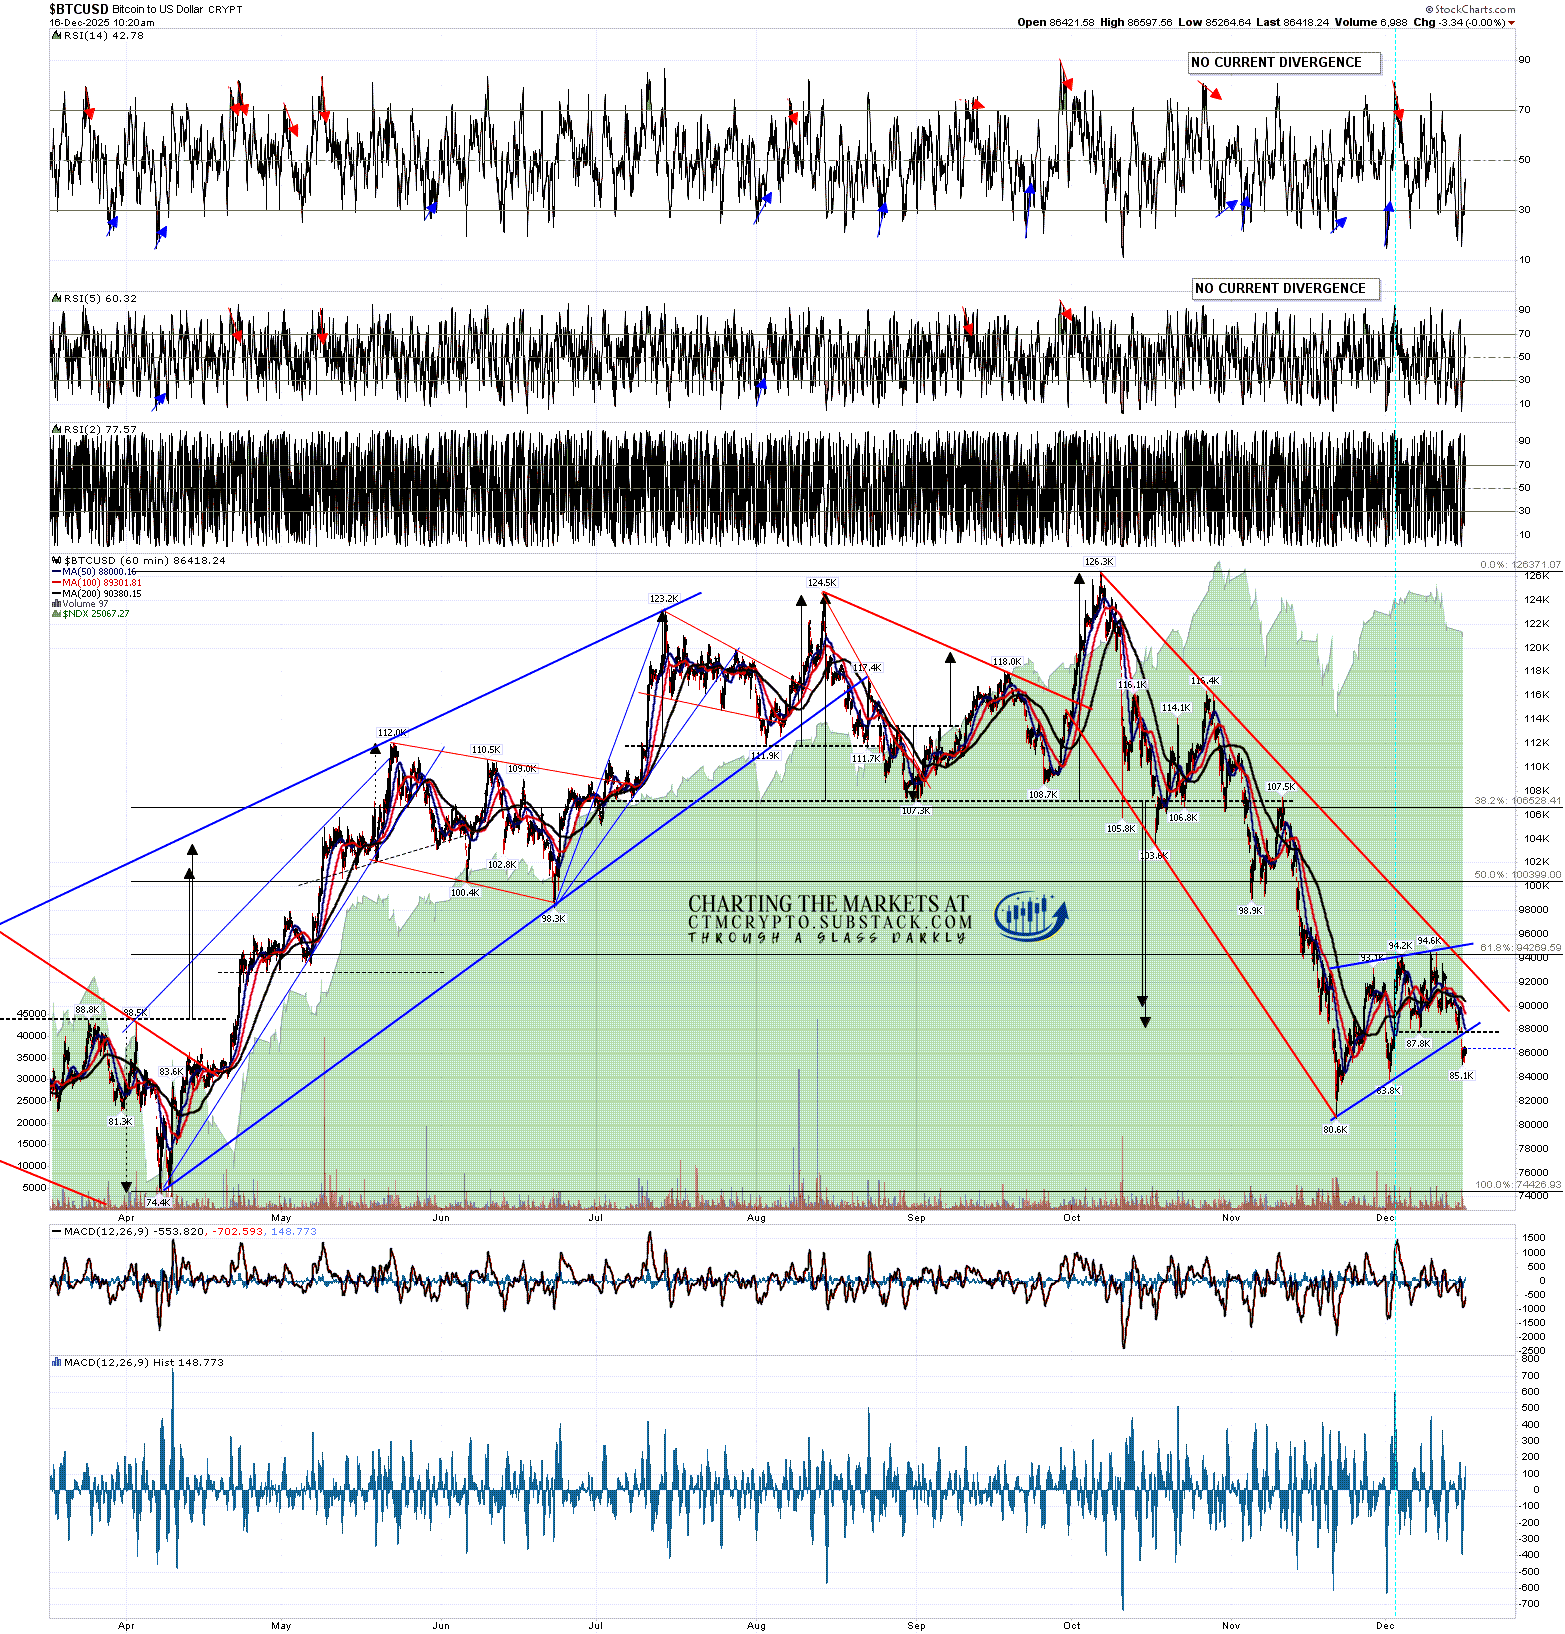
On Bitcoin the obvious bigger picture target for this move down would be a retest of the April low at 74.4k. This is a big established support level and the full retracement of the rising wedge from the April low. It is also a H&S neckline and I’m expecting this area to be hit by the end of January.
If we see a retest of the November low and, we are to see a second stage of this rally start, then that low retest would establish a possible double bottom setup which, in estimated terms, on a subsequent break over this rally high at 94.6k would look either for a double bottom target in the 108k to 110k area or a fail back into a retest of these November and December lows.
Either way I’d then be looking for a fail back towards that 74.4k target.
BTCUSD 60min chart:
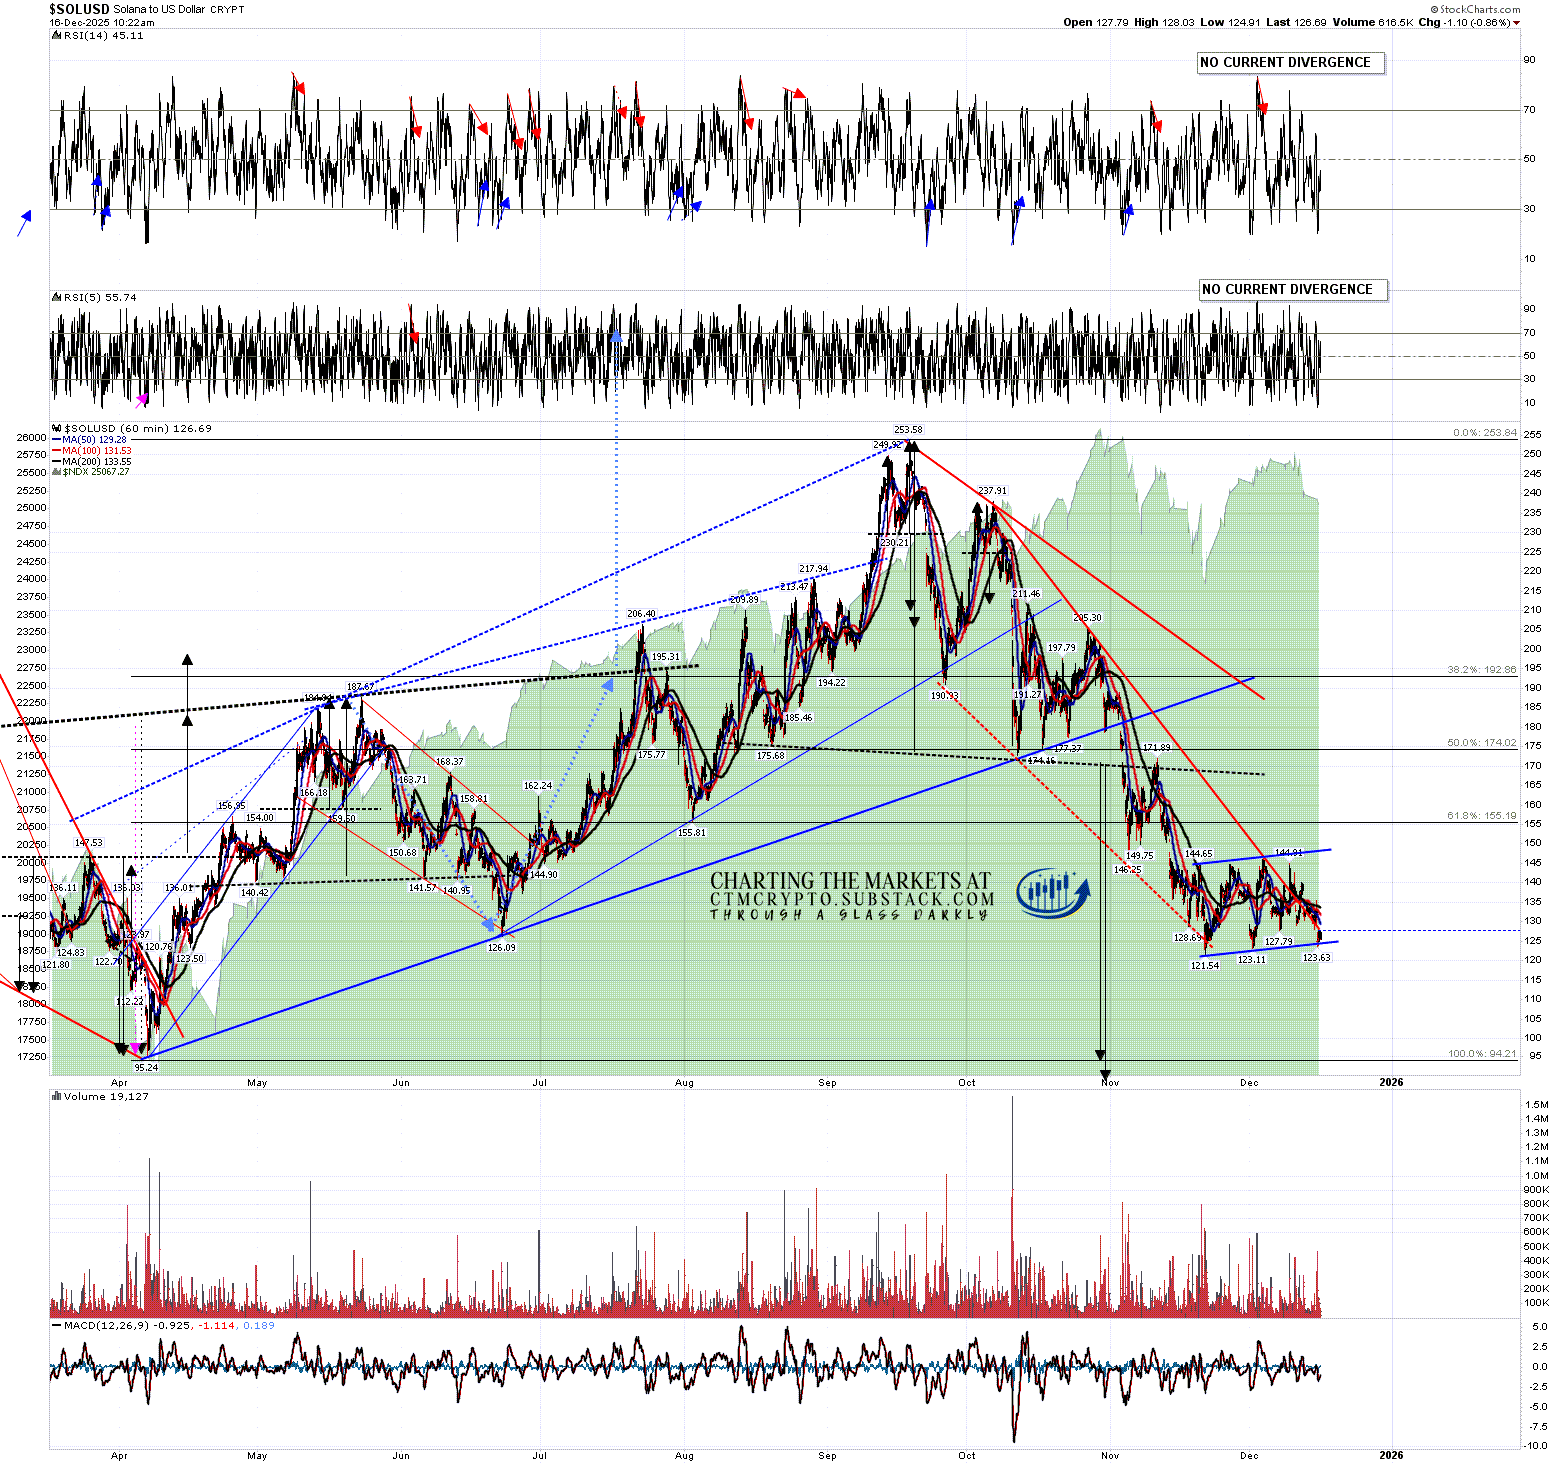
On Solana the obvious bigger picture target for this move down would be the H&S target at a retest of the April low at 95.24. This is a big established support level and the full retracement of the rising wedge from the April low. I’m expecting this area to be hit by the end of January.
If we see a retest of the November low and, we are to see a second stage of this rally start, then that low retest would establish a possible double bottom setup which, in estimated terms, on a subsequent break over this rally high at 146.91k would look either for a double bottom target in the 172 area or a fail back into a retest of these November and December lows.
Either way I’d then be looking for a fail back towards that 95.24 target.
SOLUSD 60min chart:
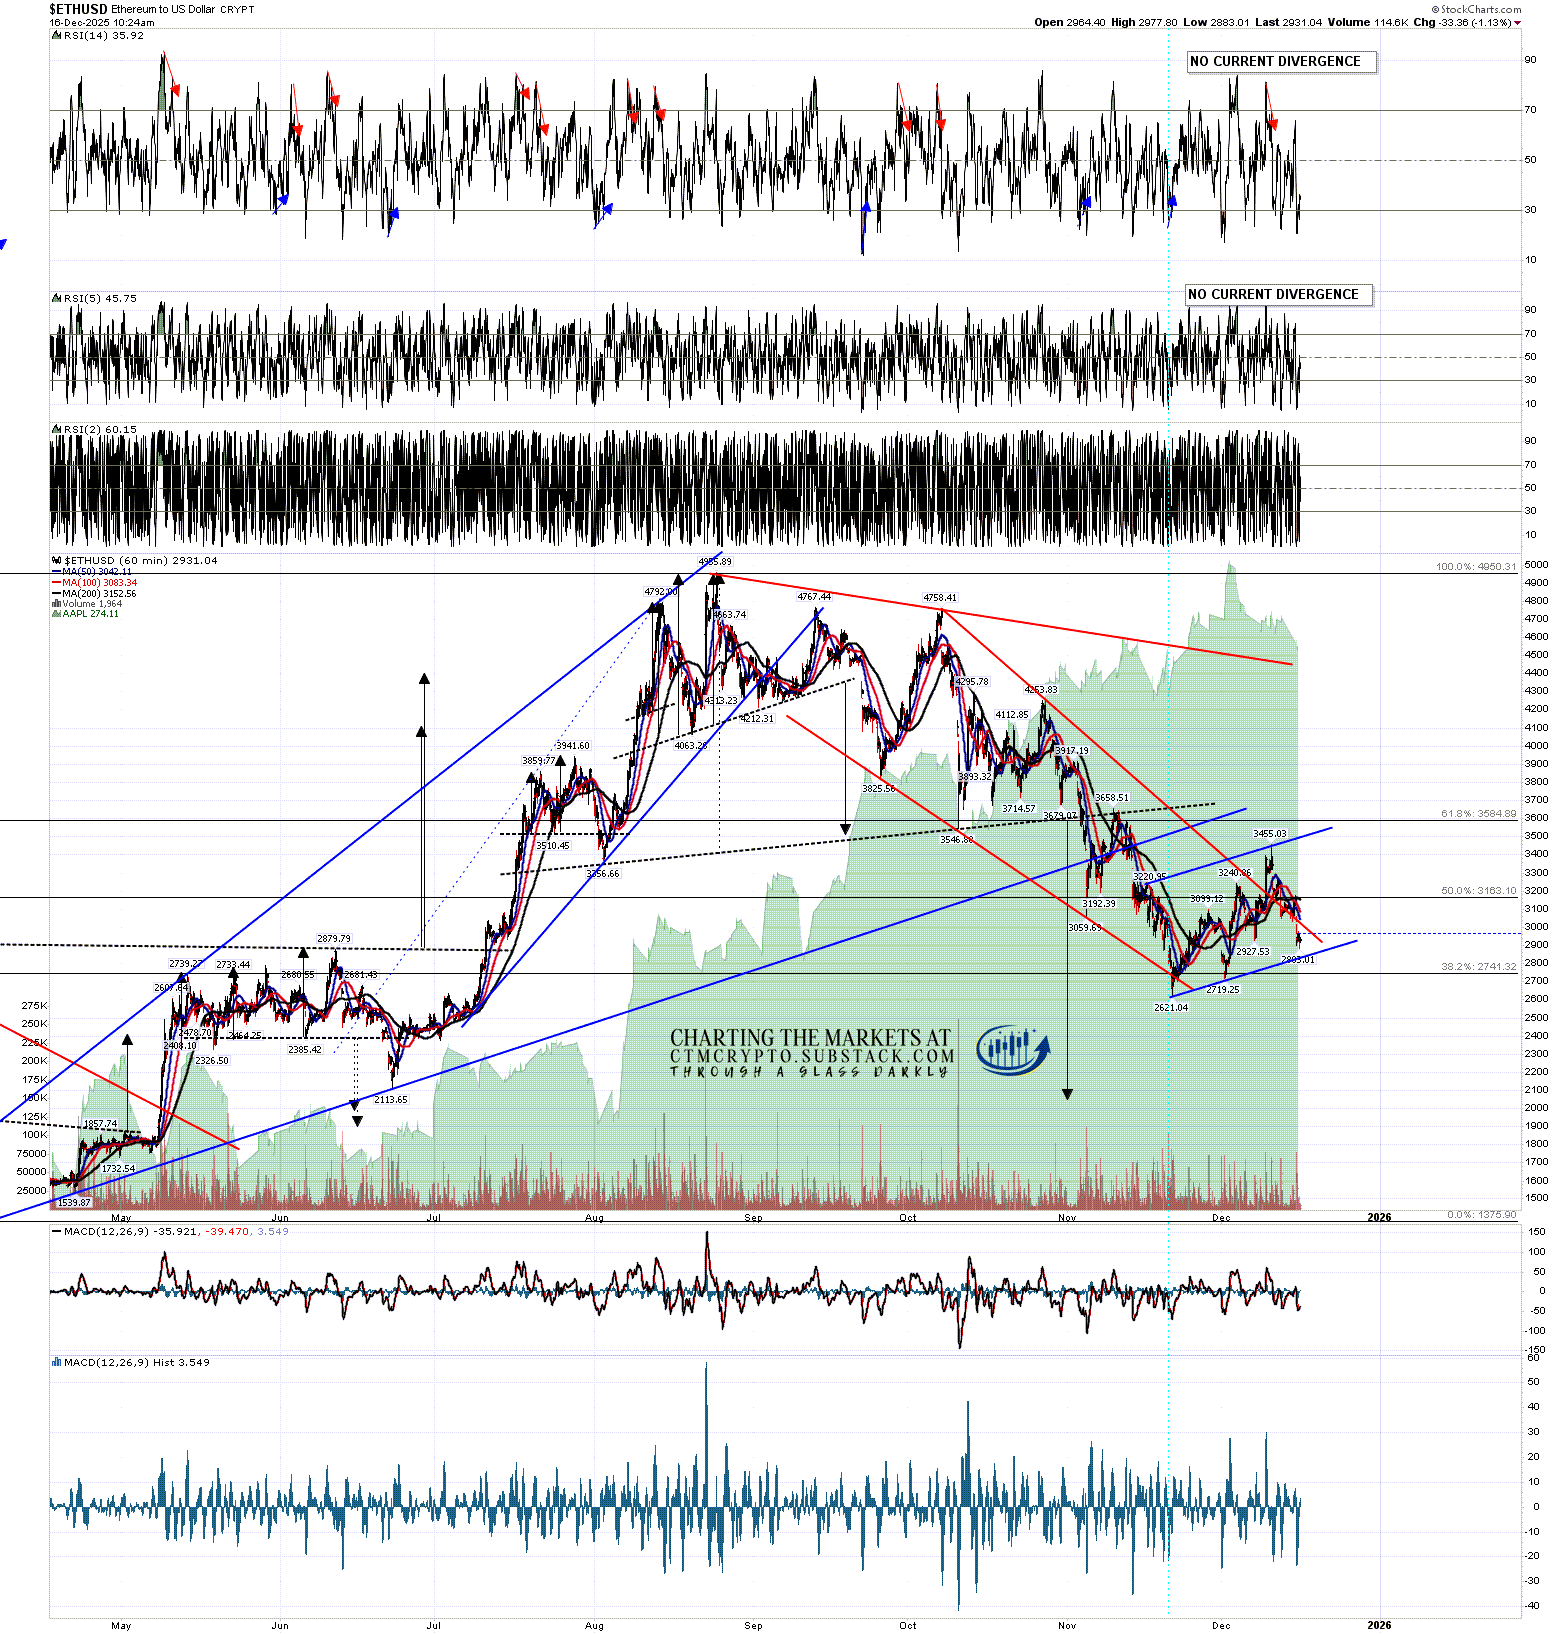
On Ethereum the obvious bigger picture target for this move down would be the H&S target in the 2050 area. I’m expecting this area to be hit by the end of January.
If we see a retest of the November low and, we are to see a second stage of this rally start, then that low retest would establish a possible double bottom setup which, in estimated terms, on a subsequent break over this rally high at 3455.03 would look either for a double bottom target in the 4300 area or a fail back into a retest of these November and December lows.
Either way I’d then be looking for a fail back towards that 2050 target.
ETHUSD 60min chart:
Since I started doing daily videos on Crypto early last year I’ve got Crypto direction right most of the time and more so than any other analyst anywhere that I’m aware of. I’m a very good analyst and all three of these instruments are very classical chartist friendly. I’m not much of a marketer though, and the free Crypto substack I set up last August still has less than 200 readers. I’d like to increase that readership and invite any suggestions on how I could do that.
If you’d like to see more of these posts please subscribe for free to my Crypto substack. I also do a premarket video every day (except tomorrow at 8.00am) on Crypto at 8.30am EST with morning charts for paying subscribers. All the videos I record are posted shortly after a delay of three days on my Youtube channel, and every post I publish is linked on my twitter.