- WE'RE JUST RANDOM SPECKS OF DUST IN A TORNADO TO THE MARKETS .......
- CHARTISTS MUST PUT ALL BIAS ASIDE AND LET THE CHARTS DO THE TALKING OR WE'LL SEE ONLY WHAT WE WANT TO SEE
- This blog has a copy of all header posts that I publish anywhere, so that those interested in seeing what my thoughts are on the markets can find them easily.
- I will be answering questions and responding to comments, so feel free to respond to any posts and I will see your comment even if it is not on the most recent post.
- If you're interested in seeing any intraday charts I post, I do that on twitter, and my twitter handle is @shjackcharts.
- The charts in the posts are as large as I can practically make them. if you would like to look at one more closely, click on it, and the link will take you to a larger version at screencast. If you click on that again, you will get a full page version, and can use the resizing function on your browser to enlarge parts of interest further.

Thursday, 30 October 2025

A VERY Important Inflection Point on Crypto

In my last post on Wednesday 22nd October I was looking at the major support being tested on Bitcoin (BTCUSD), Solana (SOLUSD), and Ethereum (ETHUSD), and saying that sustained breaks below those support levels would boost the case that the bull market on Crypto has already ended, barring possible high retests as part of the topping process. This was and is a major inflection point, and the direction of the break from this inflection point is still in the balance.

I was noting that the last two bull market highs on Bitcoin were in December 2017 and November 2021, close to the end of the year and four years apart, so the end of 2025 is the obvious period to be looking for an end to the current bull market, and I've had that pencilled in at the likely topping area all year.

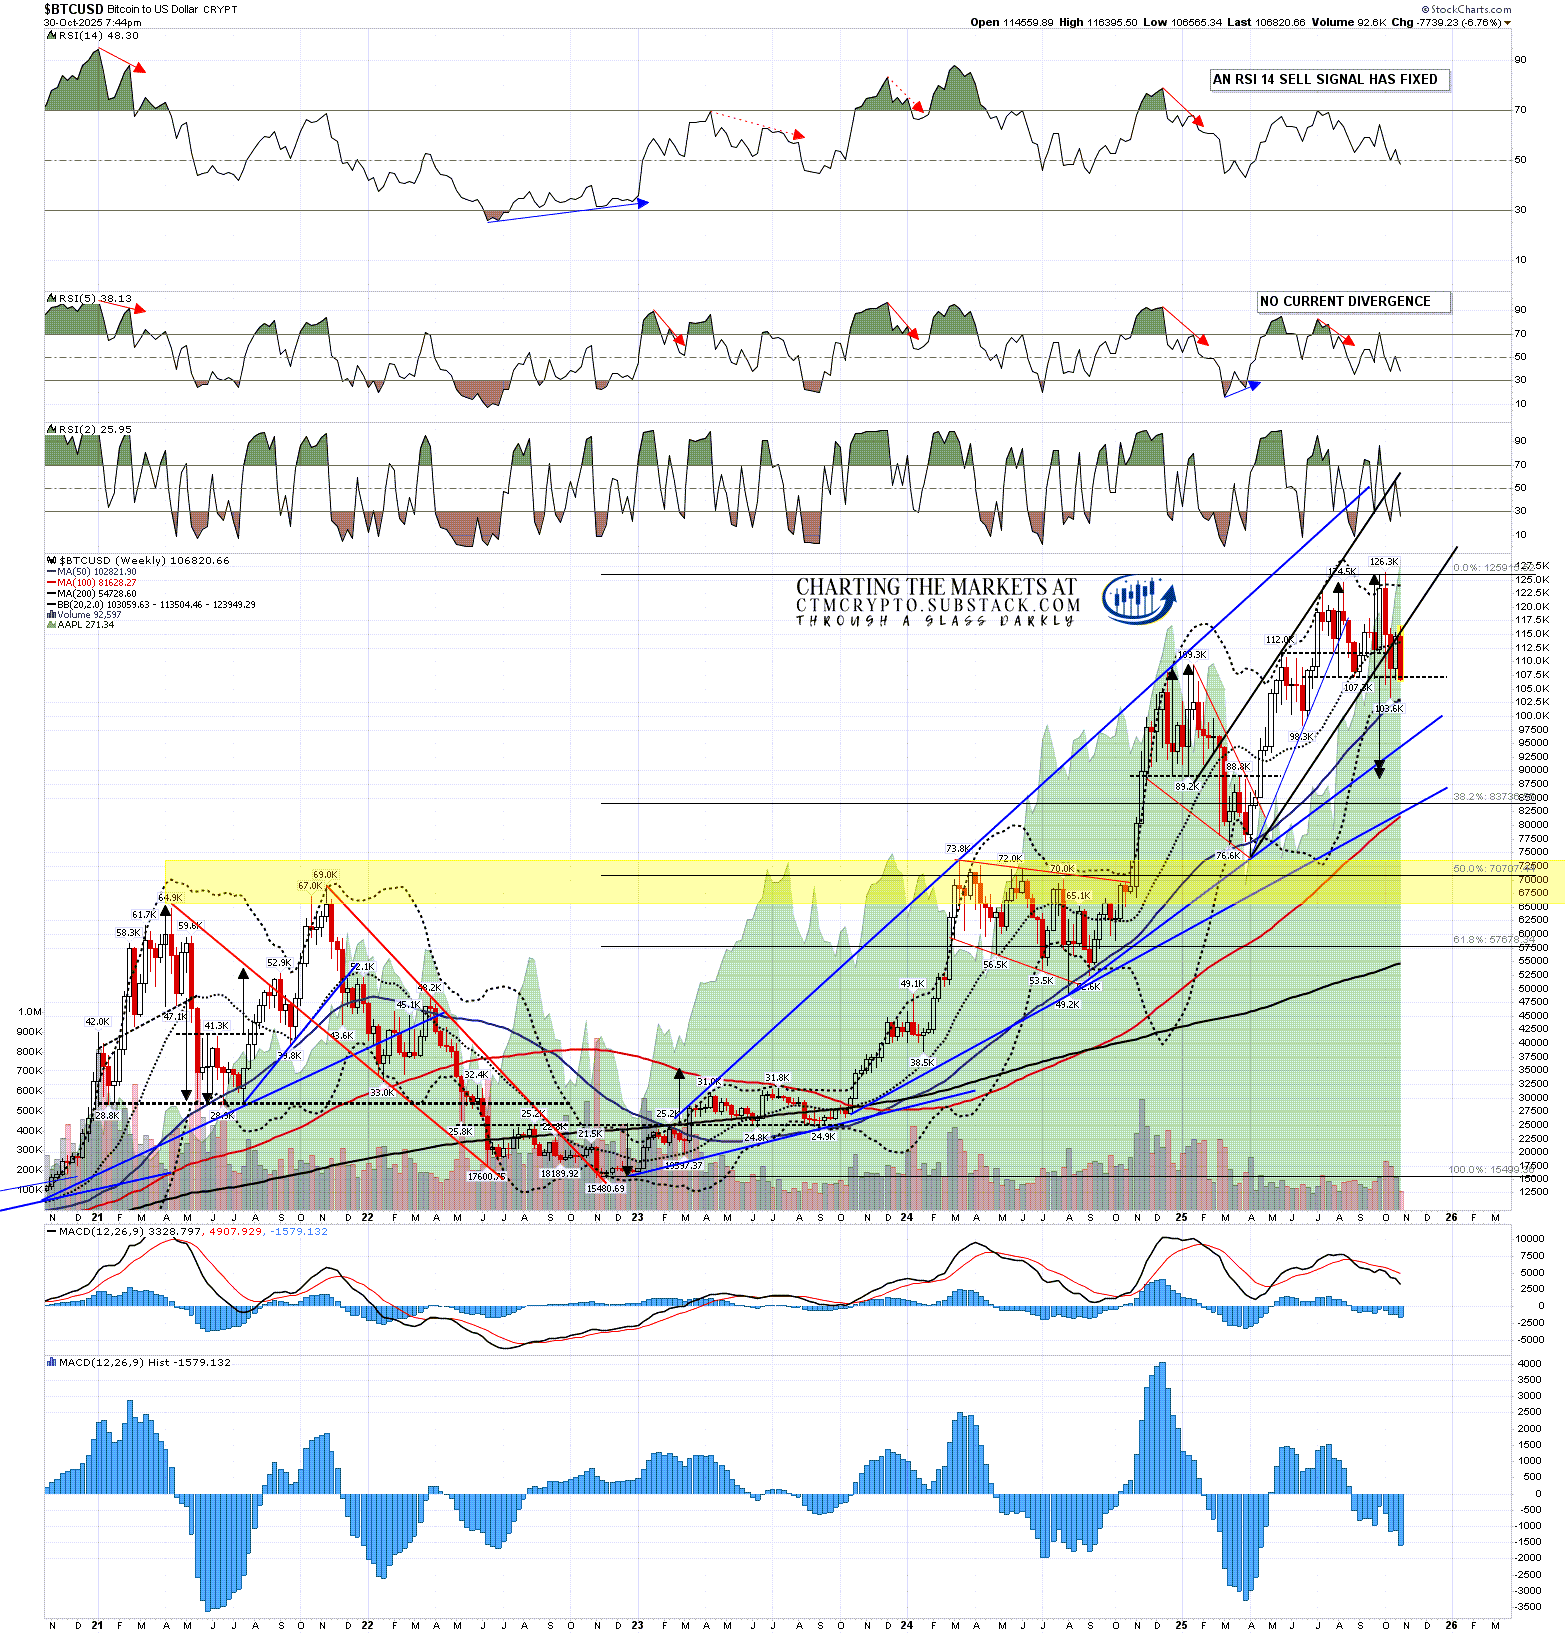
On the Bitcoin weekly chart the first big support is the weekly middle band, which was tested as support for six or the seven weeks before Bitcoin broke below it at the weekly close before last. That failed to confirm the support break at the end of last week with Bitcoin closing back above it. Bitcoin is back below that again at the moment.

The second big support is at the 50 week MA, currently at 102,832, and this is the really important level, that held as support on a weekly close basis through the last bull market until after the final high, and has held so far as support in this bull market. If we should see a significant closing break below that then there will be a strong case that this bull market is over or ending.

BTCUSD weekly chart:
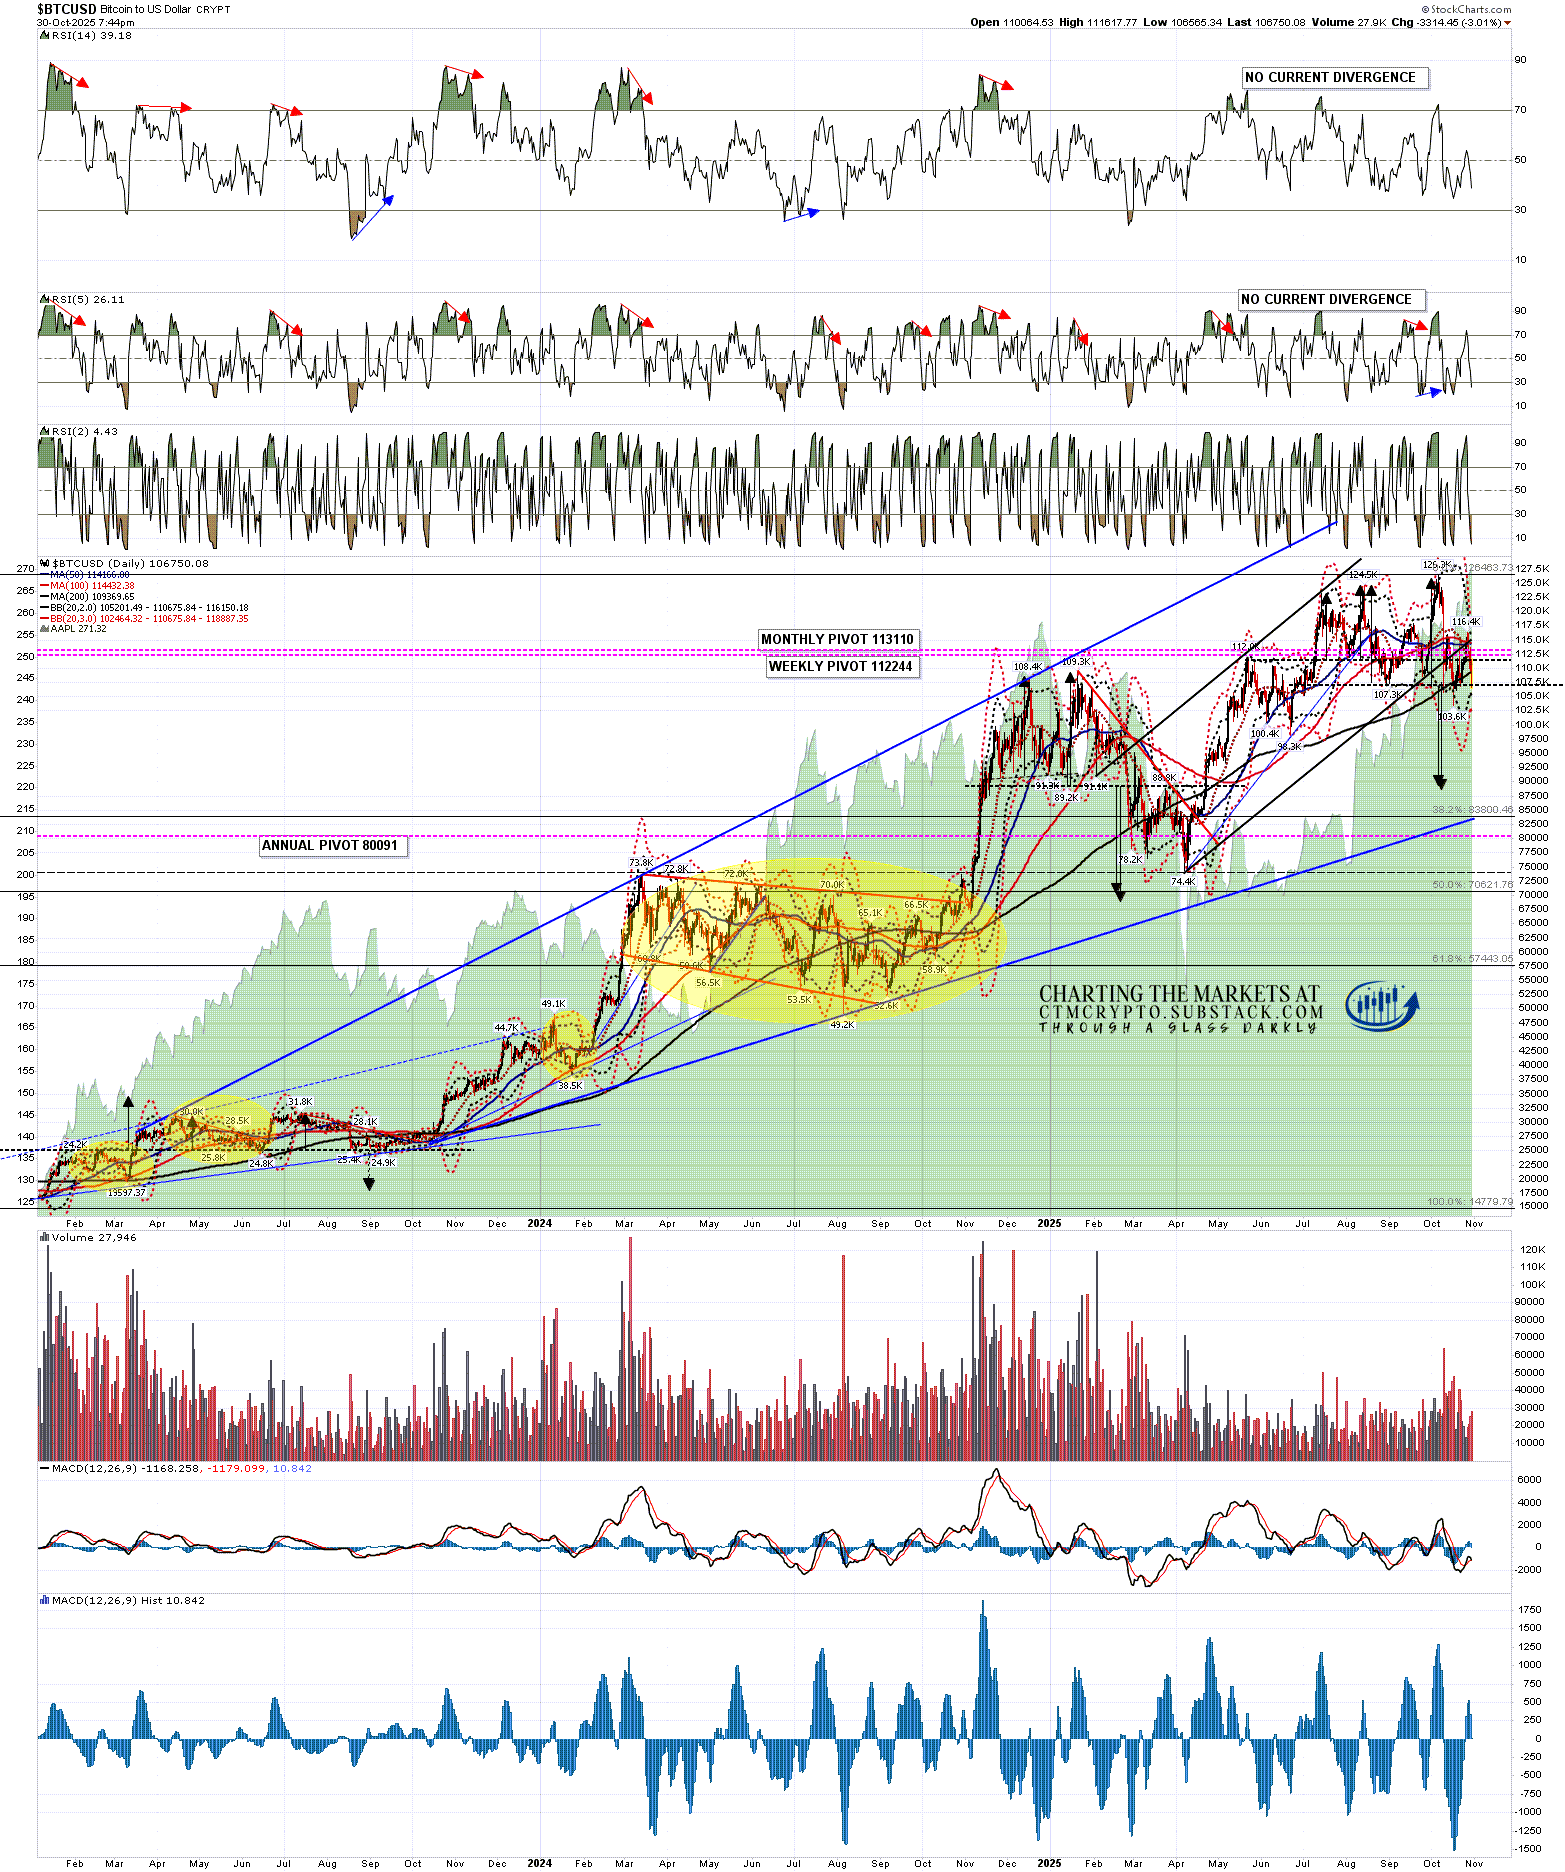
On the daily chart Bitcoin is testing the 200dma as support, currently at 109,372. This has been good support during this bull market and has been broken with conviction three times in the last two years, with these breaks delivering extended retracements lasting a further one, three and seven months before a sustained break back above.

If Bitcoin breaks down from this inflection point then a double top has already broken down with a target in the 88.3k to 90k area. If Bitcoin breaks up from this inflection point then a sustained break up directly from here (106.8k area), over the last rally high at 116.4k, would look for a retest of the all time high.

BTCUSD daily chart:
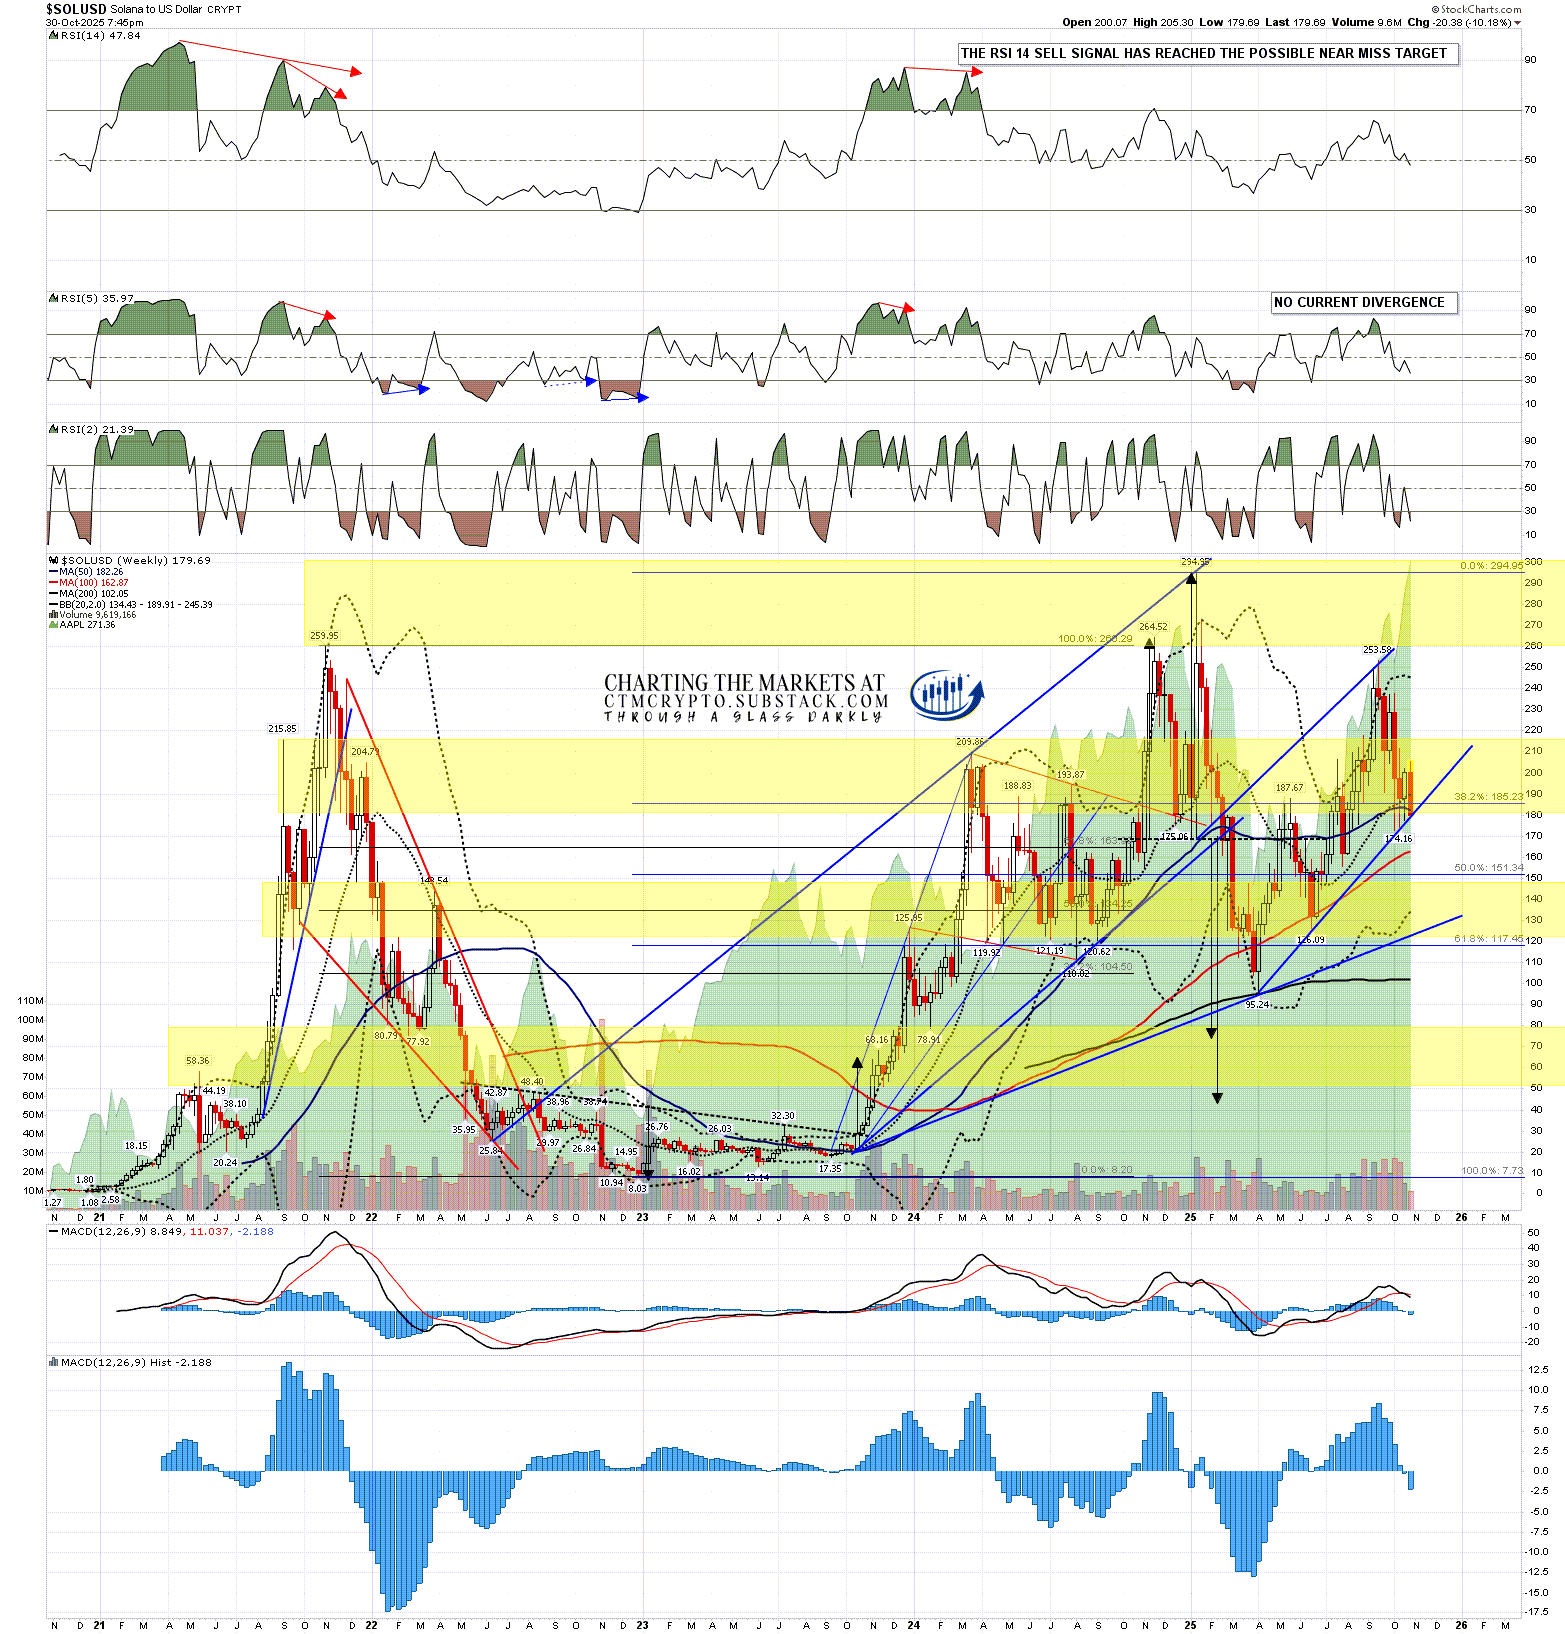
On Solana the weekly middle band has been tested as support every week for the last four weeks and has still not been broken on a weekly close basis. That may still hold as support. That’s currently at 190, just above the 50 week MA at 182.29. That 50 week MA was again only broken after the last bull market high in Q3 2021, but was broken hard weeks after the all time high made in January, with Solana only breaking back above it with confidence in July.

These are the two big levels on the weekly chart and the only other big level on this chart is the 200 week MA, which was tested at the 2025 low, and is currently at 102.06.

SOLUSD weekly chart:
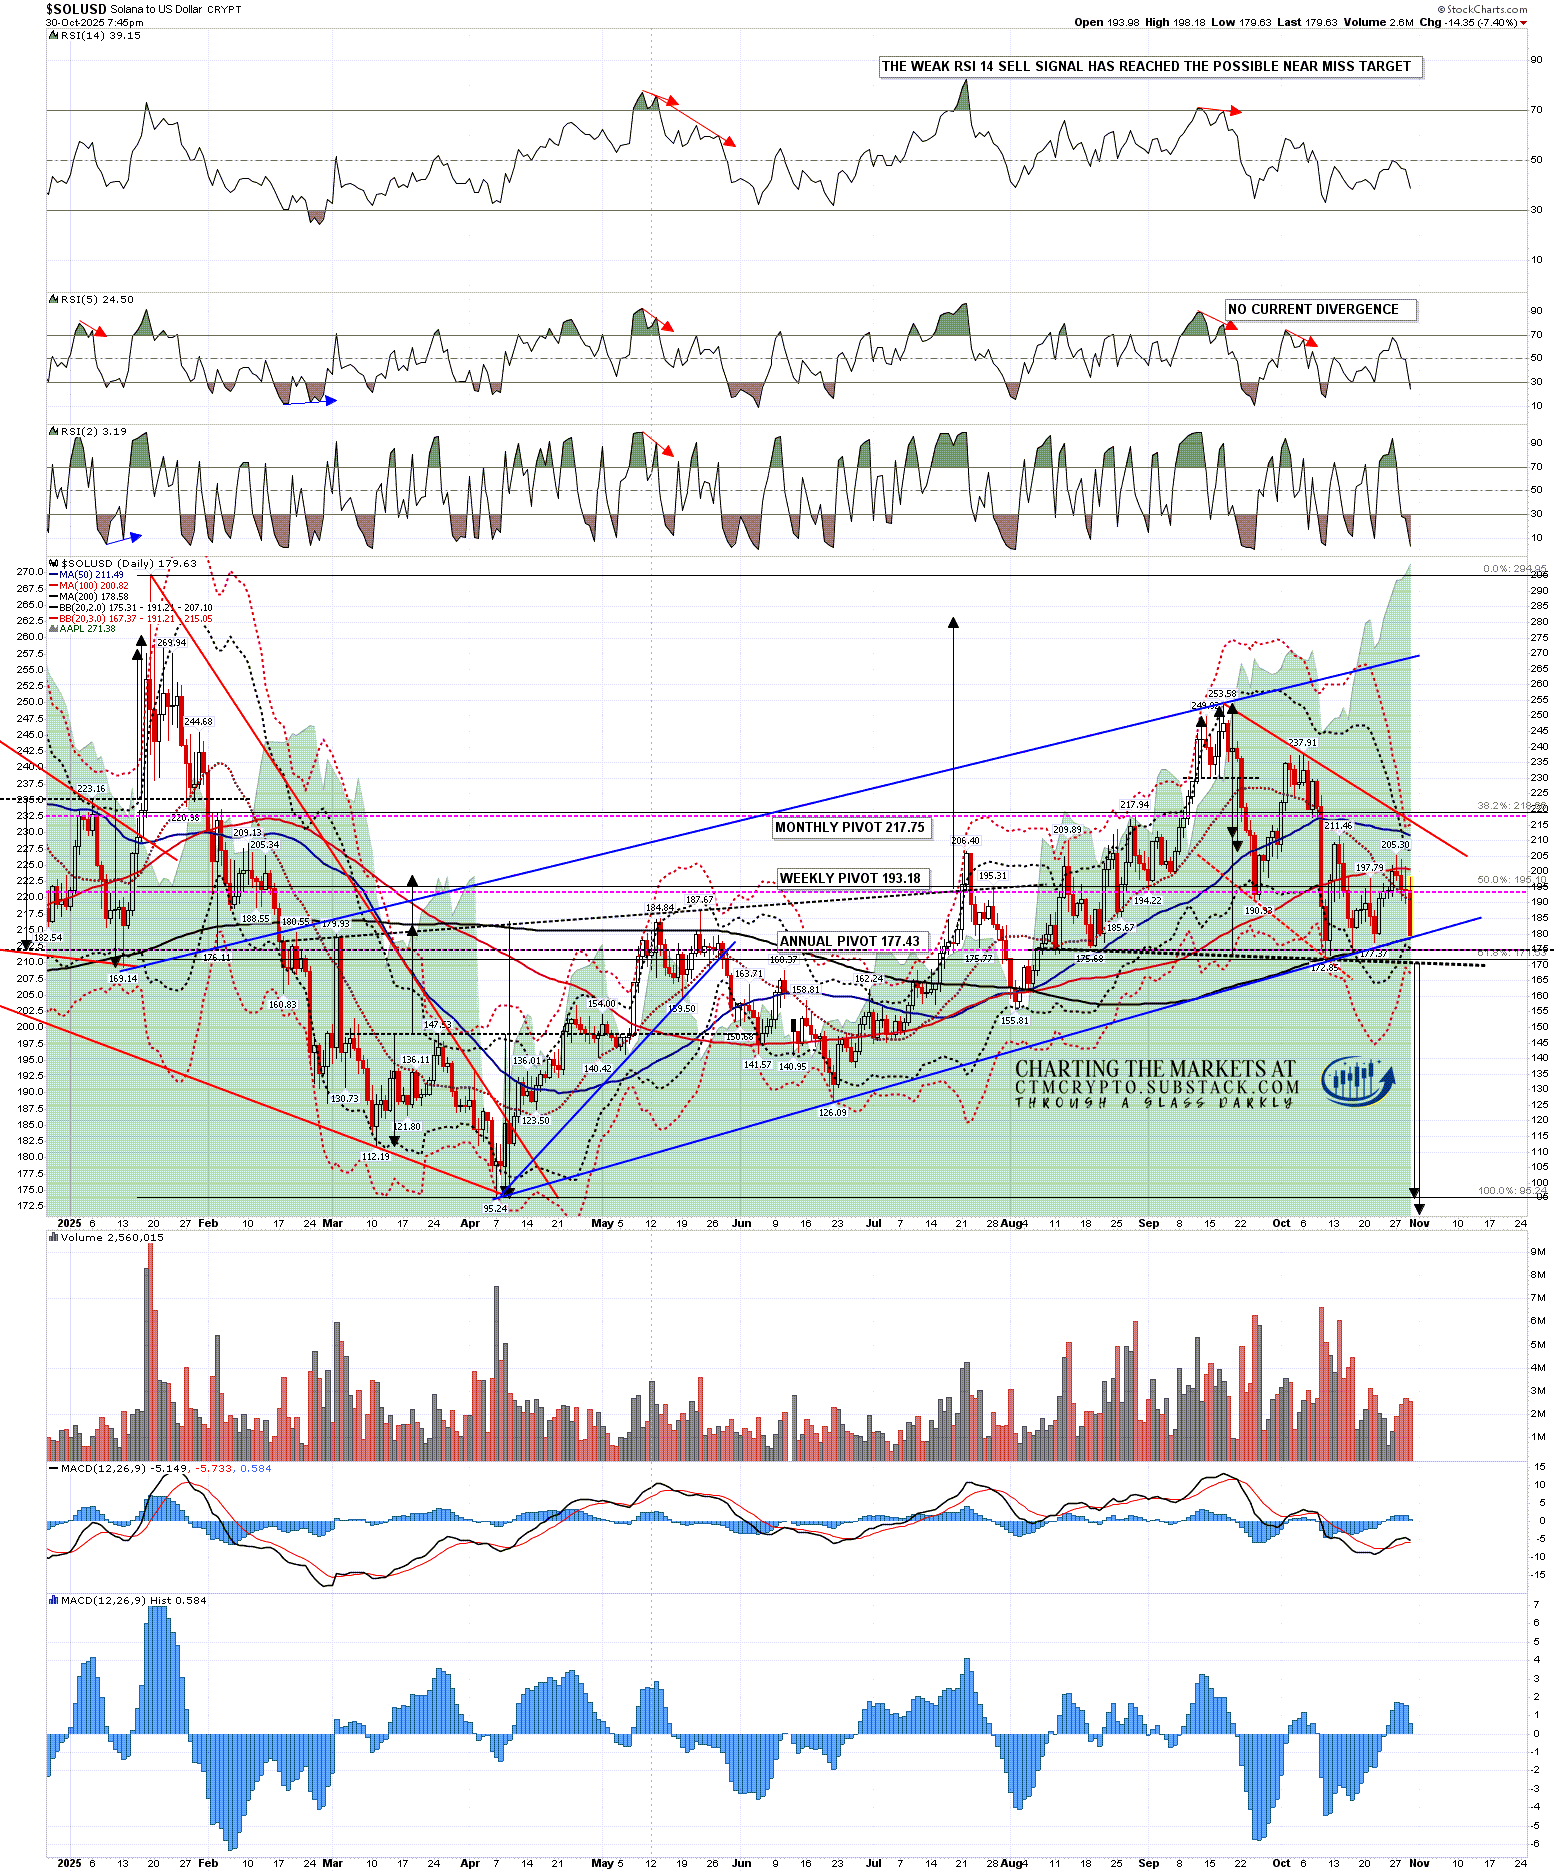
On the daily chart rising wedge support from the April low and the 200dma are currently in the 178.50 area. If that wedge support breaks then the odds that the bull market high on Solana has already been made increase considerably, but a short term double bottom may still be forming.

If Solana breaks down from this inflection point then on a sustained break below the H&S neckline at 170 the H&S target would be at a retest of the April low at 95.24. If Solana breaks up from this inflection point, then a sustained break up directly from here or lower, over the last rally high at 211.4k, would look for a retest of the September high at 253.58.

SOLUSD daily chart:
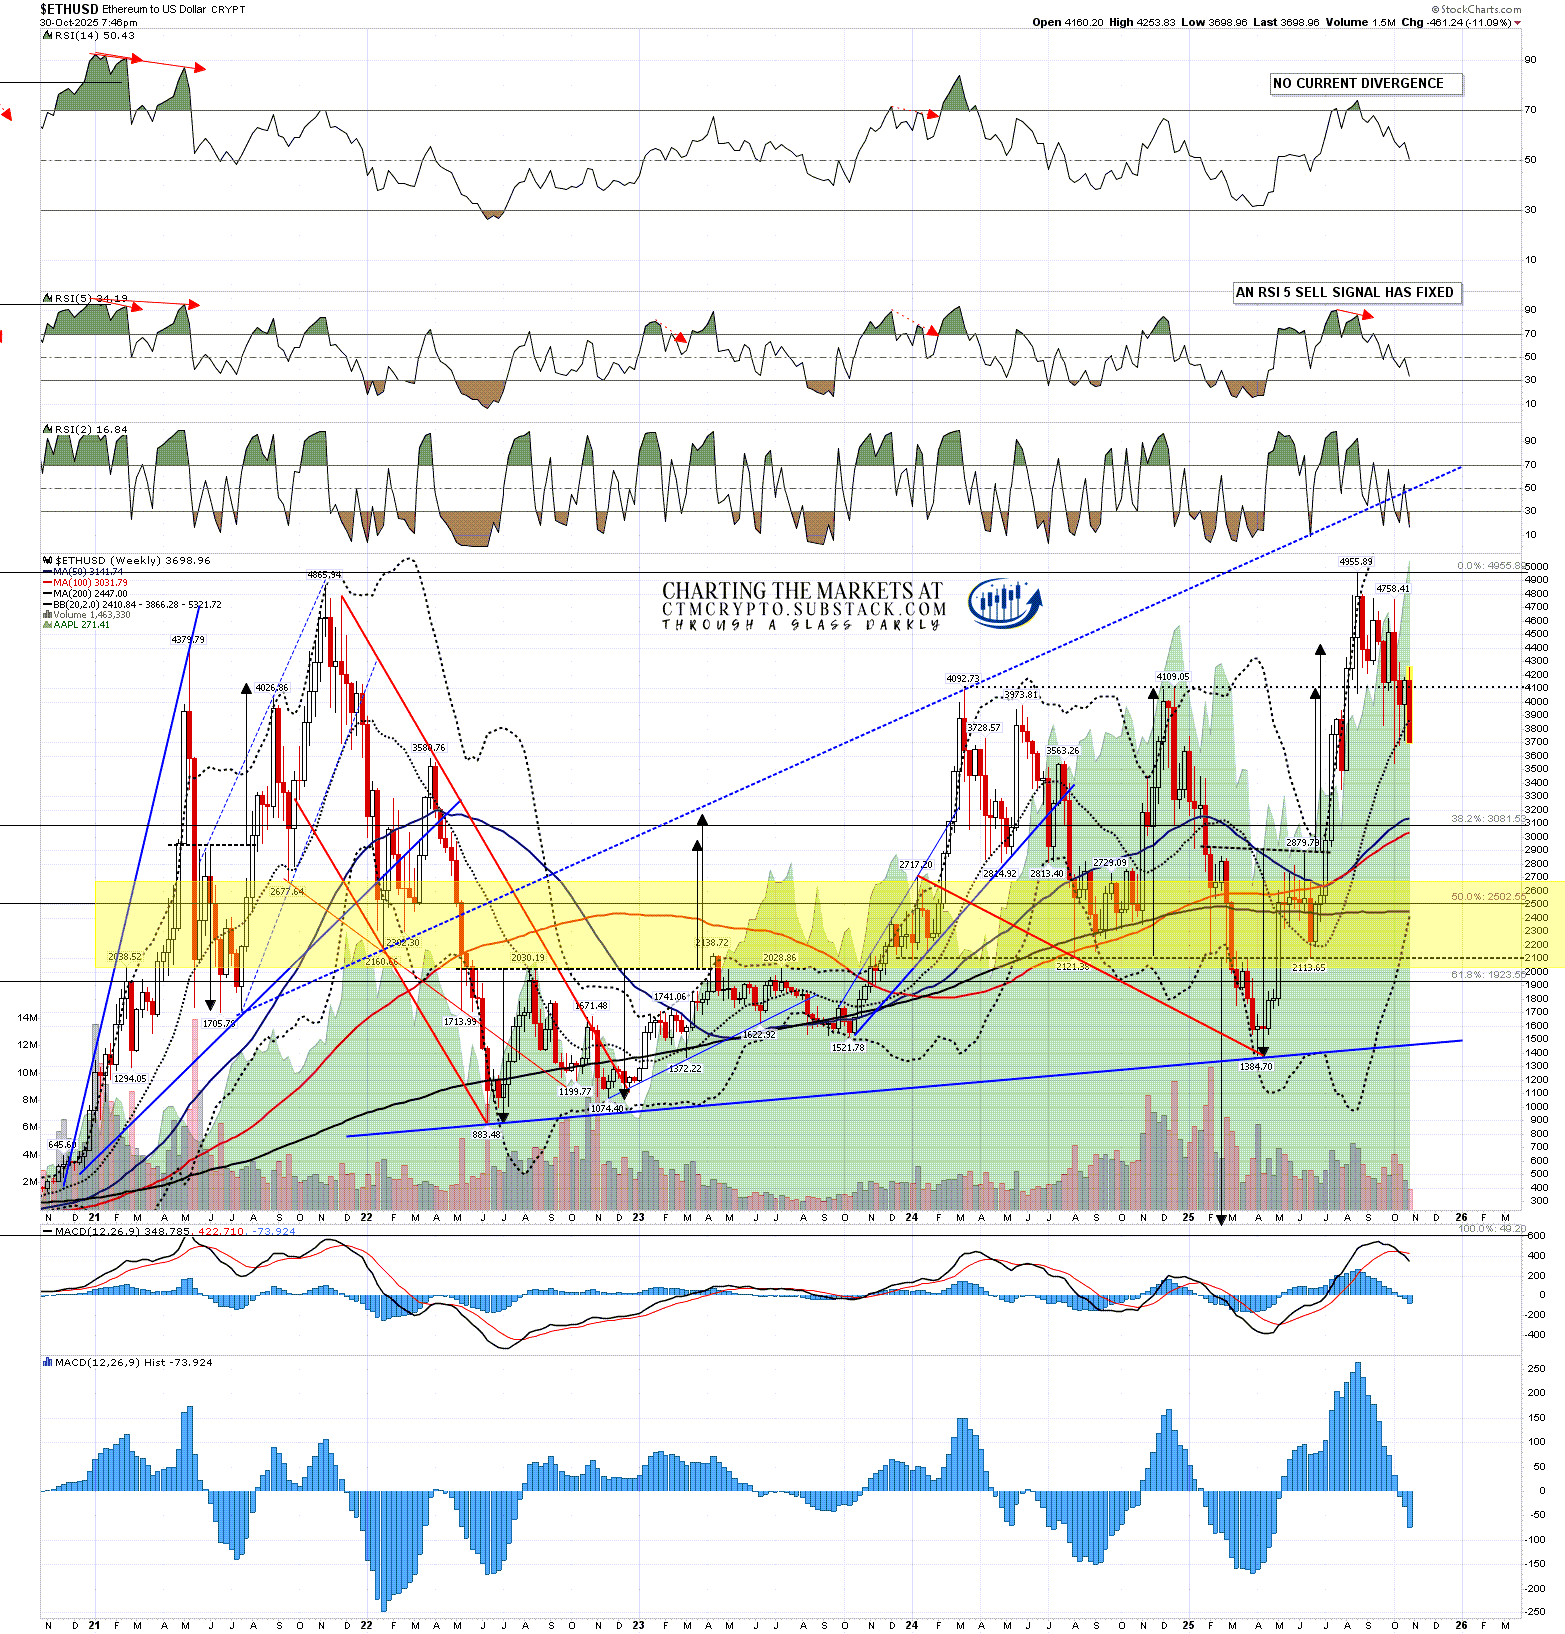
On Ethereum the weekly middle band has been tested as support every week for the last four weeks and has still not been broken on a weekly close basis. That’s currently at 3857.27. That is a big level on the weekly chart, with the other bigger level at the 50 week MA, currently at 3142.14. The 50 week MA on Ethereum was not broken until after the highs on the last two bull markets in early 2018 (on Ethereum, but in late 2017 on Bitcoin), and late 2021.

ETHUSD weekly chart:
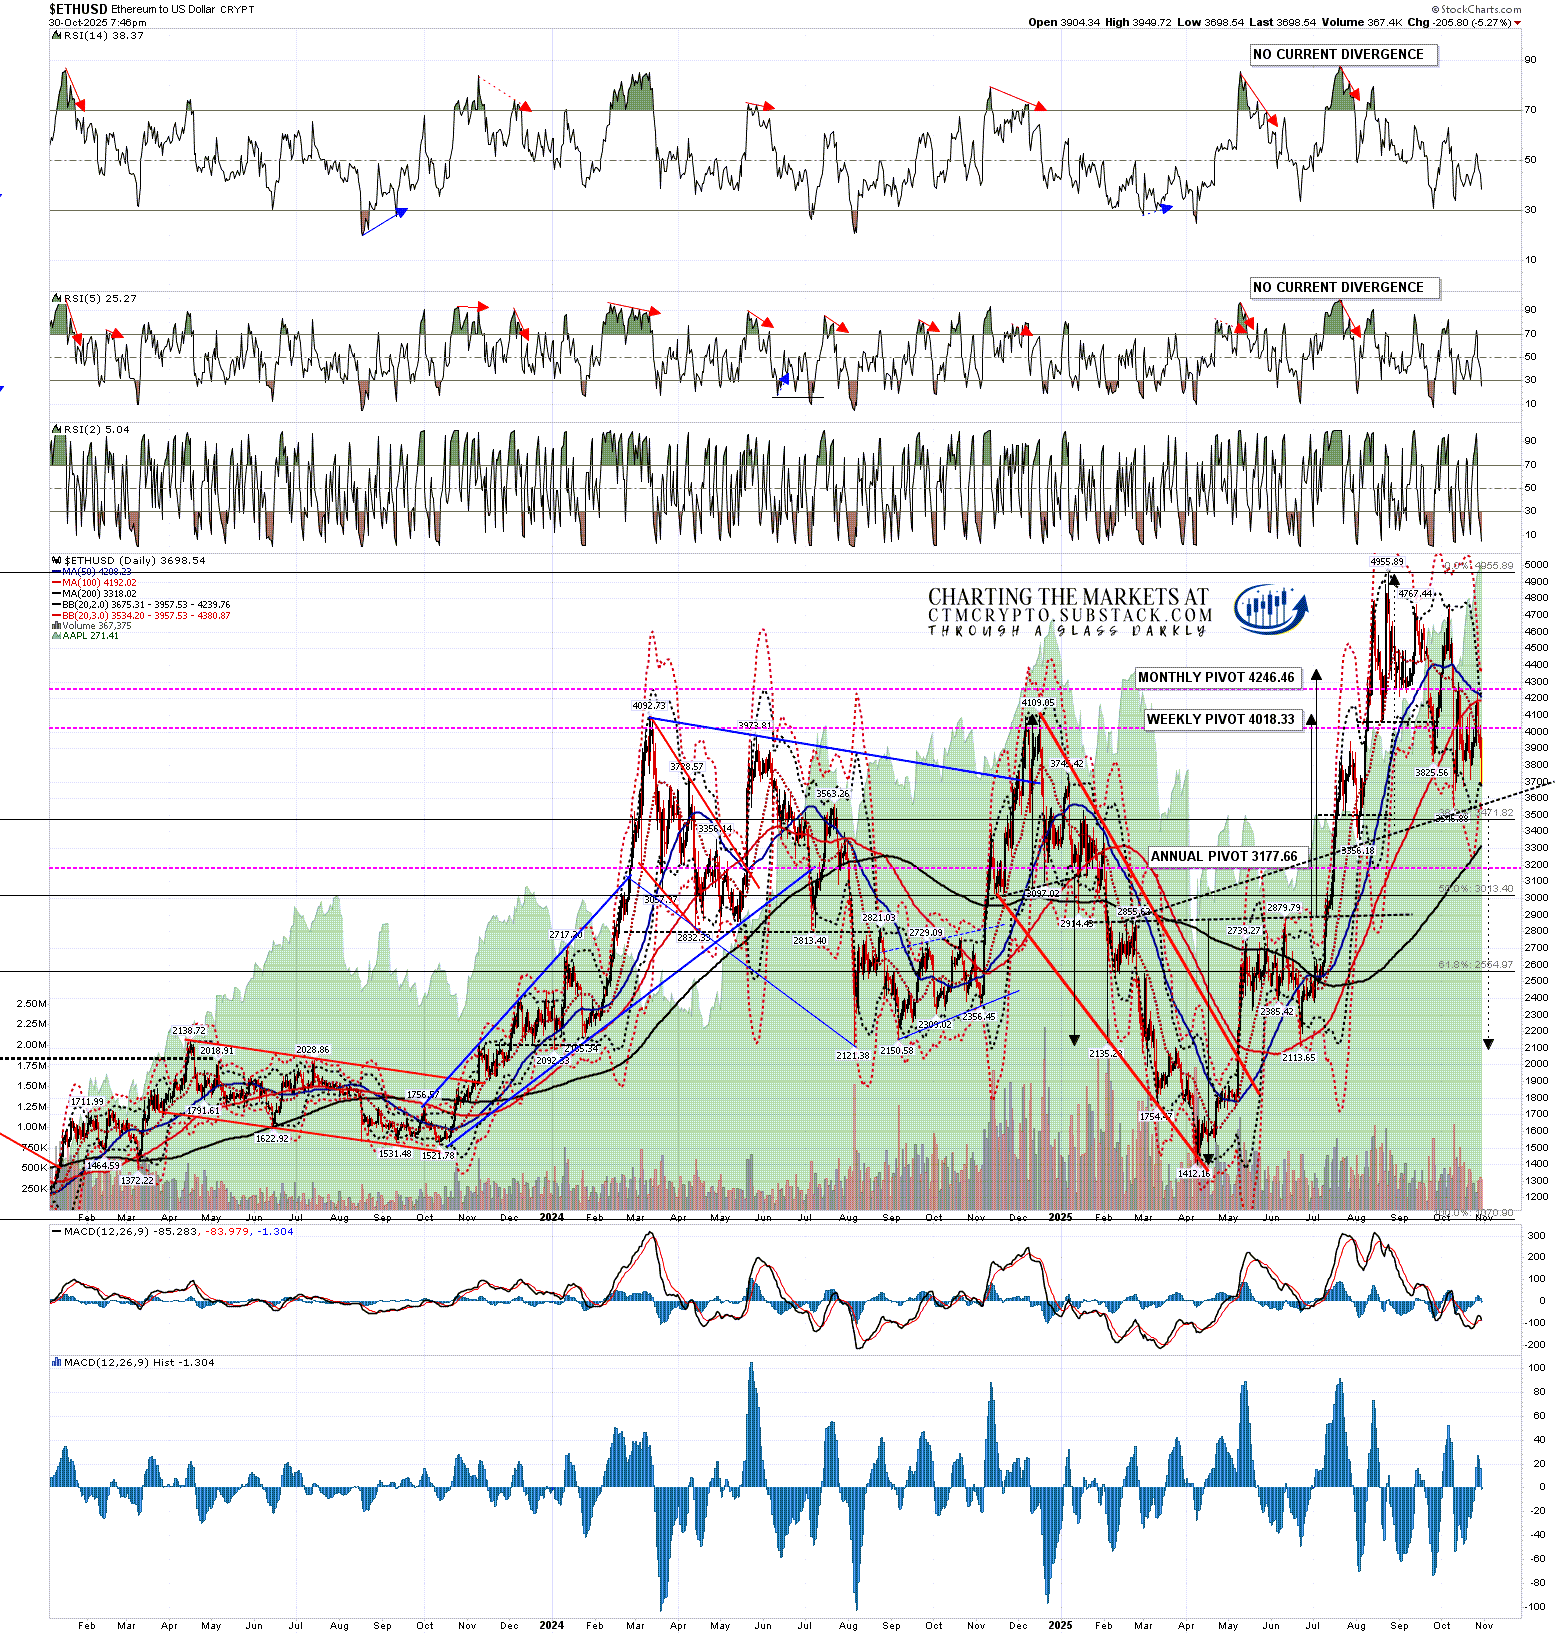
On the Ethereum daily chart the next big support is at the 200dma, currently at 3318.17. That’s been good support and is a decent match with the 50 week MA, so there is a big double support level in the 3100-3350 area.

If Ethereum breaks down from this inflection point then on a sustained break below the H&S neckline at 3600 the H&S target would be in the 2050 area. If Ethereum breaks up from this inflection point directly then there is no current bottoming pattern but if we see a retest of the recent low at 3546.88 then on a sustained break over the last rally high at 4253.83, I’d be looking for a retest of the all time high at 4955.89.

ETHUSD daily chart:
What’s the bottom line here? Well that we are seeing this inflection point now at all is suggesting that the bull market high is close, but then I’ve been talking about a high in the December 2025 area all year, and tomorrow is the last day of October.

Since I started doing daily videos on Crypto early last year I’ve got Crypto direction right most of the time and more so than any other analyst anywhere that I’m aware of. I’m a very good analyst and all three of these instruments are very classical chartist friendly. I’m not much of a marketer though, and the free Crypto substack I set up last August still has less than 200 readers. I’d like to increase that readership and invite any suggestions on how I could do that.

If you’d like to see more of these posts please subscribe for free to my Crypto substack. I also do a premarket video every day on Crypto at 9.05am EST with morning charts for paying subscribers. All the videos I record are posted shortly afterwards on my Youtube channel, and every post I publish is linked on my twitter.

Tuesday, 28 October 2025

Overthrowing The Rising Wedges

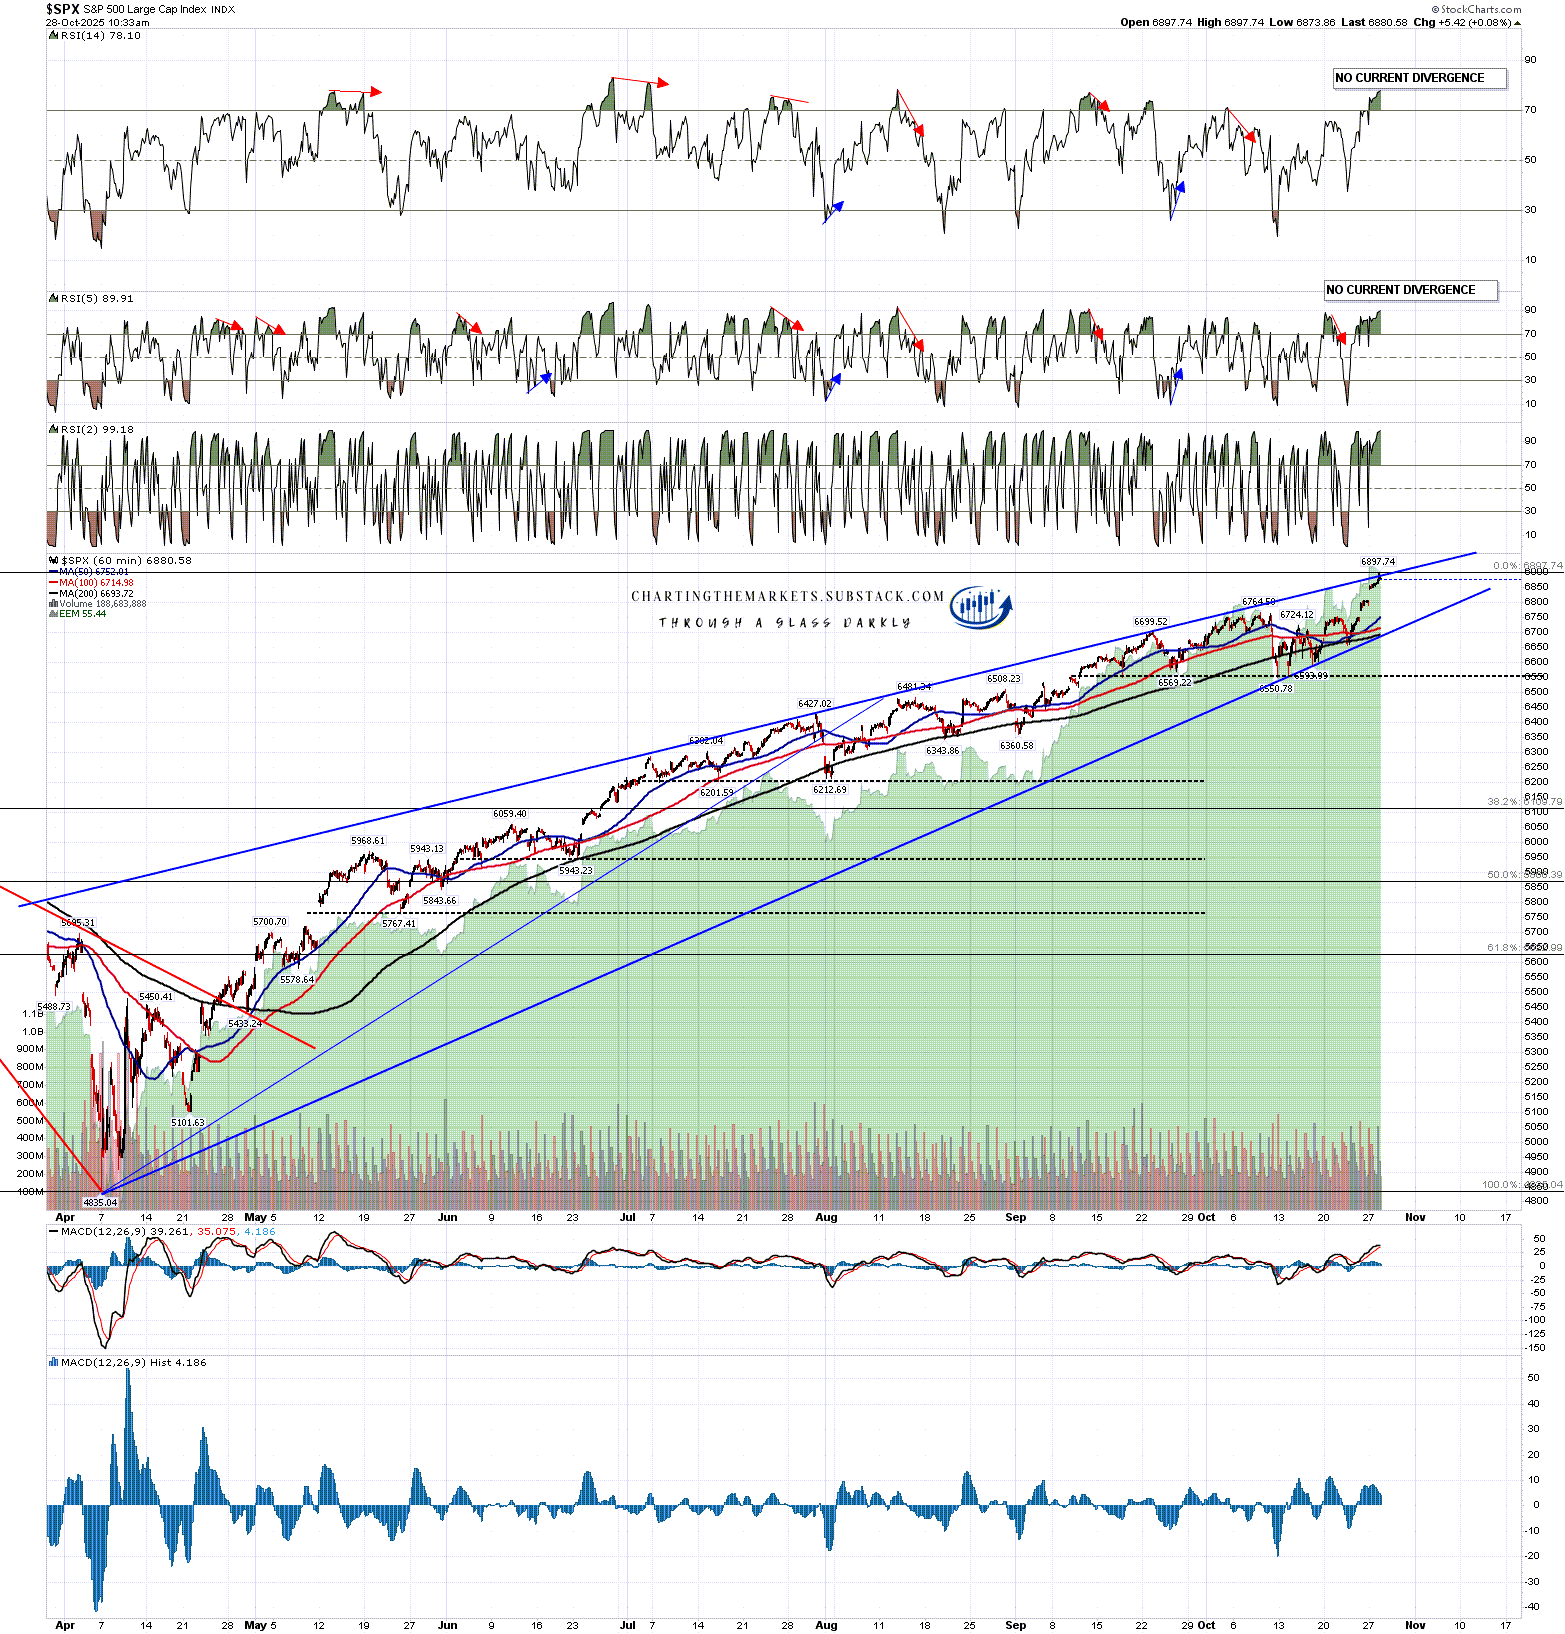
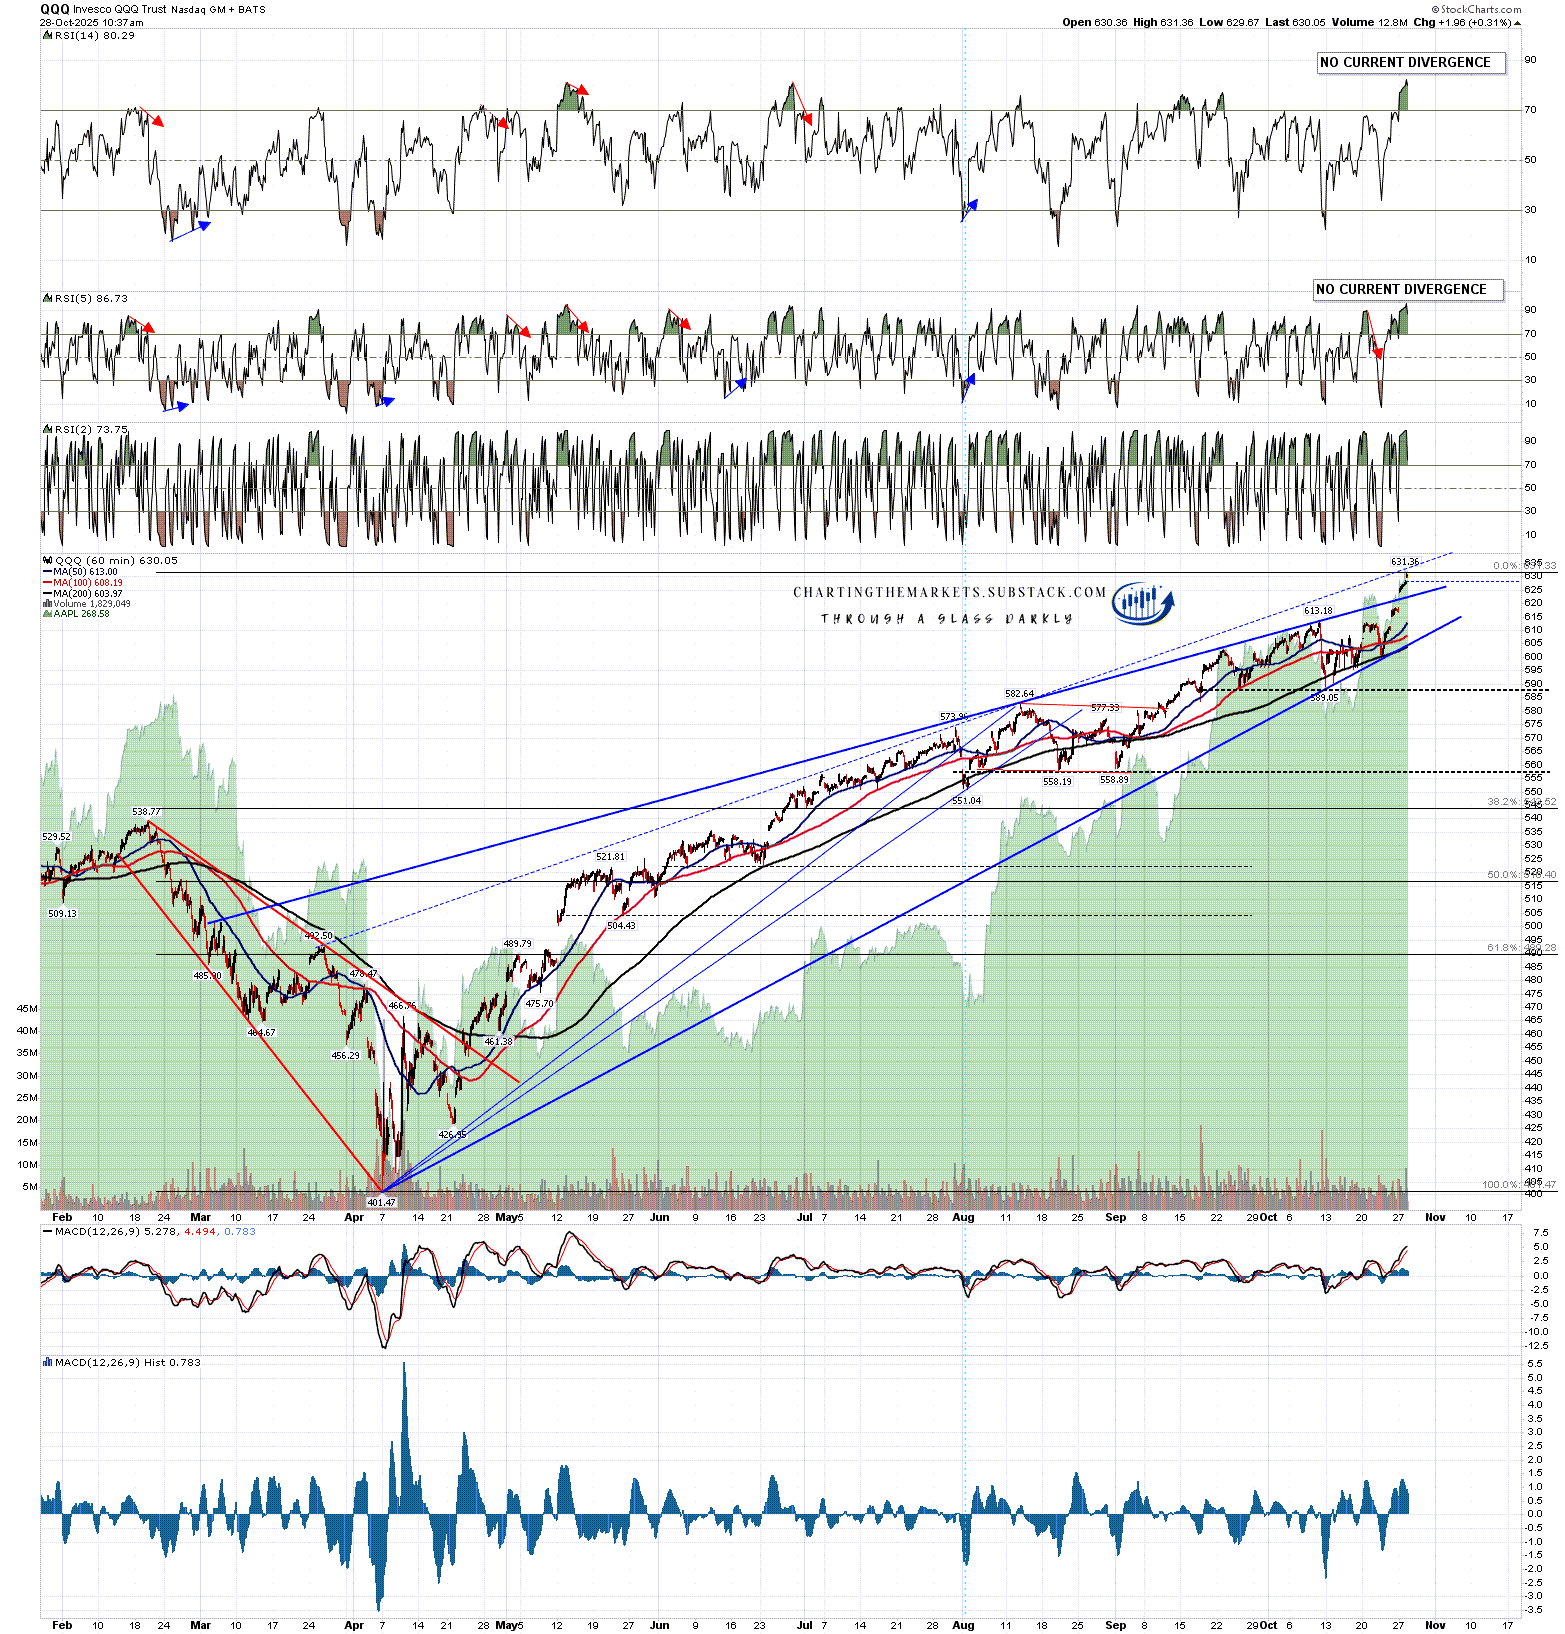
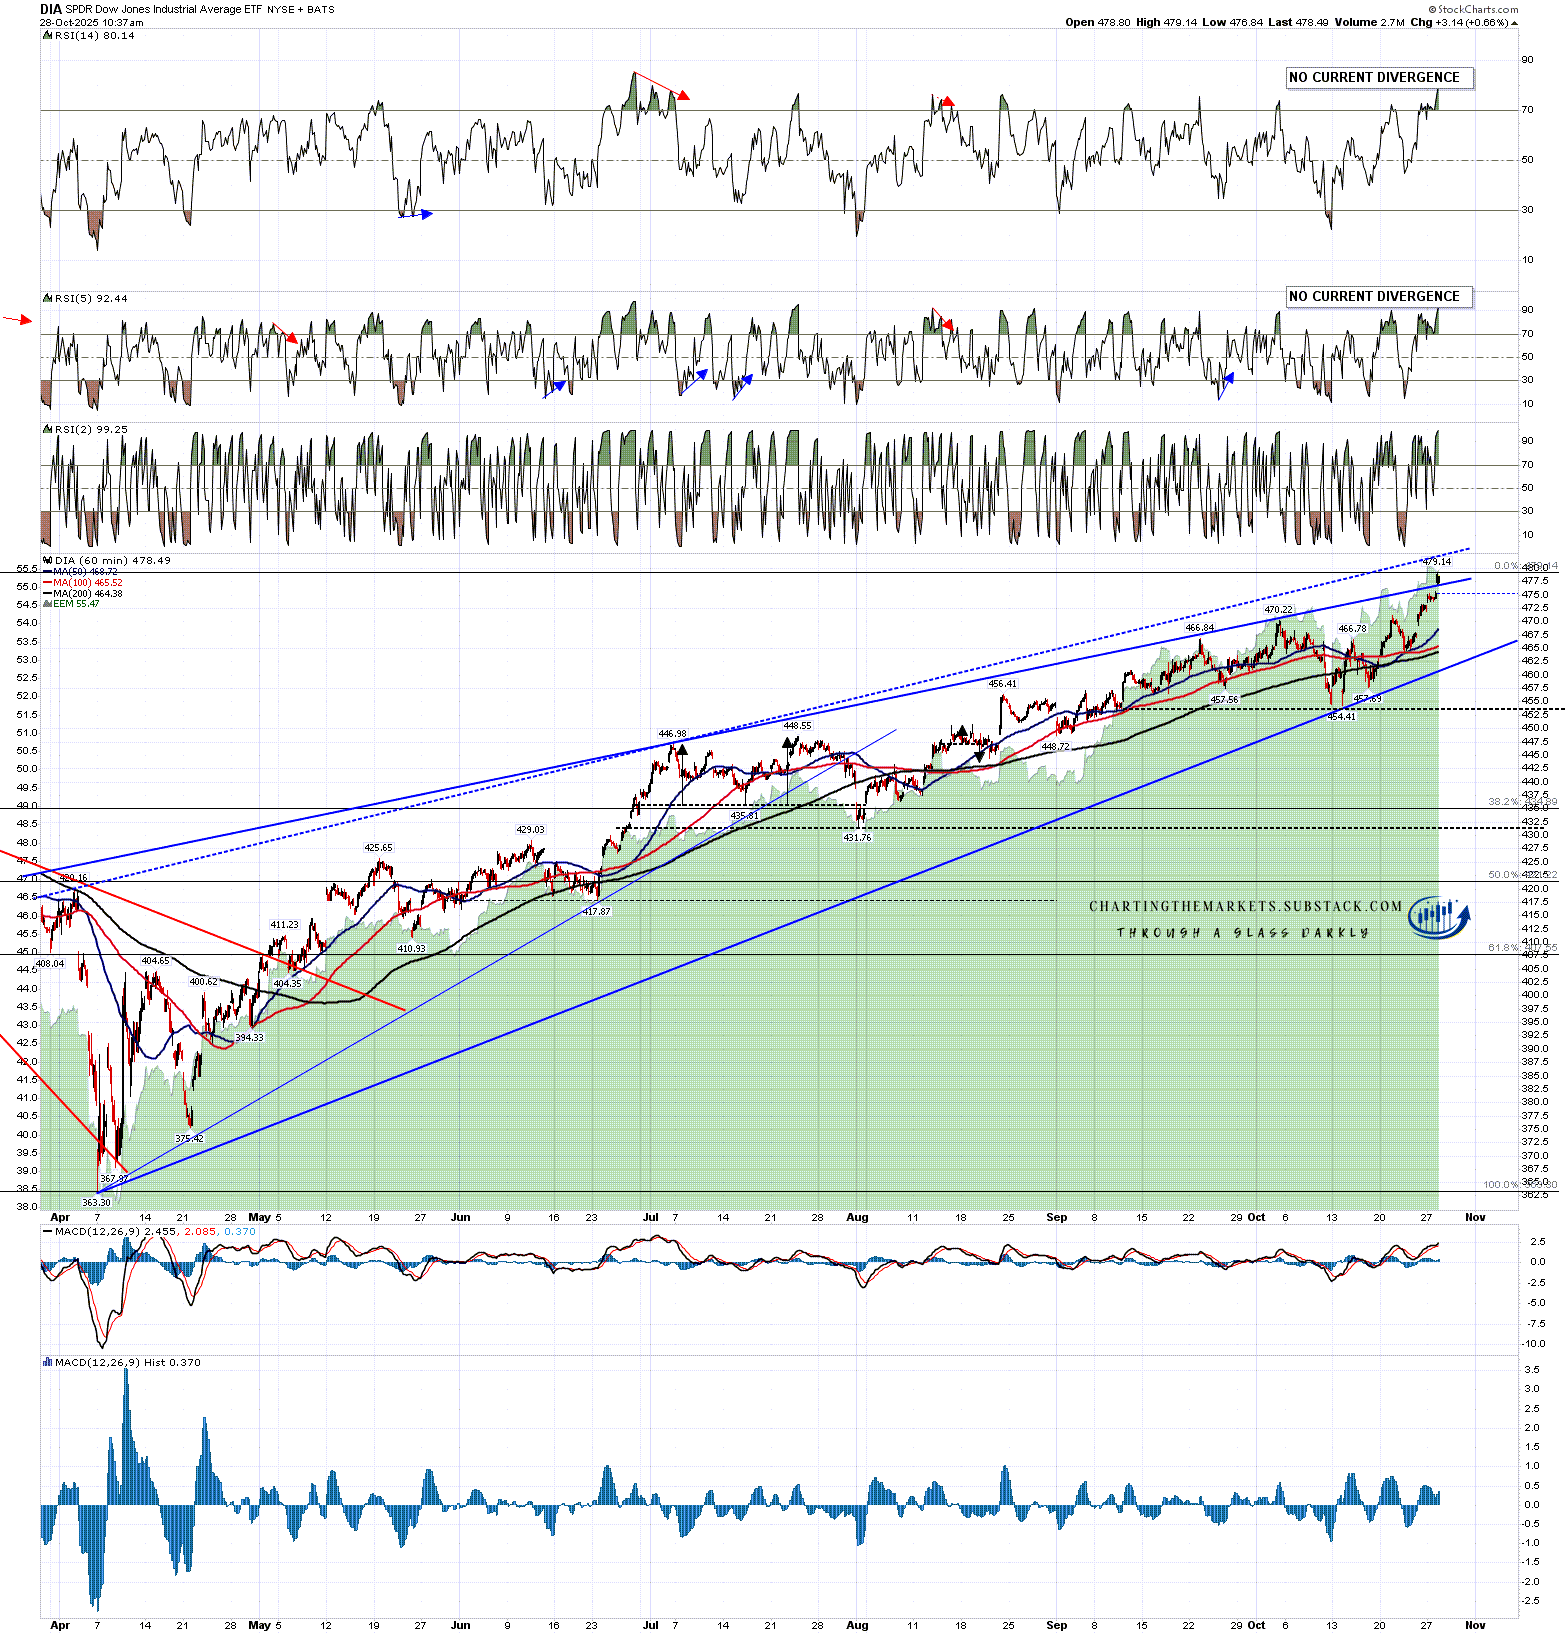
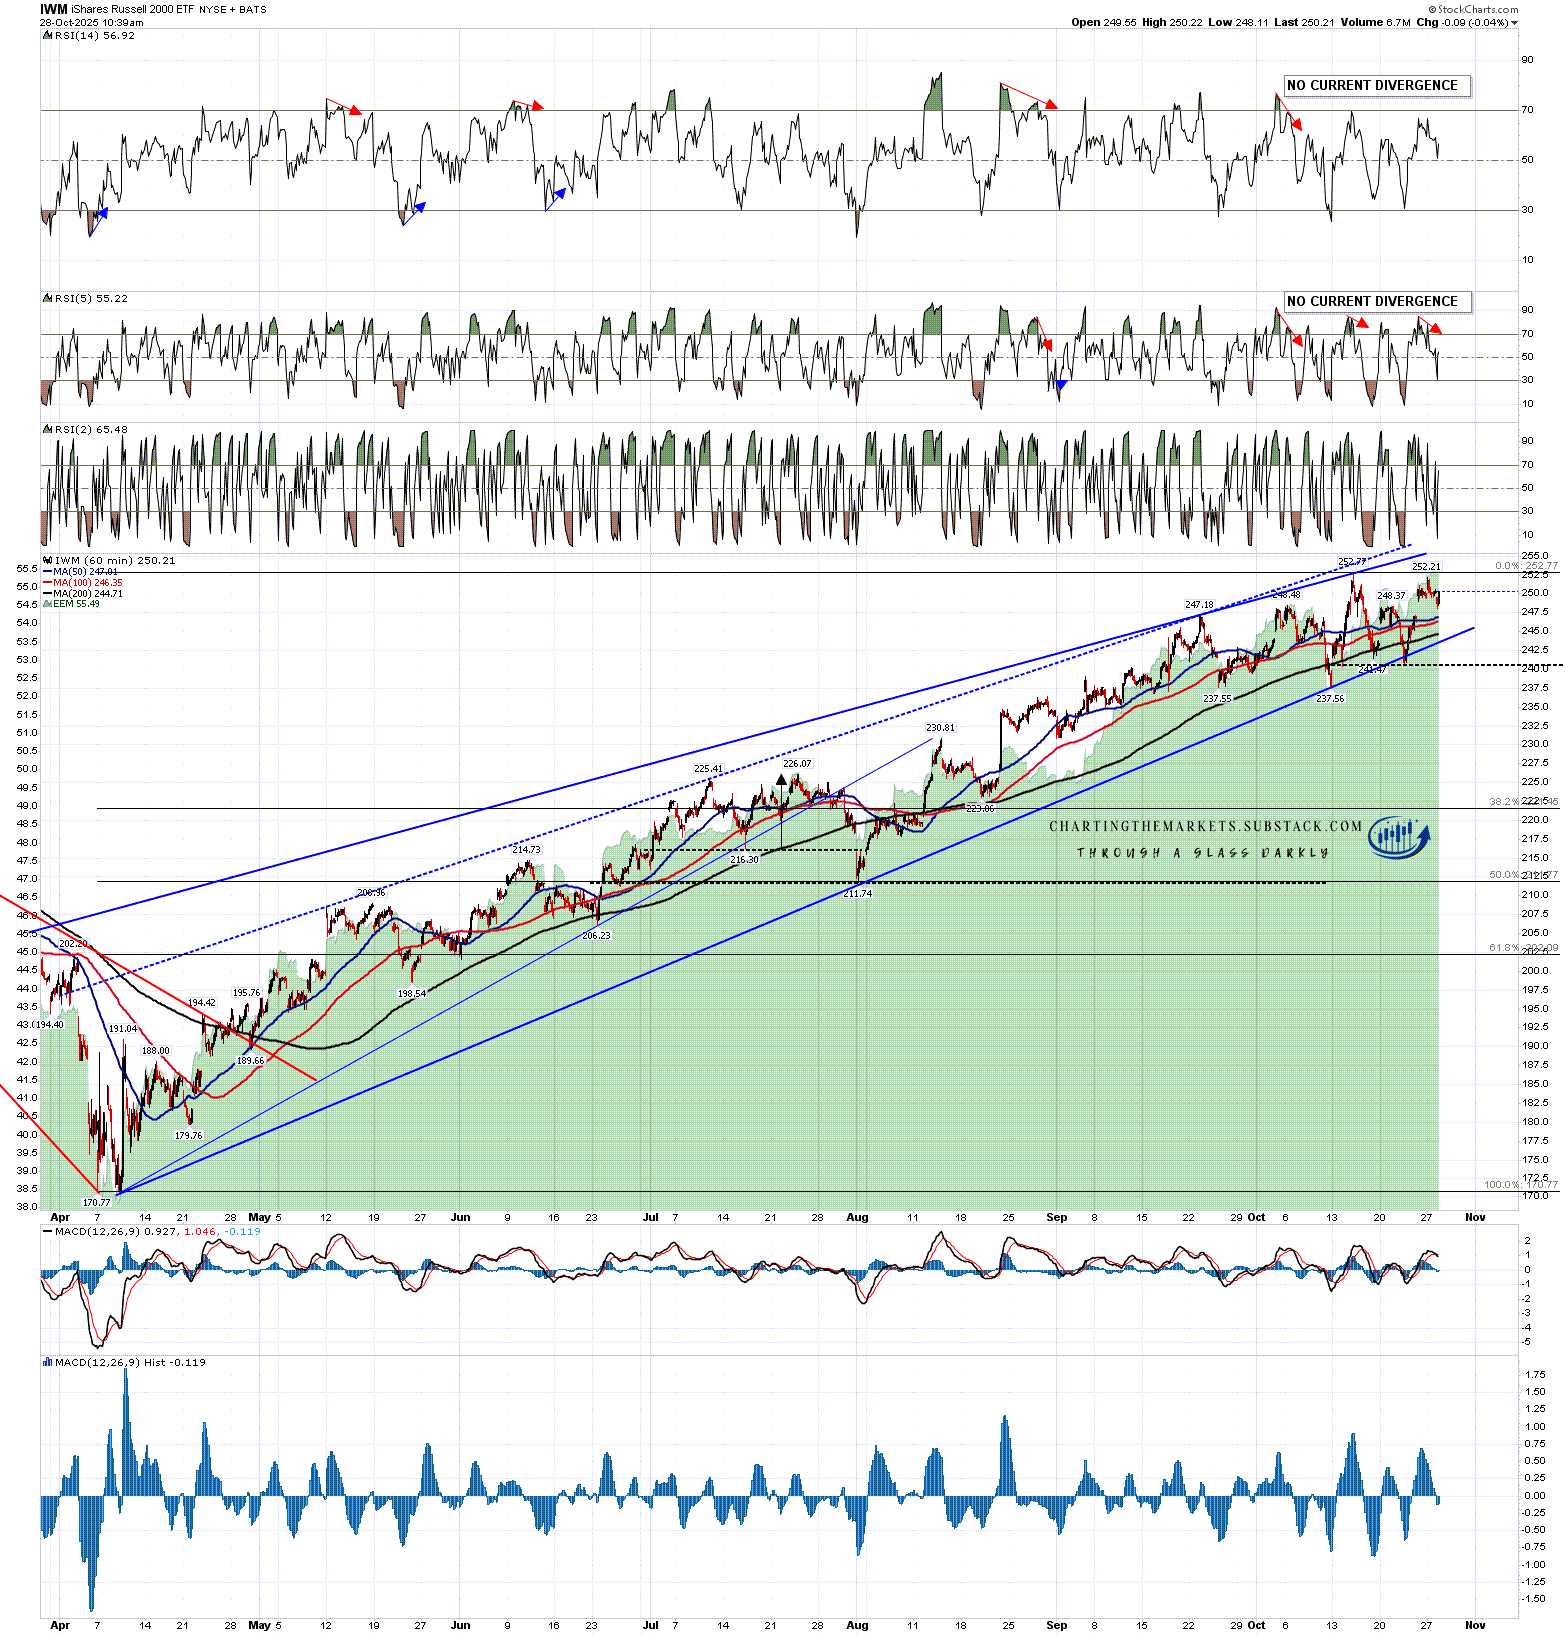
In my last post on 24th October I was looking at rising wedges on SPX, QQQ, DIA and IWM from the April lows and weighing the odds of these breaking down into a substantial retracement in the near future.

For SPX, QQQ and DIA I was looking at possible upside targets if they went higher, which they have, but not on IWM where I was just looking for a possible high retest, which we have not quite seen yet.

Looking at the rising wedge on SPX the rising wedge resistance has been hit, and I have redrawn the wedge support through the last low as this means that the wedge has expanded, and has therefore not yet broken down. The high at the time of writing is breaking slightly over the high quality rising wedge resistance and this may be a bearish overthrow.

As I mentioned in my last post, this move has eliminated the double top setup but may still be an H&S forming.

SPX 60min chart:

Looking at the rising wedge on QQQ the first rising wedge resistance I showed has been hit and broken, and I have redrawn the wedge support through the last low as this means that the wedge has expanded. The high at the time of writing could be a bearish overthrow.

I posted a possible alternate wedge resistance trendline and that is now in the 834/5 area and may be hit next. If so, that would become the main wedge resistance trendline.

This move has eliminated the double top setup but may still be an H&S forming.

QQQ 60min chart:

Looking at the rising wedge on DIA the first rising wedge resistance I showed has been hit and broken, and I have redrawn the wedge support through the last low as this means that the wedge has expanded. The high at the time of writing could be a bearish overthrow.

I also posted a possible alternate wedge resistance trendline on DIA and that is now in the 484 area and may be hit next. If so, that would become the main wedge resistance trendline.

This move has eliminated the double top setup but may still be an H&S forming.

DIA 60min chart:

Looking at the rising wedge on IWM I was wondering about a high retest there and we almost saw one yesterday, but not quite. That may still need a retest.

IWM 60min chart:

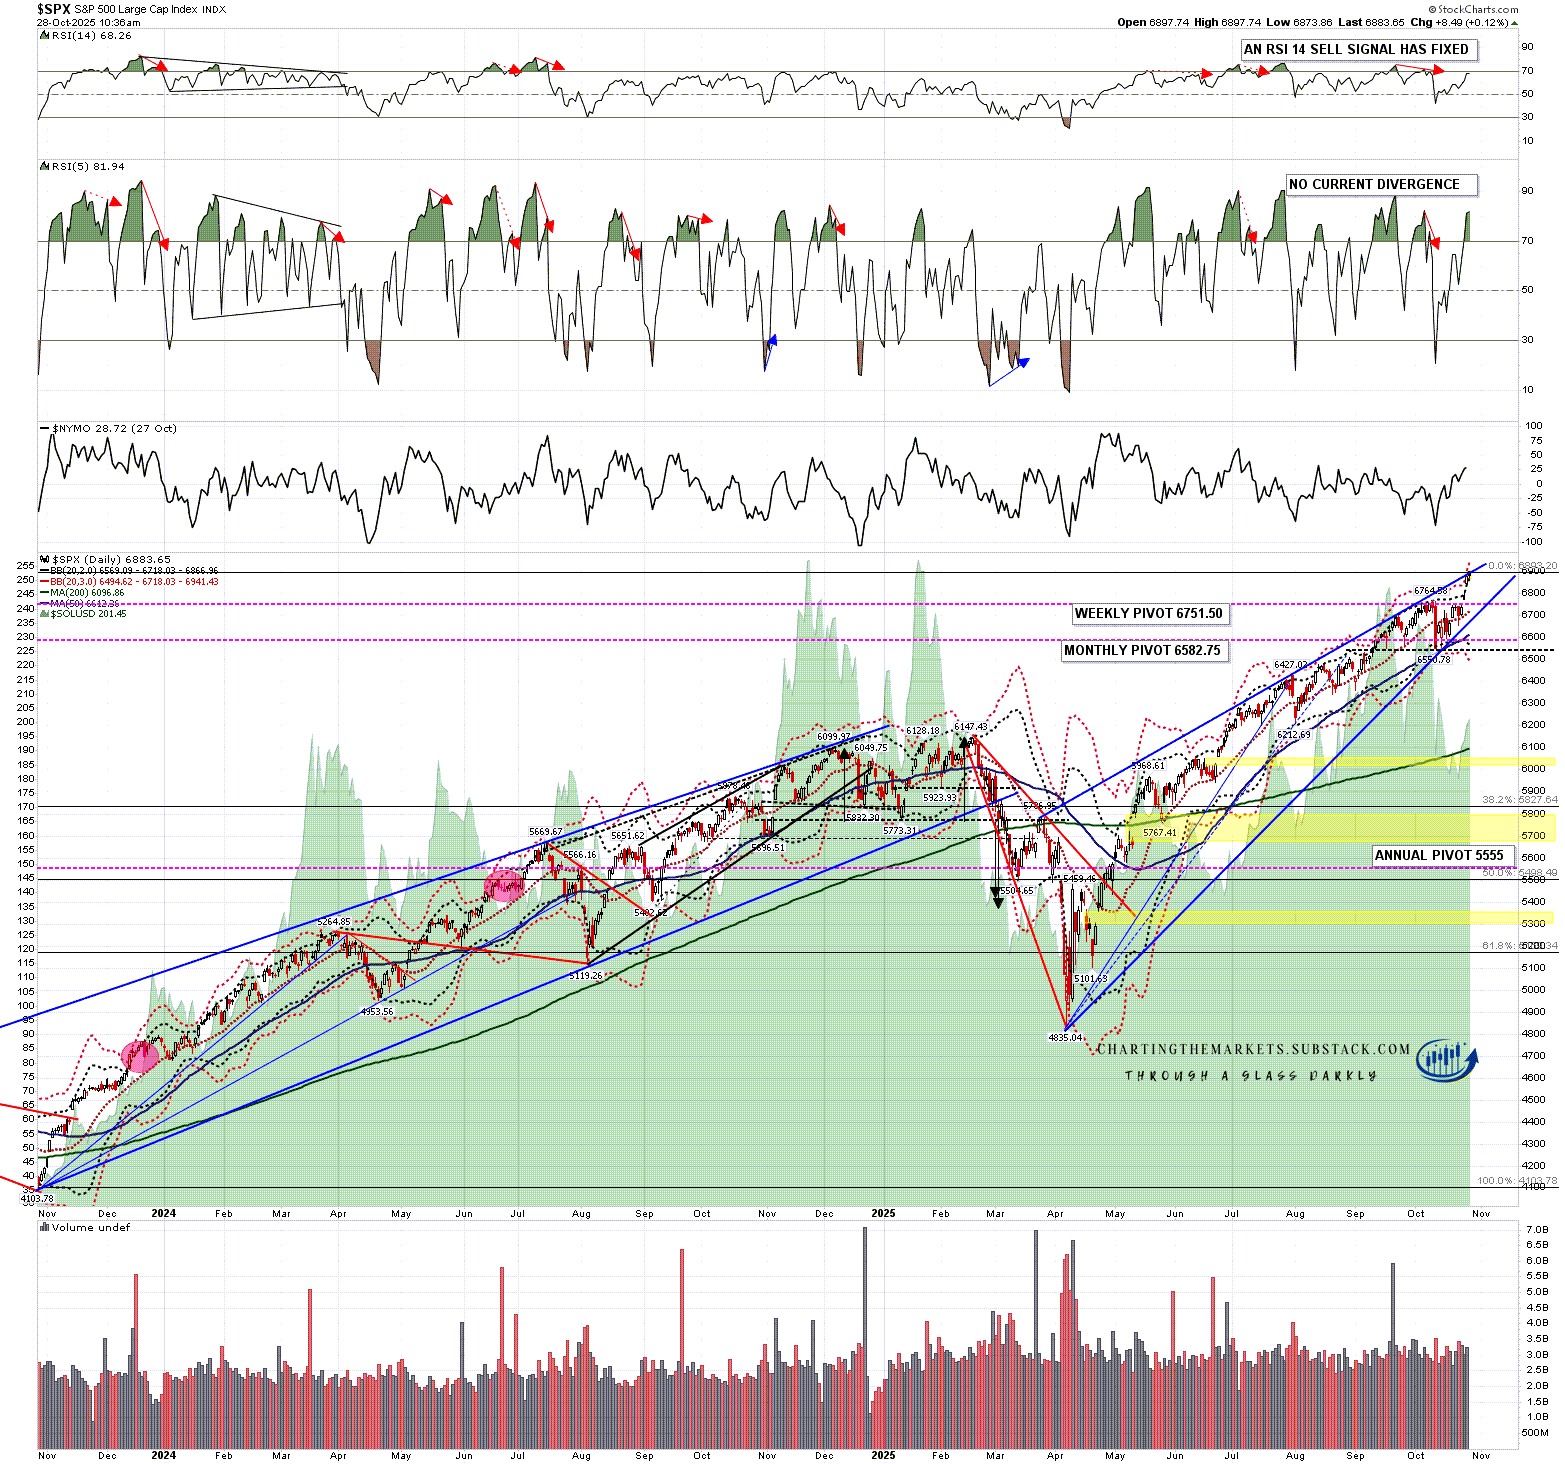
So how is this looking now? Well the first thing to say is that all of SPX, QQQ and DIA have hit wedge resistance trendlines and may be overthrowing those bearishly. All are looking very short term overbought on the hourly RSIs.

On the SPX, QQQ and DIA daily charts they have also all hit or come very close to their 3sd upper bands this week, so we would usually see a period of consolidation or retracement over the next few days.

SPX daily chart:

I’m expecting to see at least some retracement or consolidation from this area. There is a case for a bit higher short term on QQQ, DIA and IWM, but after that at least a period of consolidation looks likely. In the short term I’m seeing hourly sell signals fixed or brewing on ES, NQ and YM that are generally a reliable signal of a short term high forming. There is also a historically bearish leaning day tomorrow.

Against a more substantial retracement here we have no current reversal patterns on SPX, QQQ and DIA, though H&S patterns may be forming. There are no current hourly RSI 14 or daily RSI 5 sell signals fixed or brewing on any of these four RTH indices.

We are now also almost through October, with only three full trading days left. There are good reasons to see a significant decline in November, the ongoing government shutdown, possible failure of trade negotiation with China, or the generally fragile state of the US economy, but November and December are still historically two of the most bullish months of the year, and all year I’ve been looking for a significant high on both equities and Crypto being made in or close to December.

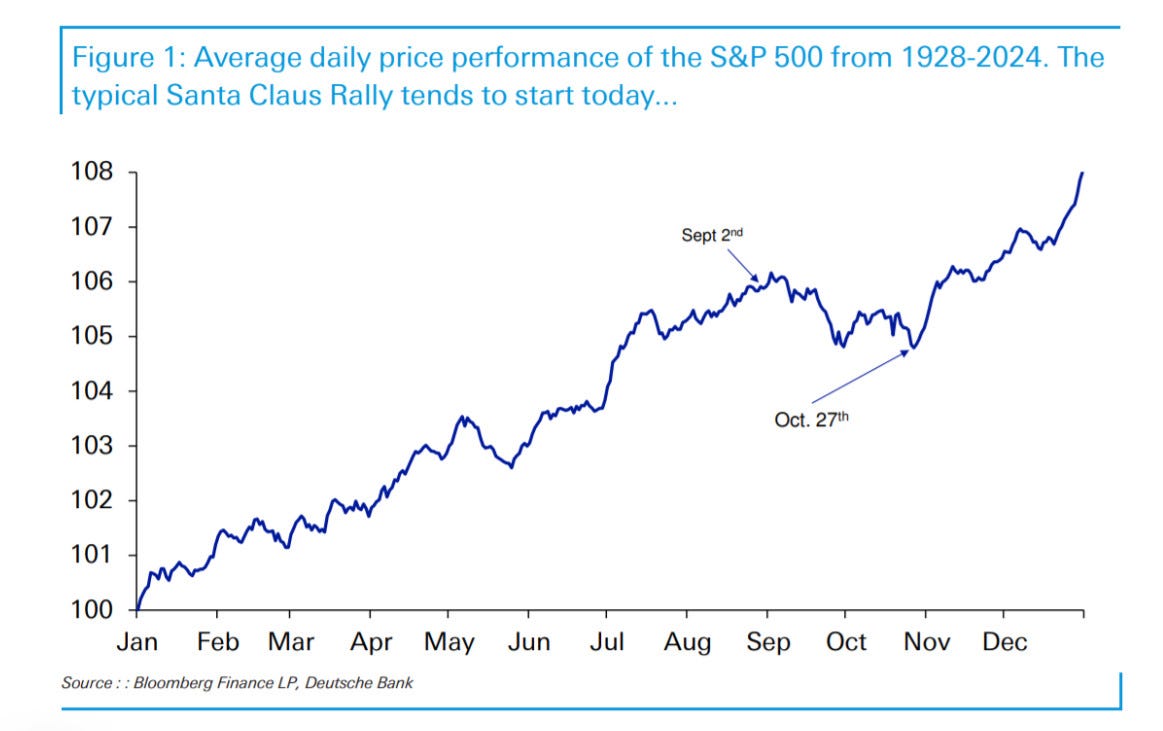
The chart below shows the average daily price performance of the S&P 500 from 1928-2024. The average Santa rally starts on 27th October and over that period the average rise into the end of the year has been over 3%:

If we are seeing a break higher here then we would need to see some sustained breaks over the wedge resistance trendlines from the April lows, but that seems unlikely to start from here, and I am doubtful about that happening at all. These are high quality patterns and they have not delivered any meaningful retracement yet. We might instead see a slower move that just expands these wedges to the upside somewhat instead, though the higher probability resistance trendlines for these are the ones we have been testing here. Higher trendlines beyond would be harder to identify. At minimum we should see some consolidation from the current area.

The historical stats for the rest of this week are bearish on Wednesday, bullish on Thursday and neutral on Friday. For next week, the first trading week of November, Monday through Friday all lean bullish with the exception of Wednesday. There is only one bearish leaning day in November and only two in December, one of which is the last trading day of 2025.

If you like my analysis and would like to see more, please take a free subscription at my chartingthemarkets substack, where I publish these posts first. I also do a premarket video every day on equity indices, bonds, currencies, energies, precious commodities and other commodities at 8.45am EST, but only for paying subscribers. Other places to find me are my twitter, and my Youtube channel.