Equity indices have been chopping around in recent days, and the action seems to be getting less interesting by the day. Overall this looks like a bullish consolidation, with SPY, QQQ holding above their daily middle bands, IWM trying to break back over the daily middle band, and only DIA holding below the middle band there.
There is a lot of talk about a possible larger decline brewing, and with Vix in the 18 area, and a lot of uncertainty about the presidential election, currently too close to call, as well as a couple of ongoing wars, there is certainly enough potential news around that could help a decent retracement along.
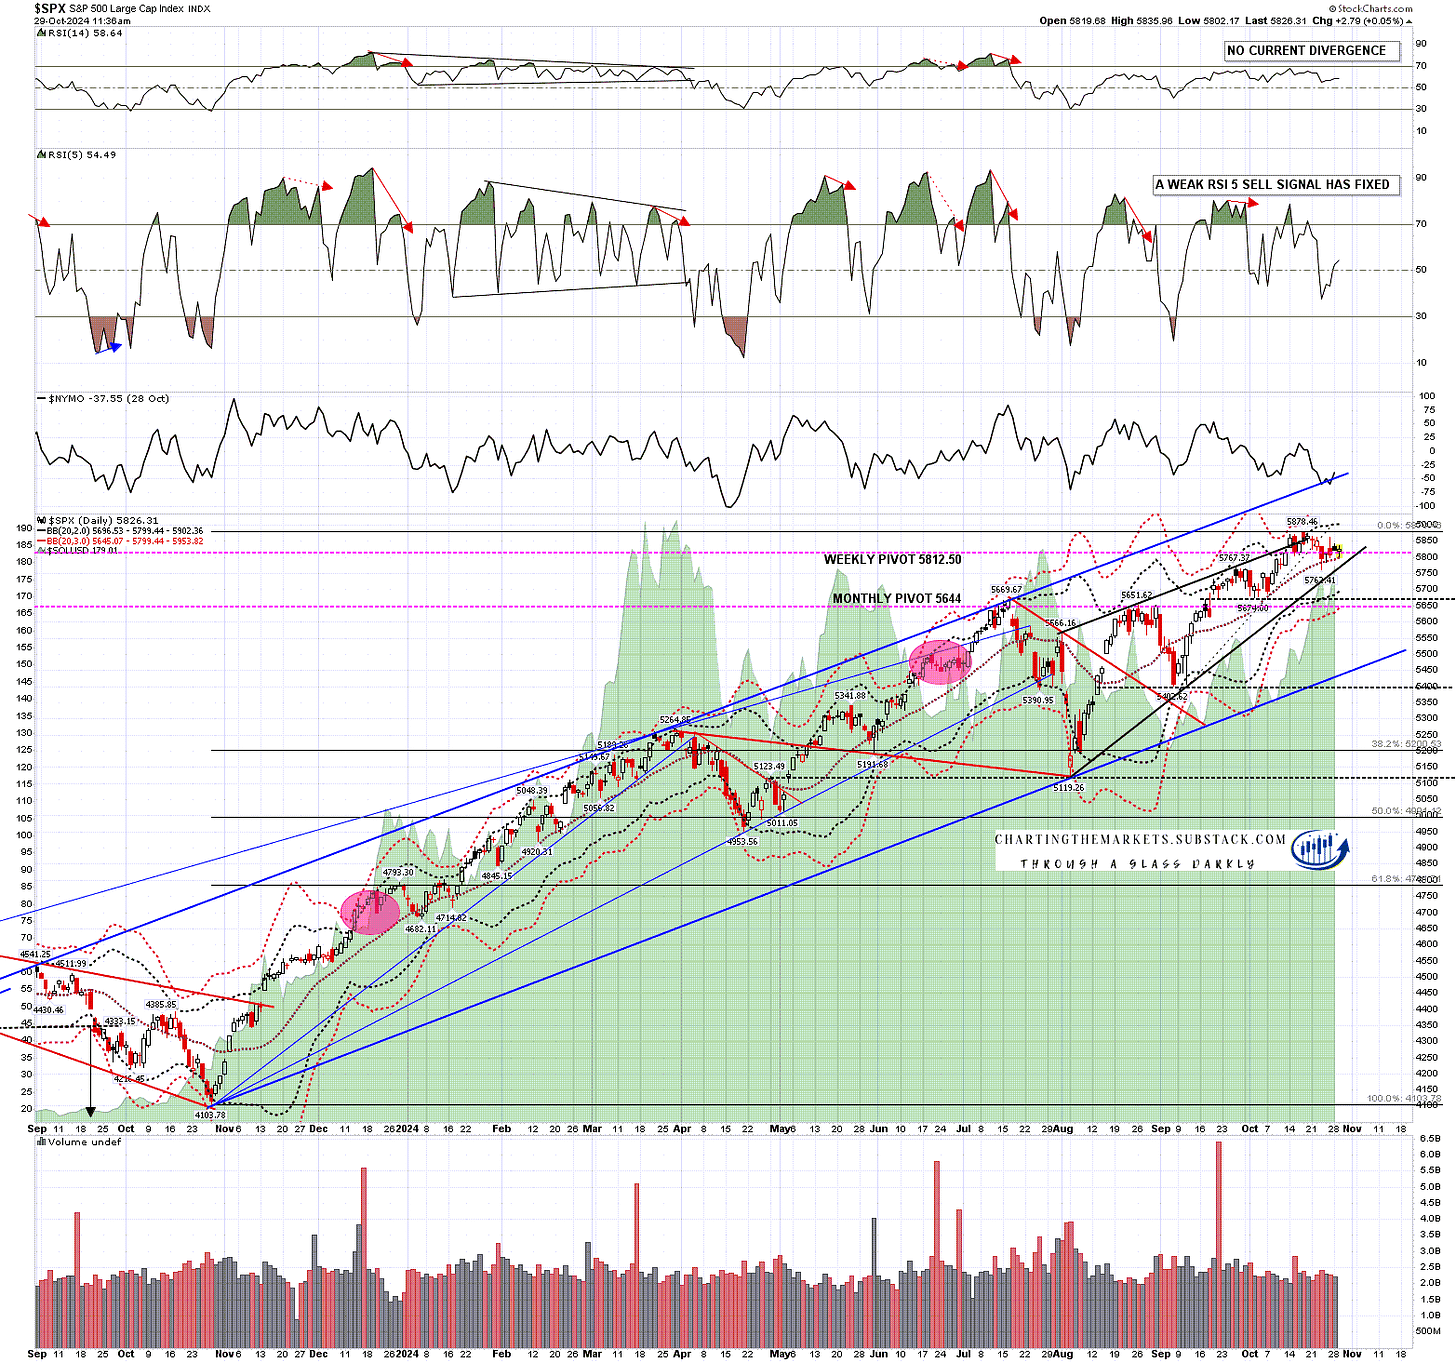
I’d obviously expect to see a retest of the recent high on SPX which would set up a modest double top setup. If that was to play out then SPX could test and potentially form a right shoulder near the possible H&S neckline in the 5674 area. That could create a larger H&S pattern that could then look for the 5400-25 area. There are other possible H&S necklines further down in the 5402 and 5119 areas that could set up even larger H&S reversal patterns. There is a similar sort of setup on Dow/DIA, with potential H&S necklines in the 417.5, 399.5, 383 & 373 areas. No current option for any large double top on either.
SPX daily chart:
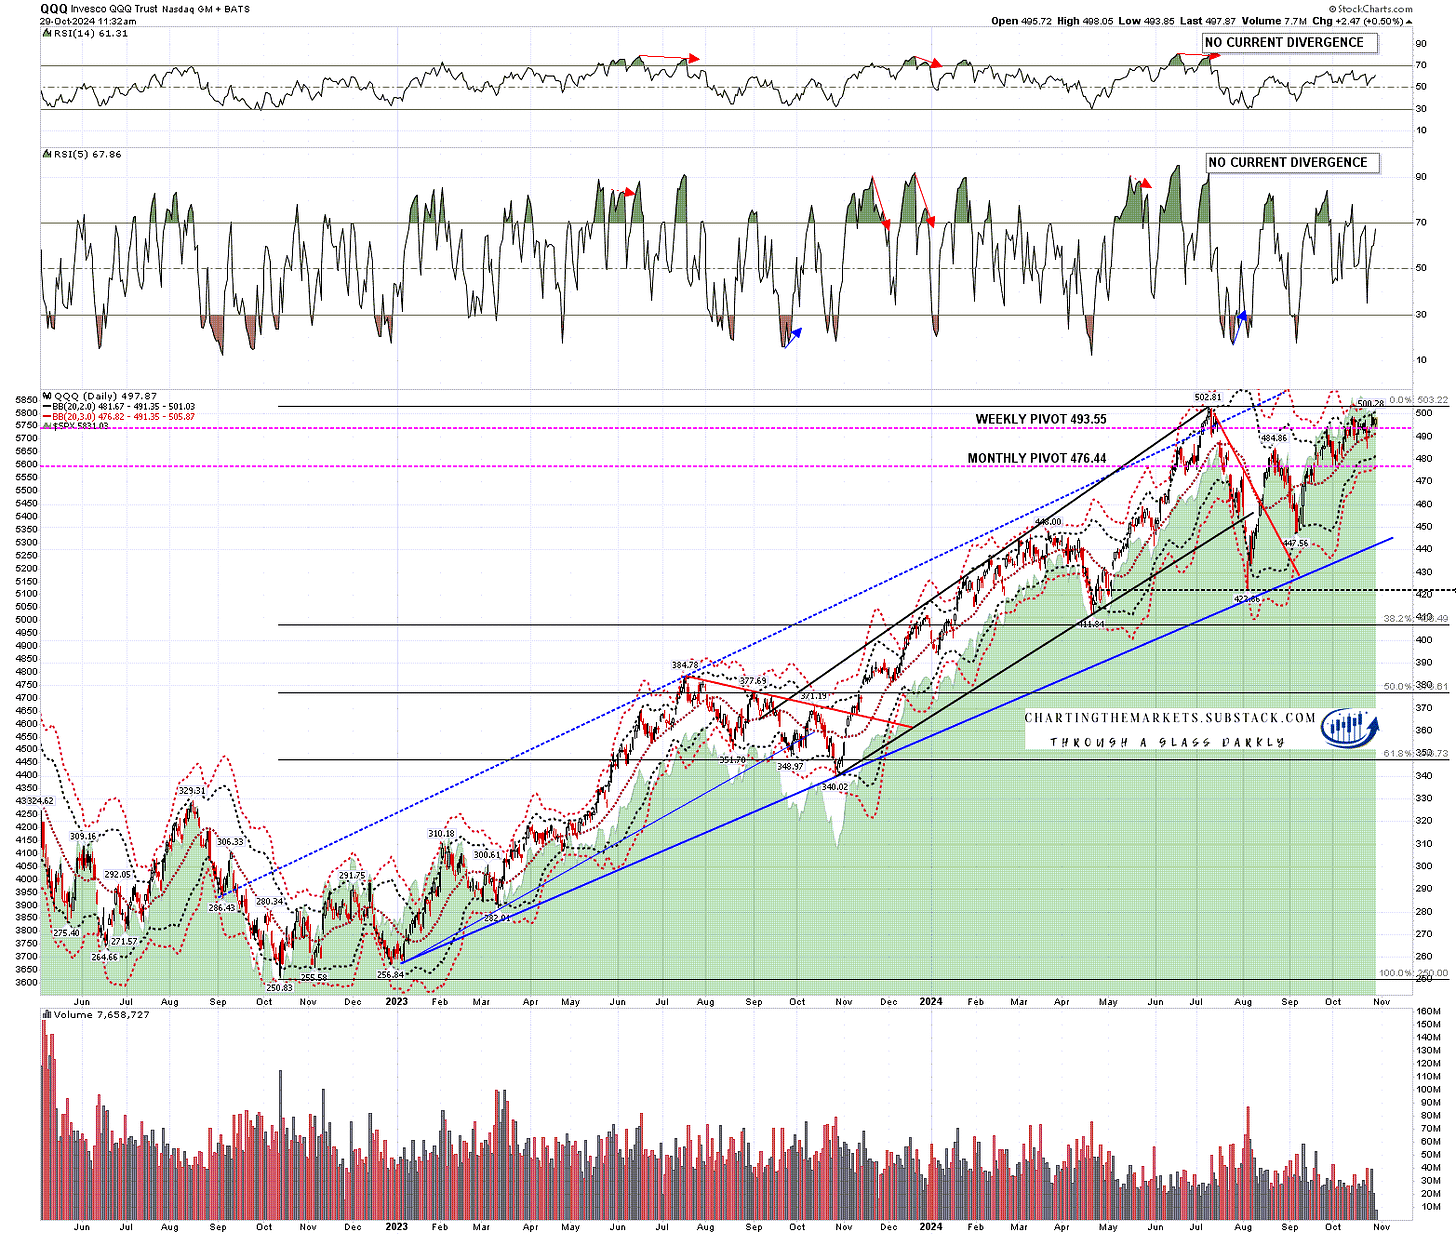
The path to a decent topping pattern would be a lot shorter on QQQ & IWM. A retest of the ATH on QQQ at 502.81 could make the second high on a possible much larger double top setup that on a subsequent sustained break below double top support at 422.86 could look for a target in the 345 area, a more than 50% retracement of the move up from the October 2022 low.
QQQ daily chart:
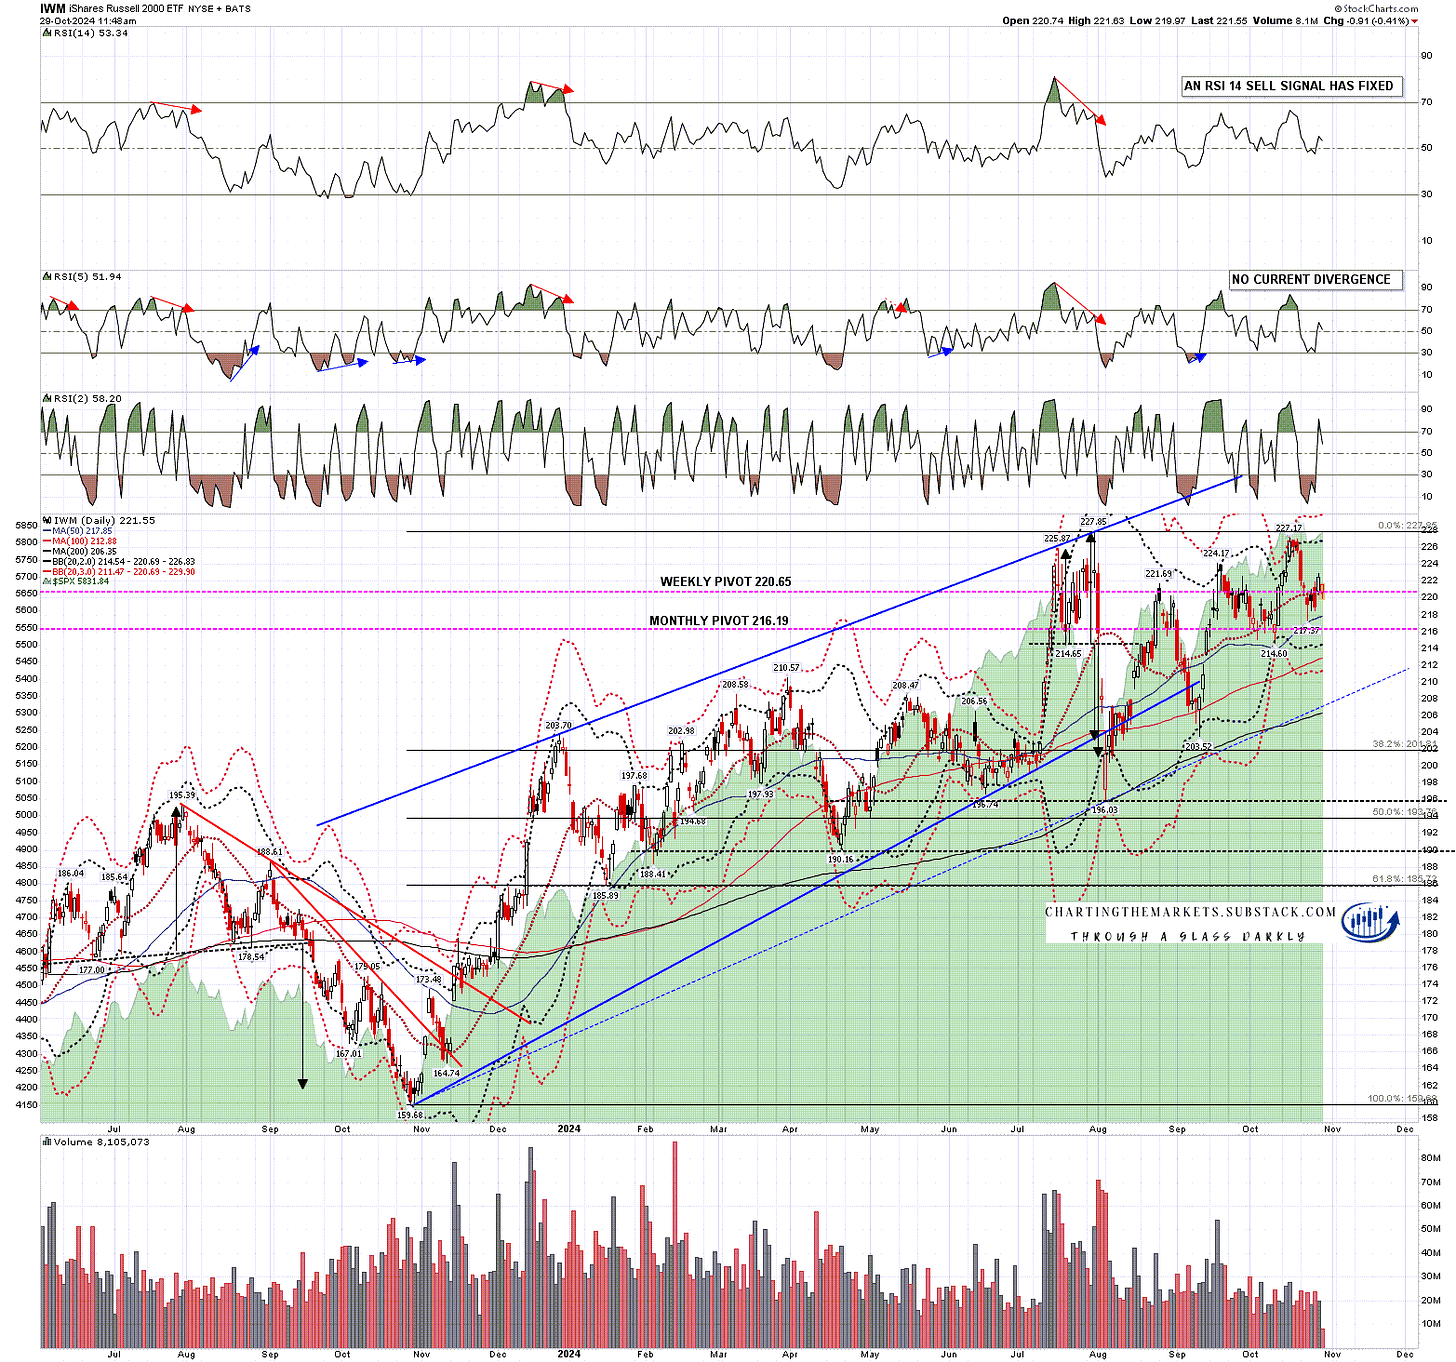
A retest of the 2024 high on IWM at 227.85 could make the second high on a possible much larger double top setup that on a subsequent sustained break below double top support at 196.03 could look for a target in the 164 area, close to a full retracement of the move up from the October 2023 low.
At this stage this would be pure speculation, and the sell signal support for a big decline here is thin, but there is some potential here after a modest move higher.
IWM daily chart:
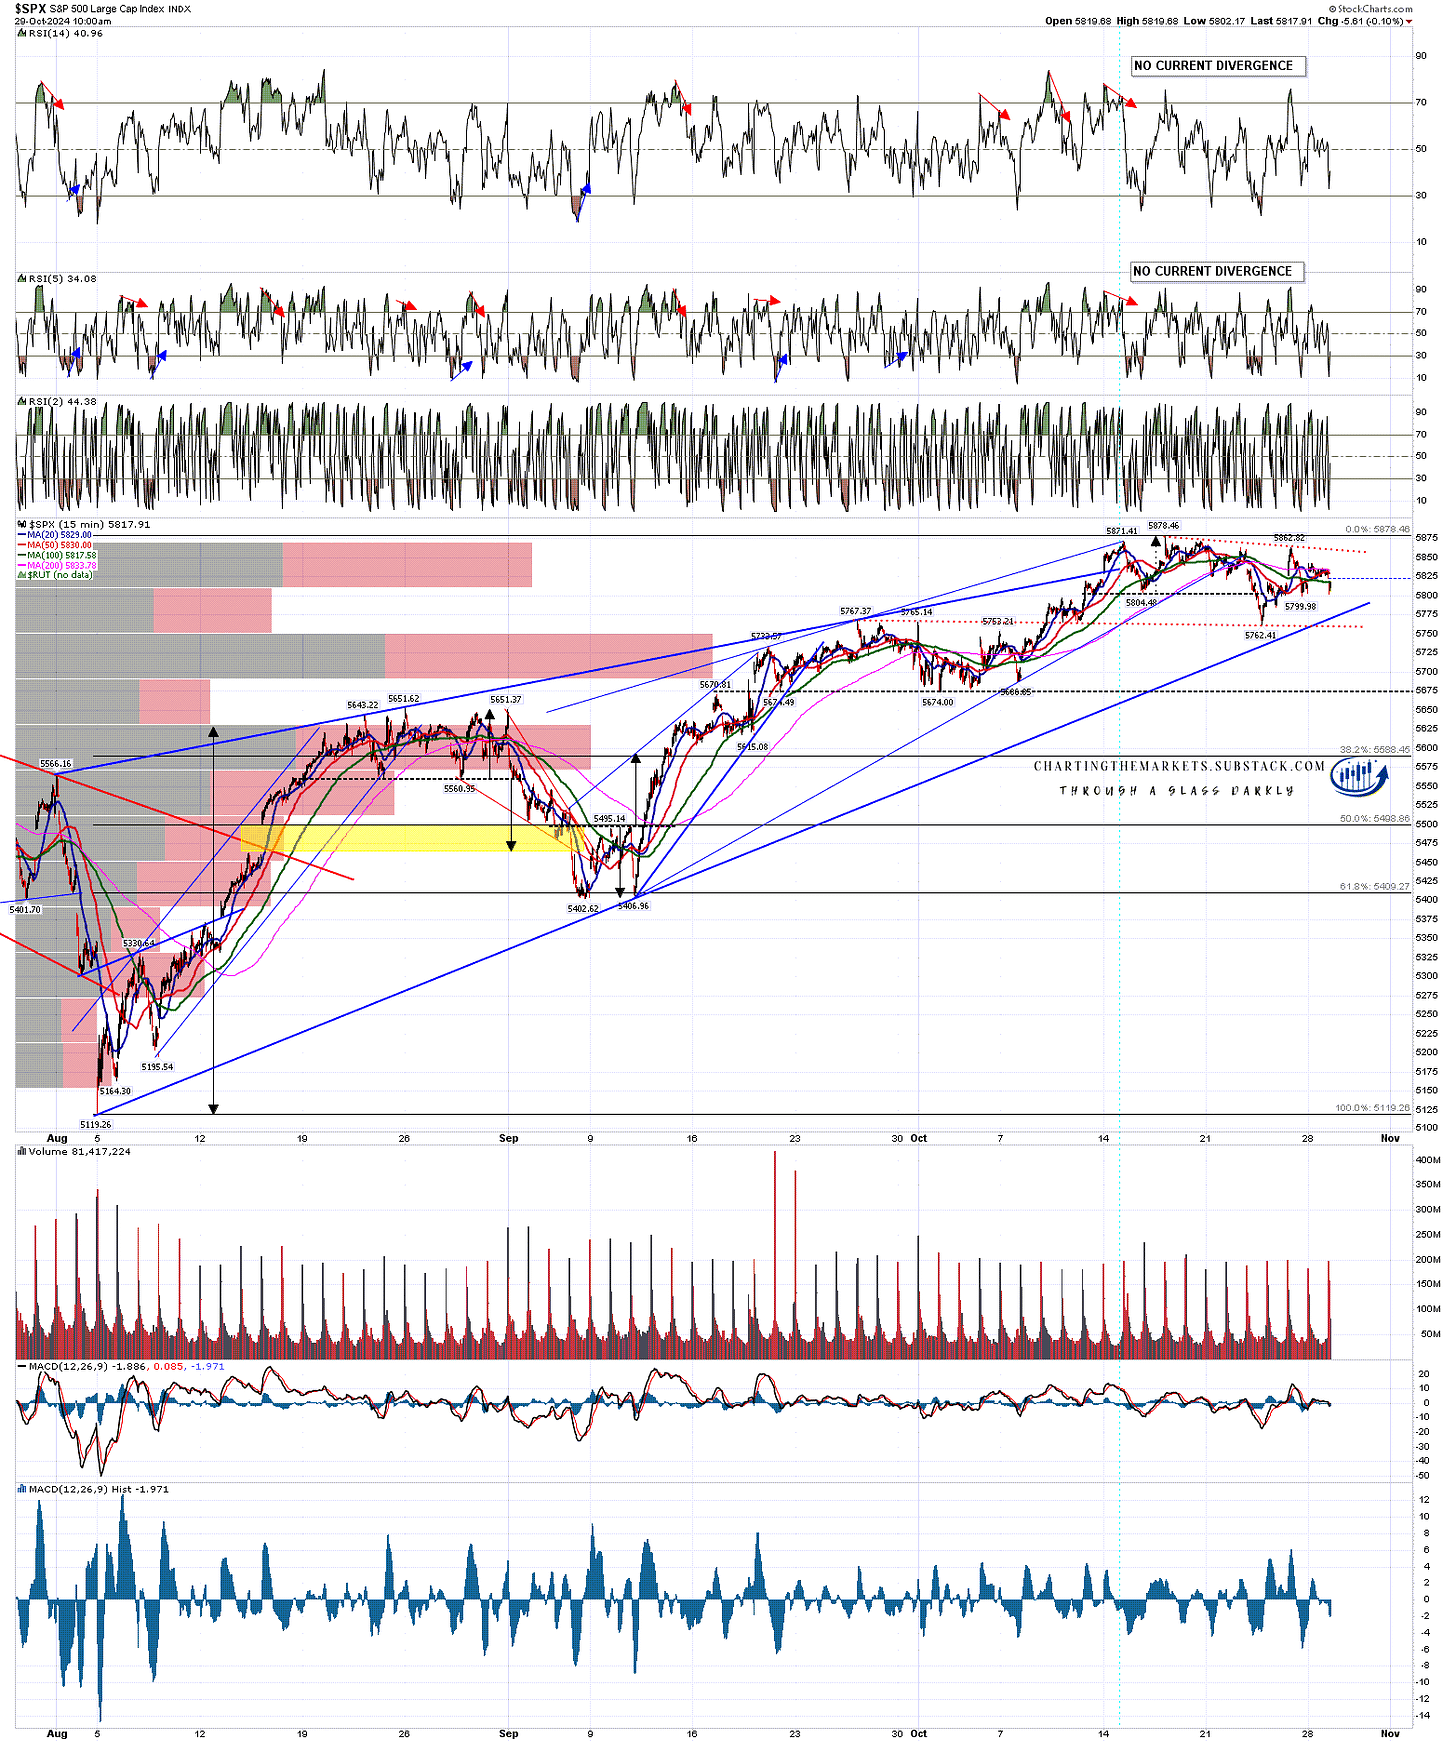
In the short term these look like bull flags forming on SPX and DIA particularly. On SPX I have drawn in an ideal flag support trendline in the 5760 area that could get a hit, with rising support from the August 2024 currently slightly higher in the 5775 area. That could be a good level for a high retest to start from.
SPX 15min chart:
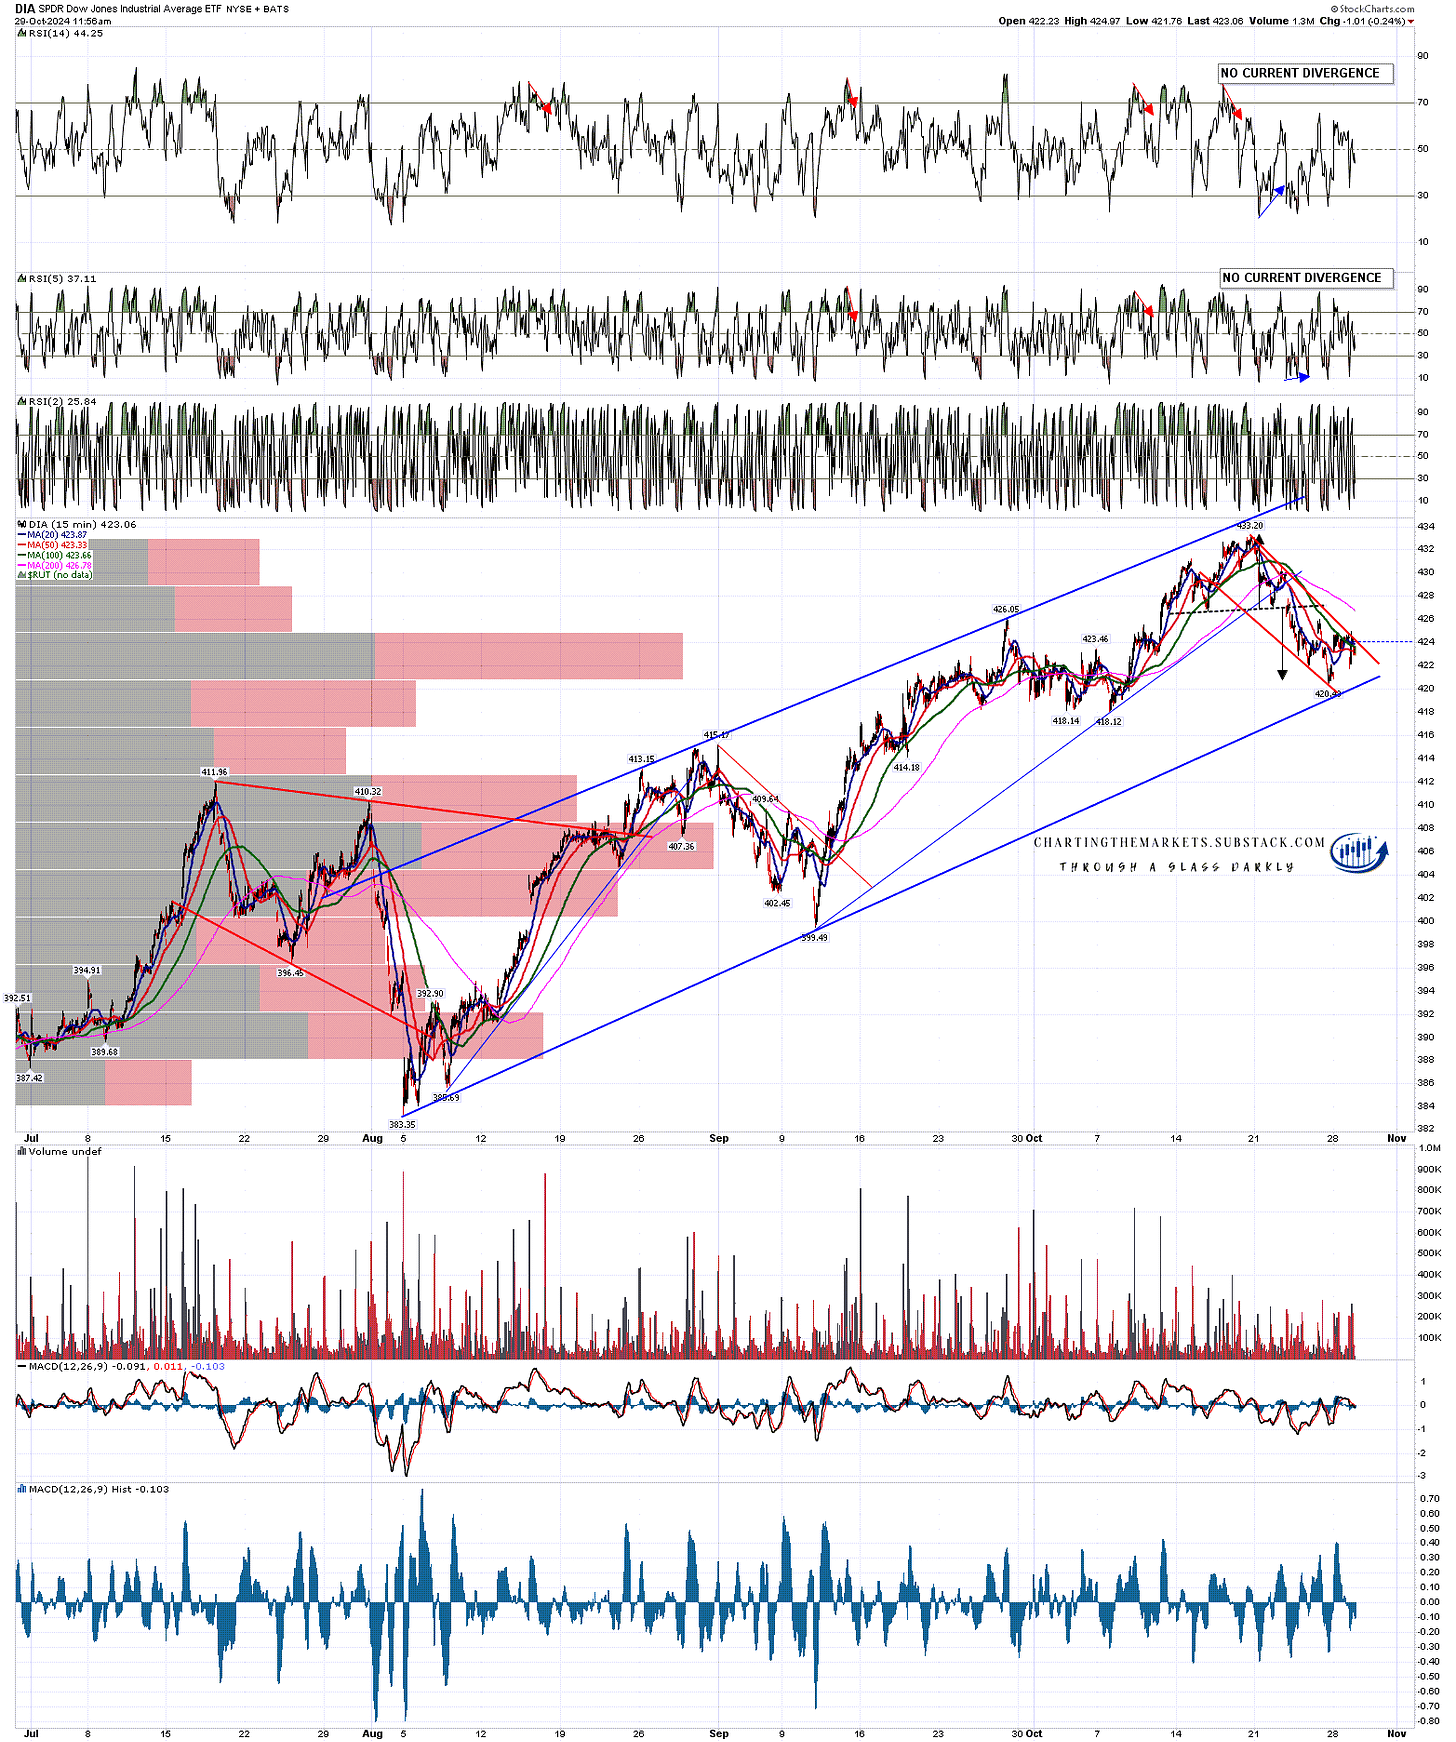
On DIA there was a small H&S that reached target last Friday, and a high quality falling wedge that could be a bull flag and has been showing some signs of breaking up today. If we see a break up and then a retest of the current low at 420.42 then that might both tag the rising support trendline from the August low and set up a small double bottom to set up a retest of the all time high at 433.20.
DIA 15min chart:
Whatever happens I’d be looking for at minimum a bit more upside to set up a larger move down, but I’d note that both the topping setup and the seasonality for a big decline were both better a few weeks ago than anything we are likely to see form here.
November and December both lean bullish historically and in the last 68 years, there are only five days in November that have historically closed green less than 50% of the time, and all five averaged over 49% green. December is a little more bearish with six days that have closed green less than 50% of the time, and a better spread of bearish probability down to only 42% on Friday the 13th of December, but that isn’t much to support a bear move into the end of the year. We'll see.
If you like my analysis and would like to see more, please take a free subscription at my chartingthemarkets substack, where I publish these posts first and do a short premarket review every morning.

No comments:
Post a Comment