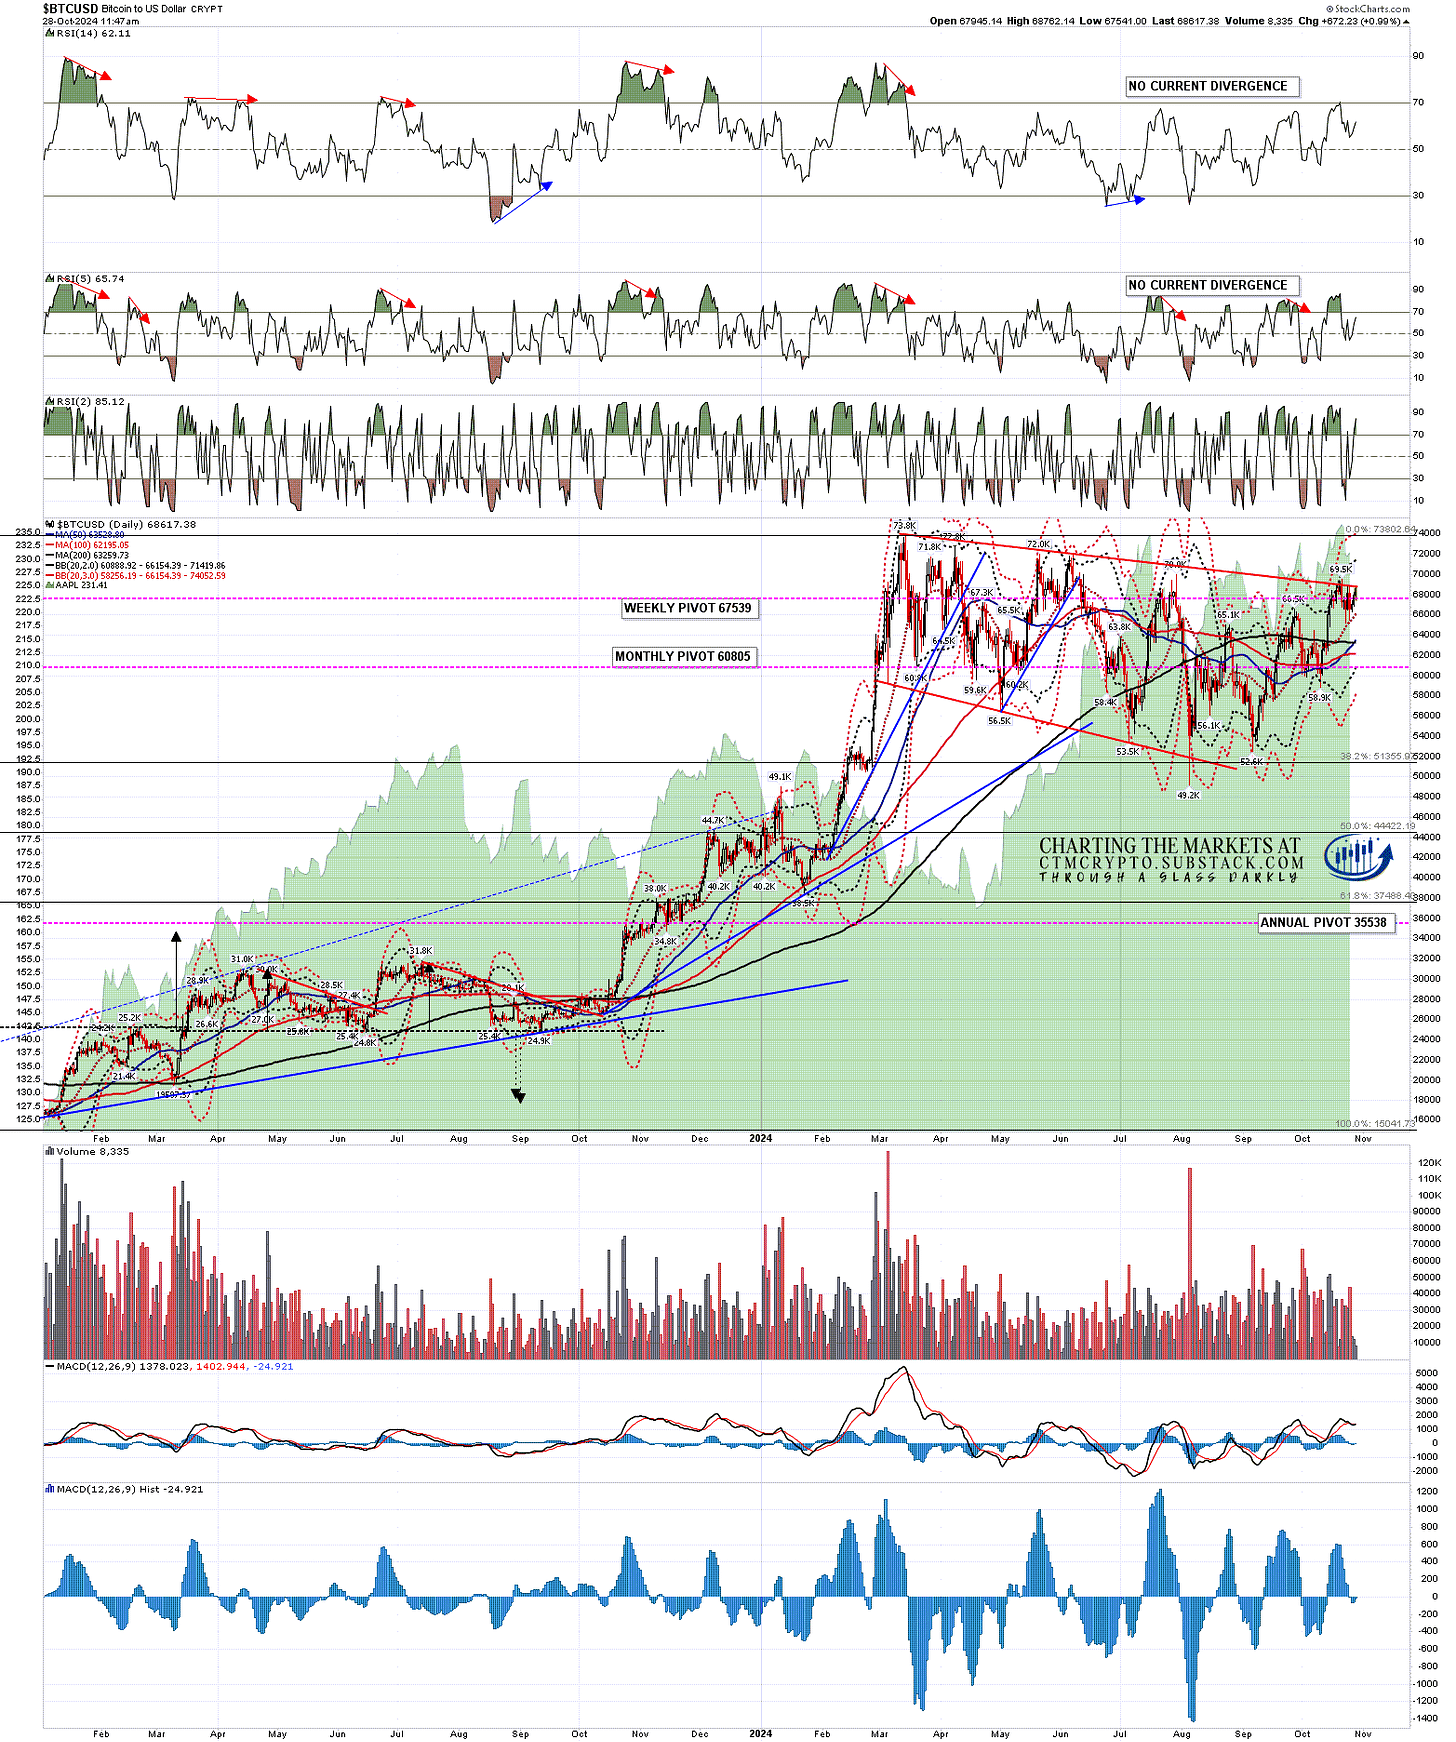
After my post on Thursday there was a modest retracement on Crypto but there was no technical damage on Bitcoin (BTCUSD). That held the daily middle band perfectly on the last backtest and the obvious next target is a retest of the last high at 69.5k.
If Bitcoin continues higher from there, the larger bull flag that has broken up has a target at a retest of the all time high at 73,802.641.
BTCUSD daily chart:
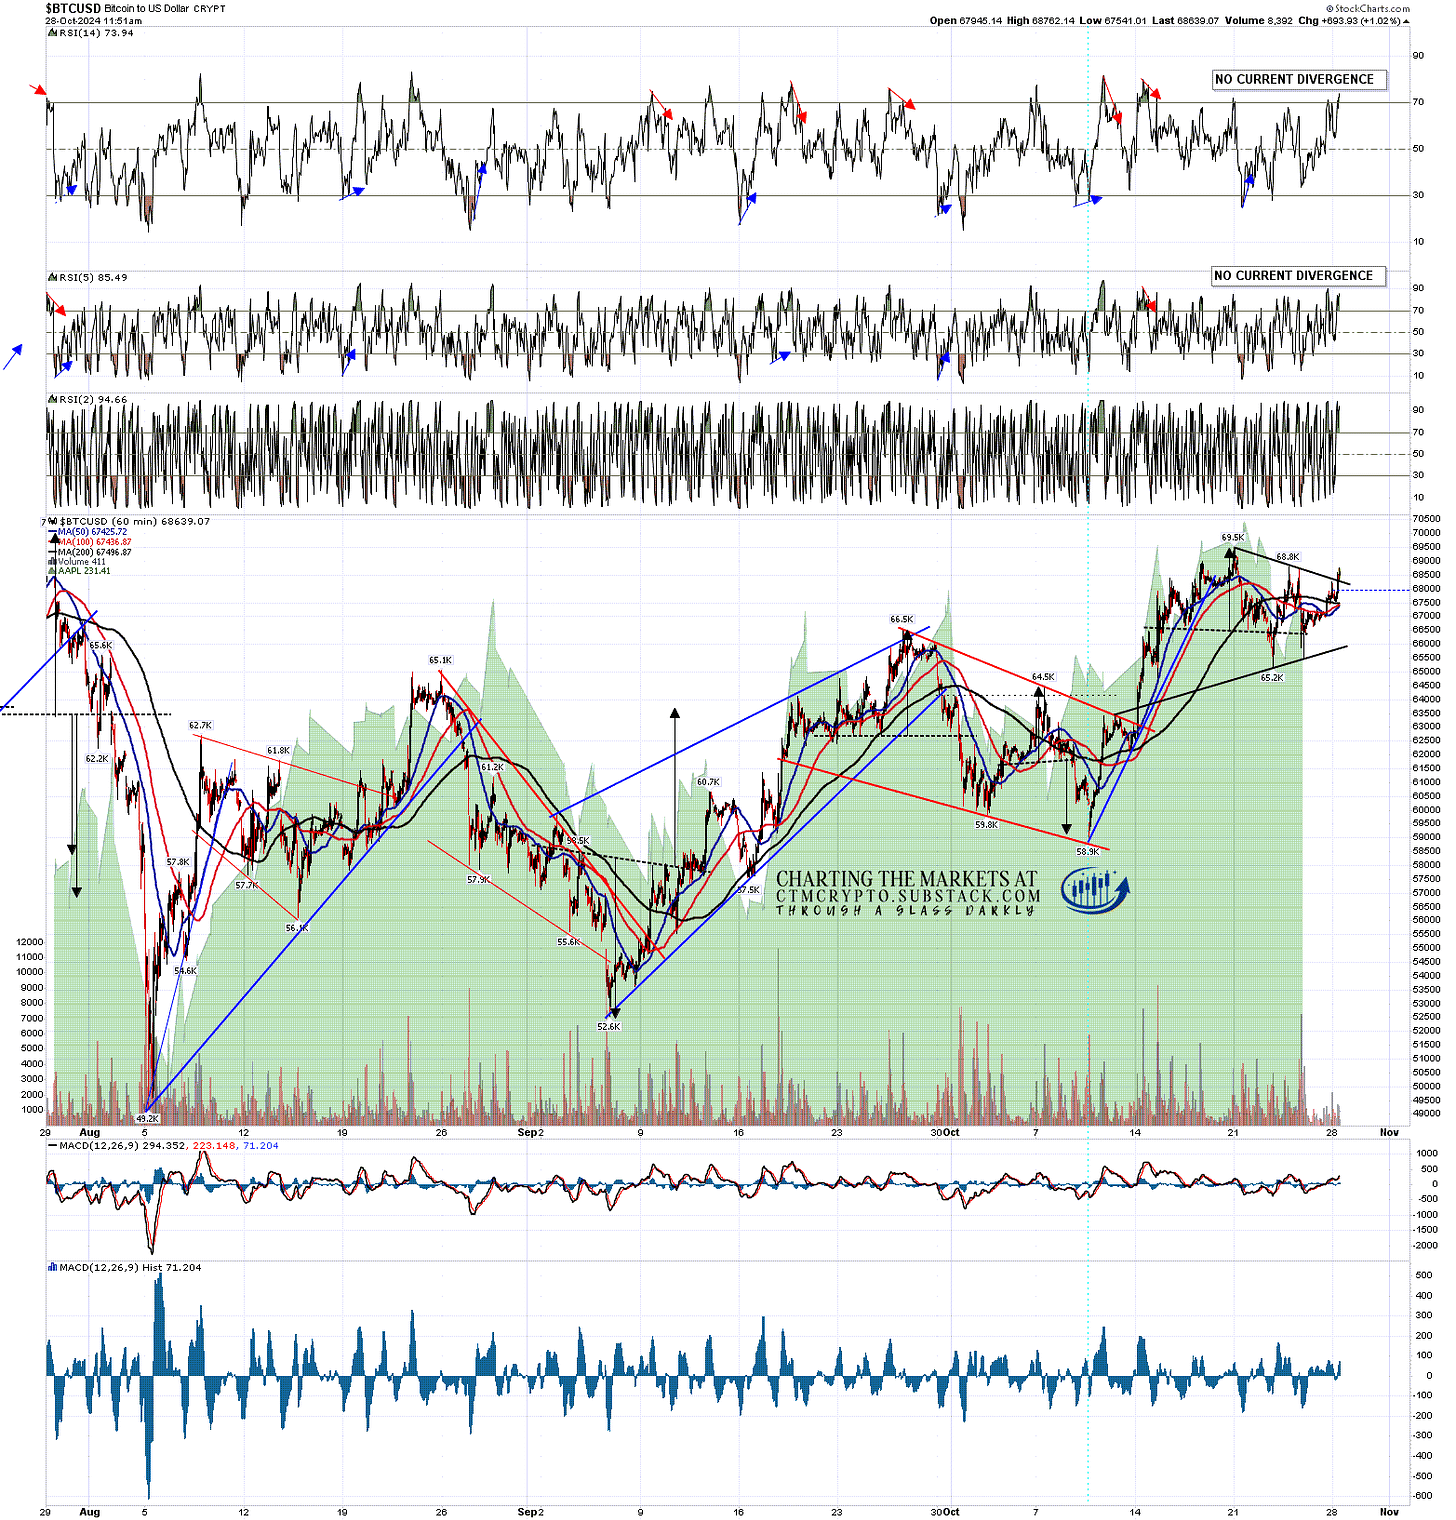
On the hourly chart the H&S had already failed before my last post with a target at a retest of the last high at 69.5k. After that post Bitcoin finished forming a bullish triangle which has broken up this morning. That triangle target is also a retest of the last high at 69.5k.
BTCUSD 60min chart:
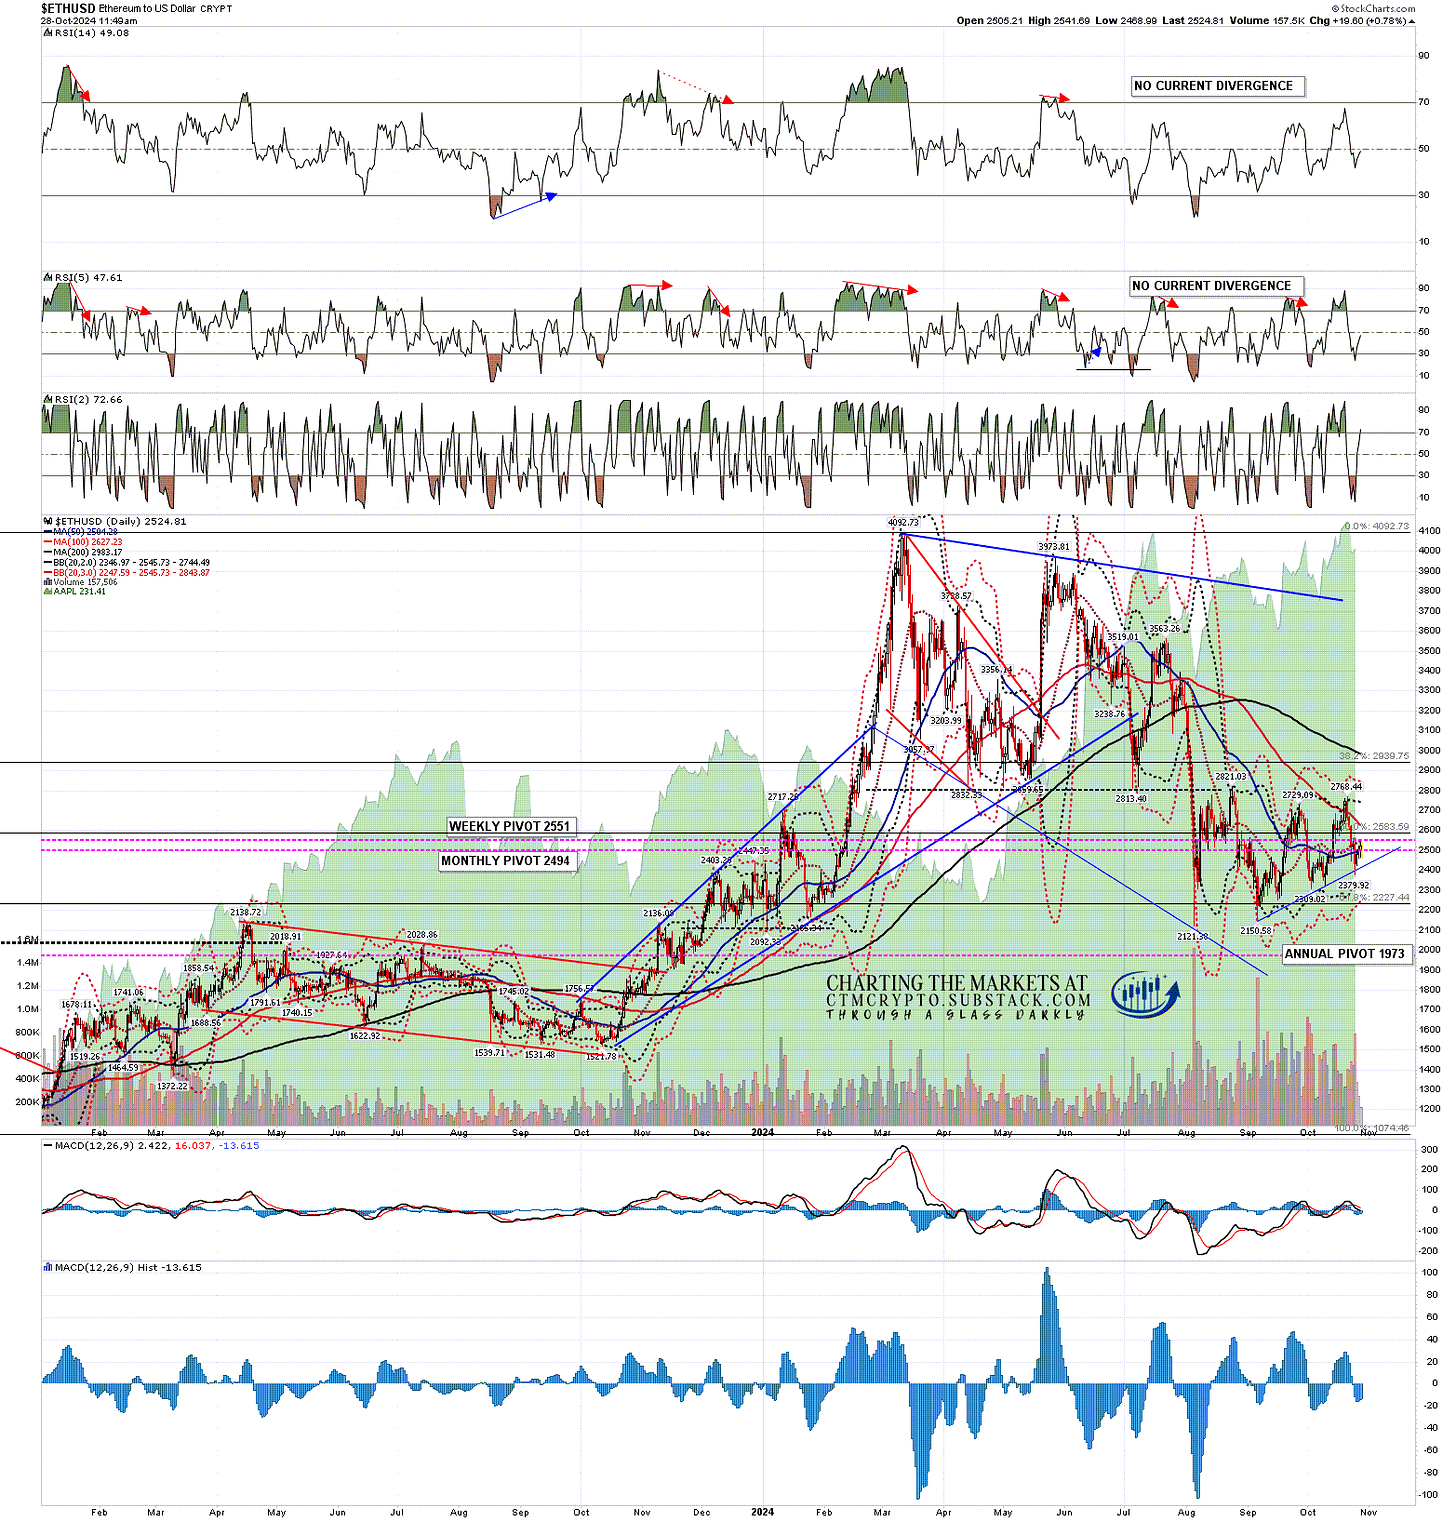
Ethereum (ETHUSD) has been relatively weak and broke below double support at the daily middle band and 50dma. It is currently trying to break back over both. I am concerned that the rally from the August 2024 low could be forming a bearish flag or triangle.
ETHUSD daily chart:
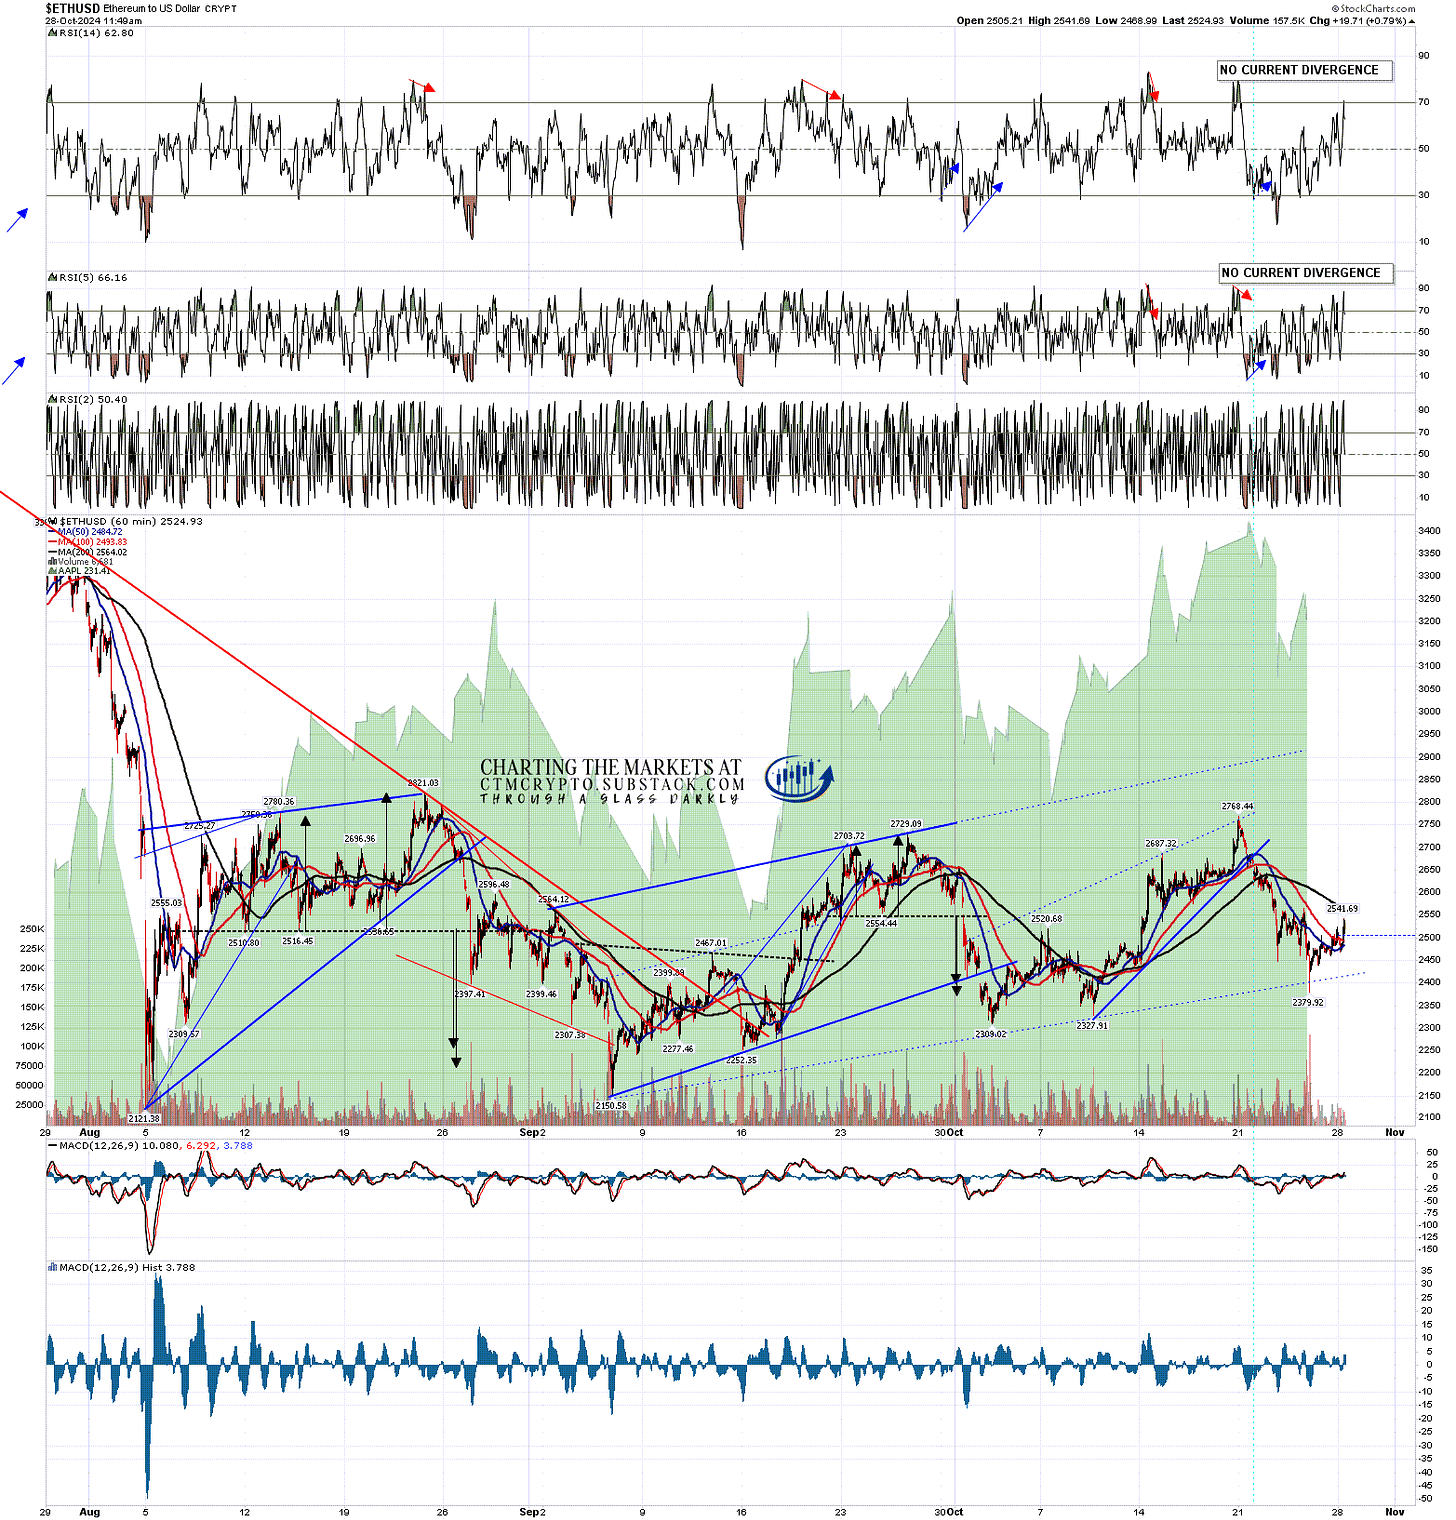
I the short term I have no targets lower or RSI negative divergence on any timeframe, so I’m leaning towards higher and a possible break back over the daily middle band.
ETHUSD 60min chart:
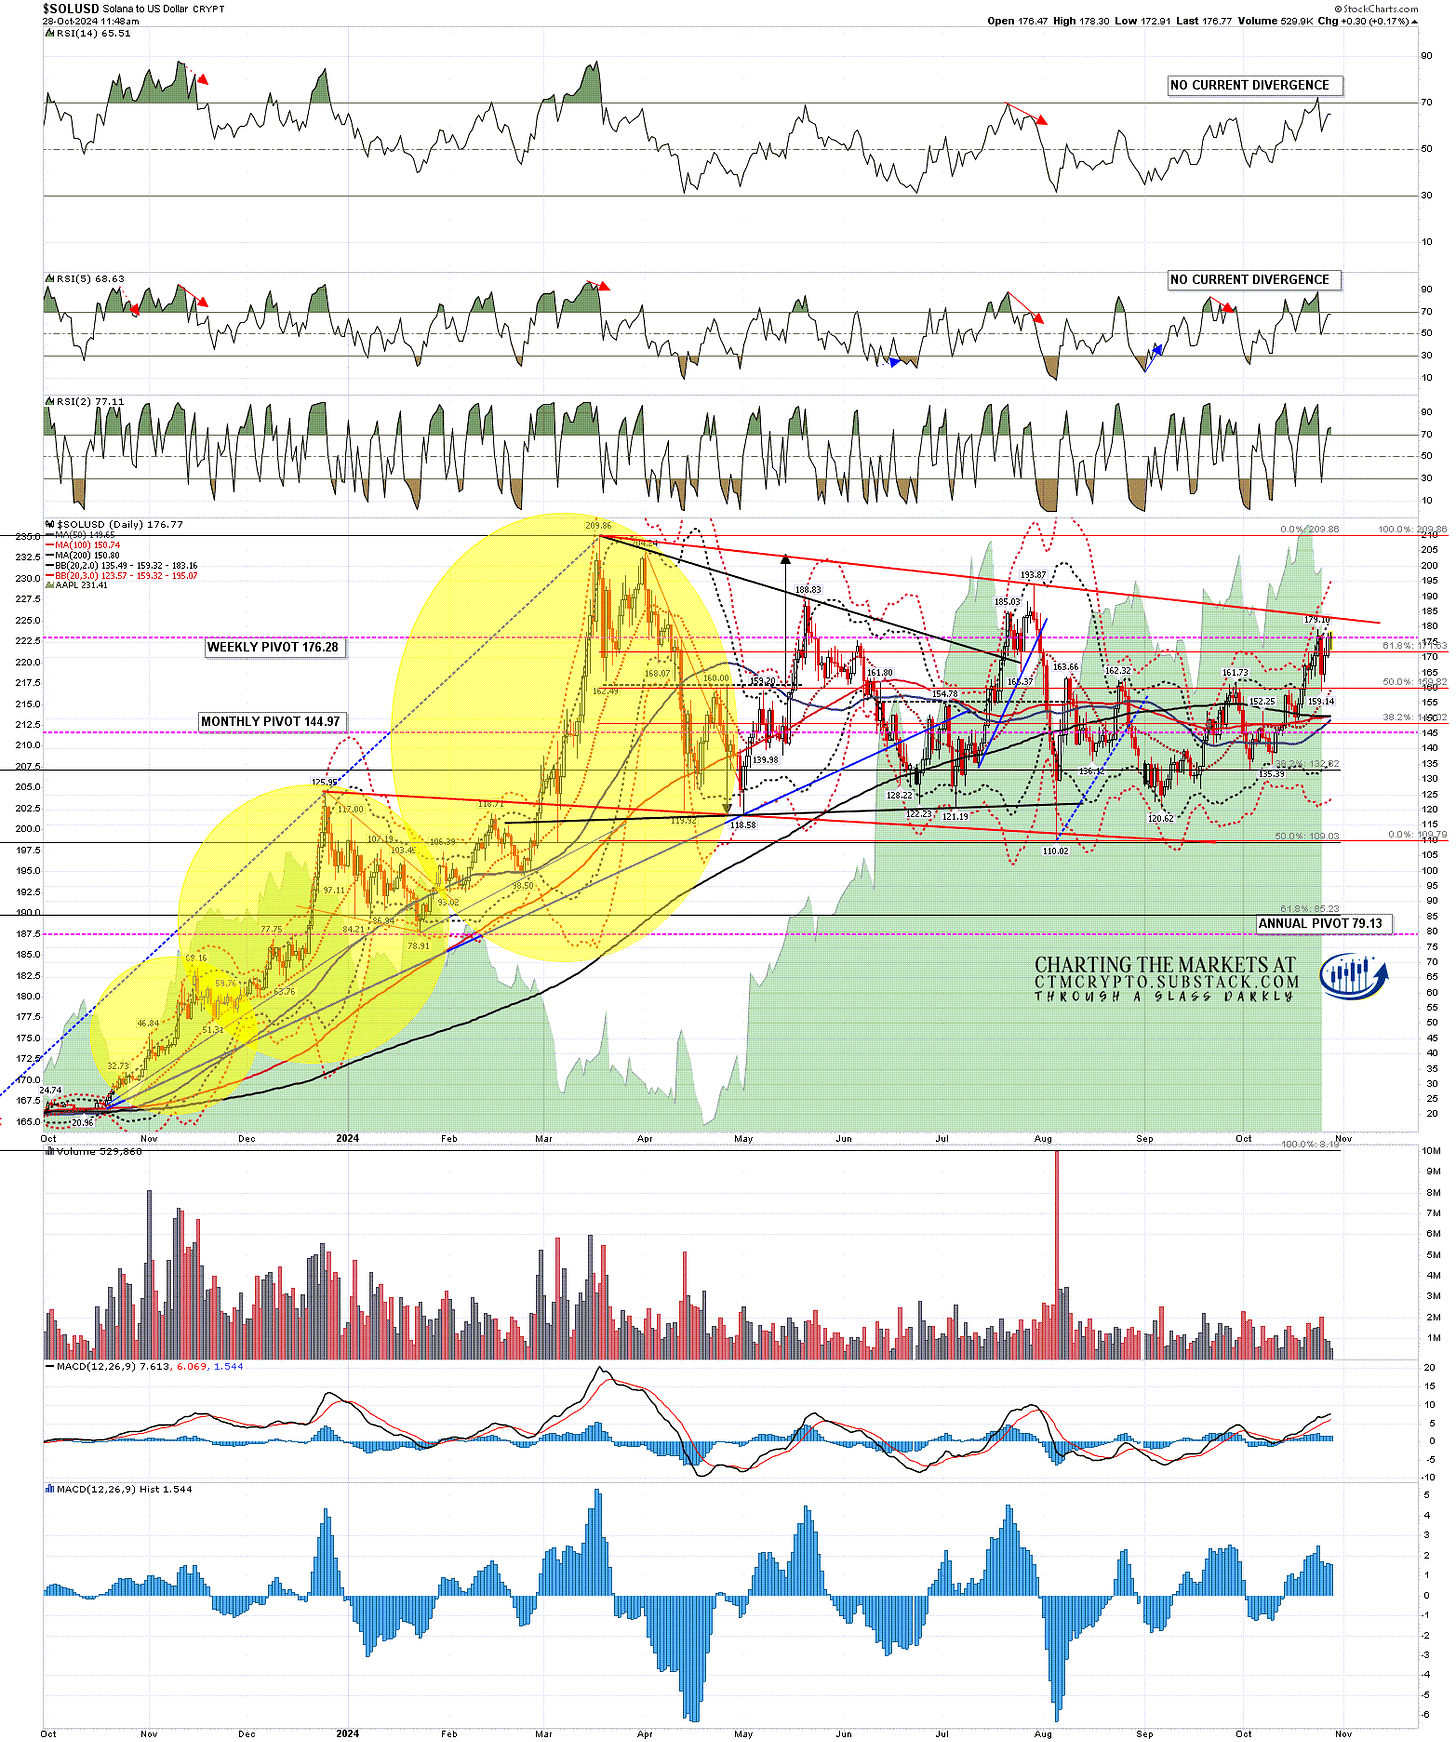
On Solana the backtest never tested the daily middle band and the next obvious target, after a retest of last week’s high at 179.10, is a test of main bull flag resistance, now in the 183.5 area. On a sustained break over that bull flag resistance, the target would be a retest of the 2024 high at 209.86.
SOLUSD daily chart:
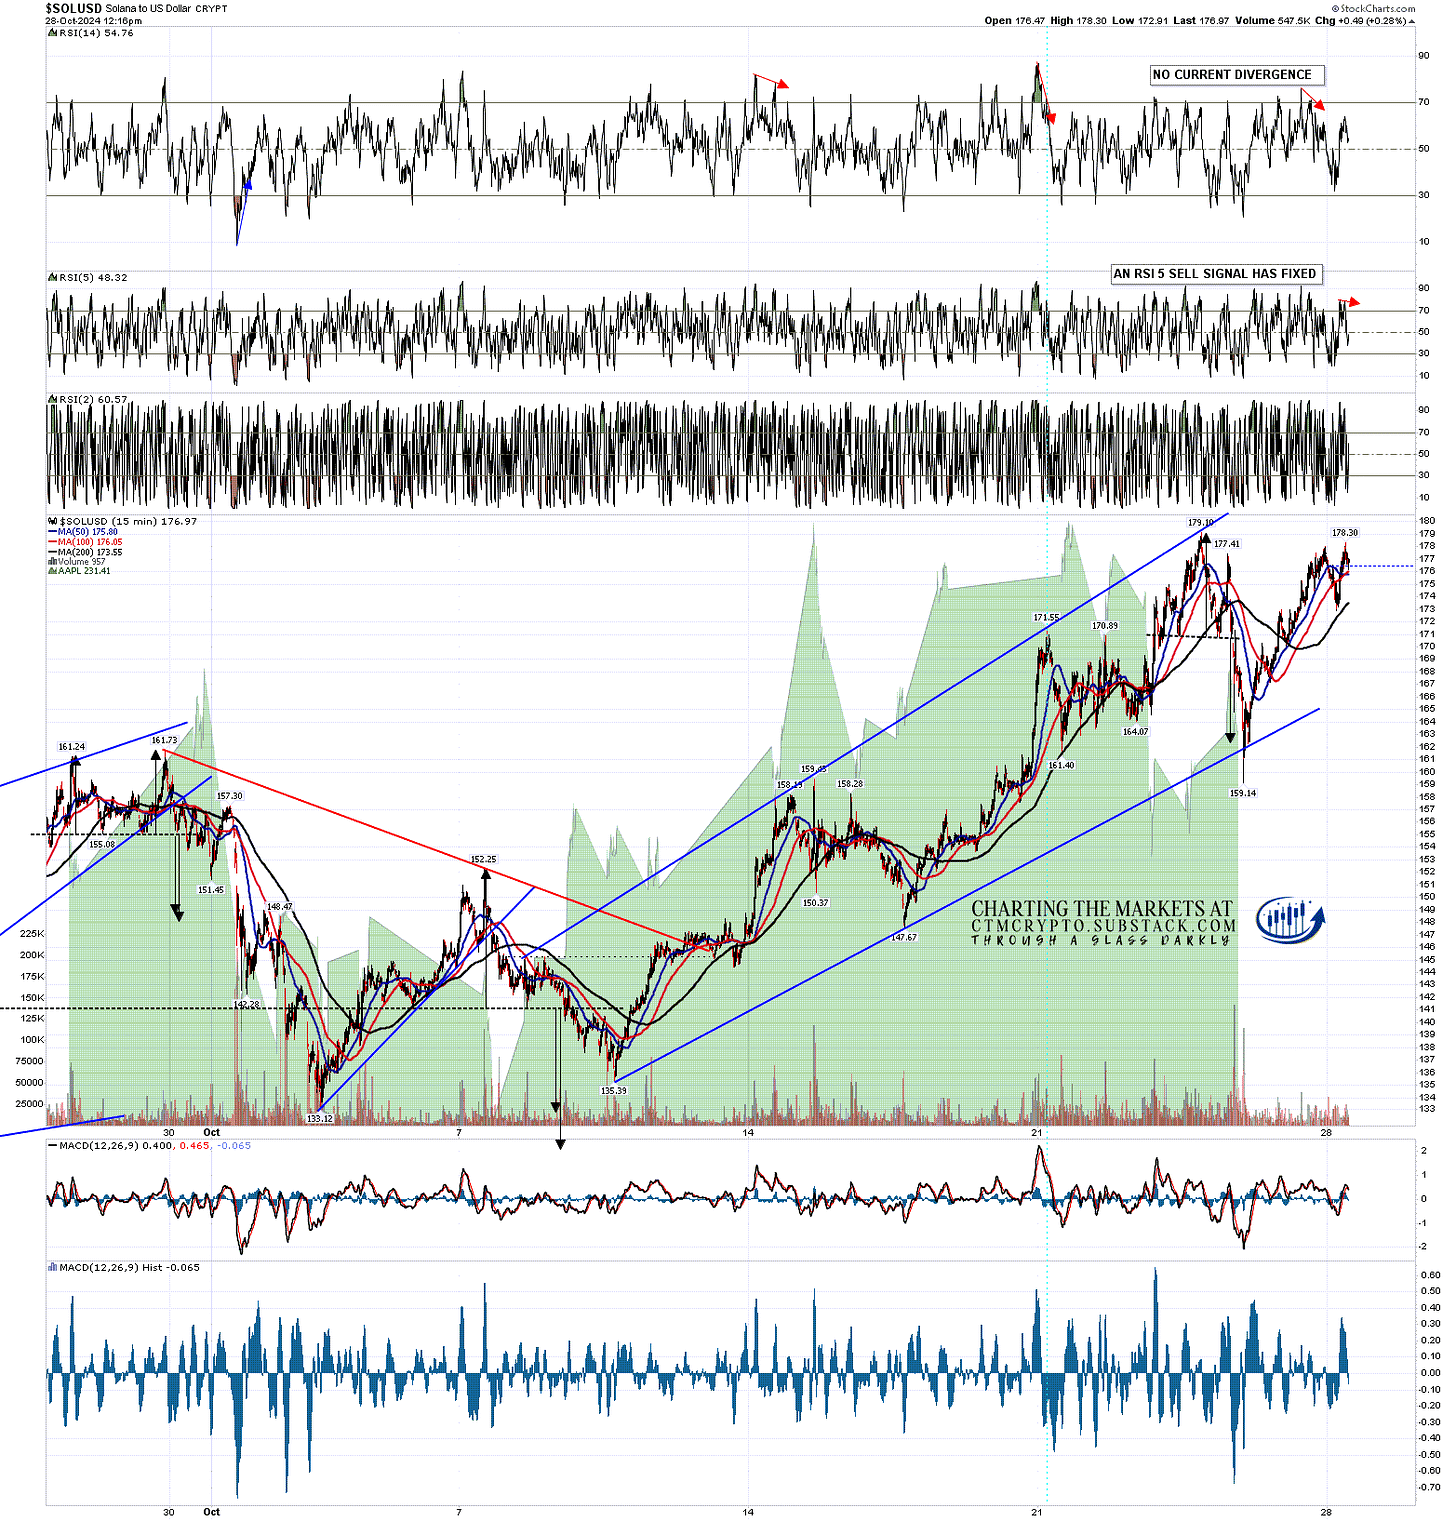
In the short term there was a small H&S that formed and played out on the 15min chart before almost retesting the high this morning.
There is some sign of short term weakness, with an 15min RSI 5 sell signal fixed, and small double top formed, but the double top target, if reached, would only be back in the 174 area. Rising support from the 135.39 low was broken on the last retrace, but that doesn’t look significant, and likely just established a slightly shallower rising support trendline.
SOLUSD 15min chart:
Overall I’m still liking the upside, though I would note that on a retest of 179.10, a possible daily RSI 14 sell signal would start brewing on Solana. That’s not necessarily significant, but there would then also be a potential large double top there that could look for the 138/9 area on a reversal, so Solana would need to push up through that reversal setup.
If you’d like to see more of these posts and the other Crypto videos and information I post, please subscribe for free to my Crypto substack.
I'm also to be found at Arion Partners, though as a student rather than as a teacher. I've been charting Crypto for some years now, but am learning to trade and invest in them directly, and Arion Partners are my guide around a space that might reasonably be compared to the Wild West in one of their rougher years.


No comments:
Post a Comment