In my post on 20th February I was looking at the big support levels on Bitcoin (BTCUSD), Solana (SOLUSD) and Ethereum (ETHUSD). I was leaning towards seeing a retracement / consolidation on Crypto in the first half of this year and then strong new highs towards the end of the year with possible bull market highs pencilled in for Nov/Dec 2025.
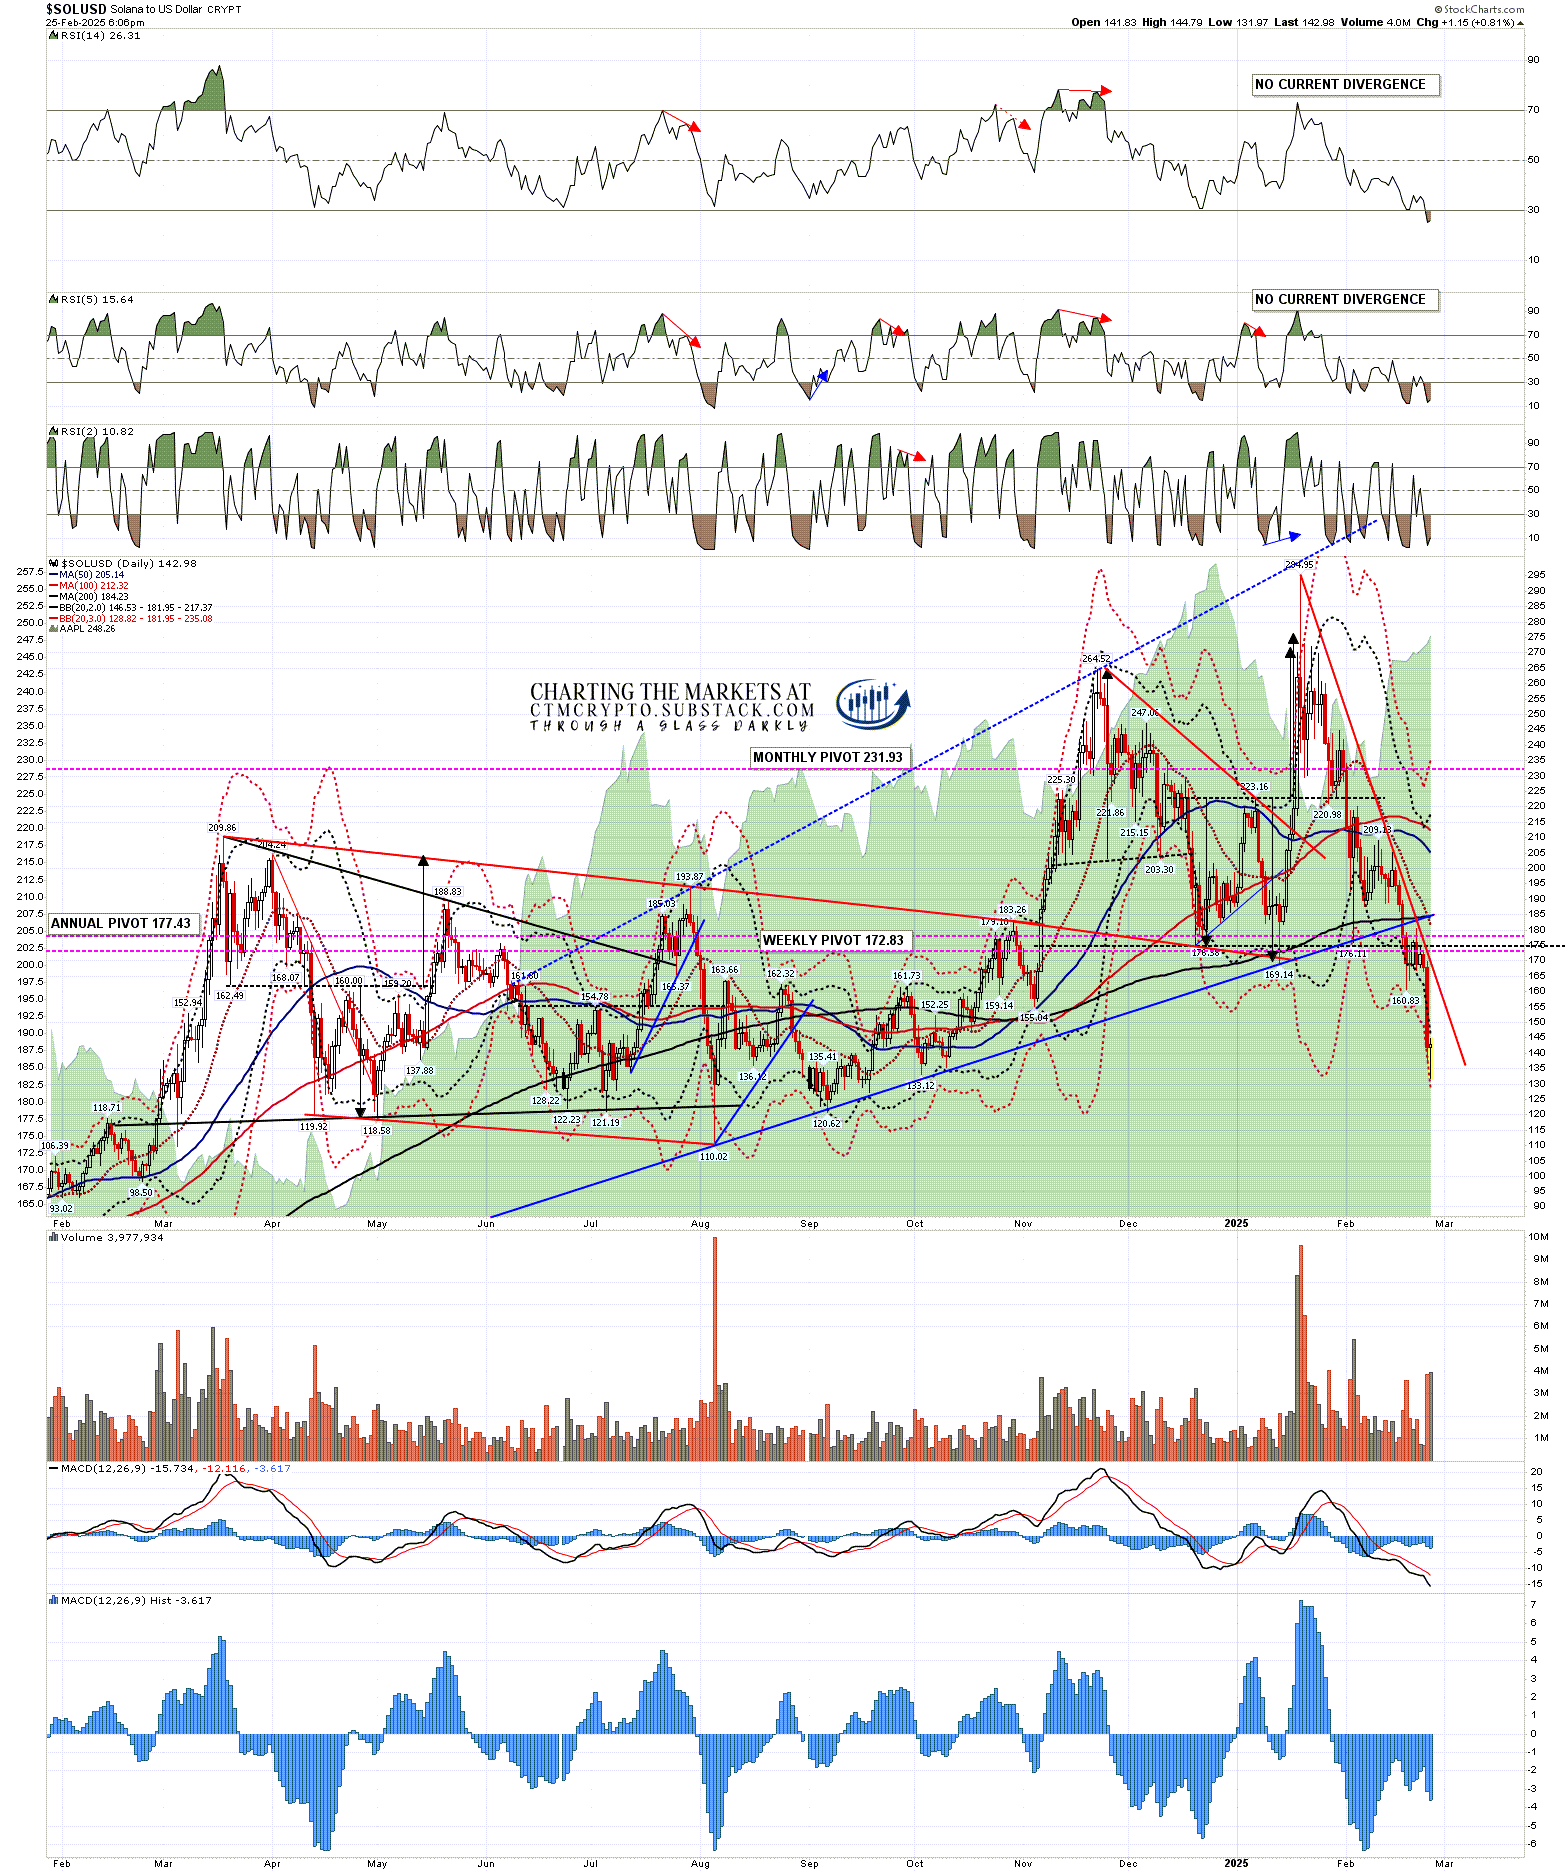
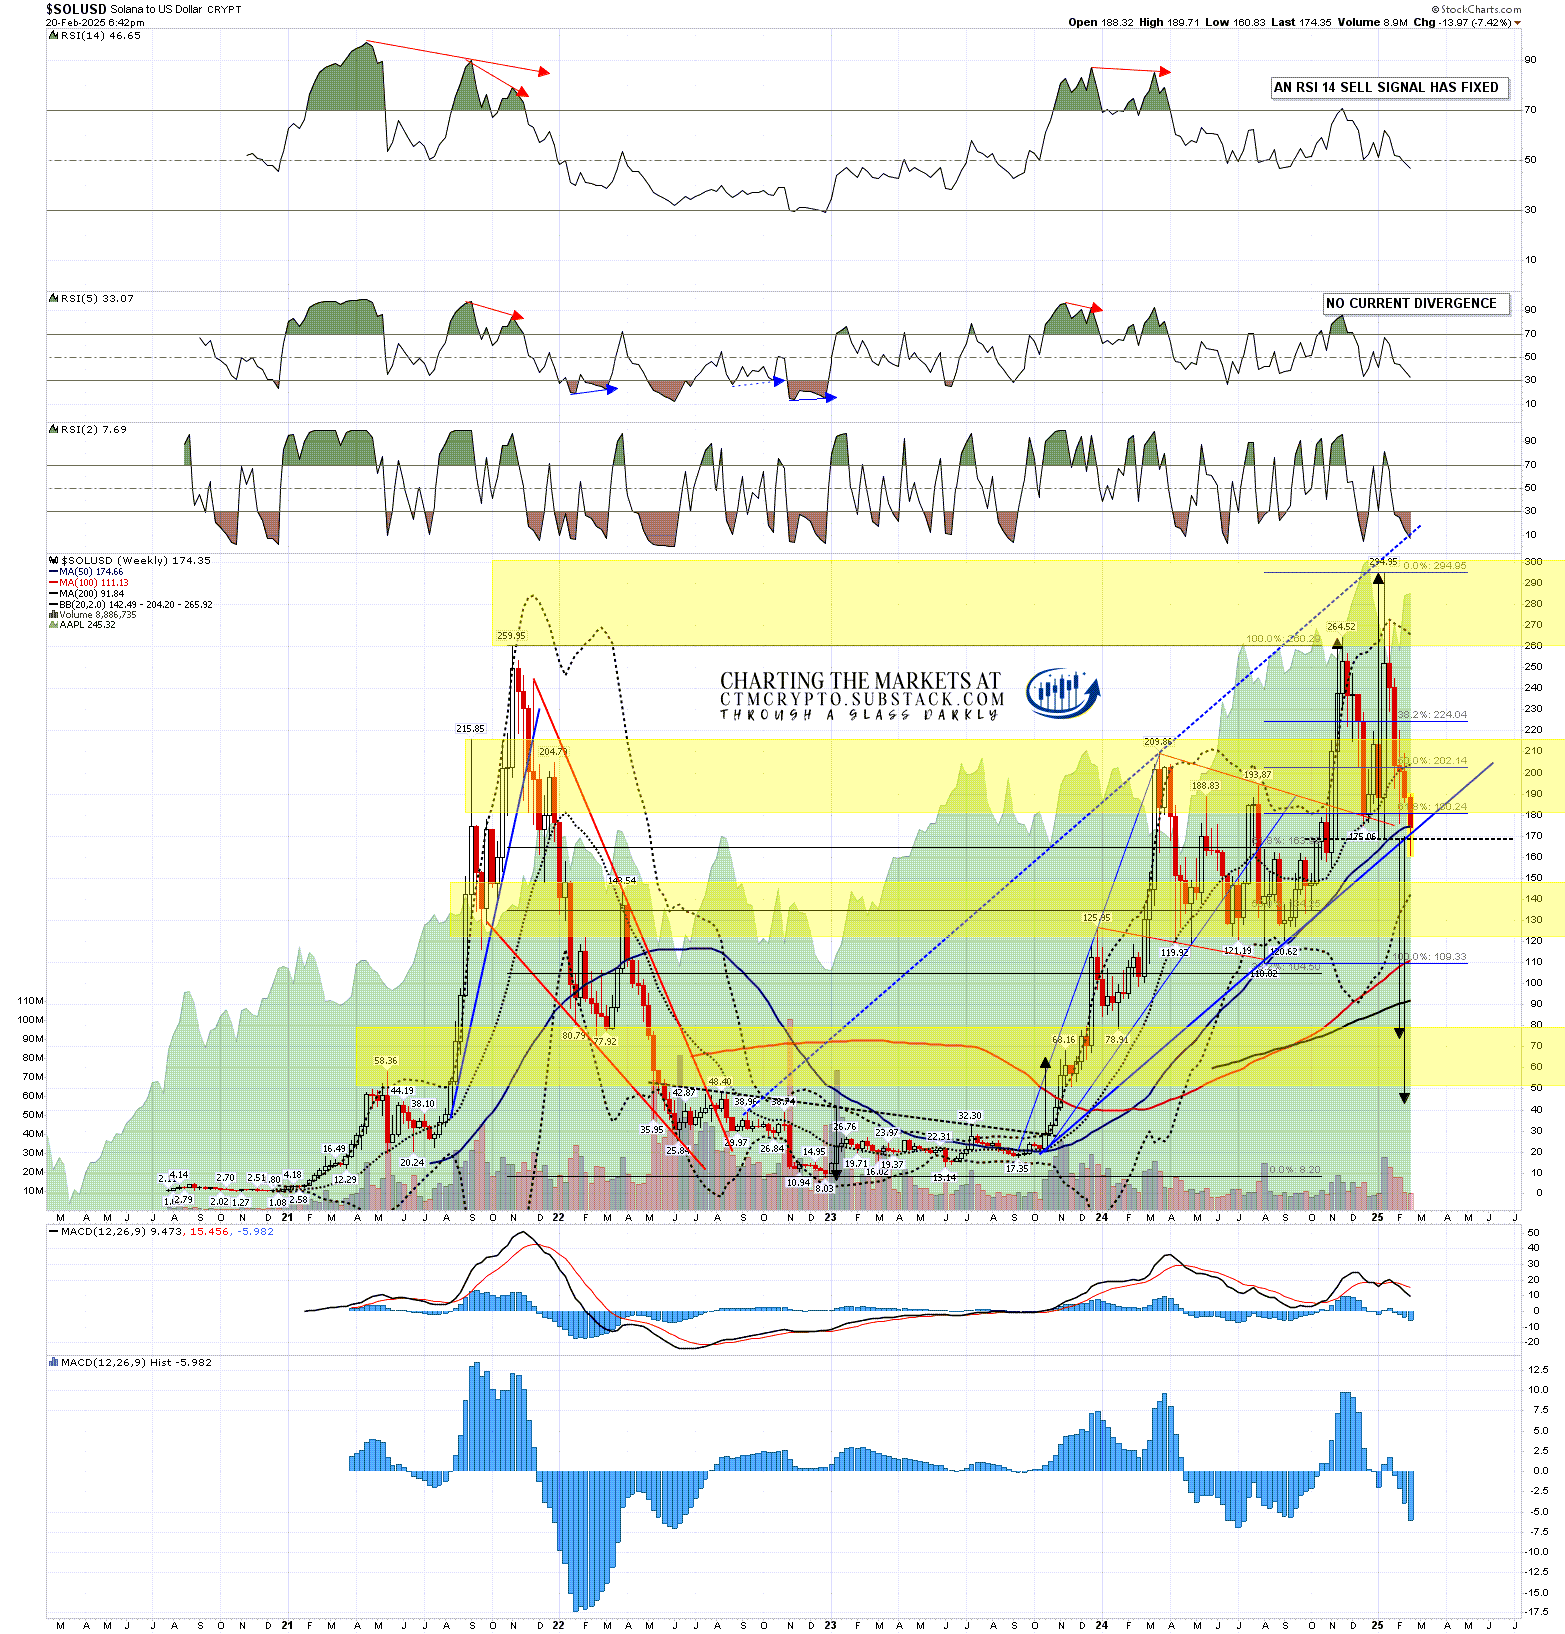
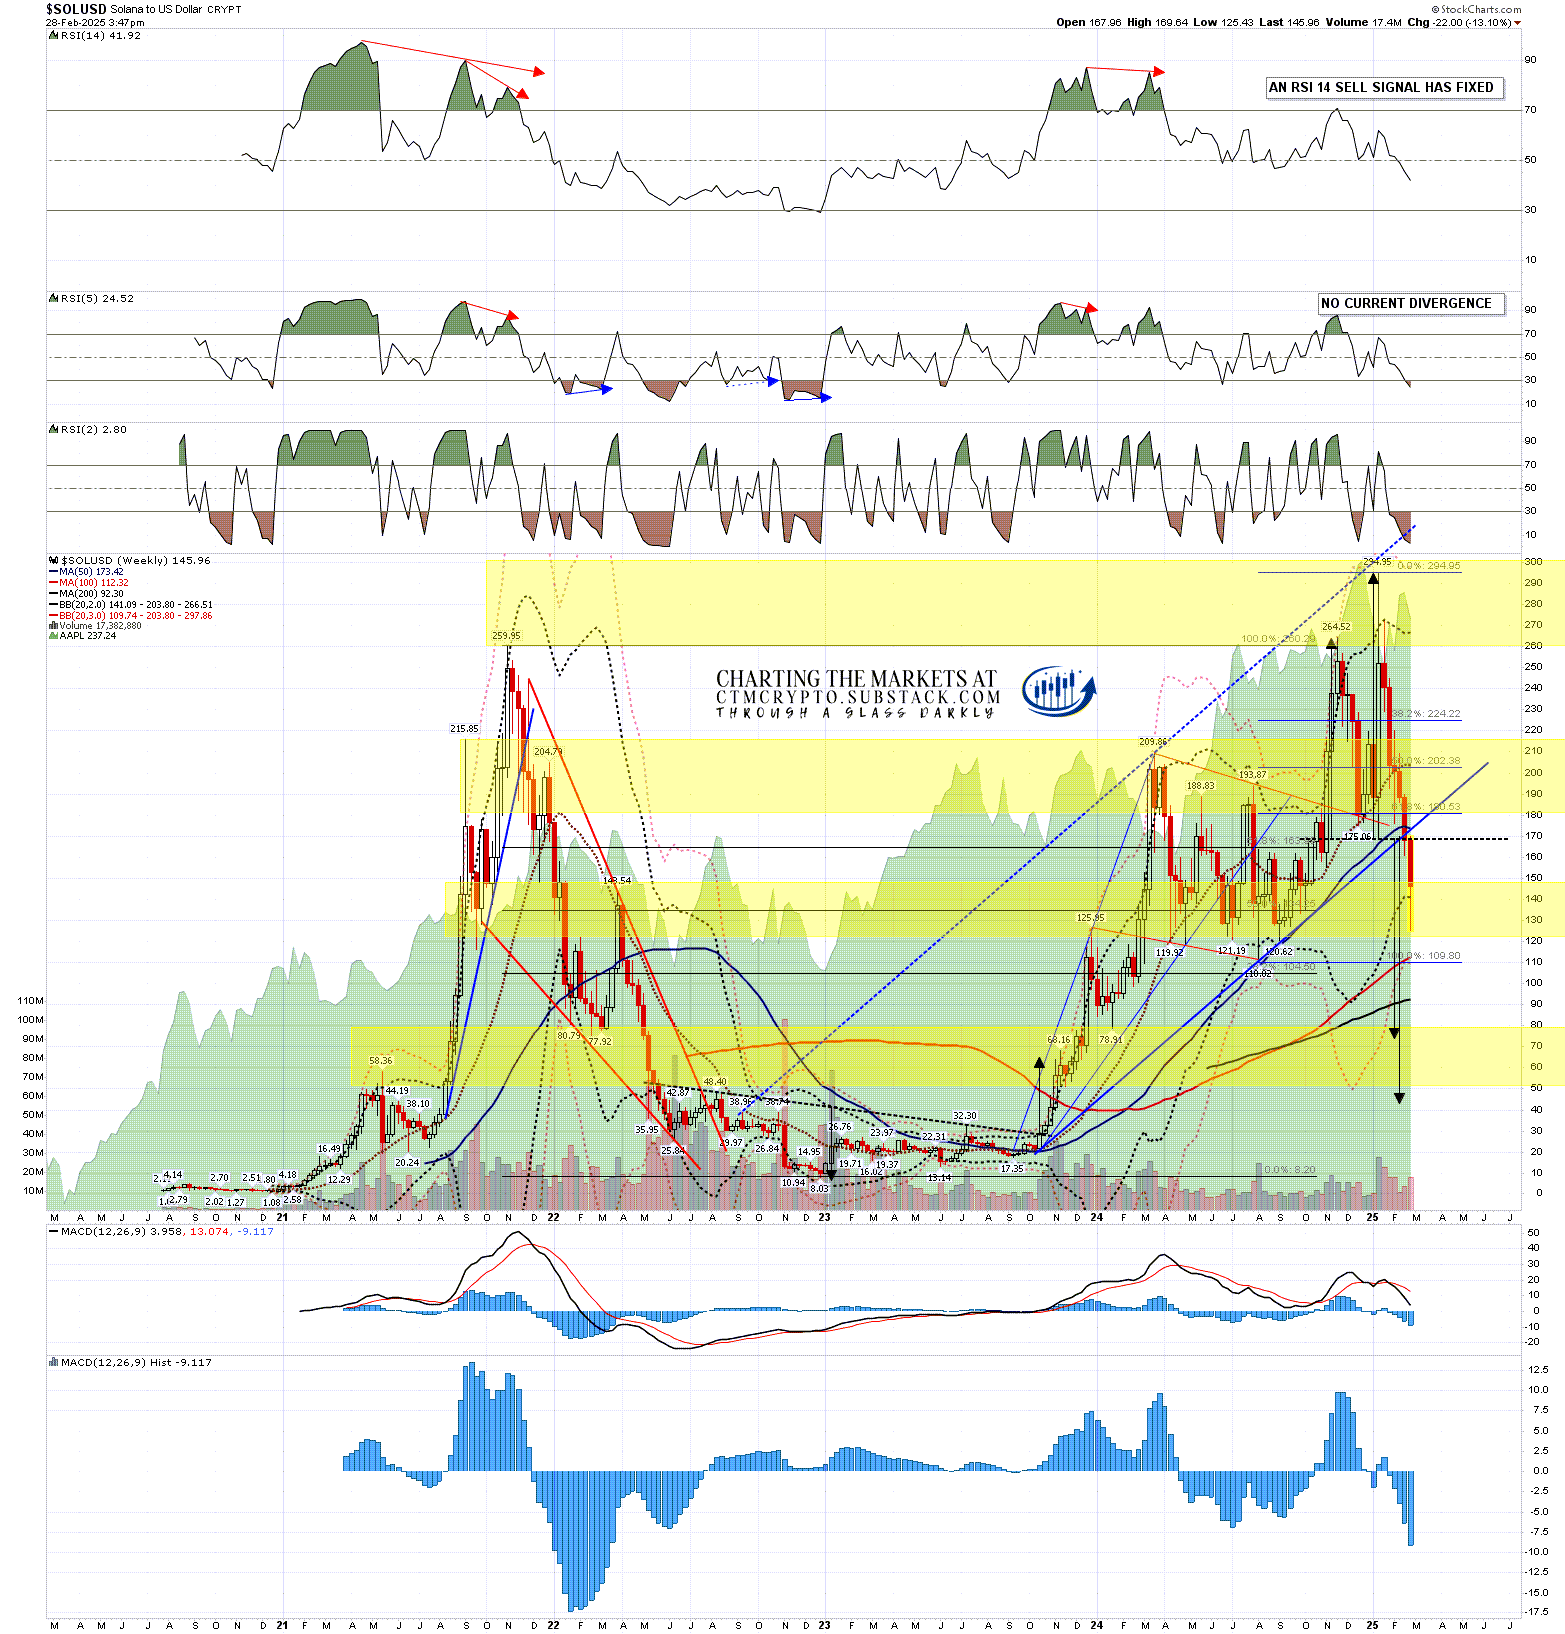
On Solana I gave three big support ranges and we were testing the second 180-216 range on a weekly close basis at the time. The third level is the 120-150 support/resistance range and by the time of my last post on Tuesday Solana was testing that and, with the low so far today at 125.43, is still holding the lower end of that range. I added that on a break below there is a last level at the Aug 2024 low at 110.02 that, if broken, would then raise a very real question as to whether the bull market is over.
SOLUSD weekly chart:
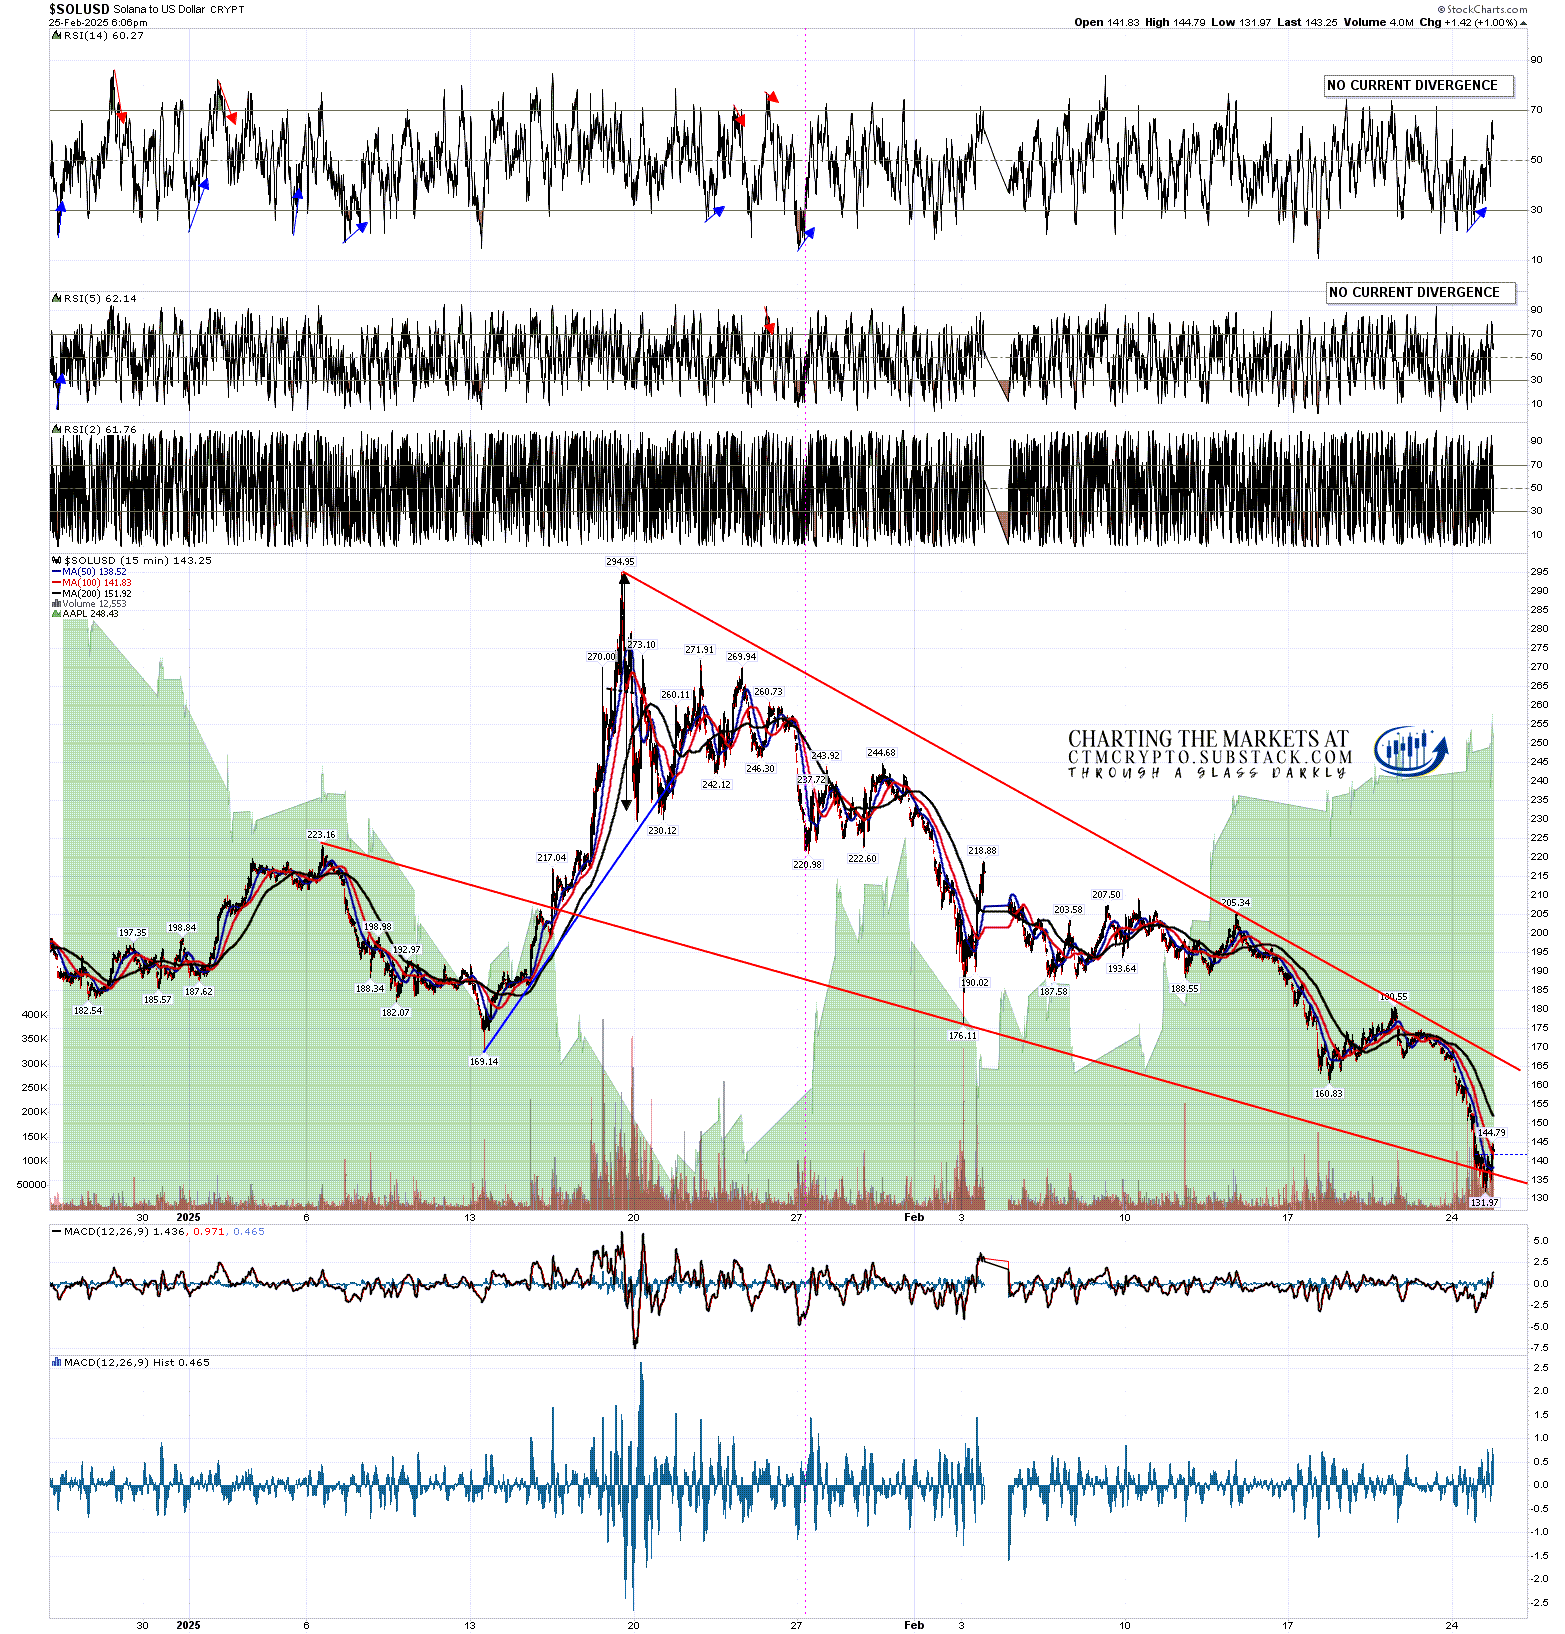
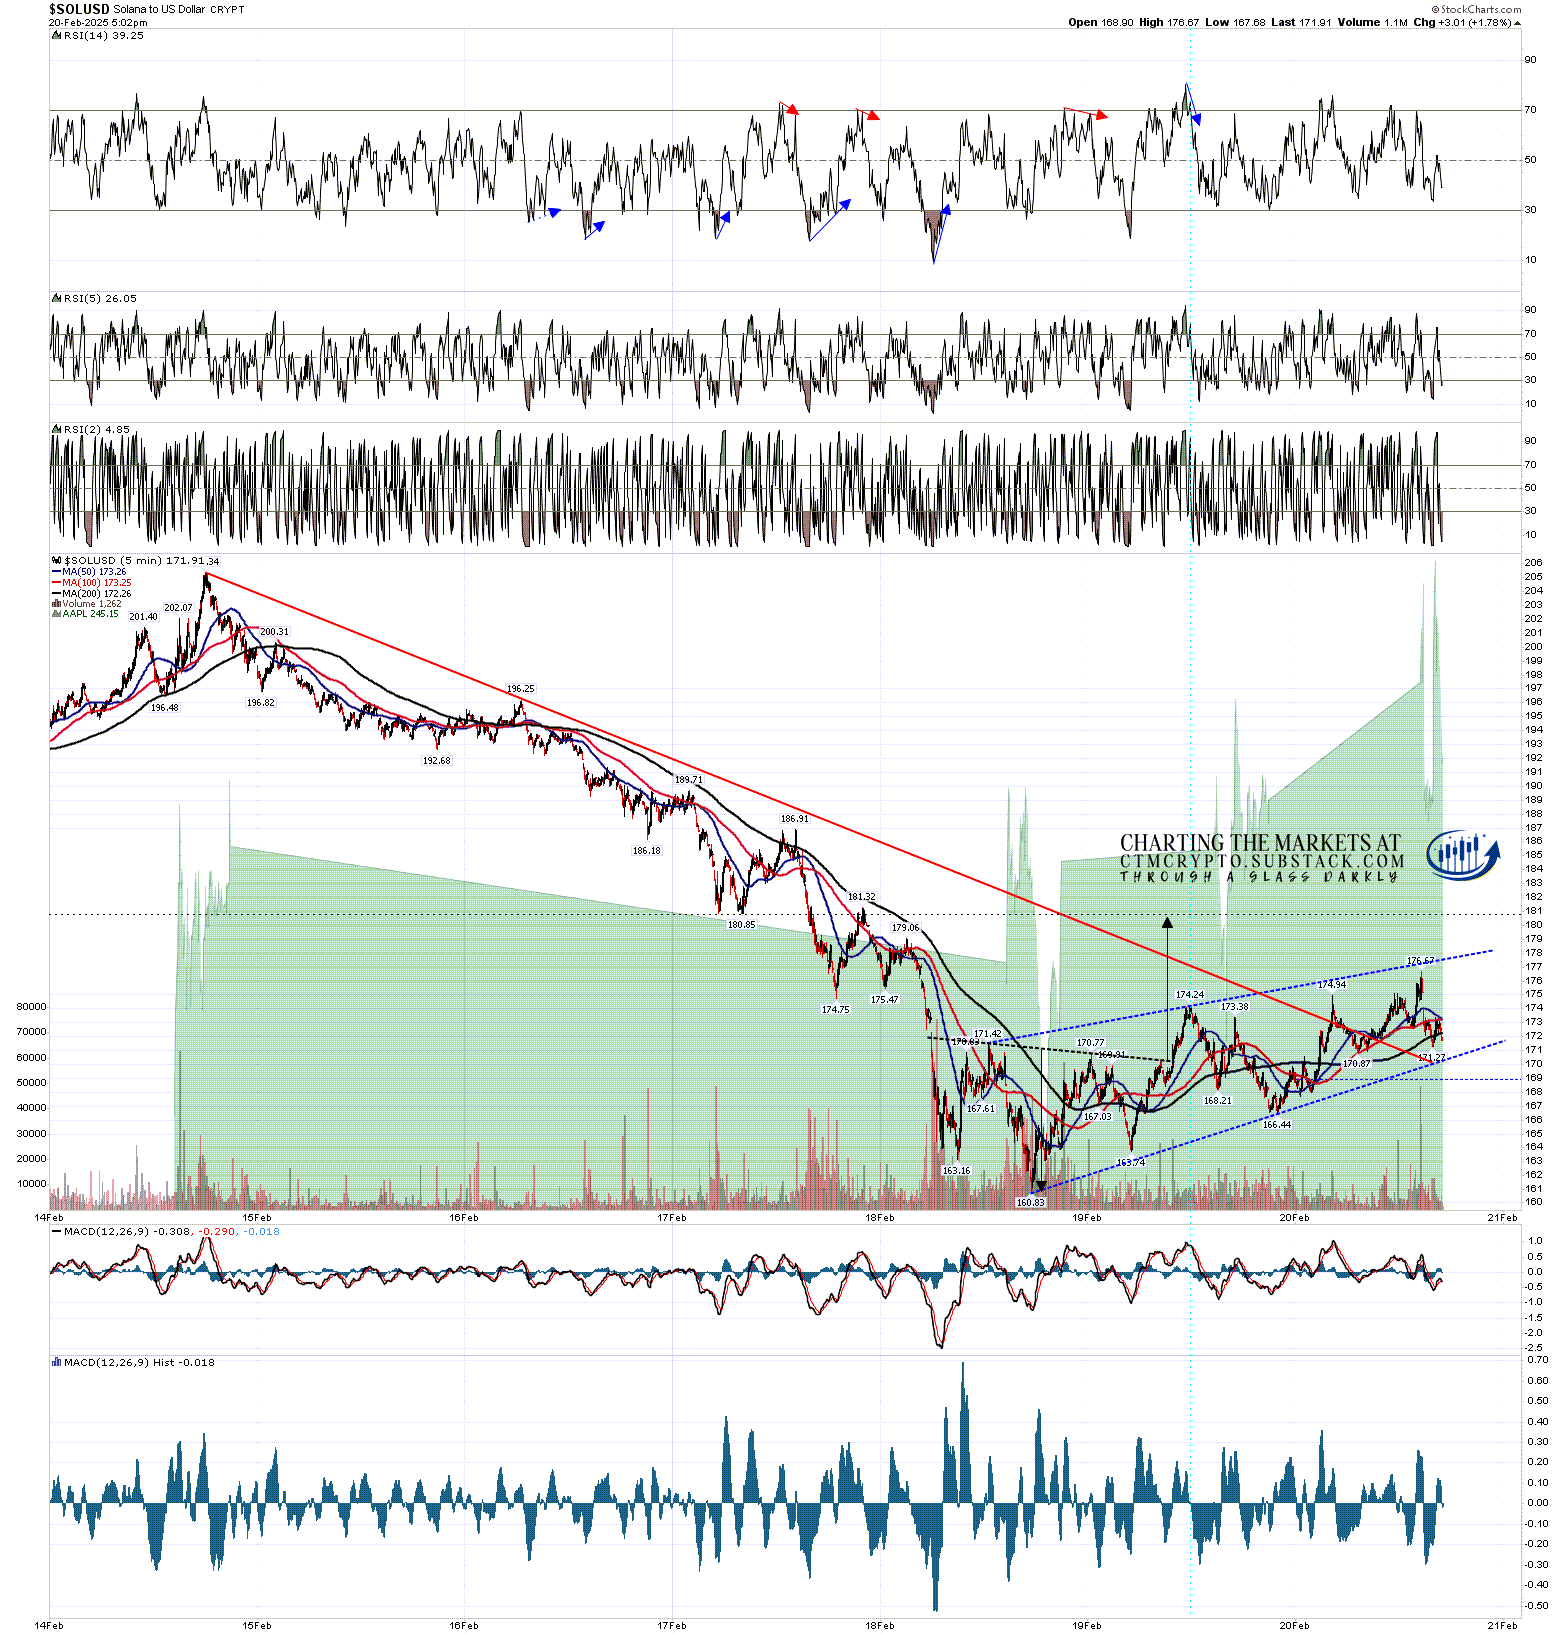
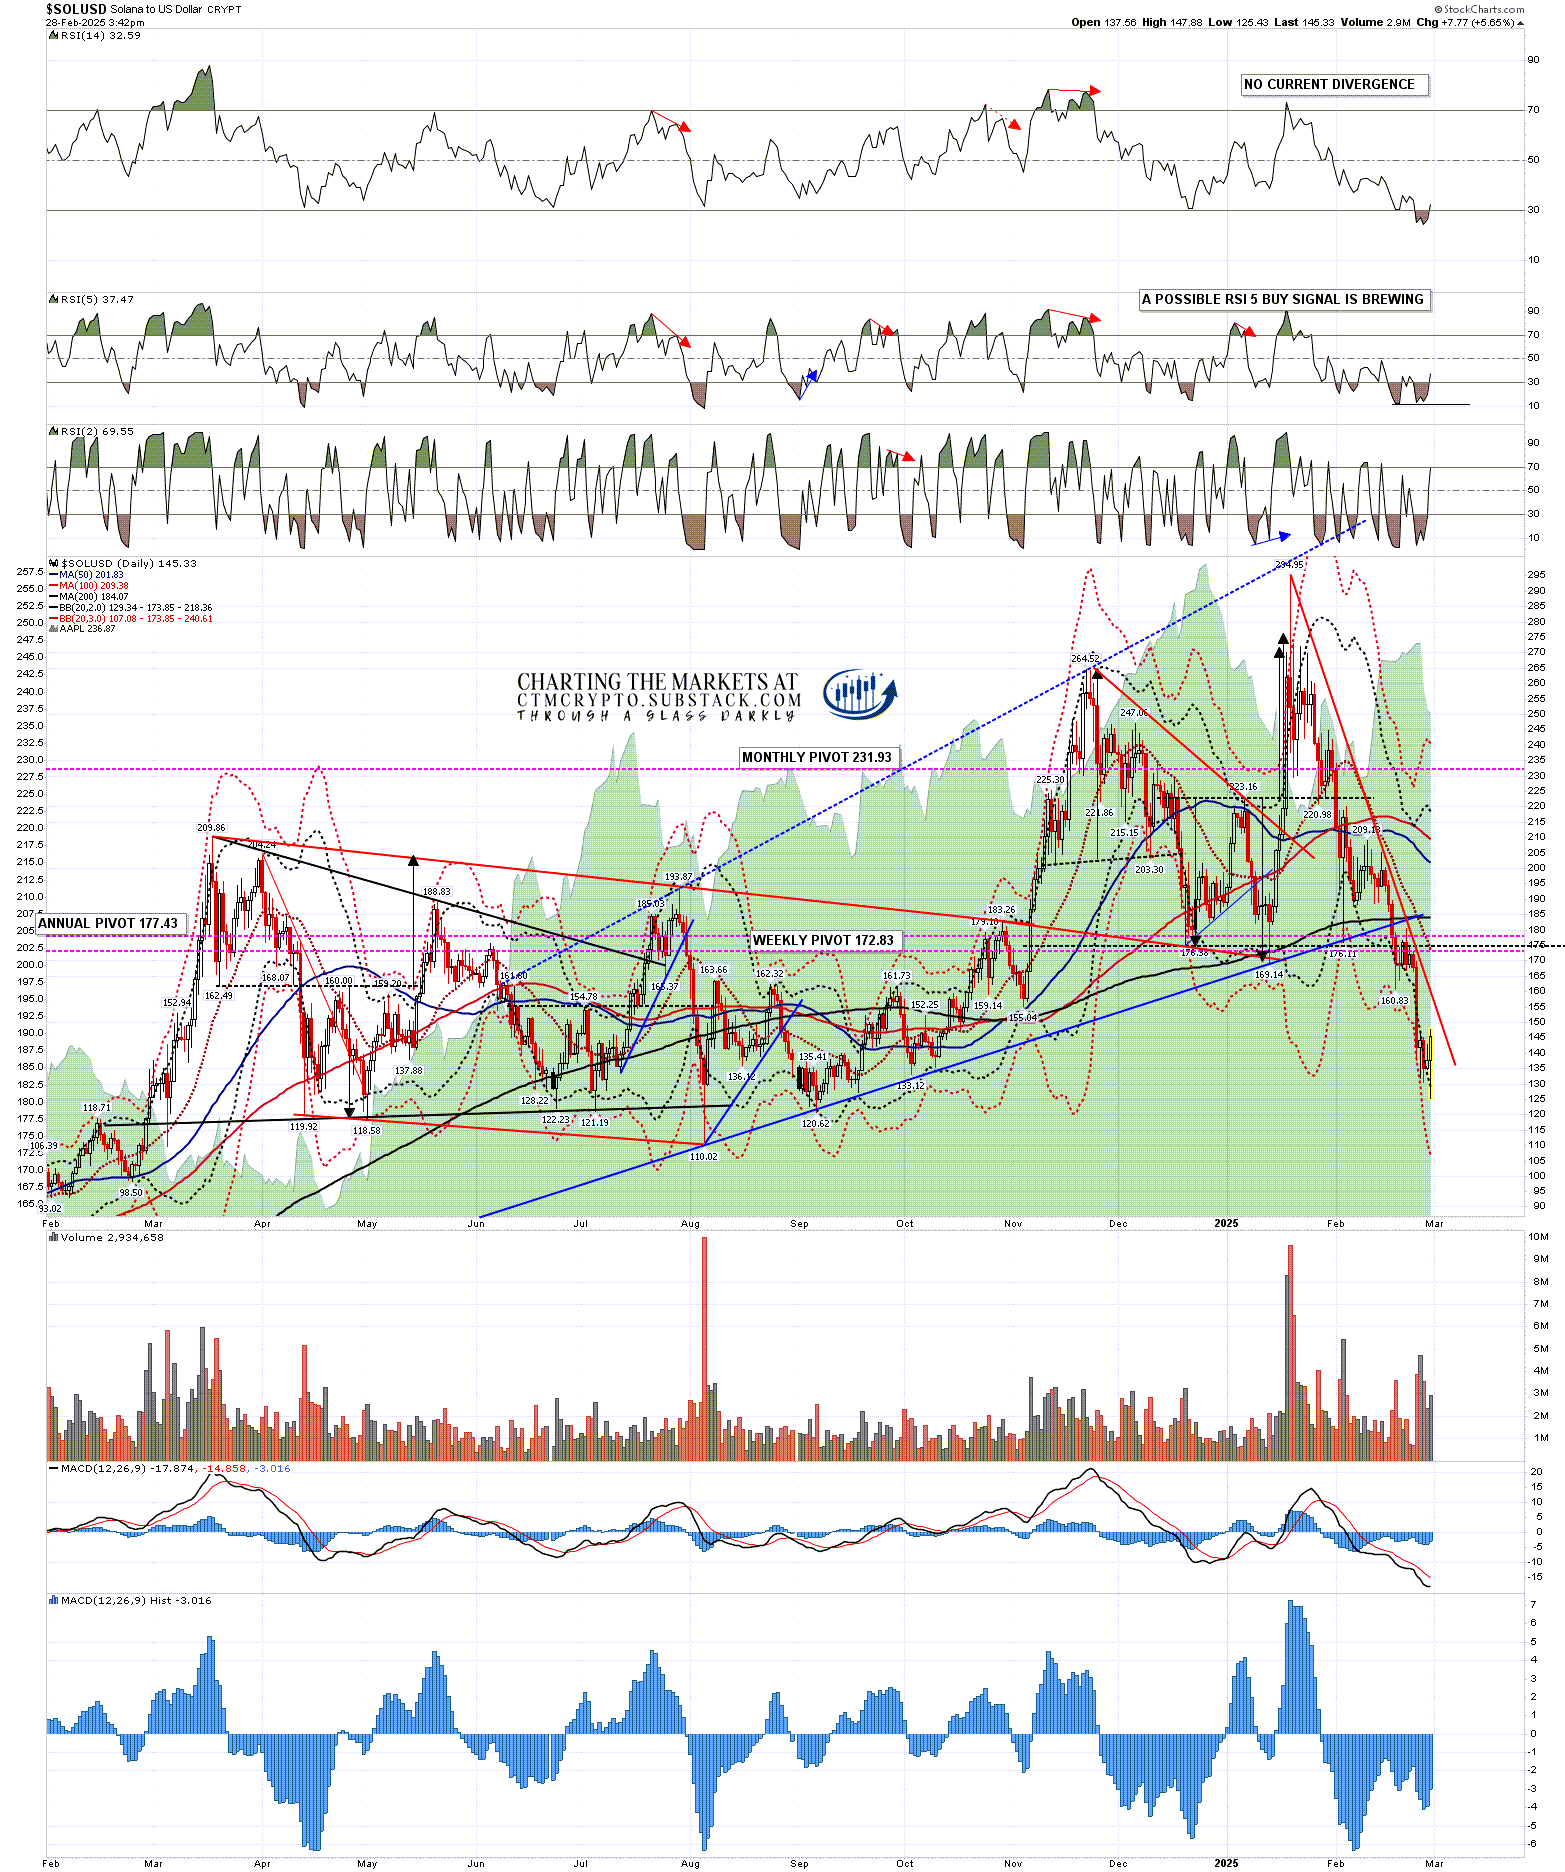
On the daily chart a high quality possible RSI 5 buy signal is brewing and I still like the falling wedge setup from the high, though it isn’t high quality. I am wondering about a possible retracement low forming here.
SOLUSD daily chart:
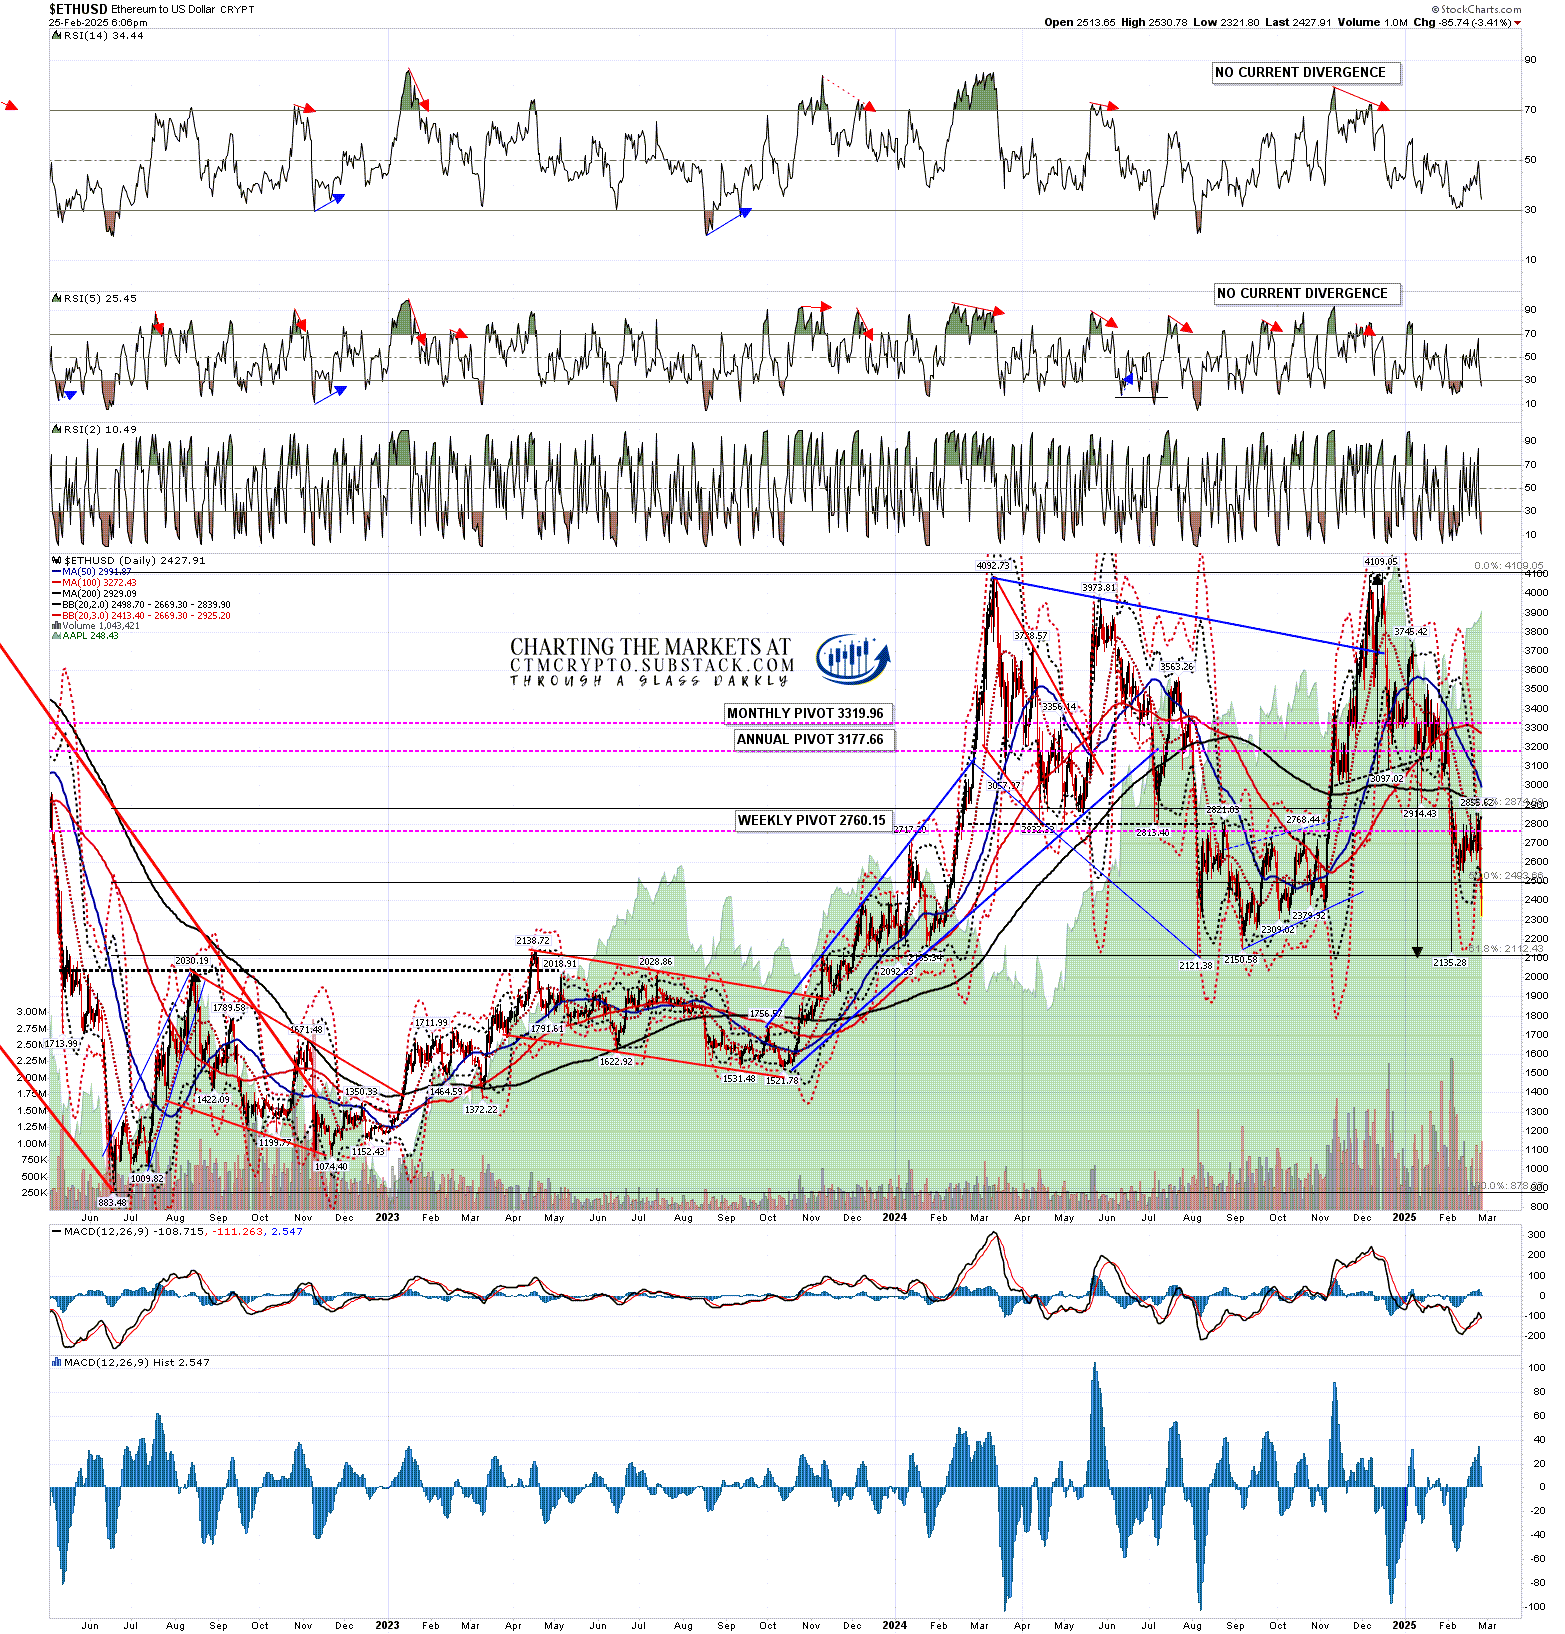
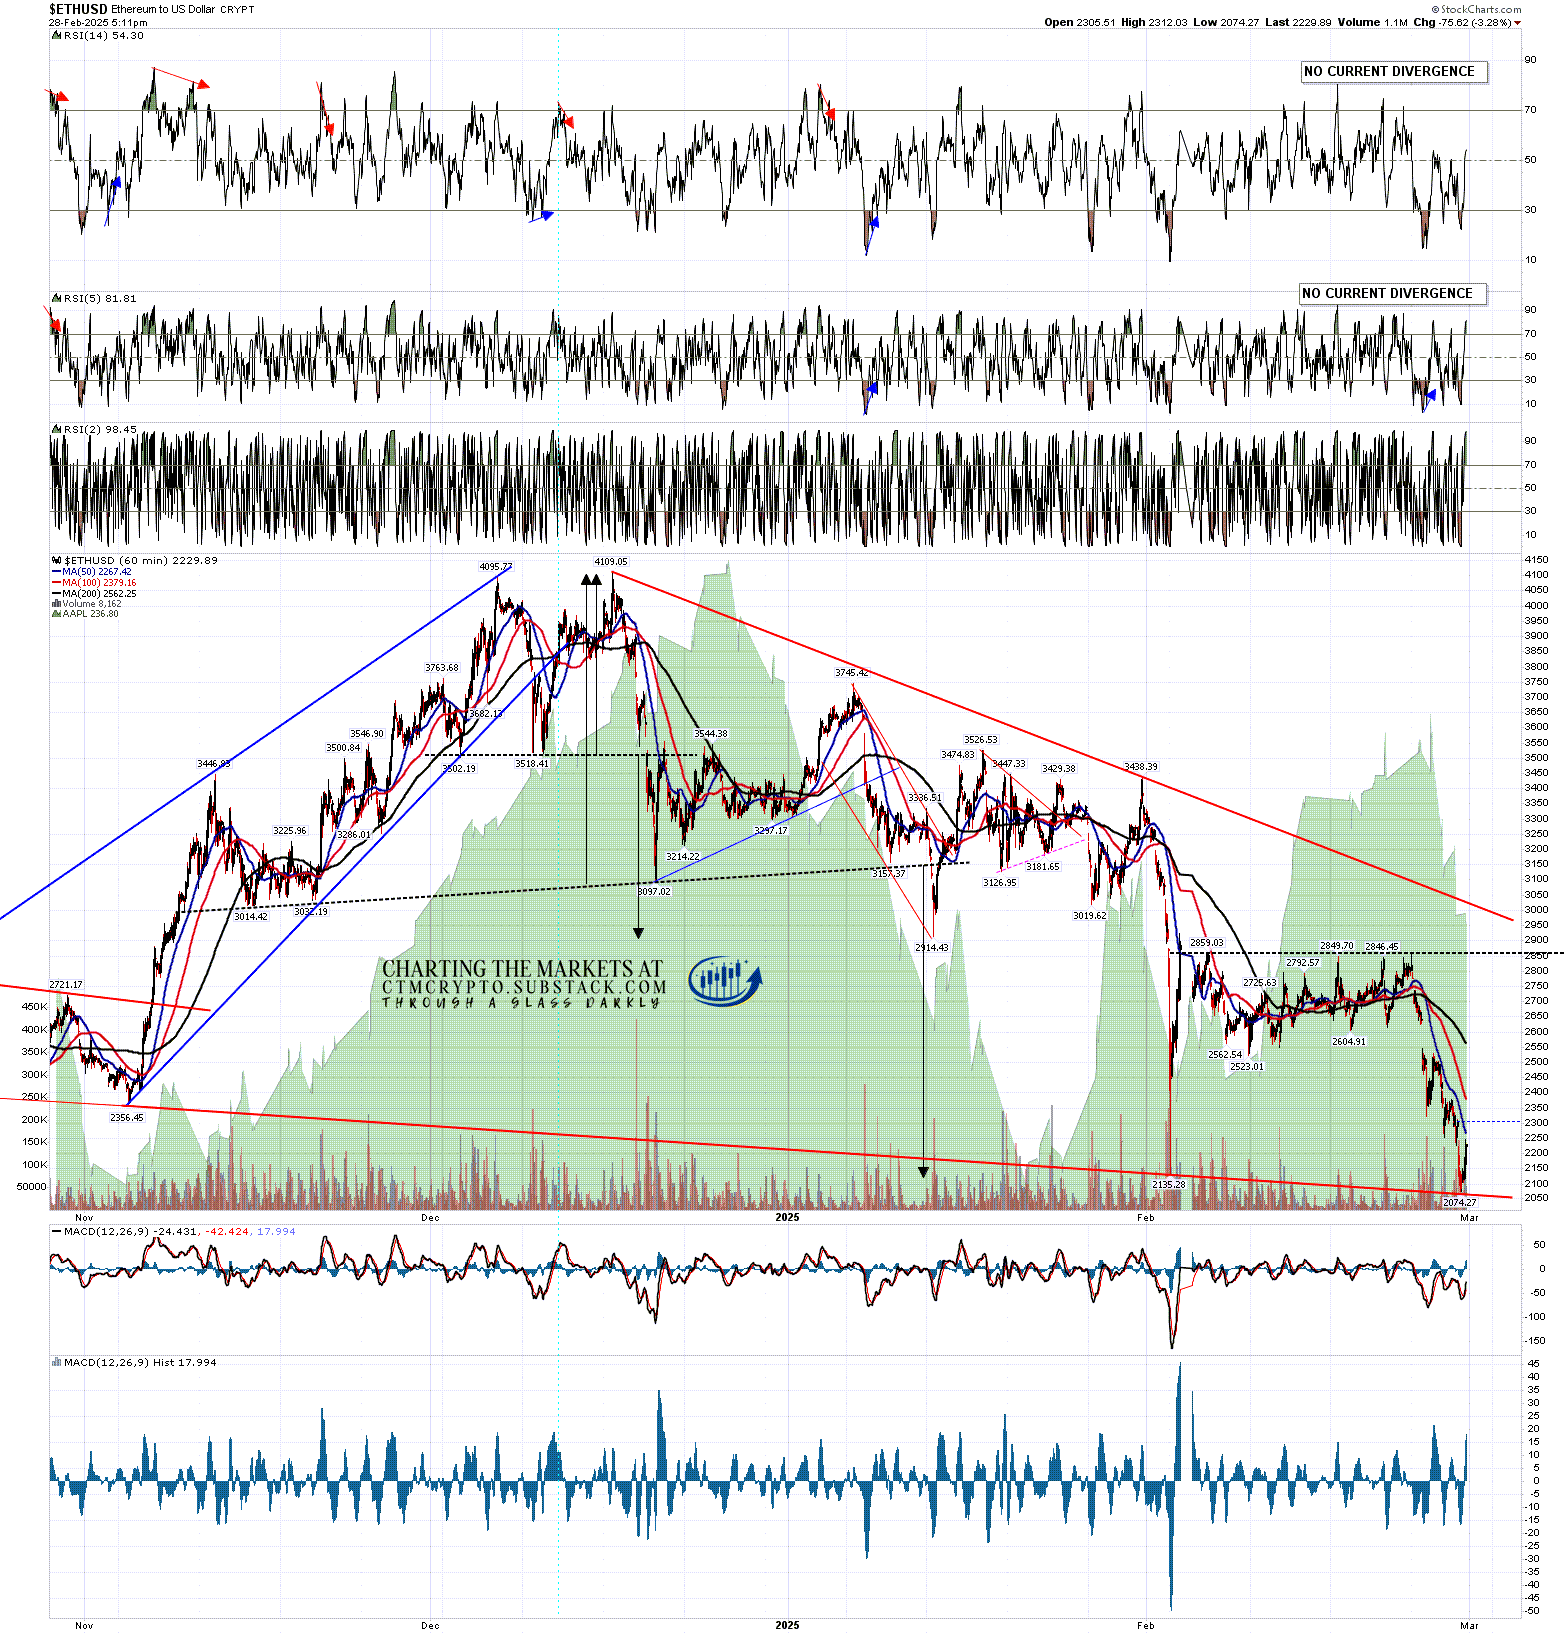
On Ethereum I was looking for a retest of the early February low at 2135.28 and we saw that last night with a lower low at 2074.27. Ethereum is still holding the 2000-2700 key support area that I’m expecting to hold and a very nice looking possible double bottom setup has now formed. On a sustained break over double bottom resistance at 2856 the double bottom target would be in the 3575 to 3635 area.
ETHUSD weekly chart:
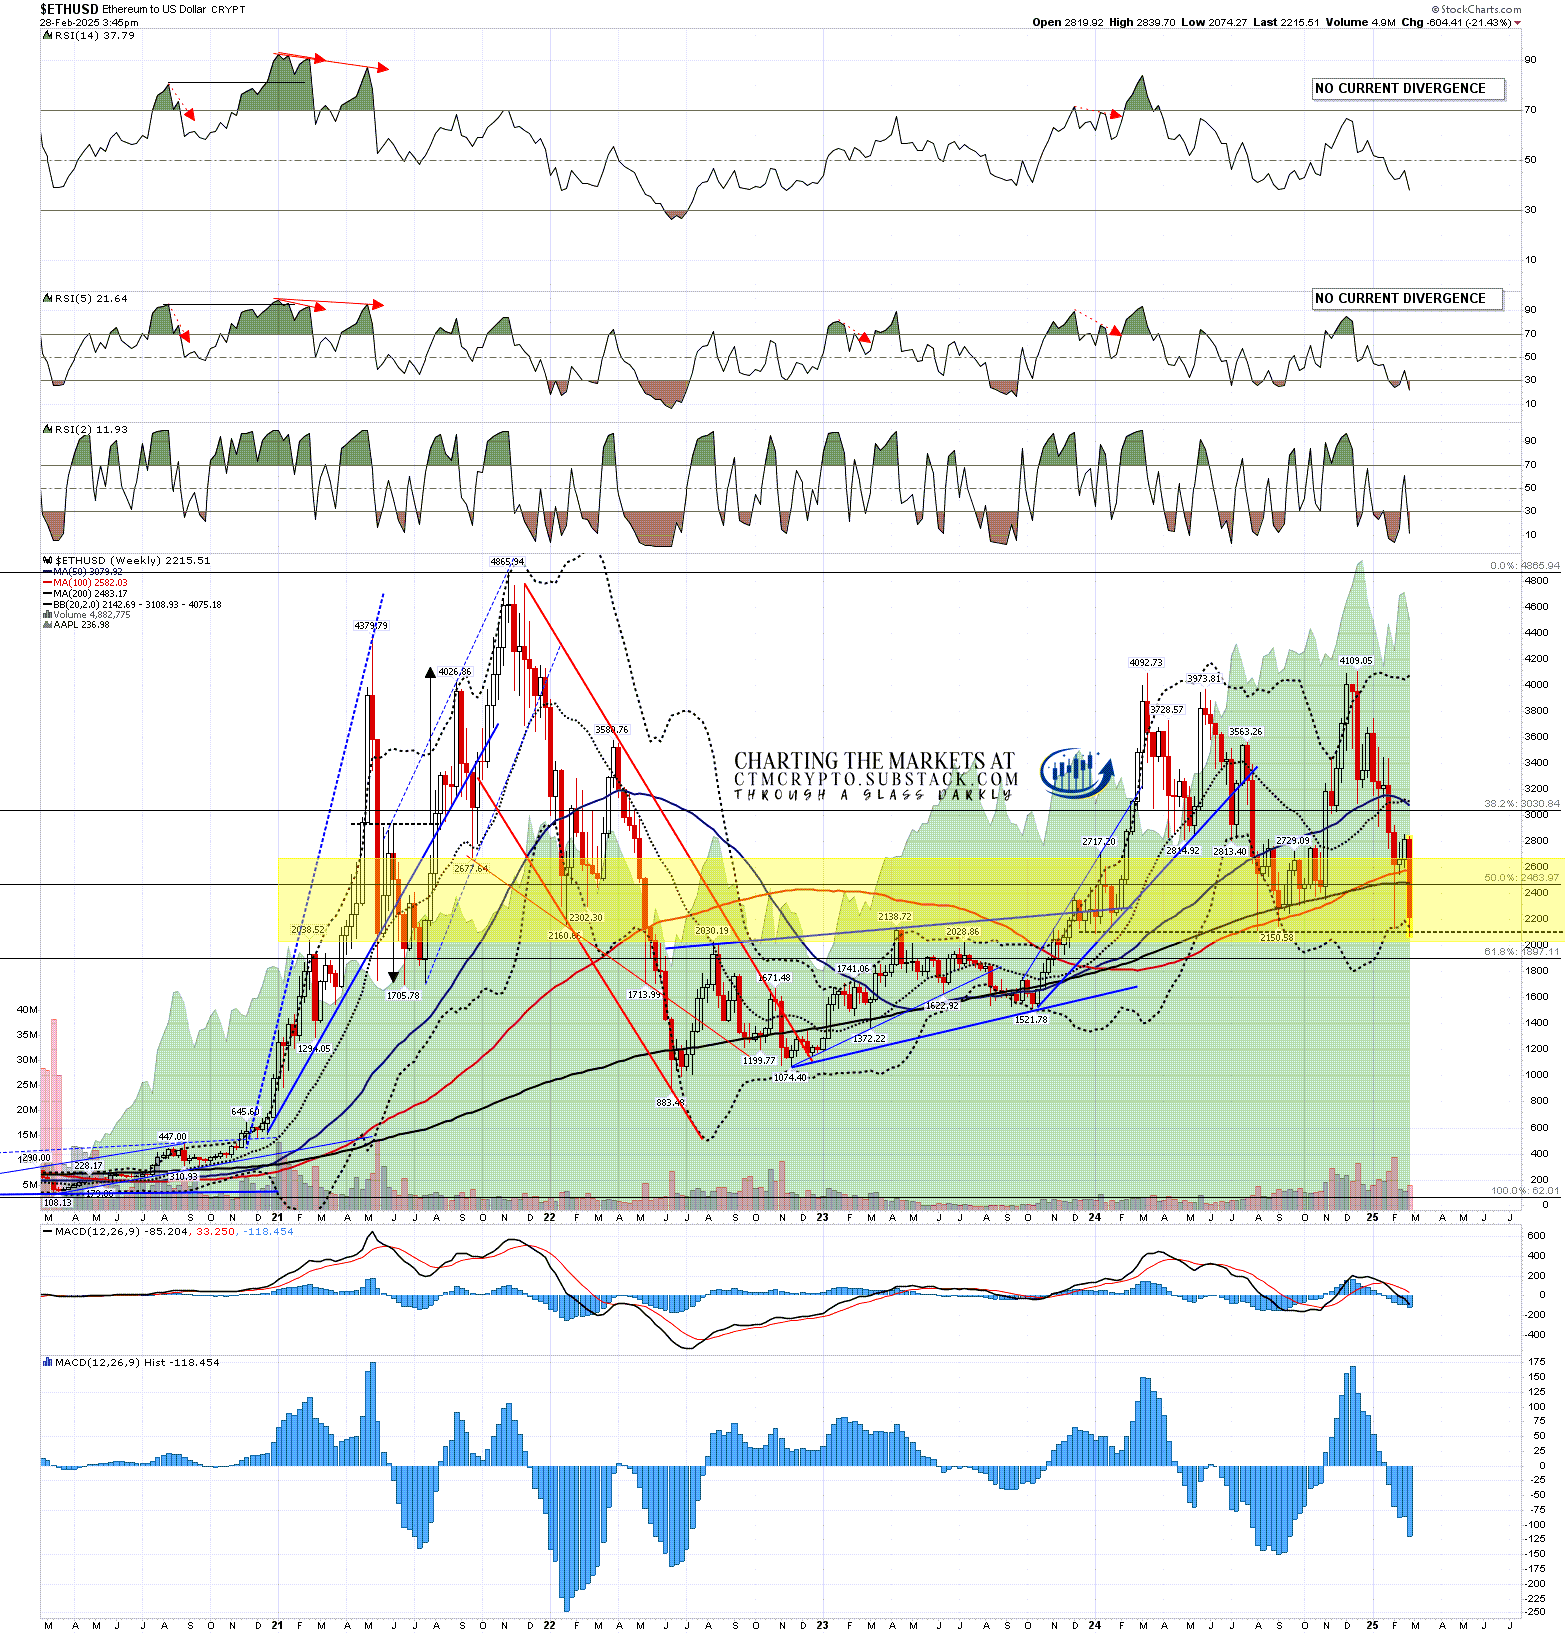
There is also a very decent looking falling wedge that has formed from the 2024 high at 4109.95 and overall this is another possible retracement low setup.
ETHUSD 60min chart:
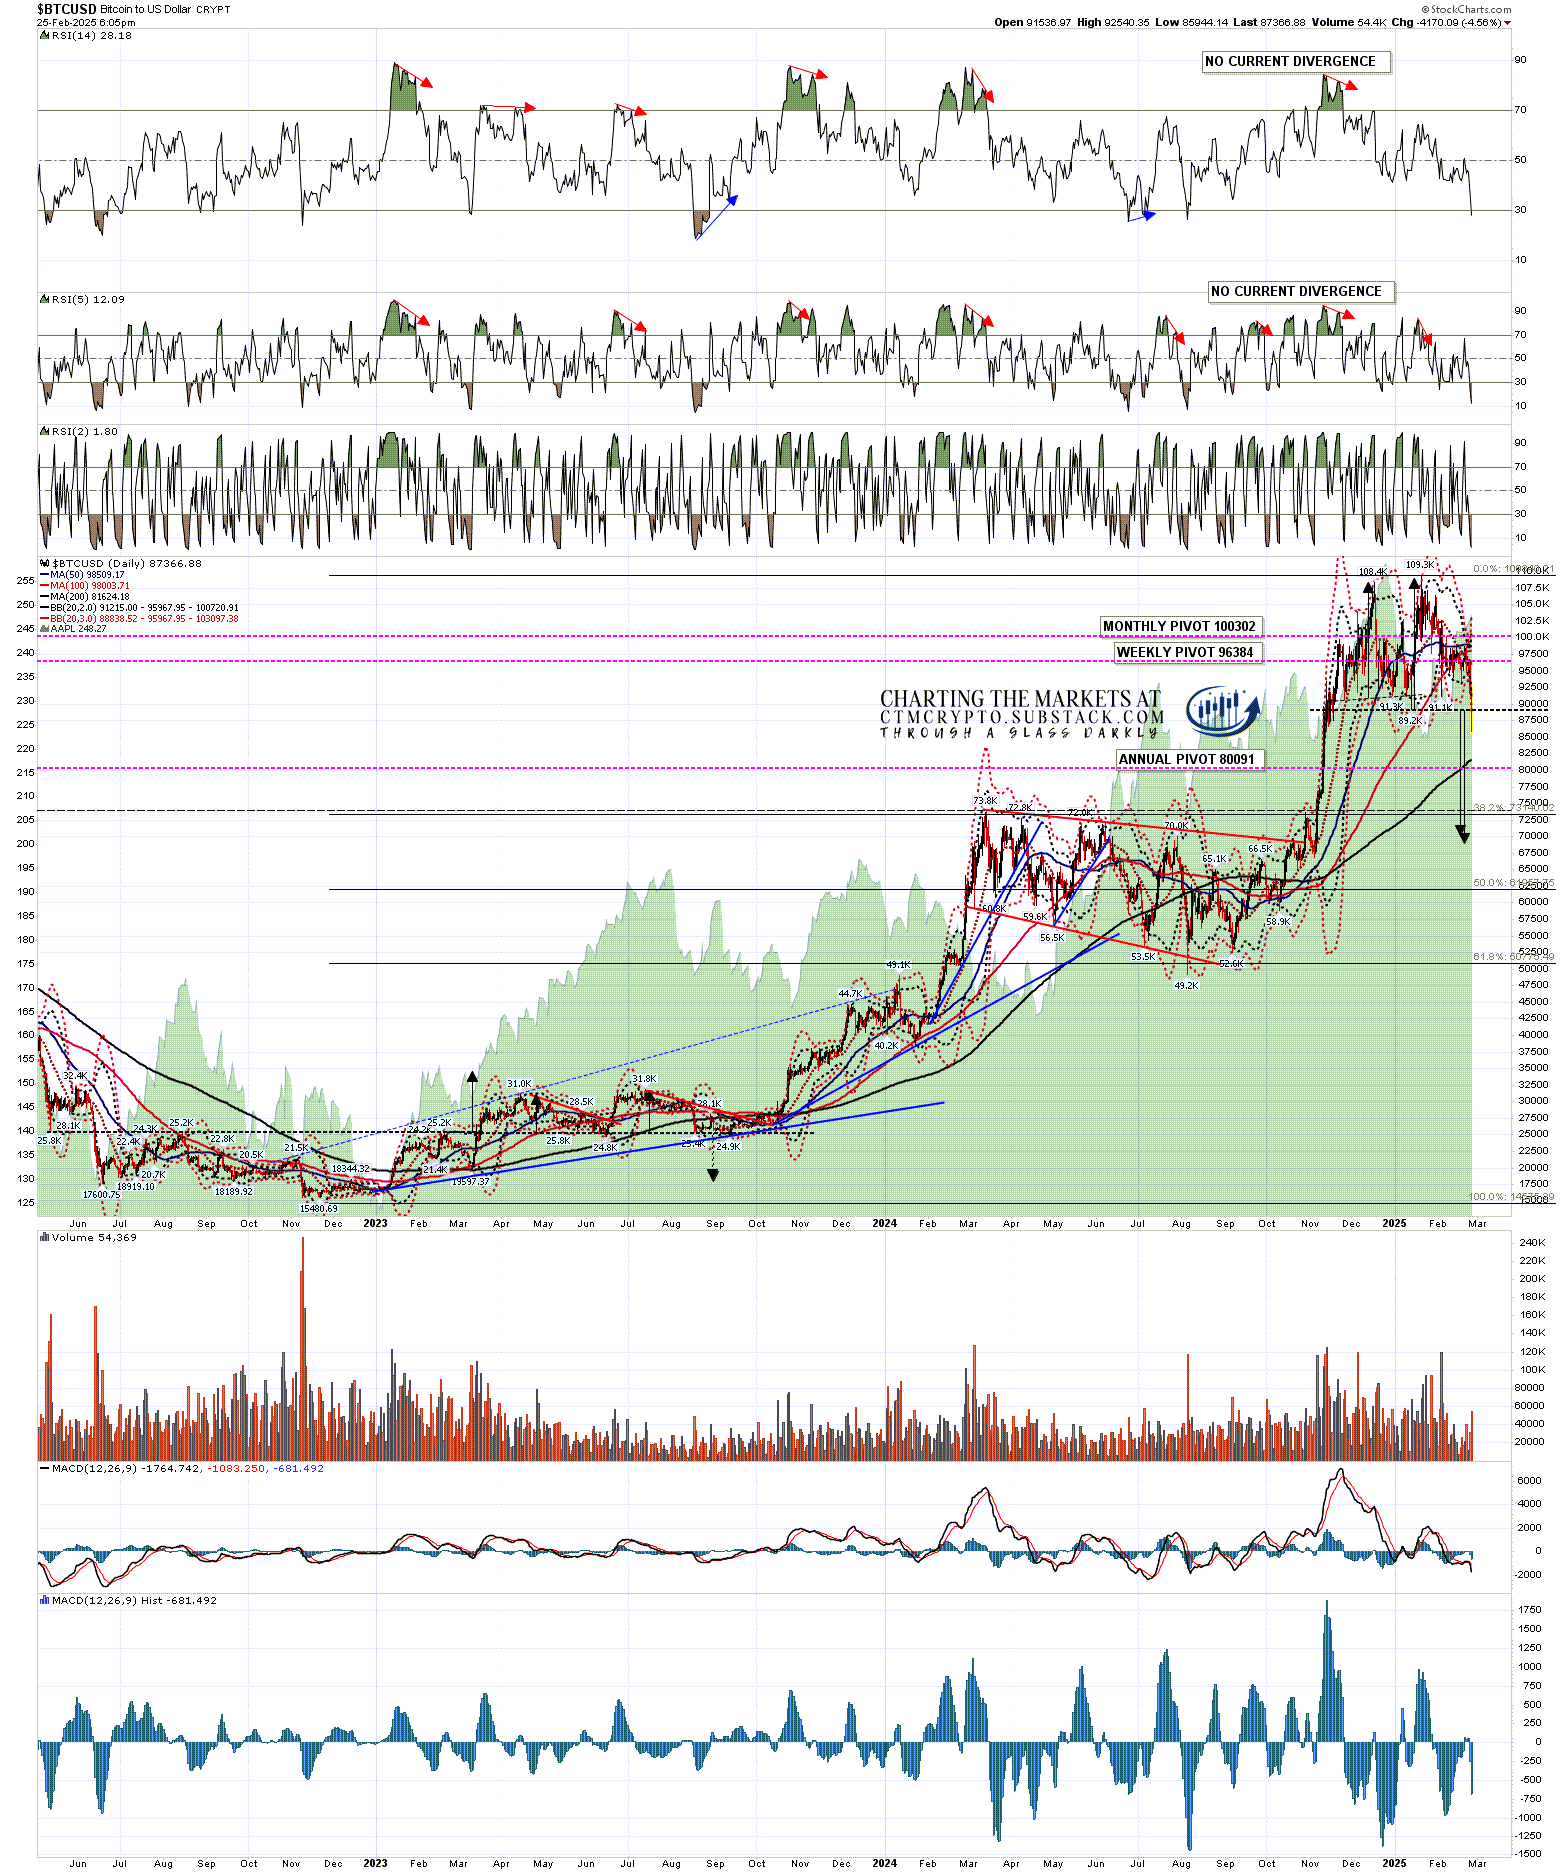
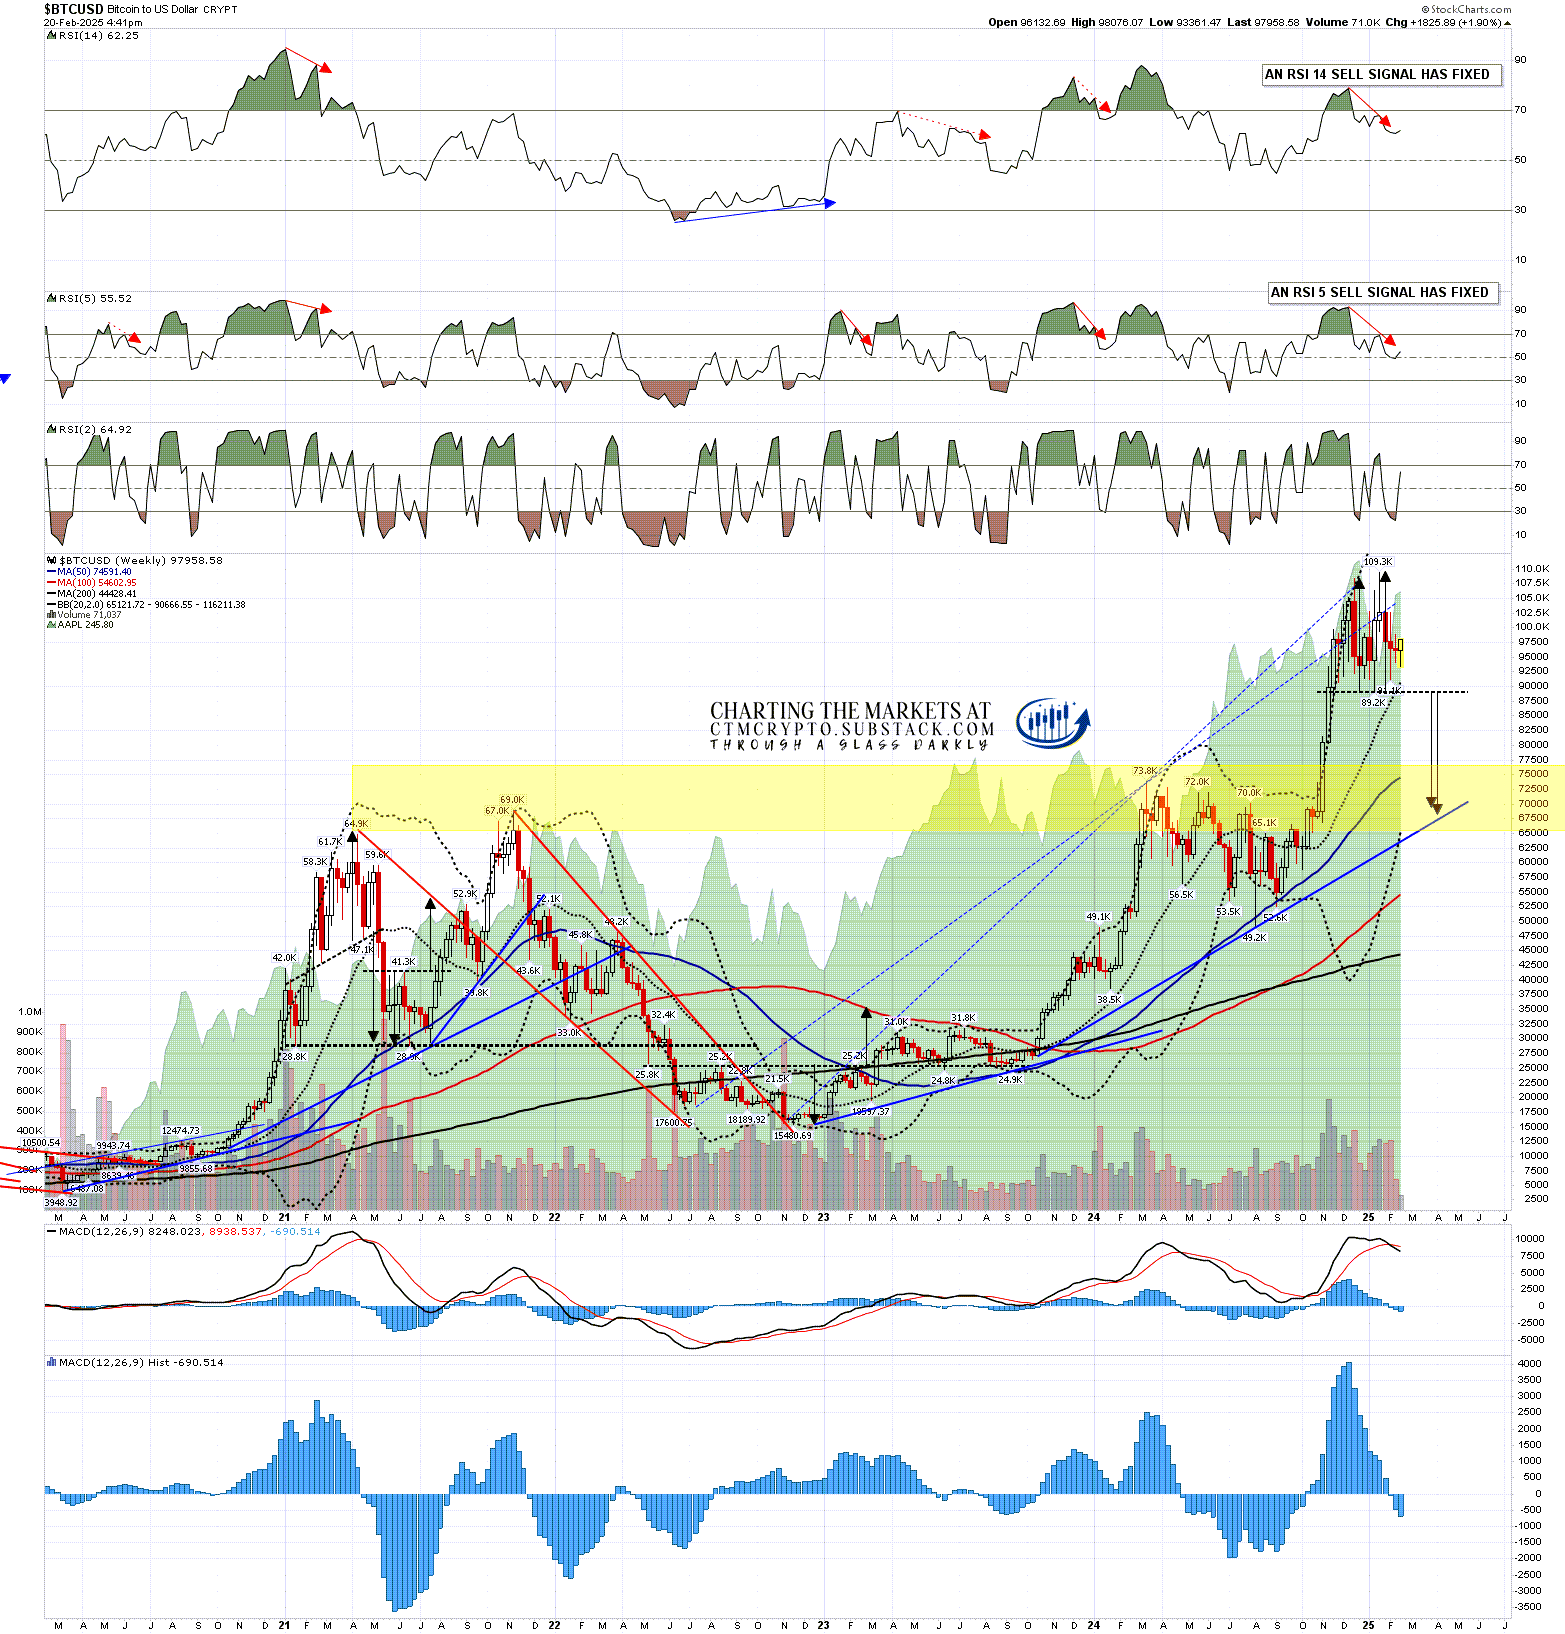
In my last post on Tuesday I was noting that the double top on Bitcoin had broken down with a target in the $69k to $70k area and, since then, Bitcoin has made a low today at $78.2k. I’m leaning towards that target being made though I would note that the 200dma is currently at 81,988.48, and that level has not yet been convincingly lost.
BTCUSD daily chart:

I’ve been promising to explain why I don’t think that the bull market on Crypto is over, and there are two main reasons.
The first reason you can see on the chart above. The retracement that is currently in progress would, if the double top target is reached, simply be a backtest of the strong resistance turned support area $65k to $74k area. Unless we see a break below that area, I don’t currently see any reason to believe that this is anything more than a bullish retracement.
The second reason you can see on the chart below, comparing the current bull market to the last two bull markets. In those two bull markets there was a clear euphoria phase that delivered the bull market highs and we haven’t yet seen that euphoria phase. Is it possible that we won’t see that? Sure, but history leads us to think that we likely will. The current all time high is just 58% above the last bull market high, and by Crypto standards that would be very slim pickings indeed for a new bull market high.
BTCUSD weekly (LOG) vs SPX chart:
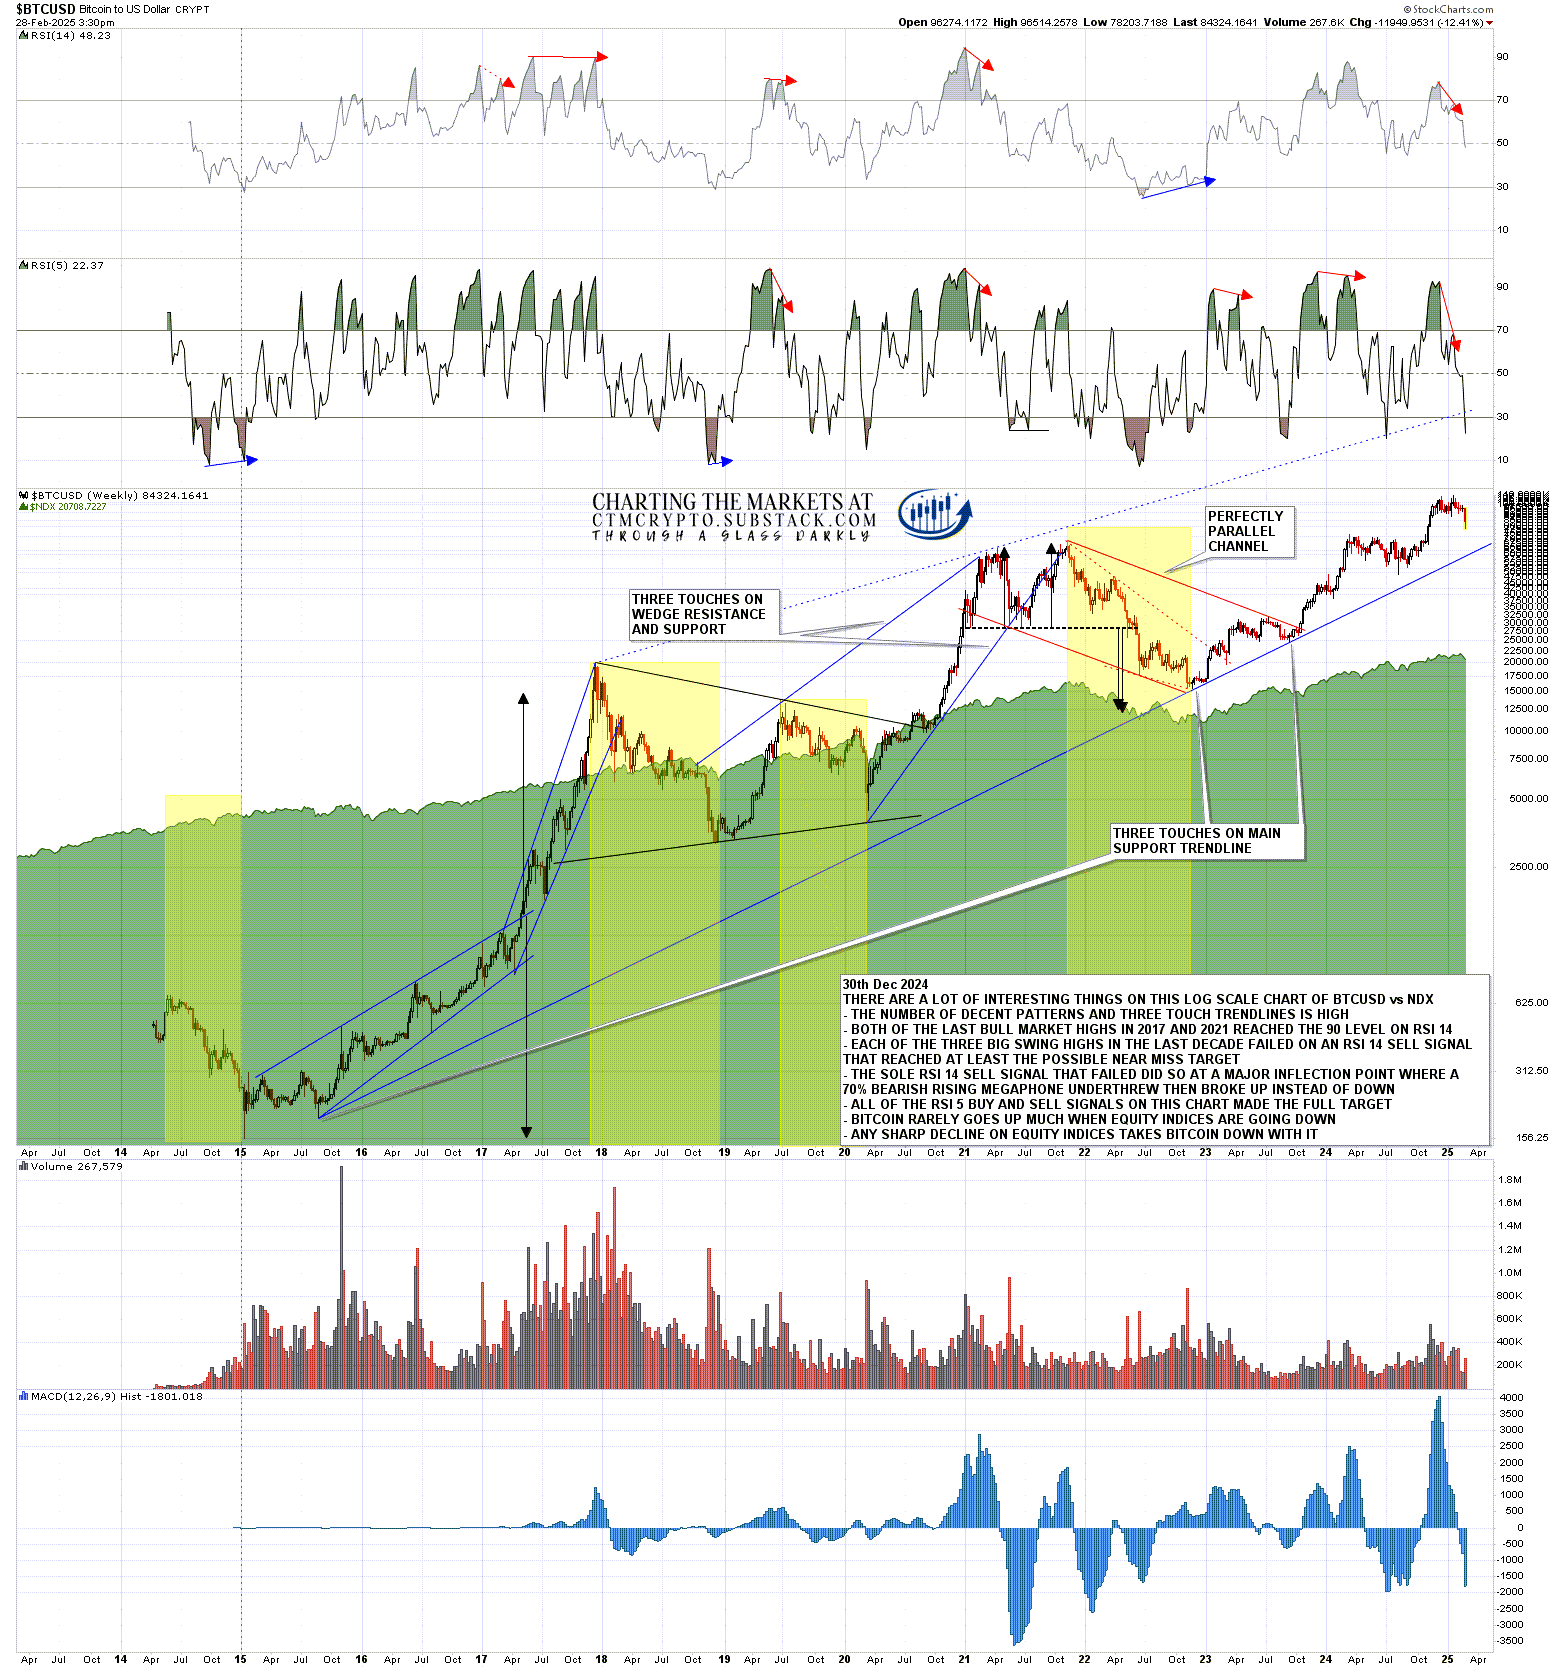
Is it possible that a big fail on equities this year could end this Crypto bull market early? Yes, but it’s too early to call that either. In December I was saying that I was expecting to see significant weakness on both Crypto and equity indices in the first half of this year and we have been seeing that, with Crypto leading that as it often has. I think we may well see more of that on both Crypto and equity indices before these retracements are finished. At the moment though. I’m still leaning towards weakness in the first half of the year and renewed strength in the second half of 2025, with a very possible bull market high on Crypto pencilled in close to the end of the year. That scenario would be a good match with past Crypto bull markets.
Is it possible that I am mistaken? Always, but we can only ever try to identify the higher probability paths in the future. Only time can show us the path that is actually taken. Still, I’m with Confucious who said ‘study the past, if you would divine the future’. Everyone have a great weekend :-)
If you’d like to see more of these posts and the other Crypto videos and information I post, please subscribe for free to my Crypto substack. I also do a premarket video every day on Crypto at 9.05am EST. If you’d like to see those I post the links every morning on my twitter, and the videos are posted shortly afterwards on my Youtube channel.
I'm also to be found at Arion Partners, though as a student rather than as a teacher. I've been charting Crypto for some years now, but am learning to trade and invest in them directly, and Arion Partners are my guide around a space that might reasonably be compared to the Wild West in one of their rougher years.