In my post on Monday 10th Feb I was looking at the bull flag setups on SPX and QQQ and the historically bullish lean through Tuesday 18th Feb and was projecting that we might well see retests of the all time highs on SPX and QQQ in that bullish window. We saw those all time high retests on QQQ on Friday 14th Feb and on SPX on Tuesday 18th Feb.
In my post on Wednesday 19th Feb I was looking at the very nice looking topping setups on SPX, QQQ and DIA and the historically bearish lean through Friday 28th Feb and suggesting that if these patterns were going to deliver, then this bearish window would be a good time to get started on that.
Are we going to see these topping setups deliver? Very possibly I think. Trump and his administration are disruptors and will likely be shaking a lot of trees this year. They have already made a very strong start on that and look set to continue. Many of those trees likely need a good shake, but disruption delivers uncertainty and markets tend to not like uncertainty.
Depending on what is next we could well see significant spikes in inflation (tariffs), unemployment (federal government layoffs) and interest rates (inflation) in coming months and in my view the chances of seeing significant bond market disruption (planned tax cuts) this year are high and the odds of seeing a recession (unemployment & interest rates) start this year are far from insignificant. Trump was saying that there might well be some pain this year and I entirely agree. Some of that pain may well feed through into equity markets.
As we are here, equities look very fully valued, we have just finished two very strong years on equity markets, Warren Buffett has been selling into strength for months and, as I mentioned, markets historically don’t like uncertainty.
After the sharp decline on Friday we would normally see a rally. That rally might take us back to new highs, but more likely I suspect it lasts a day or three and then follows through to the downside. I’m not looking at that in detail here but if you’d like to see that explained I covered that in detail in my The Bigger Picture webinar last night and you can see that here.
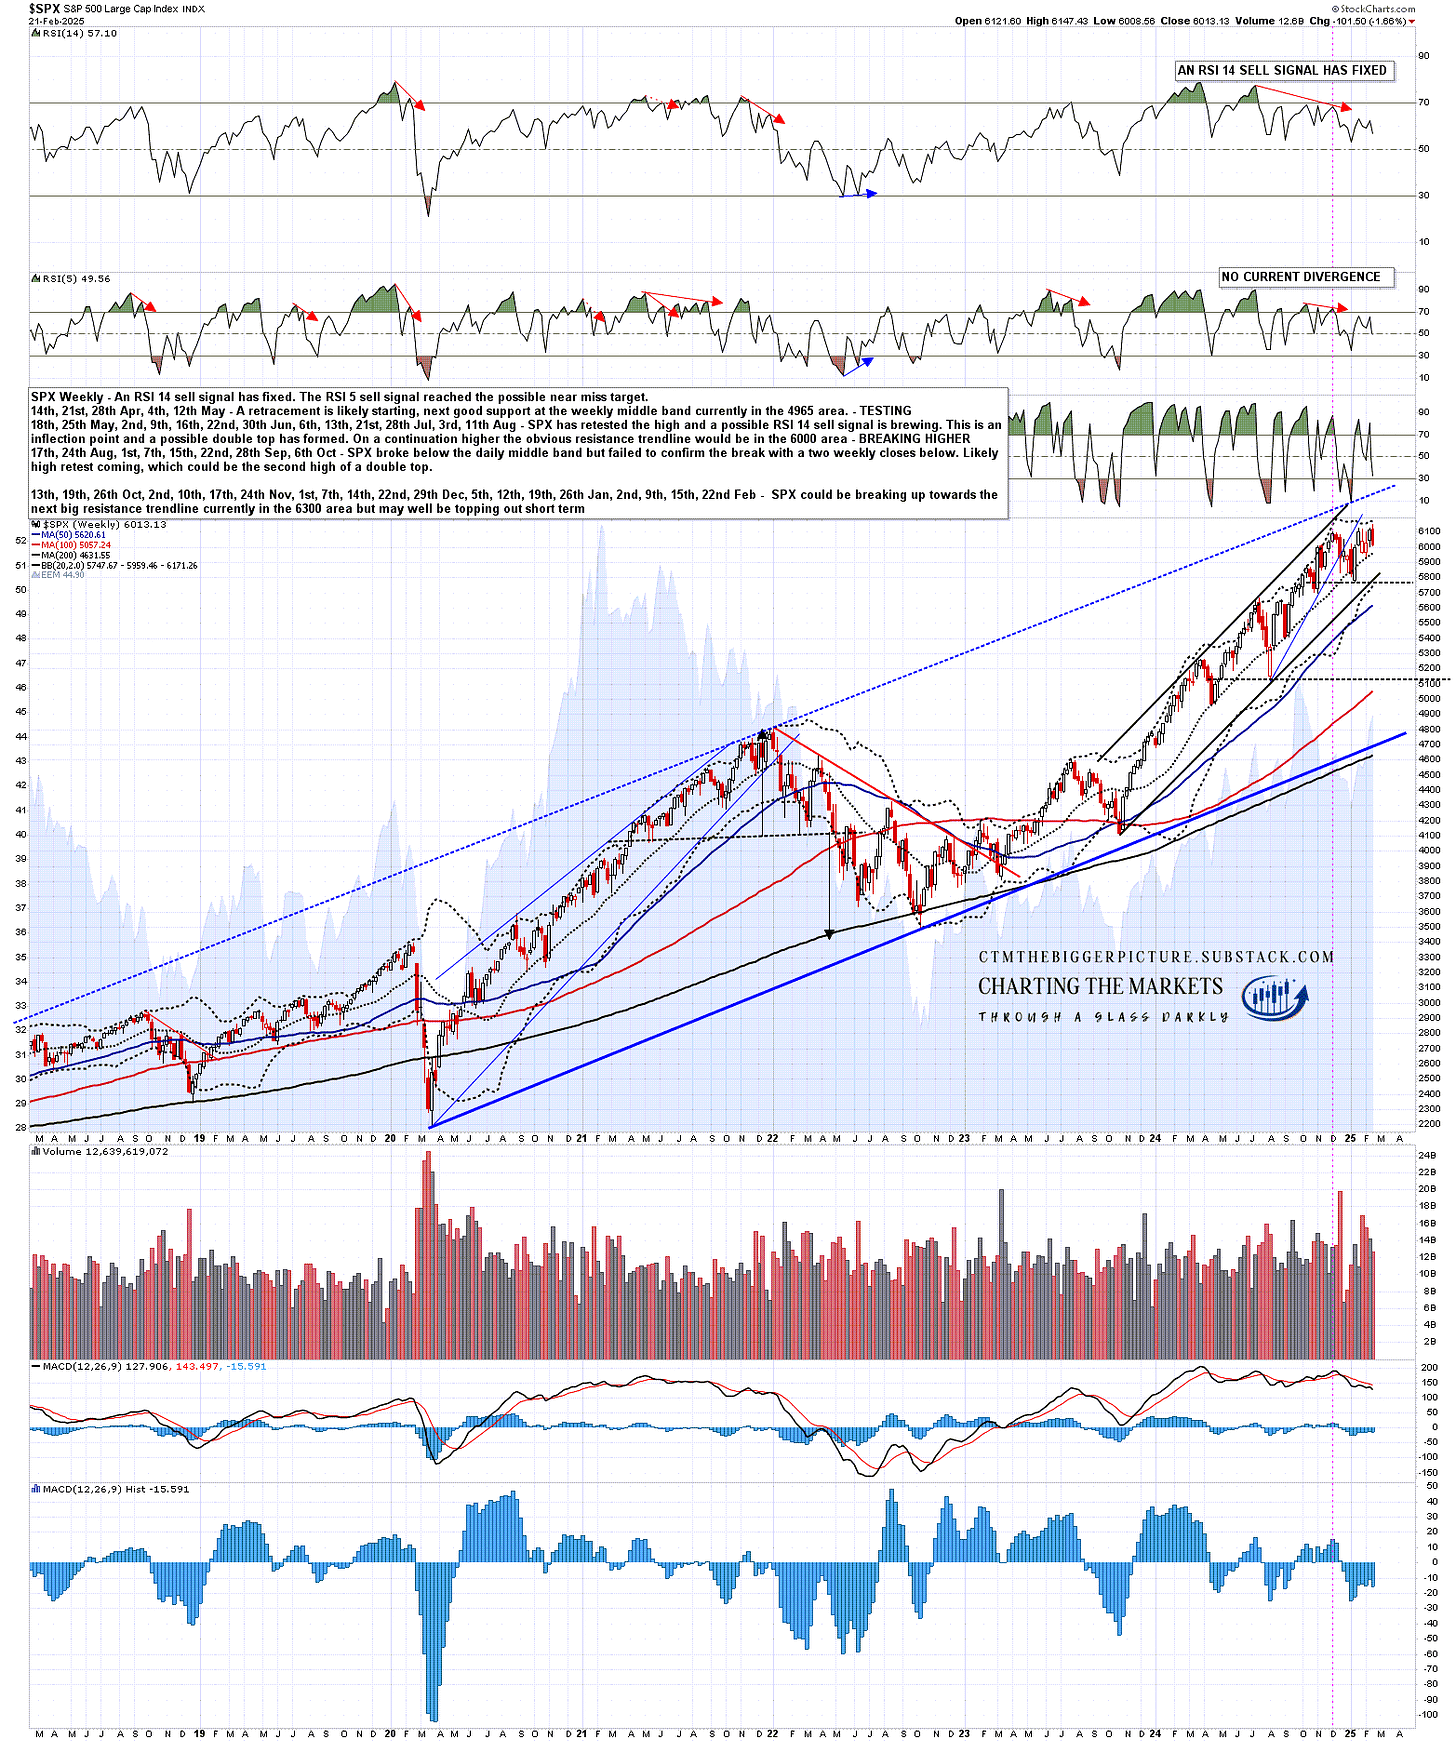
On the (small caps) bigger picture here there was a clear bearish engulfing candle on SPX last week, and you can see on the chart below that these are seen regularly at significant highs. On the chart below the obvious examples are the highs in Jan and Oct 2018, Jan 2022, July 2023 & July 2024. Not an entirely reliable indicator but those were all significant highs delivering declines of at least 5%.
SPX weekly chart:
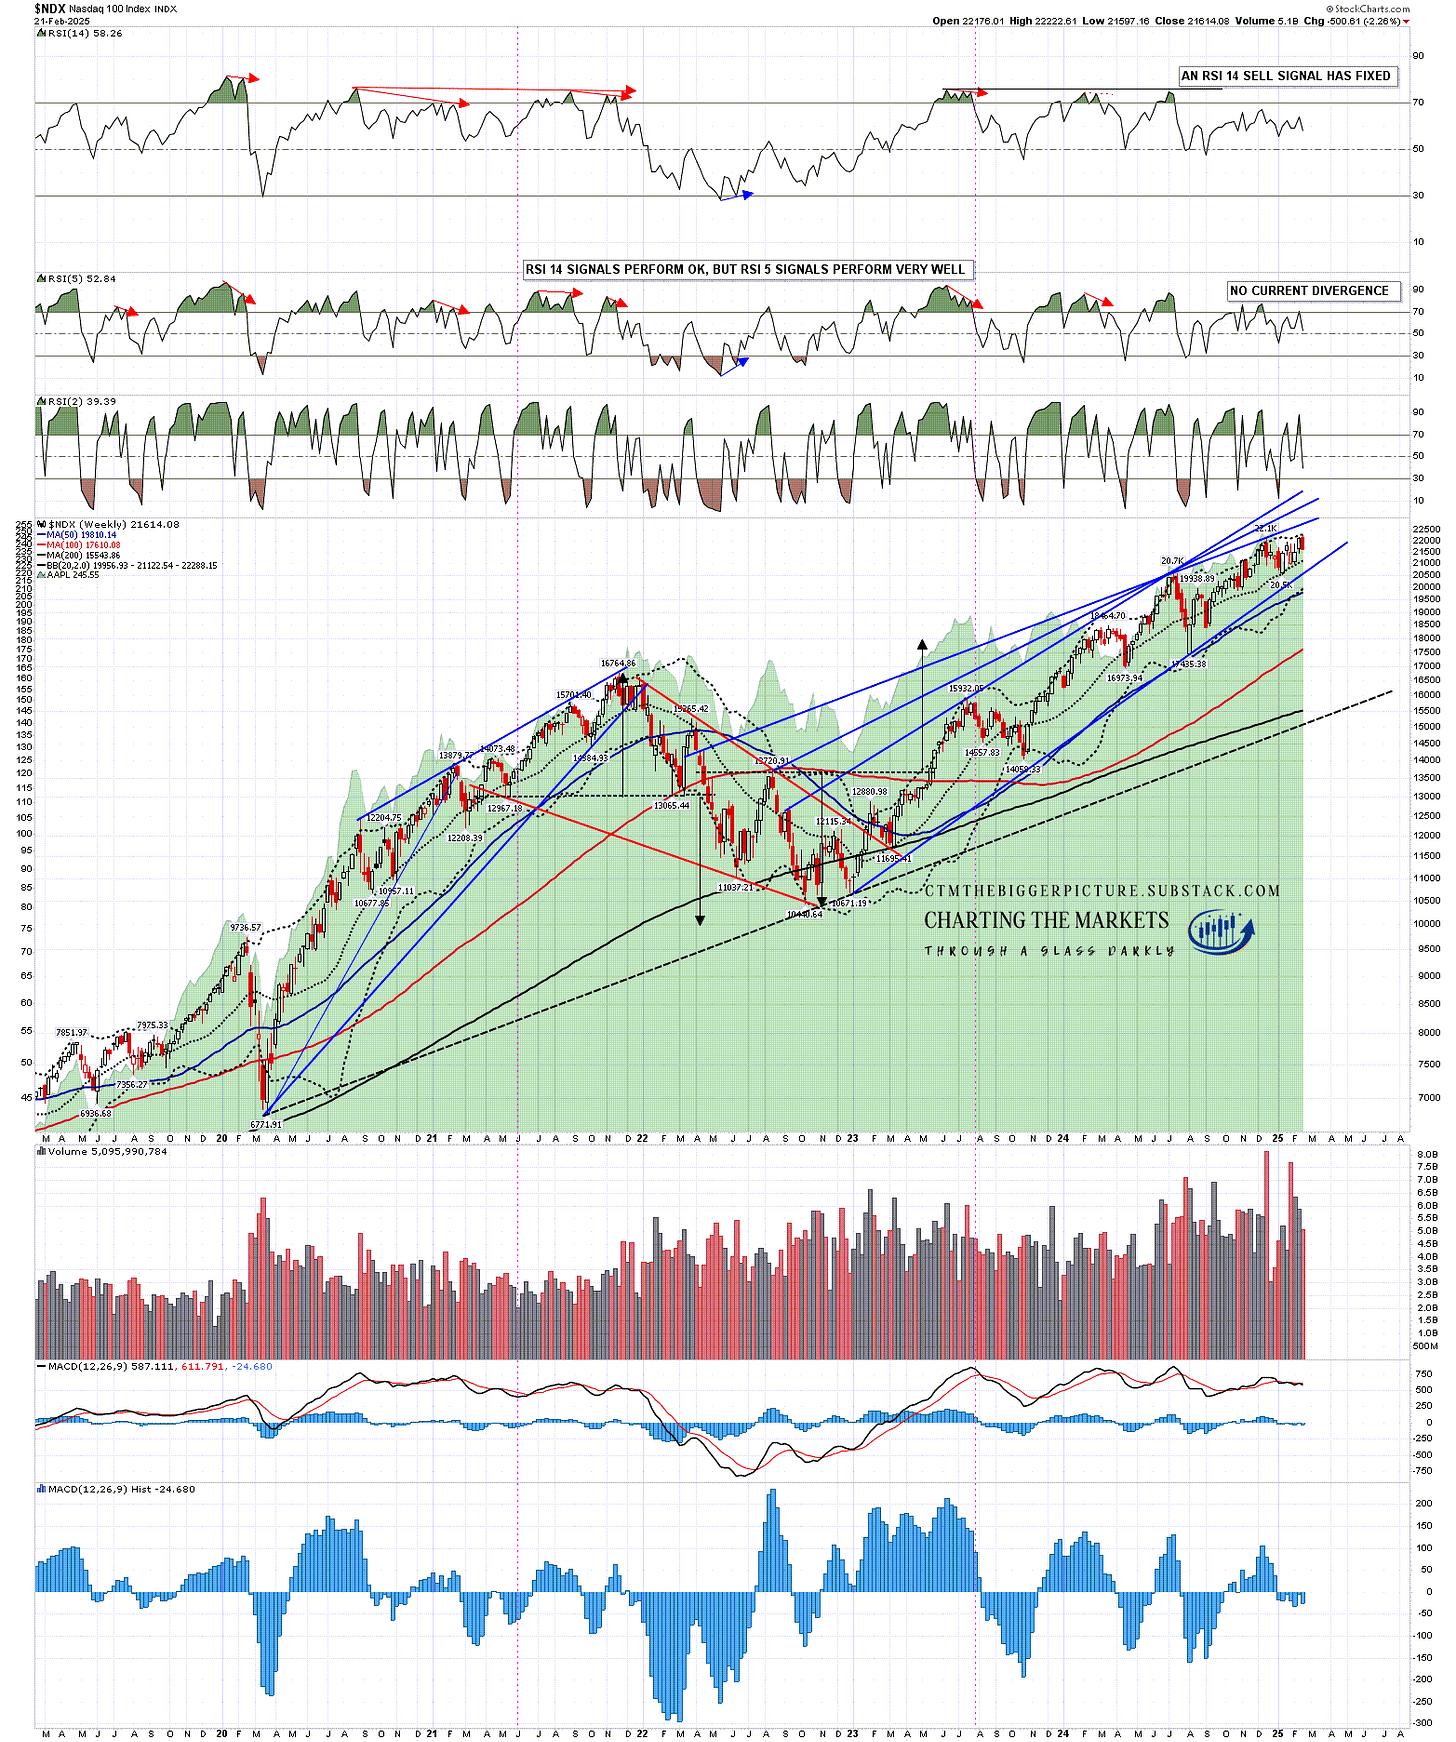
On the (small caps) bigger picture here there was also a clear bearish engulfing candle on NDX last week (I use NDX for the weekly and monthly charts rather than QQQ), and you can see on the chart below that these again are seen regularly at significant highs, though not as often as on SPX. On the chart below the obvious examples are the highs in Oct 2018 (not shown), Nov 2021, April 2022, & Dec 2024. Not an entirely reliable indicator again but those were all significant highs delivering declines of at least 5%.
NDX weekly chart:
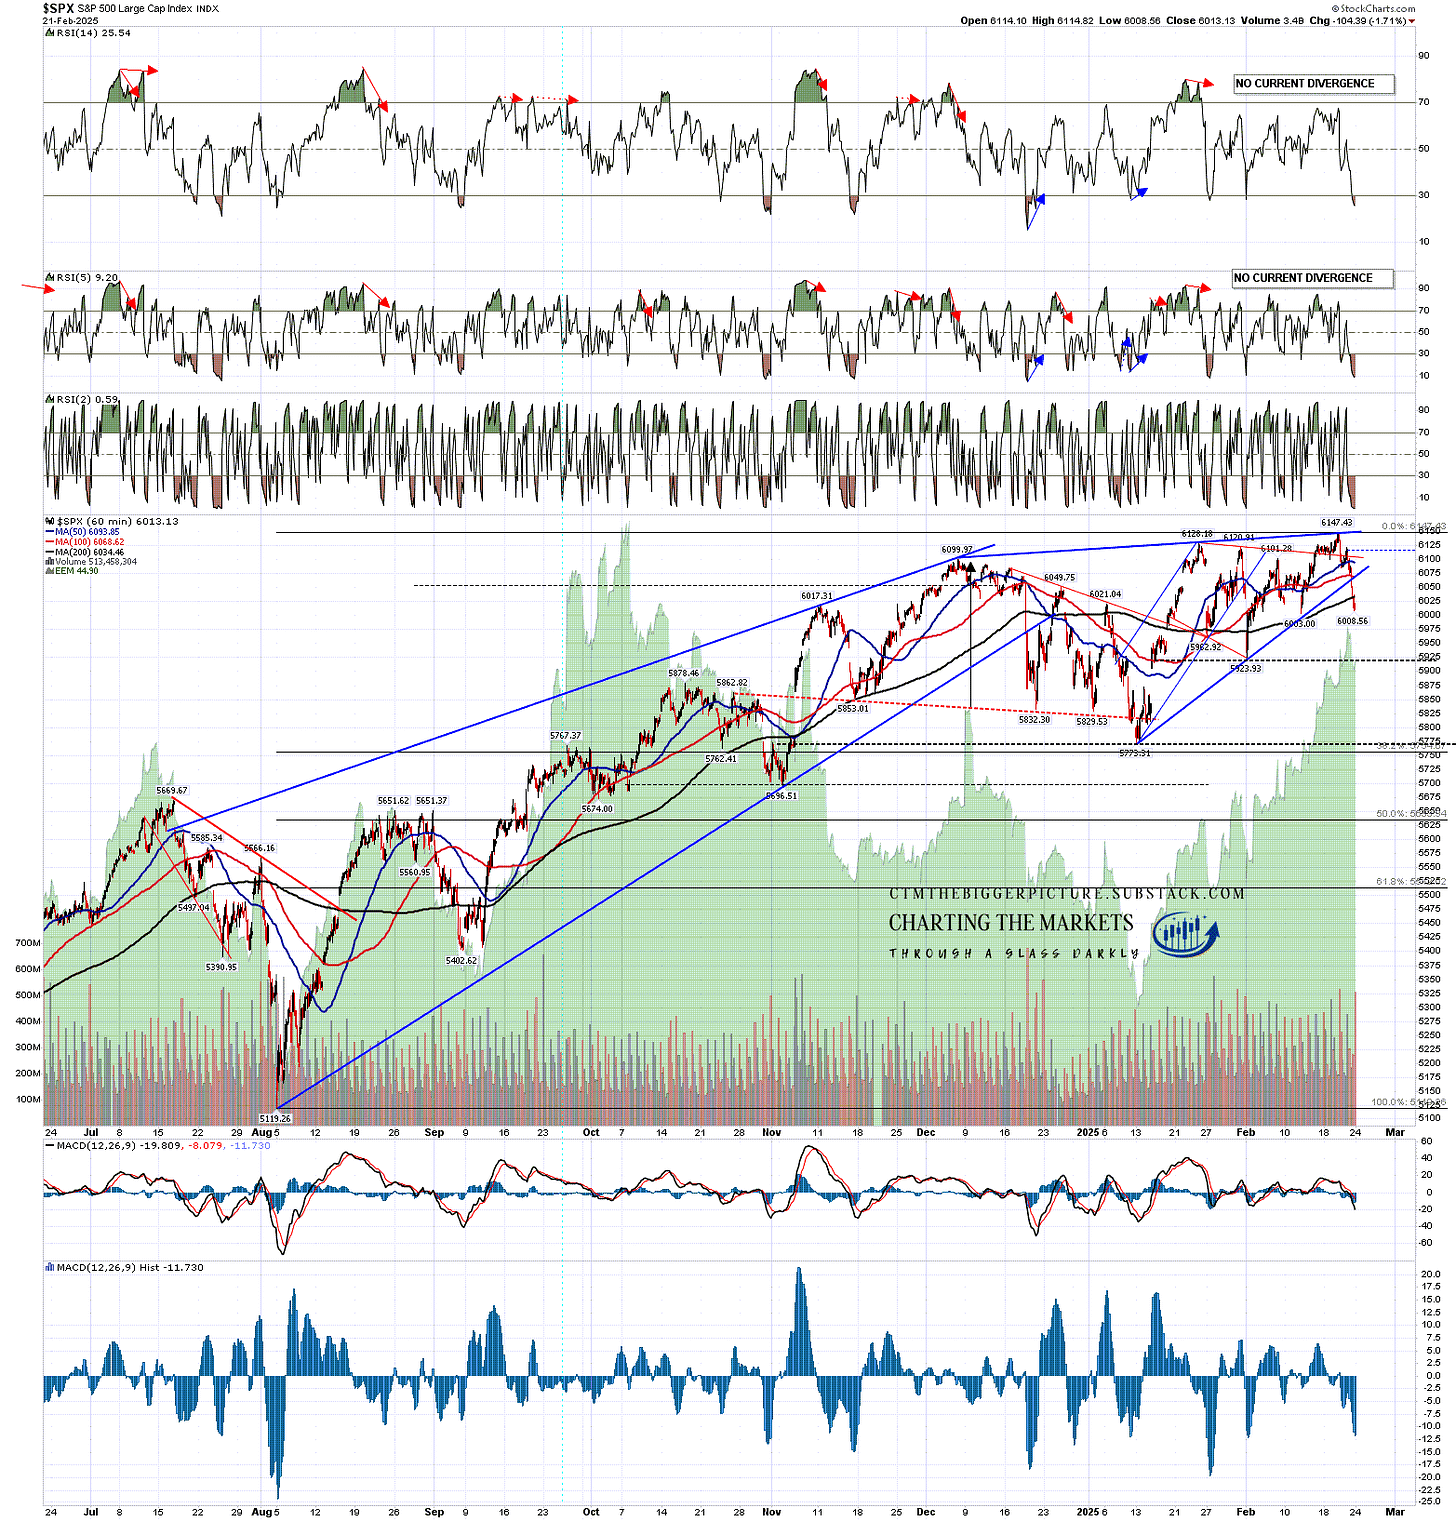
Looking again at the high quality topping setups I was looking at in my last post, rising support from the January low broke on SPX on Friday and the nested double top setup there is as follows:
On the first and smaller double top setup a sustained break below 5923.93 would look for a target in the 5720 area.
On the second and larger double top setup a sustained break below 5773.31 would look for a target in the 5418 - 5447 area.
If this full nested double top setup delivers this retracement would retrace a bit more than 61.8% of the rising wedge from the August low at 5119.26 and this might well just be a bullish retracement before the all time high is retested.
SPX 60min chart:
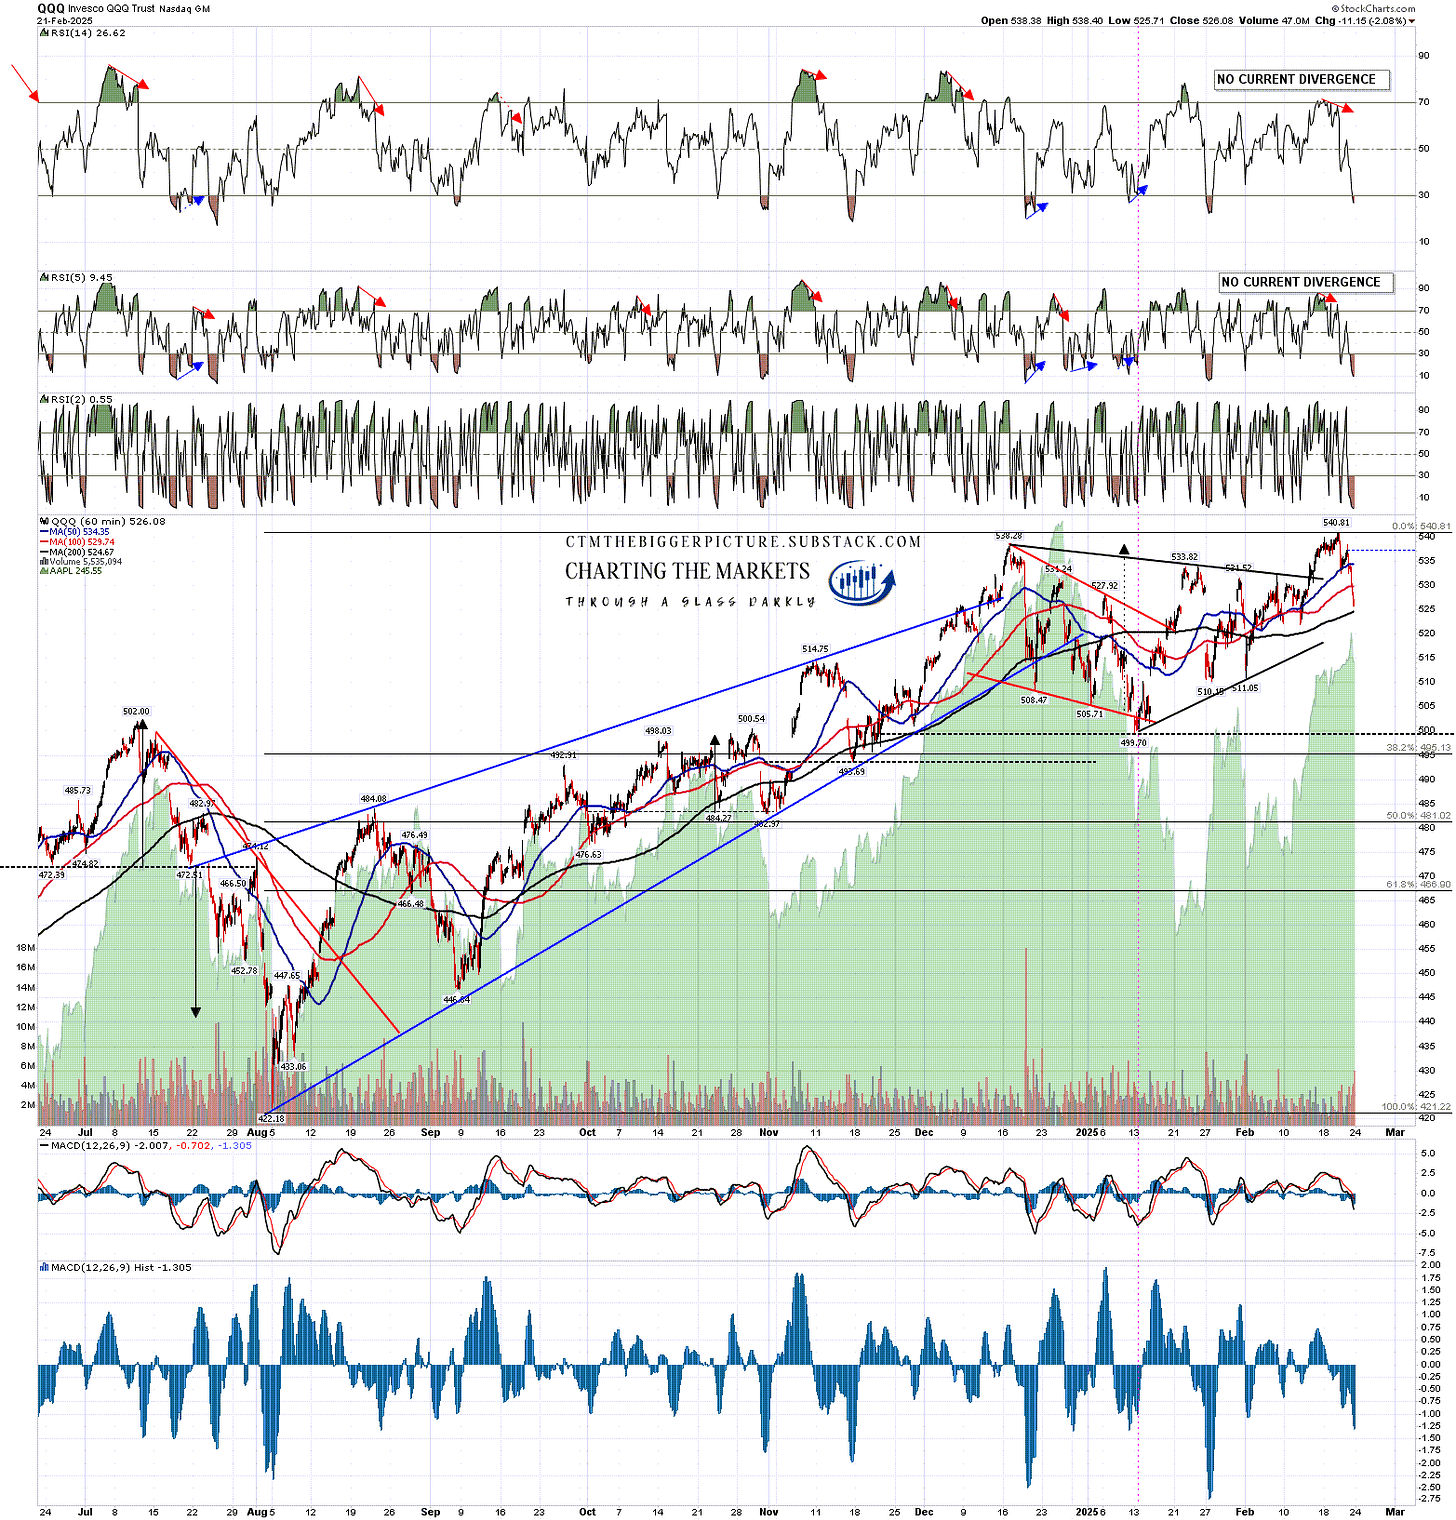
On QQQ the new all time high set up a high quality double top. A sustained break below 499.70 would fix a double top target in the 459.40 to 461.10 range.
If this setup delivers this retracement would retrace a bit more than 61.8% of the rising wedge from the August low at 422.18 and this might well just be a bullish retracement before the all time high is retested.
QQQ 60min chart:
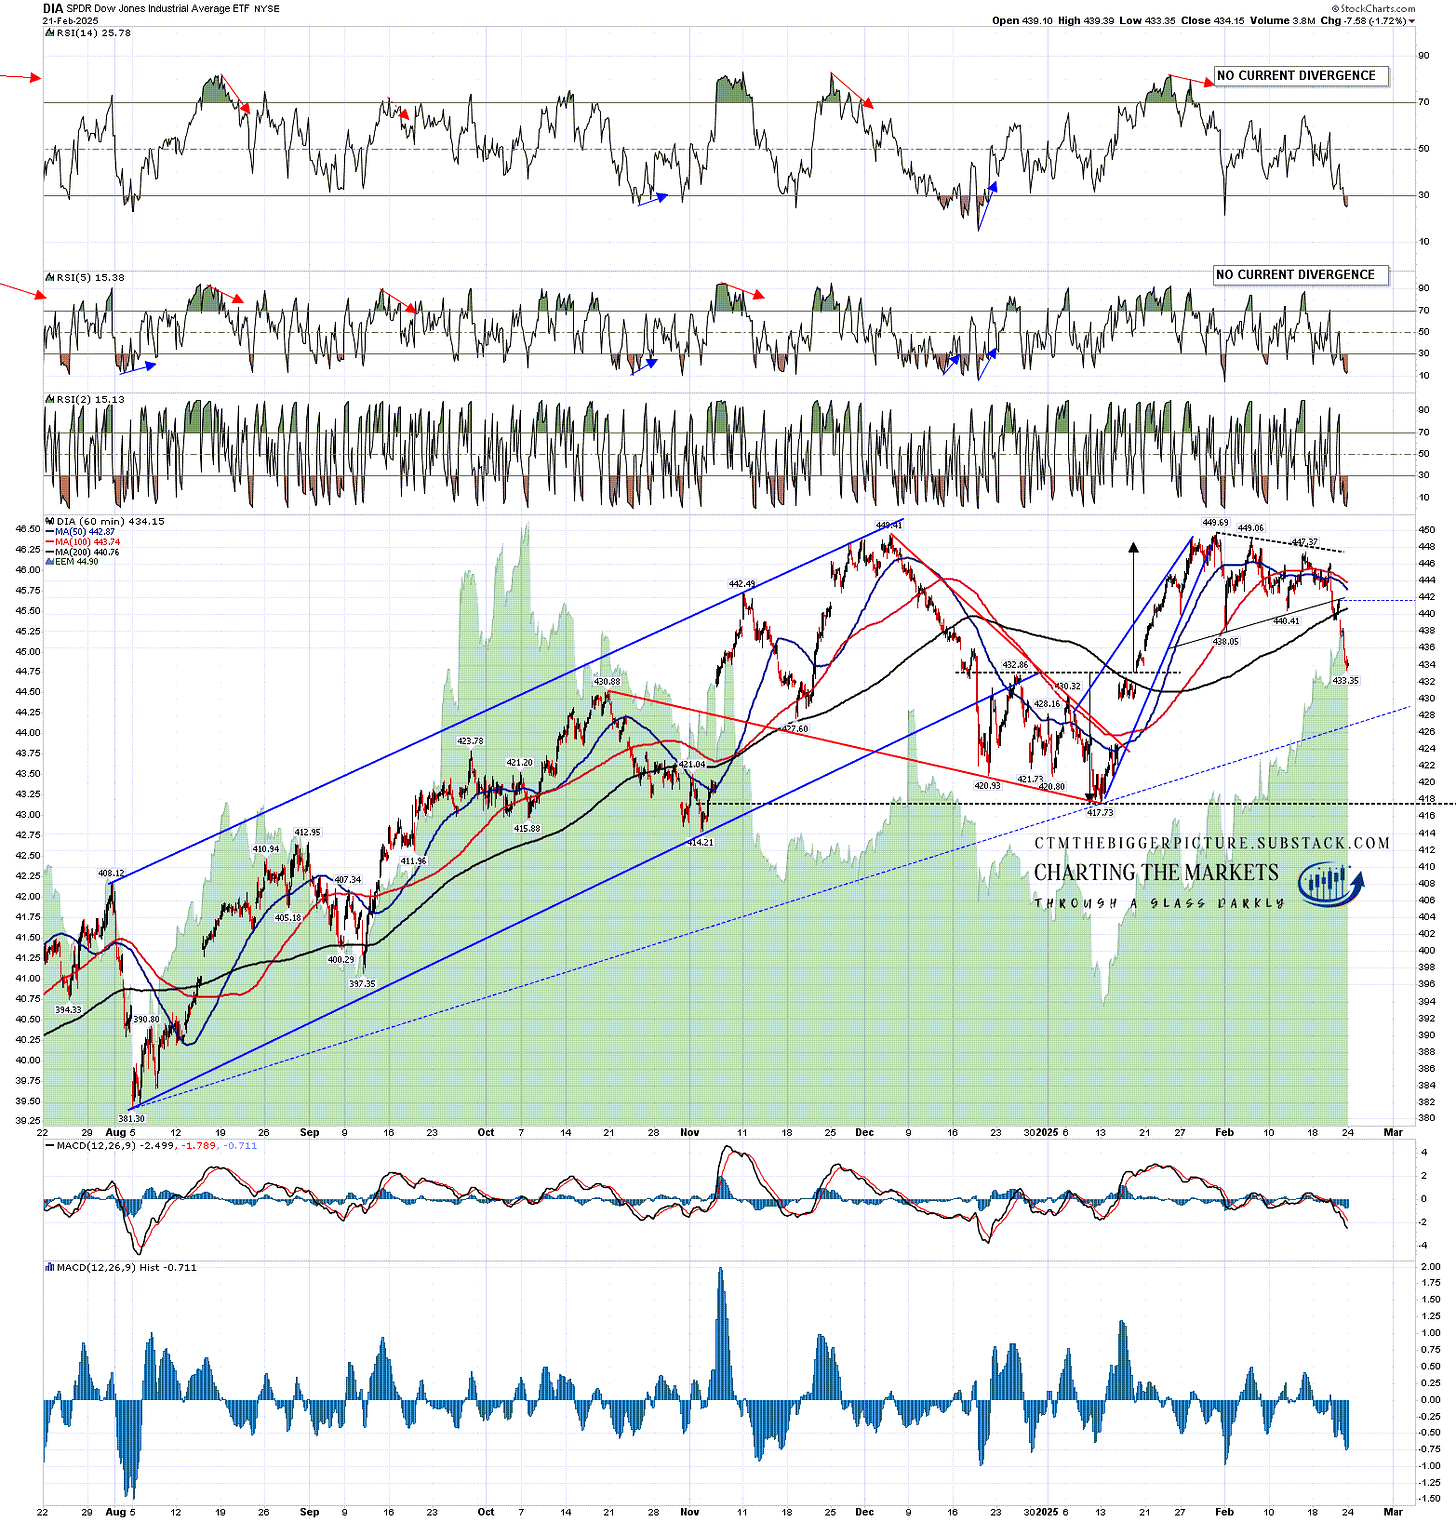
There is also a high quality double top setup on DIA, and on a sustained break below 418.35 the double top target would be in the 386/7 area, almost a full retracement of the rising wedge on DIA from the August low at 381.87 and this nonetheless might well just be a bullish retracement before the all time high is retested.
DIA 60min chart:
On IWM there is still an open high quality double top target in the 206 to 209.5 area, and a possible larger H&S forming that isn’t of the same high quality but I’ll still be watching with interest.
There are now therefore high quality topping patterns across the board on SPX, QQQ, DIA and IWM. In fact I can’t remember seeing all four of these have topping patterns of this high quality in the last twenty years. We’ll see whether those can deliver & I think they have a real shot at doing that.
I’m still leaning on the bigger picture towards a weak first half of 2025 and new all time highs later in the year, very possibly as a topping process for a much more significant high. One way or another I think we’ll be seeing lower soon and I’m not expecting this to be a good year for US equities, not least because both of the last two years have been banner years for US equities. A third straight year of these kinds of gains looks like a big stretch. I could of course however be mistaken. Everyone have a great weekend. :-)
If you like my analysis and would like to see more, please take a free subscription at my chartingthemarkets substack, where I publish these posts first. I also do a premarket video every day on equity indices, bonds, currencies, energies, precious commodities and other commodities at 8.45am EST. If you’d like to see those I post the links every morning on my twitter, and the videos are posted shortly afterwards on my Youtube channel.

No comments:
Post a Comment