
In my premarket video on Friday I was noting the four hourly sell signals fixed (3x) or forming (1x) on ES, NQ, RTY and DAX and saying that we might well see a retracement day. We saw that and all those signals reached target by the end of the day.
In my The Bigger Picture video yesterday I was looking at the support backtests seen on Friday and was looking at the bullish looking setups on SPX and QQQ particularly. So far that looks as though it may be delivering so let’s review.
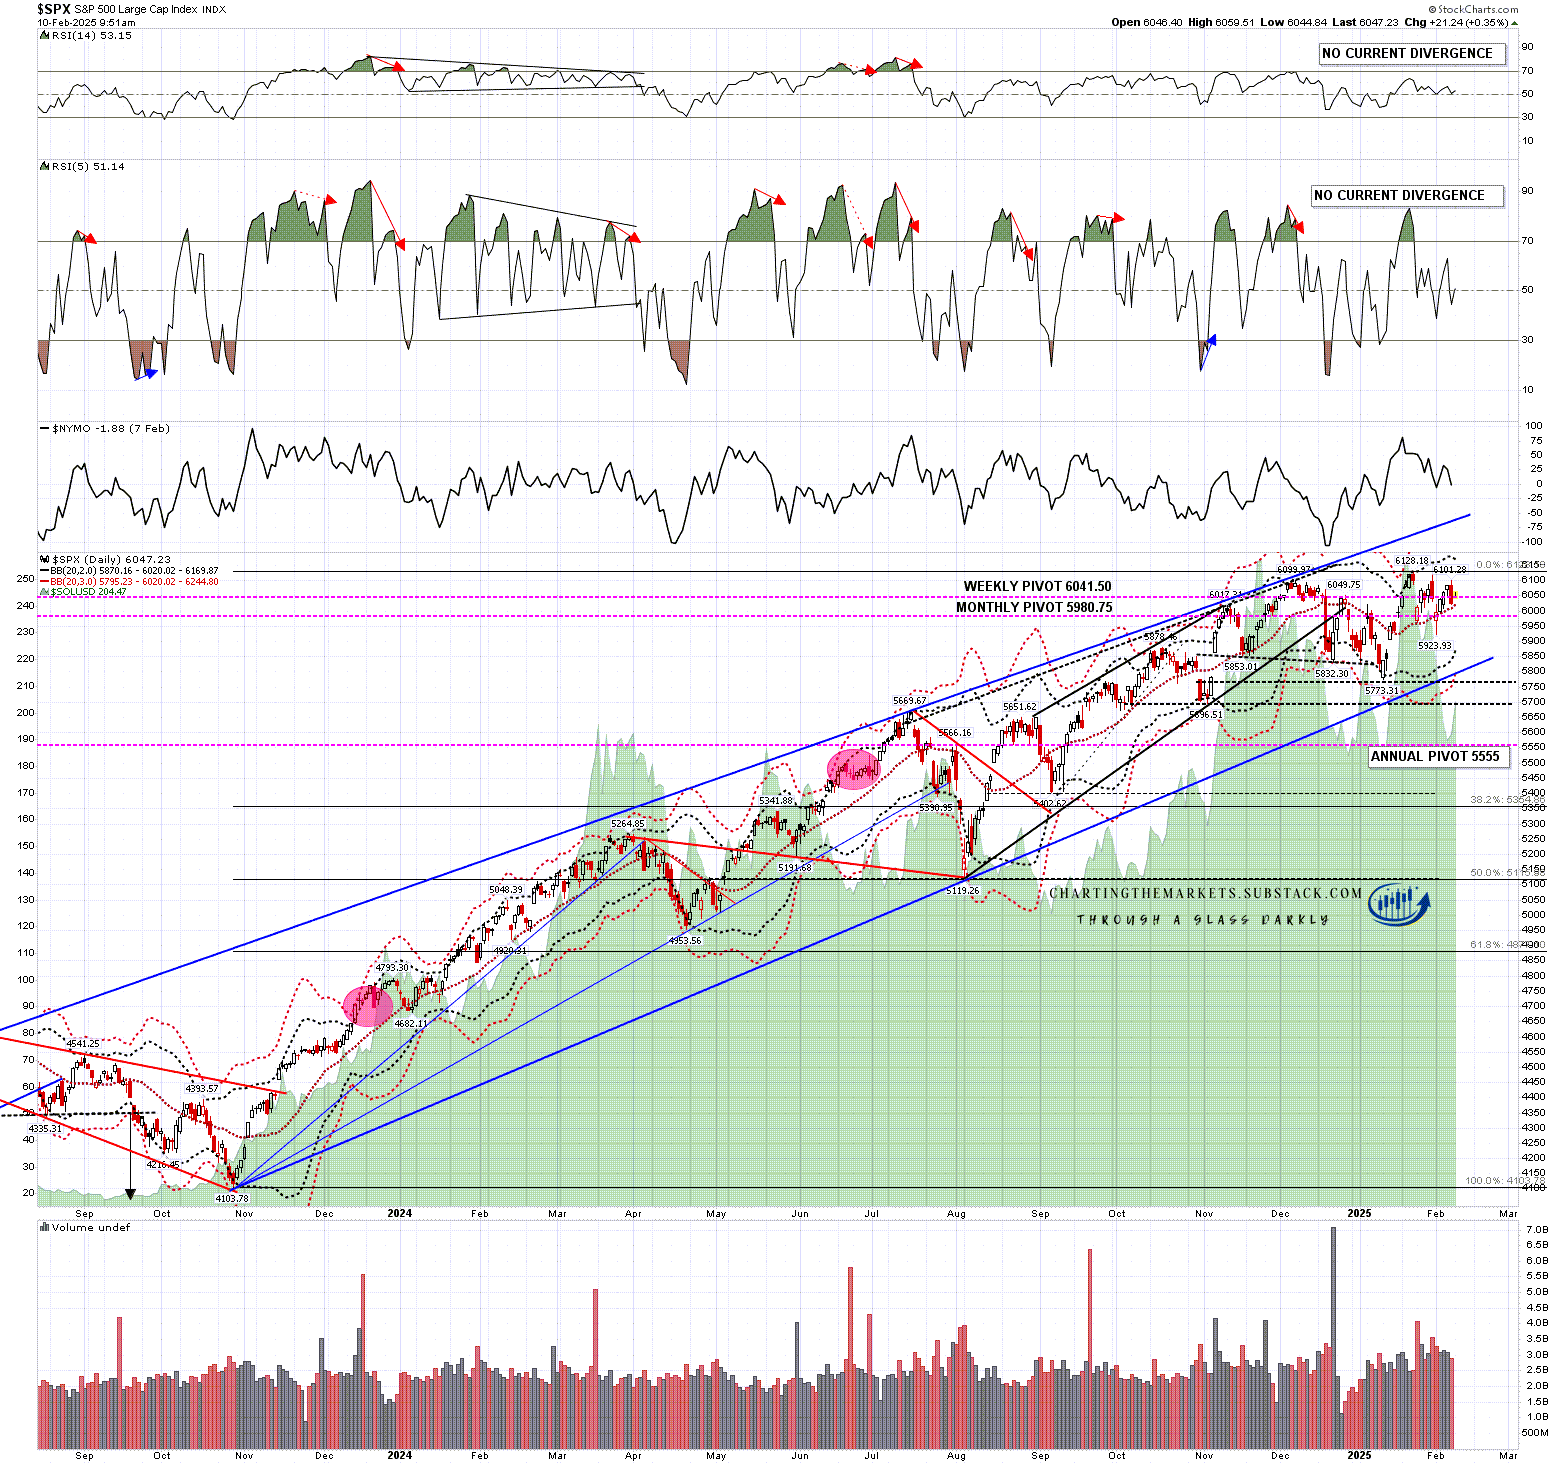
On SPX the low on Friday respected both the daily middle band and the monthly pivot at the lows, so no meaningful support was broken.
SPX daily chart:
On QQQ there was a full test of the daily middle band with a close above it. Again there was no meaningful support break. IWM did the same, and DIA never came close to a daily middle band test. None of the equity indices that I track daily broke either the daily middle band or the monthly pivot.
QQQ daily chart:
Given that there have been no significant support breaks, all the retracements on Friday may well have been bullish retracements, and there are also bullish leaning setups on QQQ, SPX and IWM.
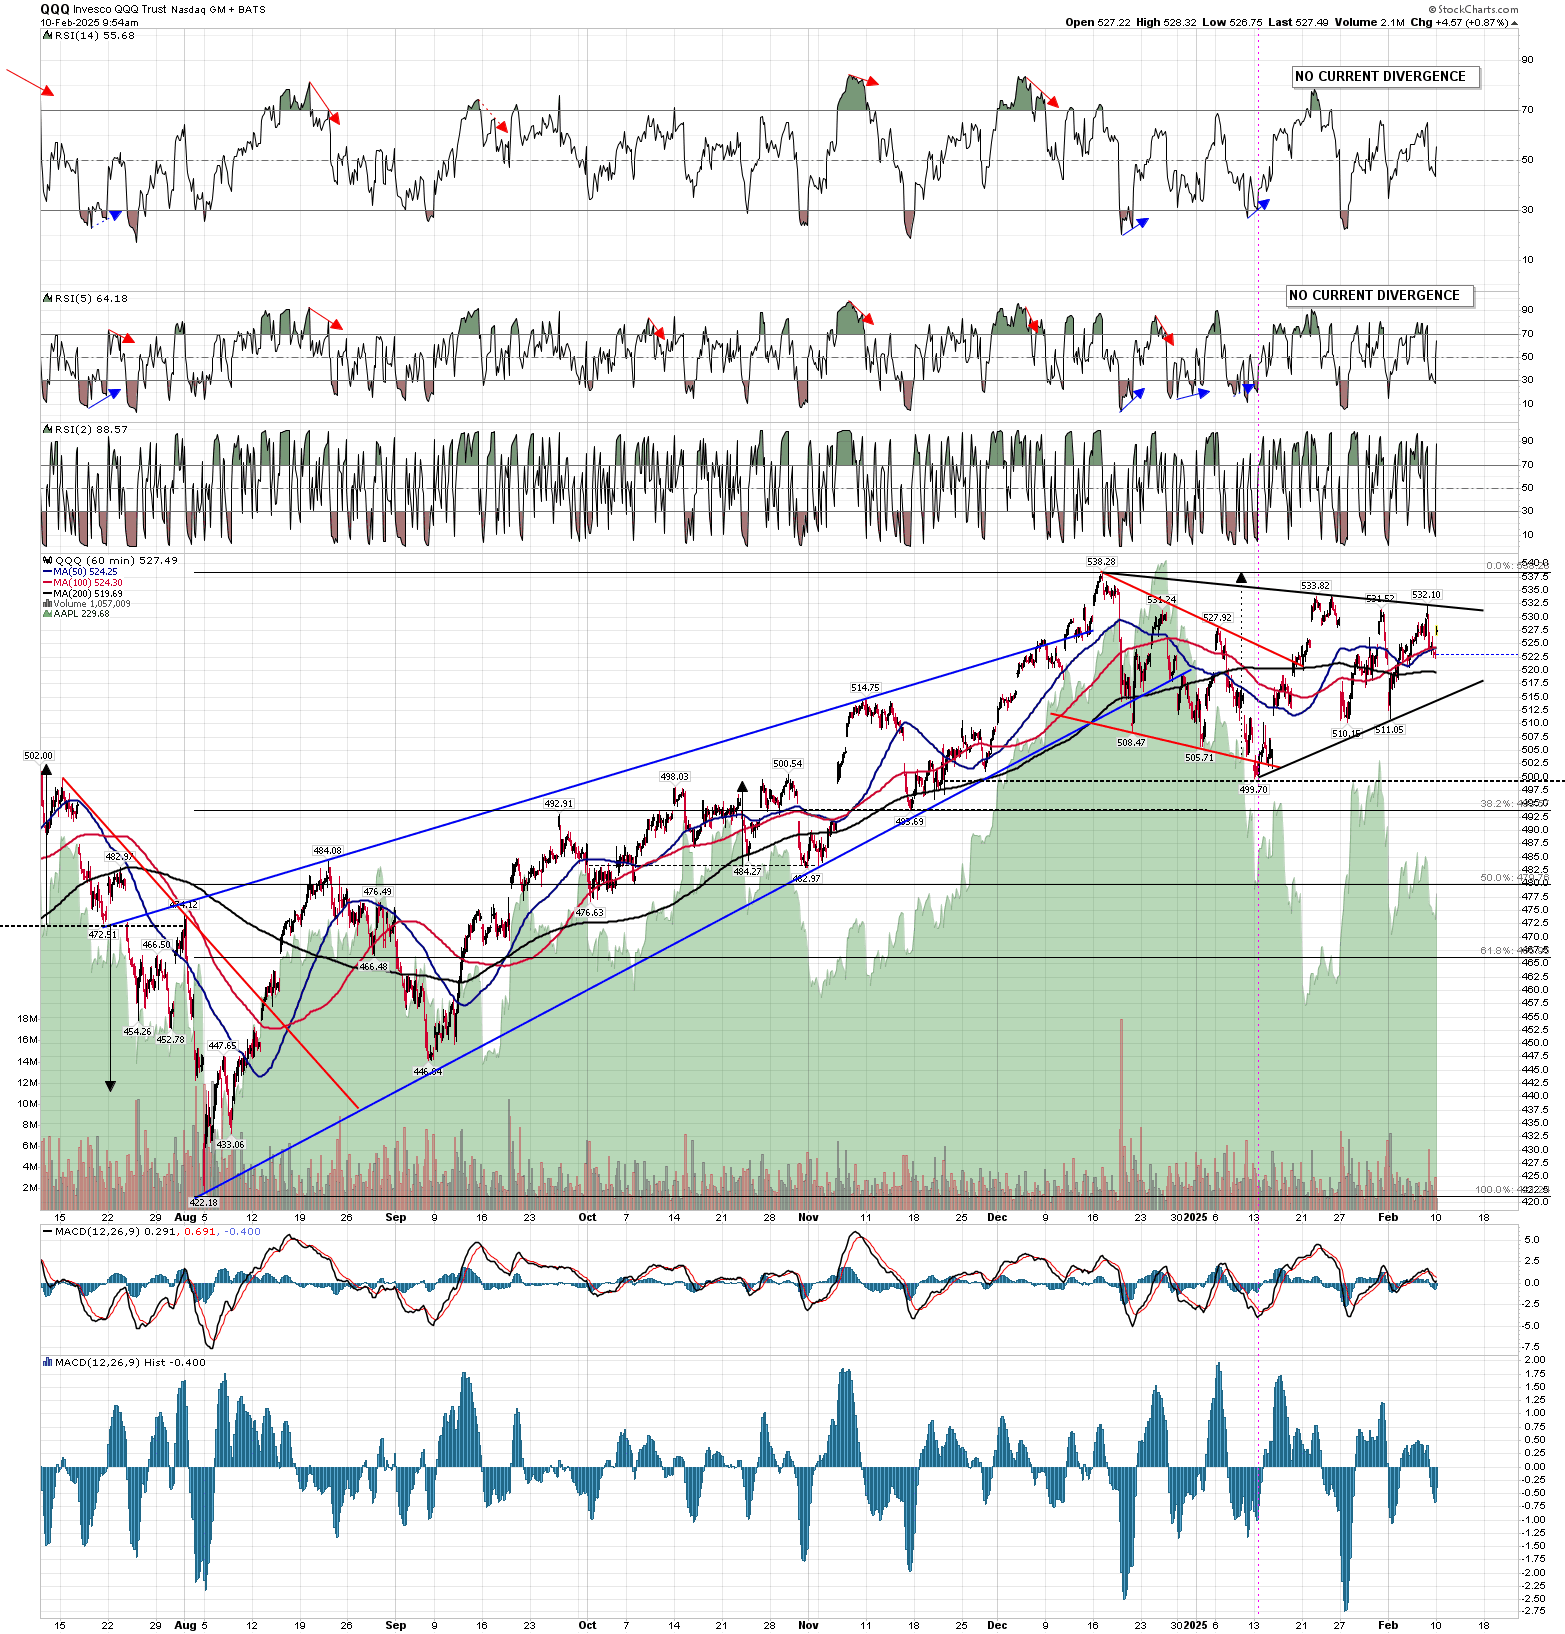
On QQQ there is a beautiful bullish classical triangle that looks ready to break up. There is a perfect three touch triangle resistance trendline from the all time high, clearly completed waves A through D and a partial retracement wave E that could break up at any time. A break over triangle resistance would fix a minimum target at a retest of the all time high, where there is already a fixed target from the bull flag that broke up last week. That flag target is the only target from last week that has not yet reached target.
QQQ 60min chart:

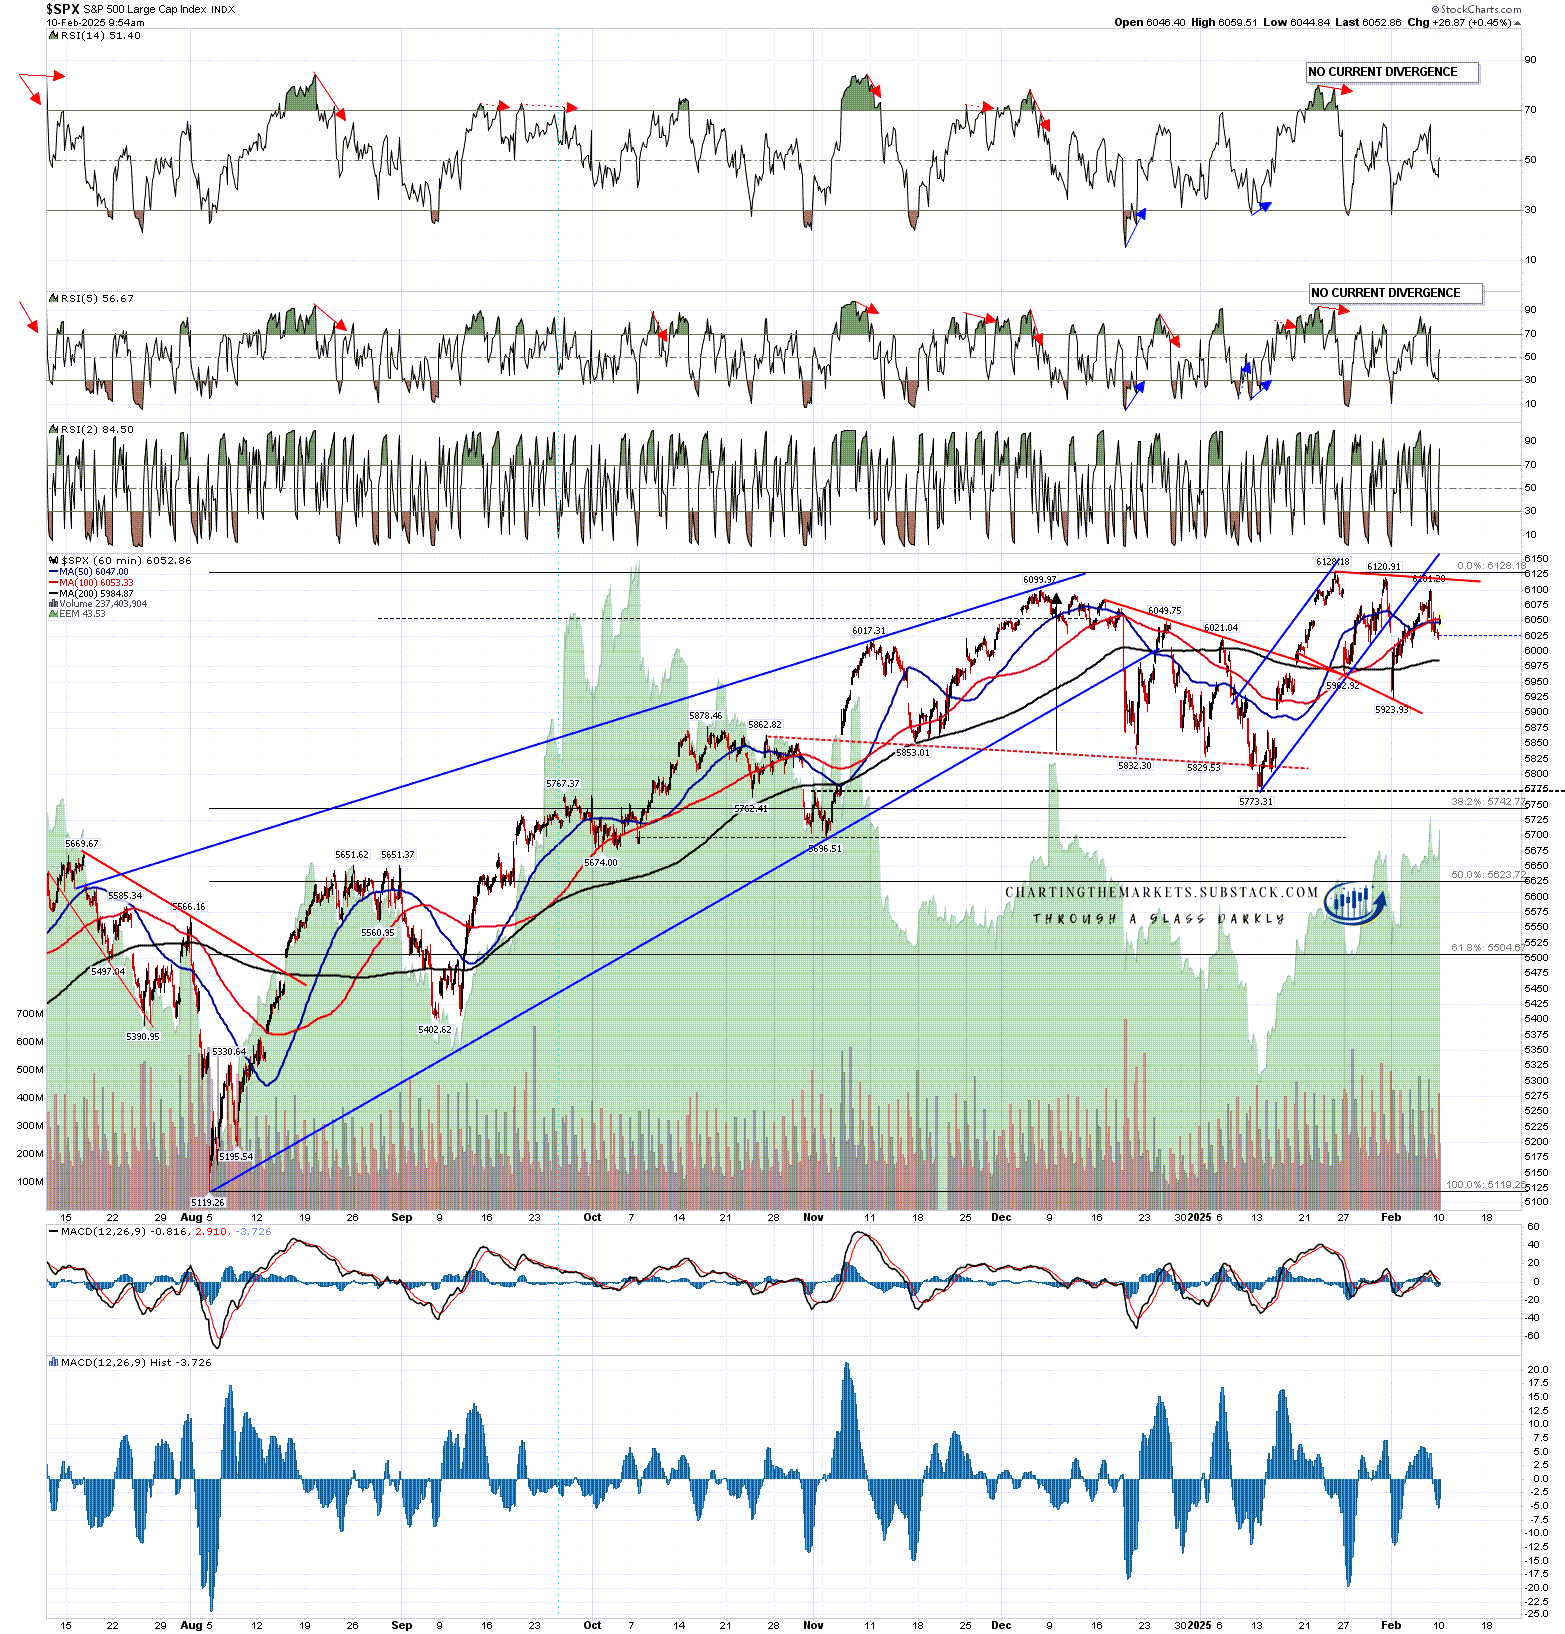
The bull flag that broke up on SPX last week already reached target at the retest of the all time high, and the short term setup isn’t as clear as on QQQ, but there is still a decent quality bull flag megaphone from the latest all time high and on a break up over megaphone resistance that too would have a target at another retest of the all time high.
SPX 60min chart:
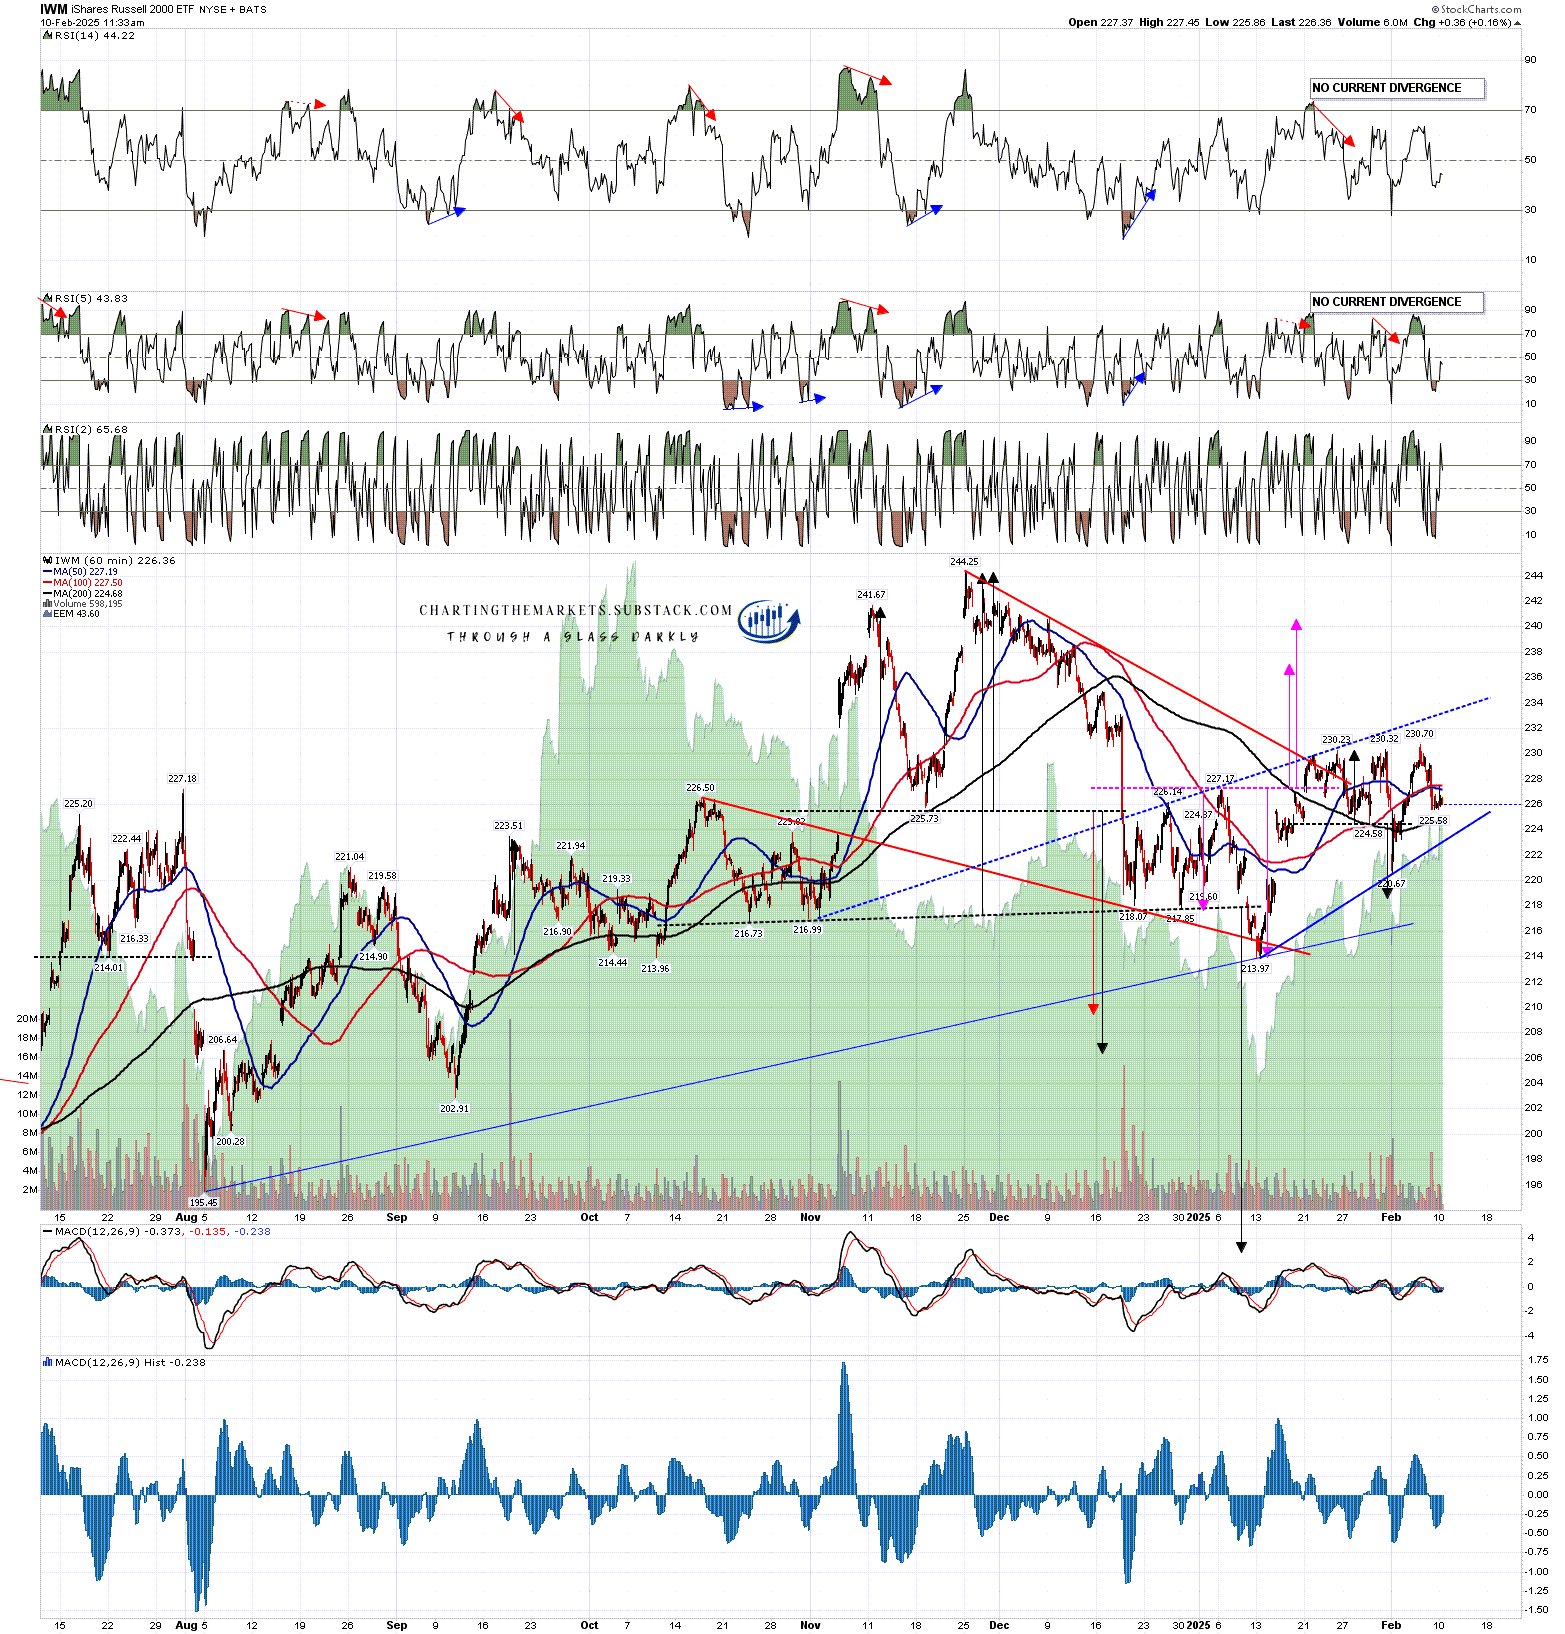
IWM has been trailing a long way behind the other indices so far this year, but there is still a very decent looking upside target that I think has a good chance of being reached.
I’ve drawn a good quality possible bear flag rising wedge on the chart below, and my upside target is that flag wedge resistance, currently in the 233.2 area. There is still a possibility that IWM may go higher, but I’m thinking IWM may well just reach that trendline and then fail back into a retest of the last low at 213.97.
IWM 60min chart:
I’ve been expecting to see some market turbulence in the first half of this year, and the imposition of new tariffs on many of the trading partners of the US looks like a good trigger to see that turbulence. If US equity indices can retest the all time highs on SPX, QQQ and DIA from here over the next few days then there will be a decent looking setup that could set up that larger retracement or correction. We’ll see how that goes.
I’m still leaning towards a weak first half of 2025 and new all time highs later in the year, very possibly as a topping process for a much more significant high. One way or another I think we’ll be seeing lower soon and I’m not expecting this to be a good year for US equities. The last two years have been banner years for US equities. A third straight year of these kinds of gains looks like a big stretch. I could of course however be mistaken. Everyone have a great weekend. :-)
If you like my analysis and would like to see more, please take a free subscription at my chartingthemarkets substack, where I publish these posts first. I also do a premarket video every day on equity indices, bonds, currencies, energies, precious commodities and other commodities at 8.45am EST. If you’d like to see those I post the links every morning on my twitter, and the videos are posted shortly afterwards on my Youtube channel.
No comments:
Post a Comment