
In my last post on Monday 10th Feb I was looking at the bull flag setups on SPX and QQQ and the historically bullish lean into yesterday and projecting that we might well see retests of the all time highs in that bullish window. We saw that all time high retest on QQQ on Friday and on SPX yesterday. So what now?
Well we now have impressive topping patterns on SPX and QQQ and a bearish window has started that runs through to the end of February, with notably bearish leaning days on Thursday and Friday this week, Monday 24th Feb and Friday 28th Feb. We will see how that develops.
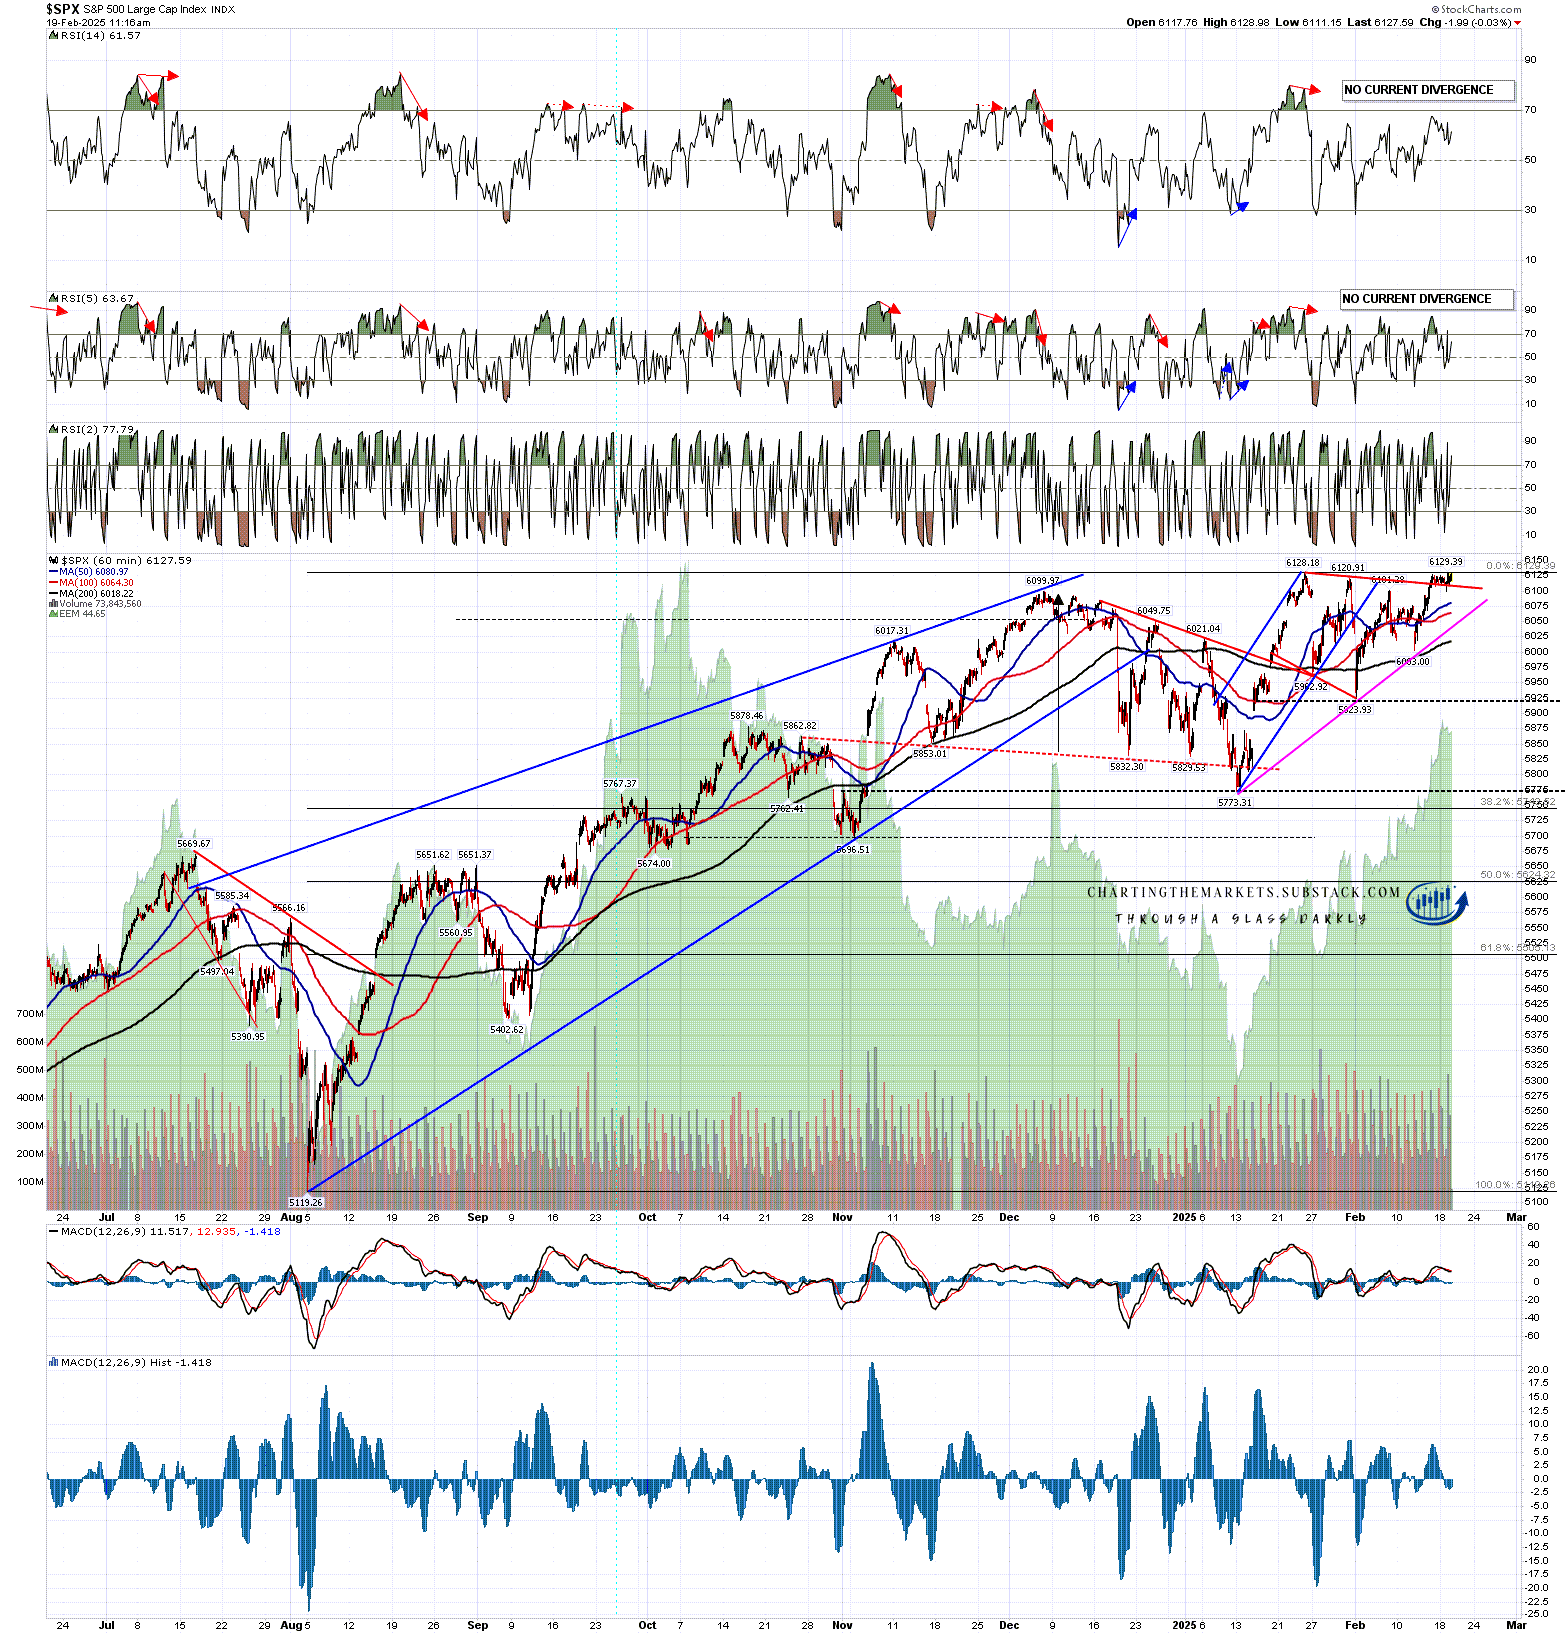
On SPX the bullish setup I was looking at last week was a bull flag megaphone and that delivered a very marginal new all time high yesterday. The bearish pattern setup here is now a possible nested double top.
On the first and smaller double top setup a sustained break below 5923.93 would now look for a target in the 5720 area.
On the second and larger double top setup a sustained break below 5773.31 would now look for a target in the 5418 - 5447 area.
If this full nested double top setup delivers this retracement would retrace a bit more than 61.8% of the rising wedge from the August low at 5119.26.
Are we going to see this deliver? Very possibly I think. Trump and his administration are disruptors and will likely be shaking a lot of trees this year. Many of those trees likely need a good shake, but disruption delivers uncertainty and markets tend to not like uncertainty. We’ll see.
SPX 60min chart:
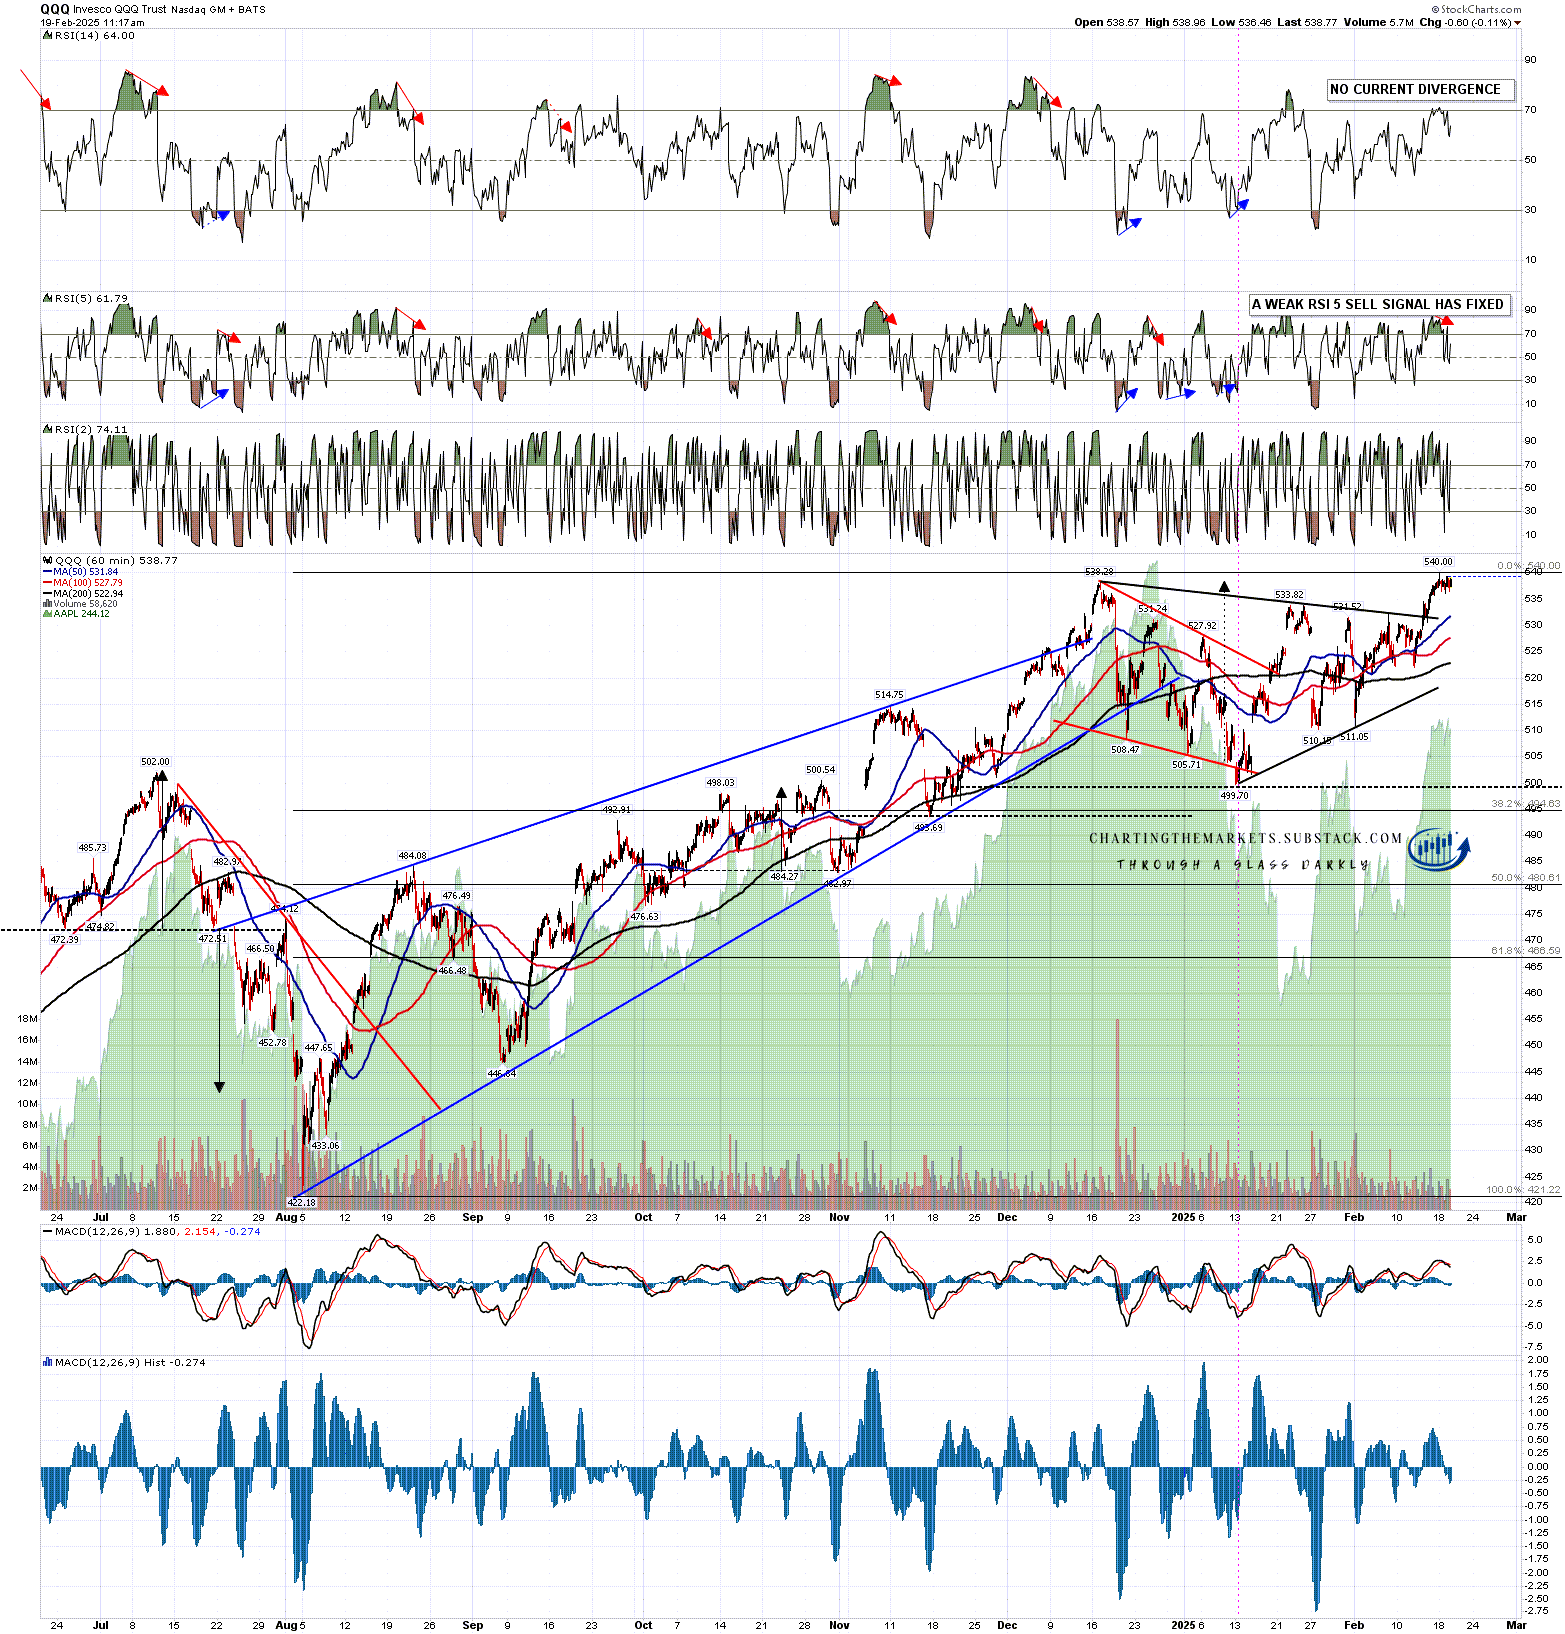
On QQQ the new all time high has set up a good quality double top. A sustained break below 499.70 would fix a double top target in the 459.40 to 461.10 range.
If this setup delivers this retracement would retrace a bit more than 61.8% of the rising wedge from the August low at 422.18.
QQQ 60min chart:
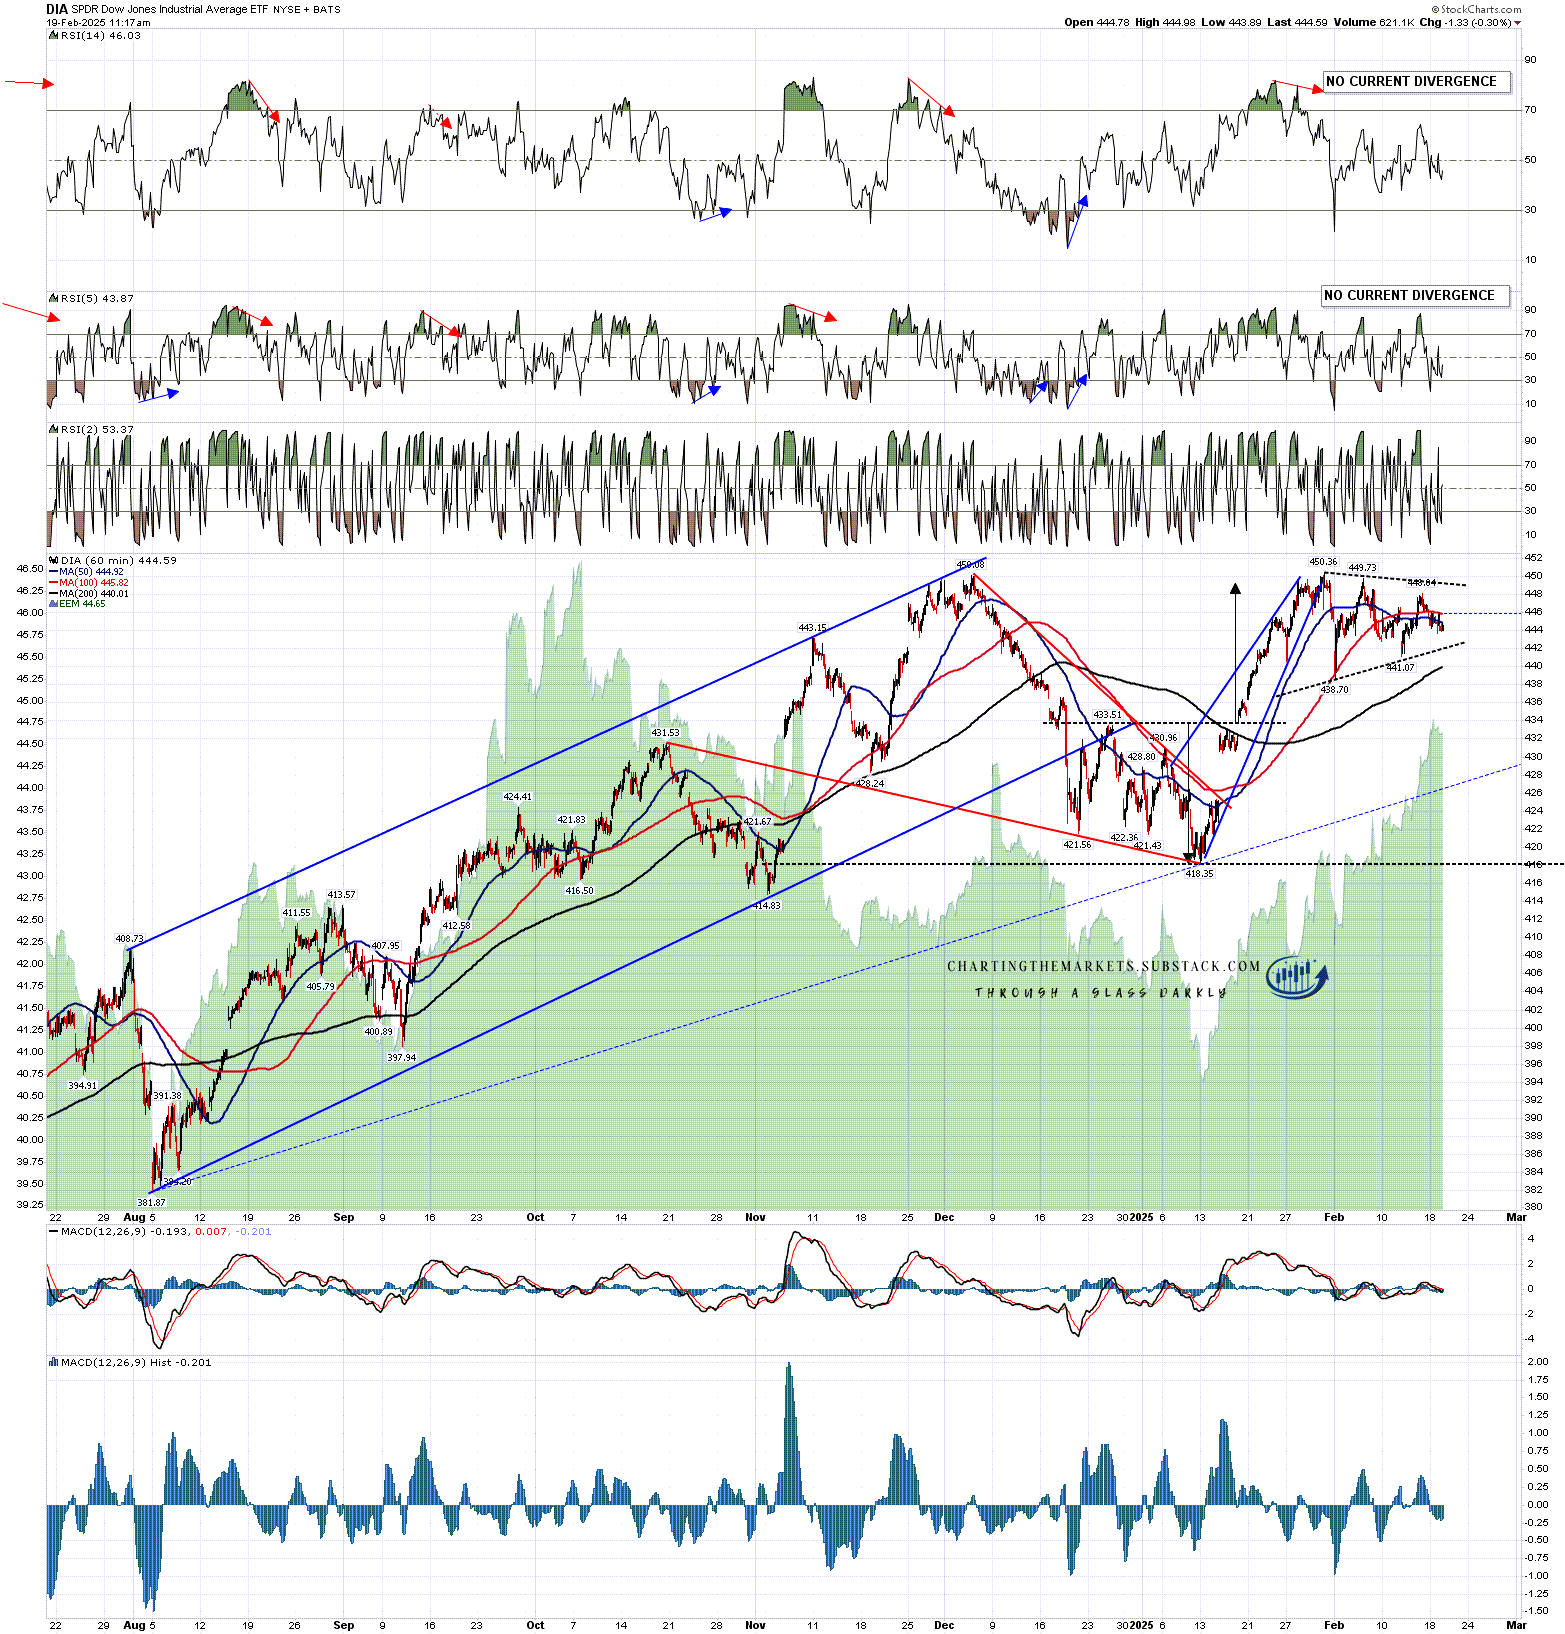
There is also a high quality double top setup on DIA of course, and on a sustained break below 418.35 the double top target would be in the 386/7 area, almost a full retracement of the rising wedge on DIA from the August low at 381.87.
I would note that there is a possible short term bull flag triangle forming on DIA and another on IWM, but both are at too early a stage to identify the patterns with any confidence.
DIA 60min chart:
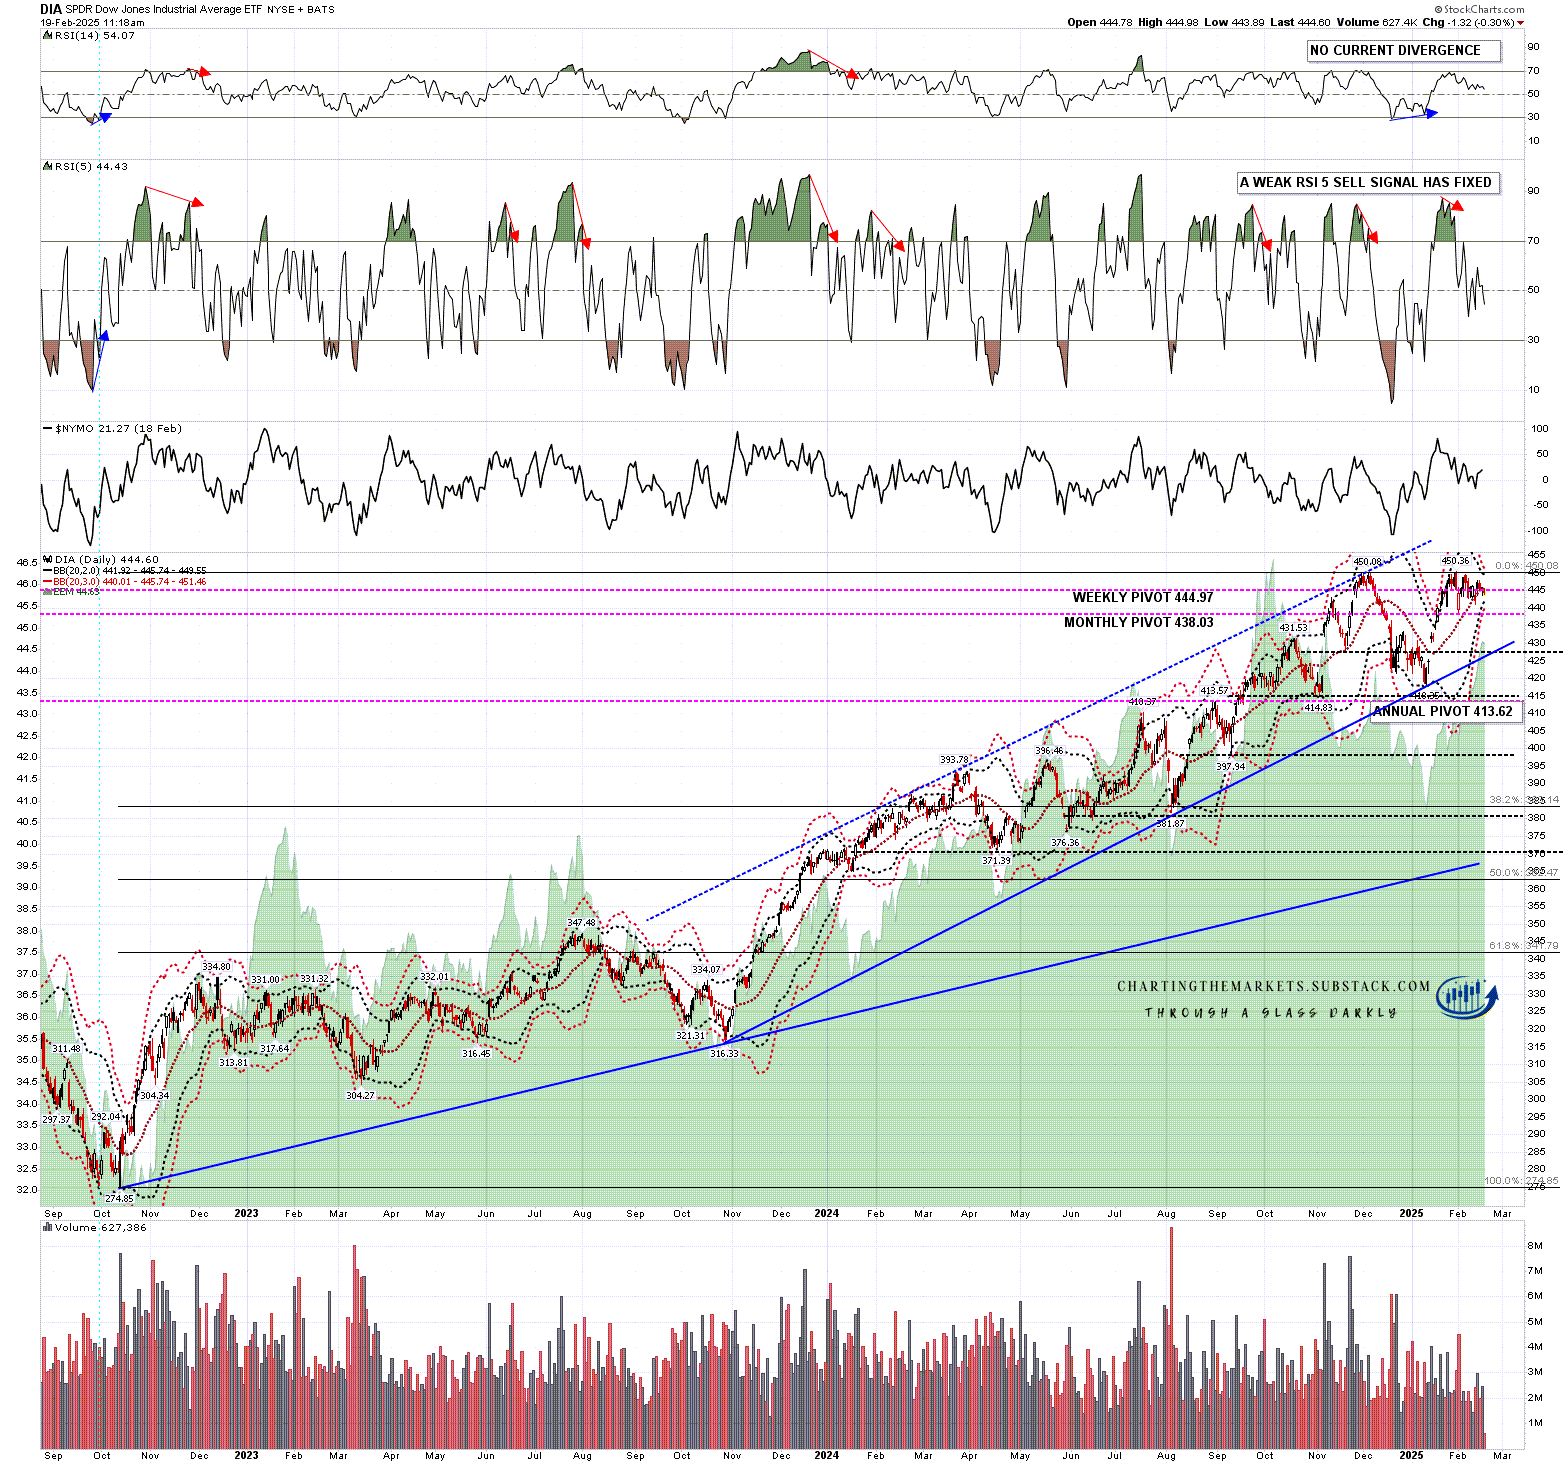
If we do see this double top play out on DIA then I would note that the rising support trendline from the October 2023 low is now in the 367 area, and might well be the bigger picture target for any retracement here.
I would also note that DIA has been struggling to hold the daily middle band as support, trading slightly below it at the time of writing.
DIA daily chart:
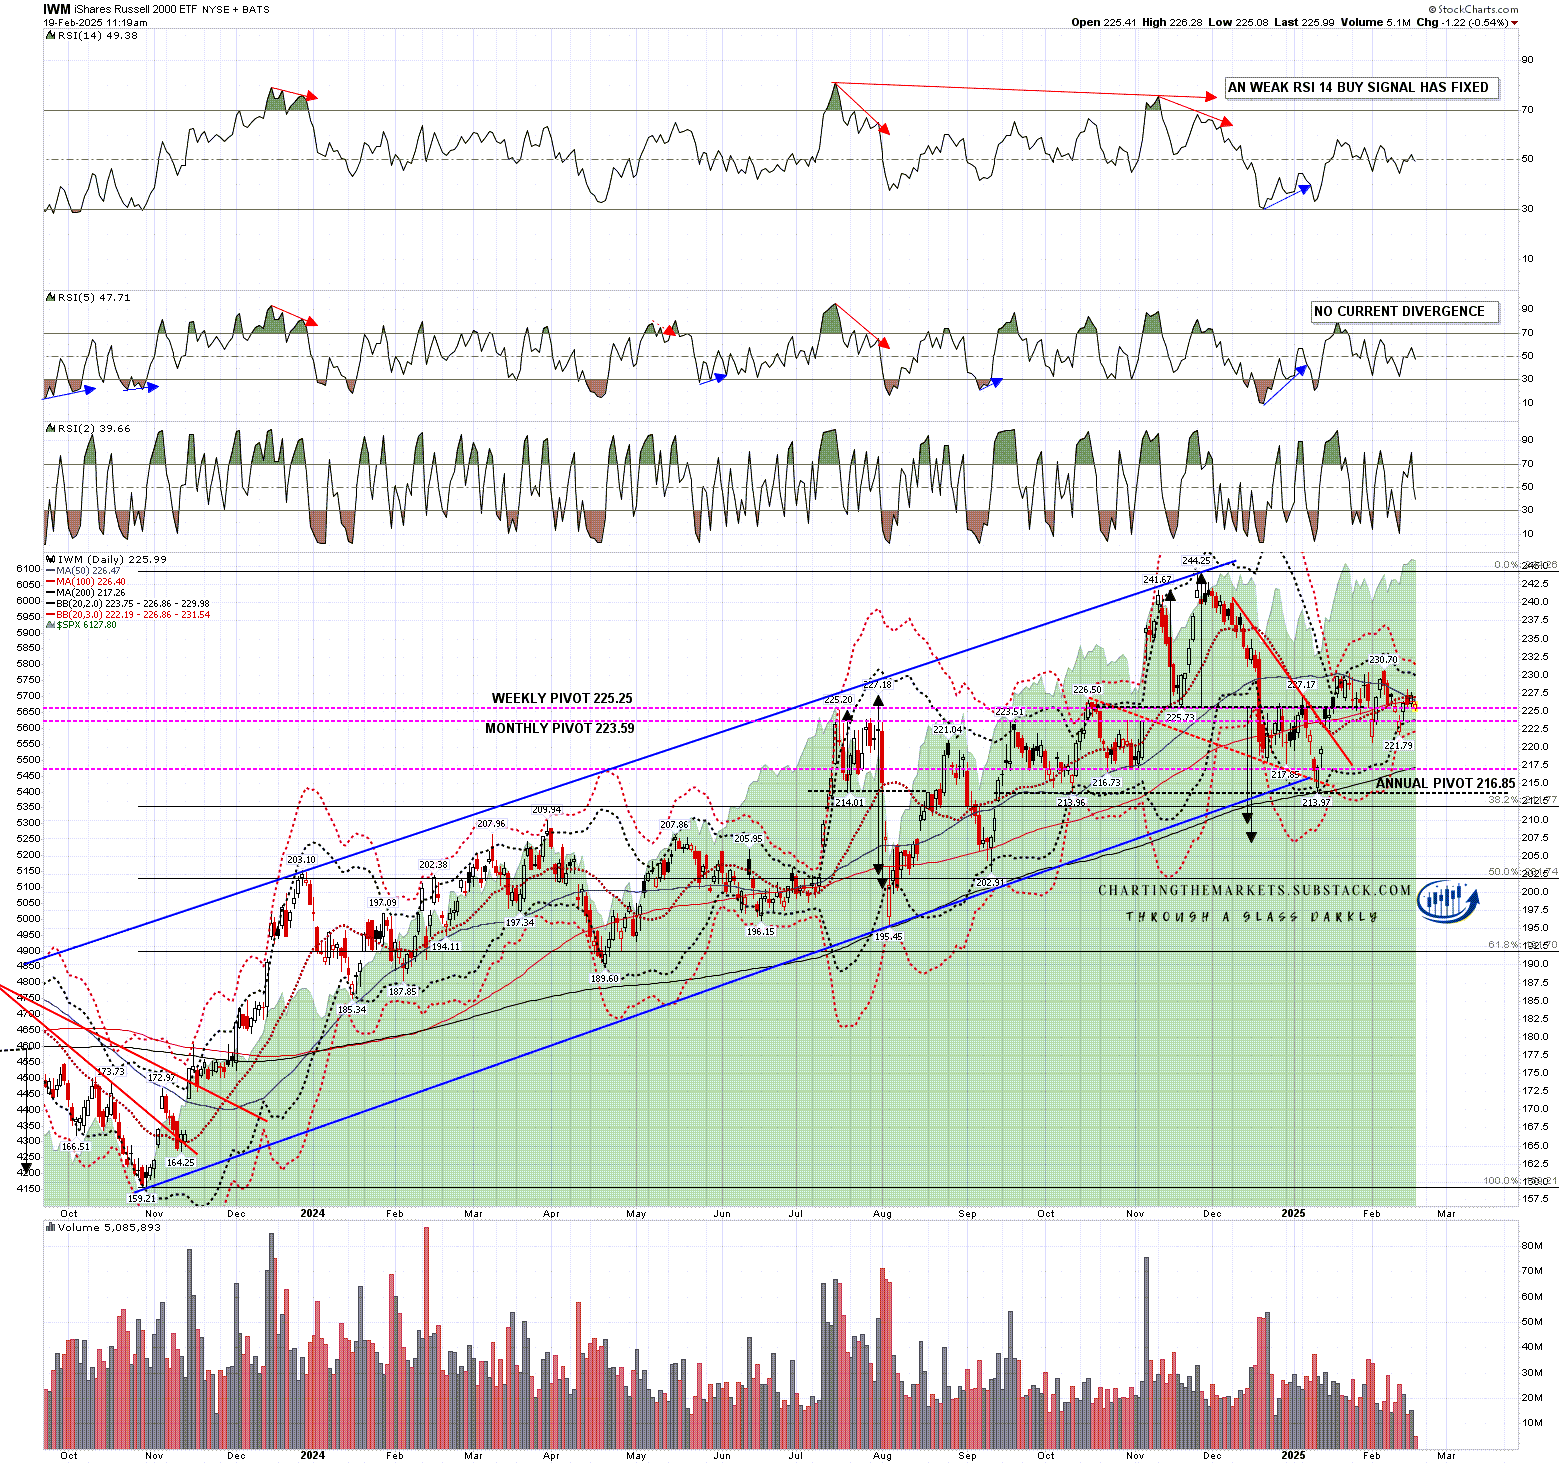
IWM has been failing to hold support at the daily middle band in recent days, with a break below that on Friday that confirmed with another close below yesterday. With that and the 50dma holding as resistance for the last two months, IWM is already in a technical downtrend, and the double top target area 207 to 209.5 that fixed in December is still valid.
There is also a possible much larger H&S forming that on a sustained break down below 213.97 would look for a target in the 183.70 area.
IWM daily chart:
I’ve been expecting to see some market turbulence in the first half of this year, and the imposition of new tariffs on many of the trading partners of the US is a possible trigger to see that turbulence. I’ve been reading that Trump’s administration is considering a position that the value added (sales) taxes levied across Europe may in effect be tariffs. That’s absurd, as those taxes apply to all sales regardless of the source, but if retaliatory tariffs started being levied against Europe on that basis, then a trade war with Europe would seem likely as a result. That could significantly disrupt world trade and markets.
On the bigger picture, I have some real sympathy with Trump’s embrace of tariffs. The US government is on a slide towards insolvency, with the current year’s deficit apparently on track to reach $2.5 trillion. It is very hard to raise taxes in the US. A lot of money could be raised using tariffs which might improve that fiscal situation, though it’s hard to say what the knock-on effect on inflation and growth might be, other than to say that the obvious lean would be towards inflation rising and growth falling.
There are now high quality topping patterns across the board on SPX, QQQ, DIA and IWM. We’ll see whether those can deliver.
I’m still leaning on the bigger picture towards a weak first half of 2025 and new all time highs later in the year, very possibly as a topping process for a much more significant high. One way or another I think we’ll be seeing lower soon and I’m not expecting this to be a good year for US equities. The last two years have been banner years for US equities. A third straight year of these kinds of gains looks like a big stretch. I could of course however be mistaken. Everyone have a great weekend. :-)
If you like my analysis and would like to see more, please take a free subscription at my chartingthemarkets substack, where I publish these posts first. I also do a premarket video every day on equity indices, bonds, currencies, energies, precious commodities and other commodities at 8.45am EST. If you’d like to see those I post the links every morning on my twitter, and the videos are posted shortly afterwards on my Youtube channel.
No comments:
Post a Comment