In December I was leaning towards seeing a retracement / consolidation on Crypto in the first half of this year and then strong new highs towards the end of the year with possible bull market highs pencilled in for Nov/Dec 2025.
That retracement / consolidation is now in progress and I’ll be looking today at the key support levels I’ll be watching on what I expect to be a bullish consolidation.
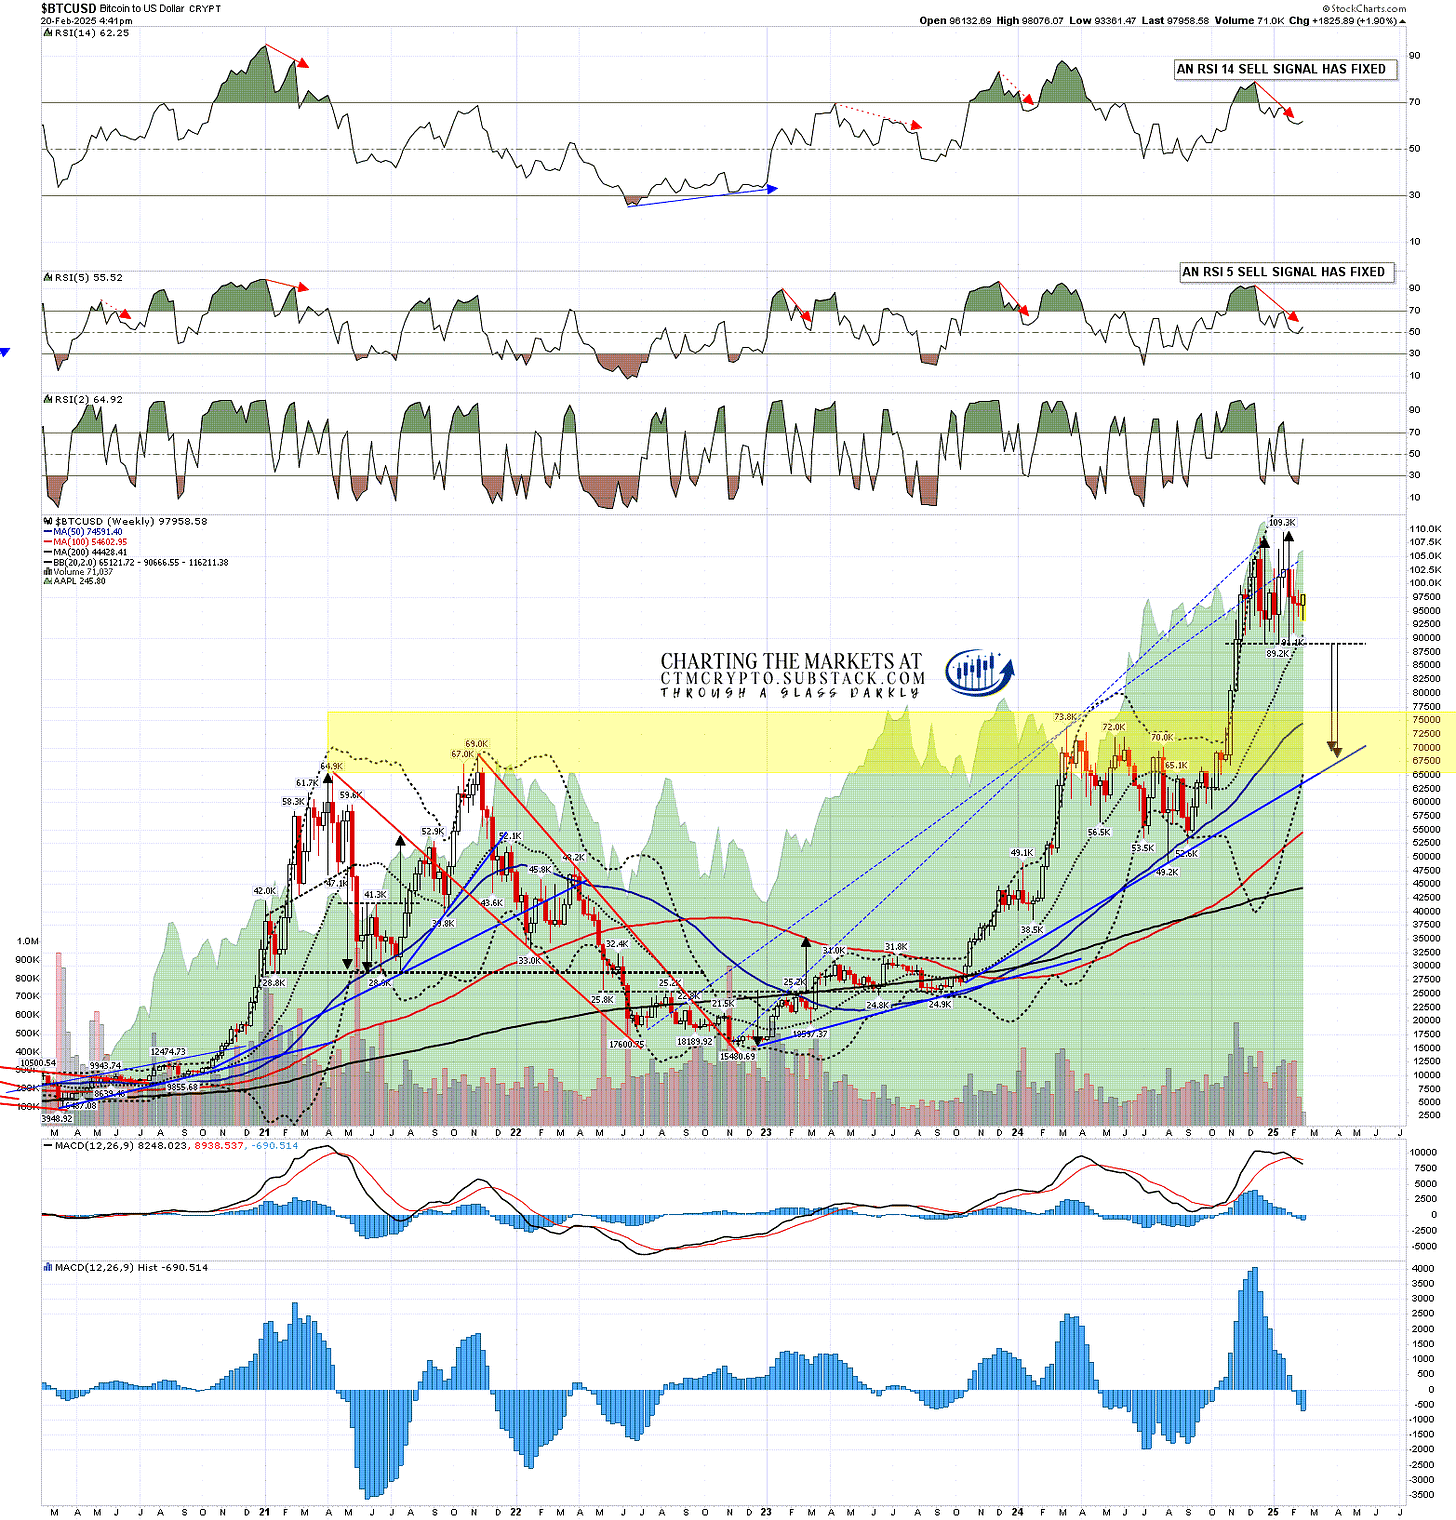
On Bitcoin (BTCUSD) there is a very obvious backtest target at the 2021 bull market highs. I’ve marked that on the chart below in the $64.9k to $69k range. I also have a rising support trendline from the October 2023 low that is currently in the $65k area and due to reach $69k in May.
As it happens a very high quality double top has formed on Bitcoin that on a sustained break below $89.2k would have a target in the $69.1k area. I think this double top may well deliver and make a retracement low in this area.
BTCUSD weekly chart:
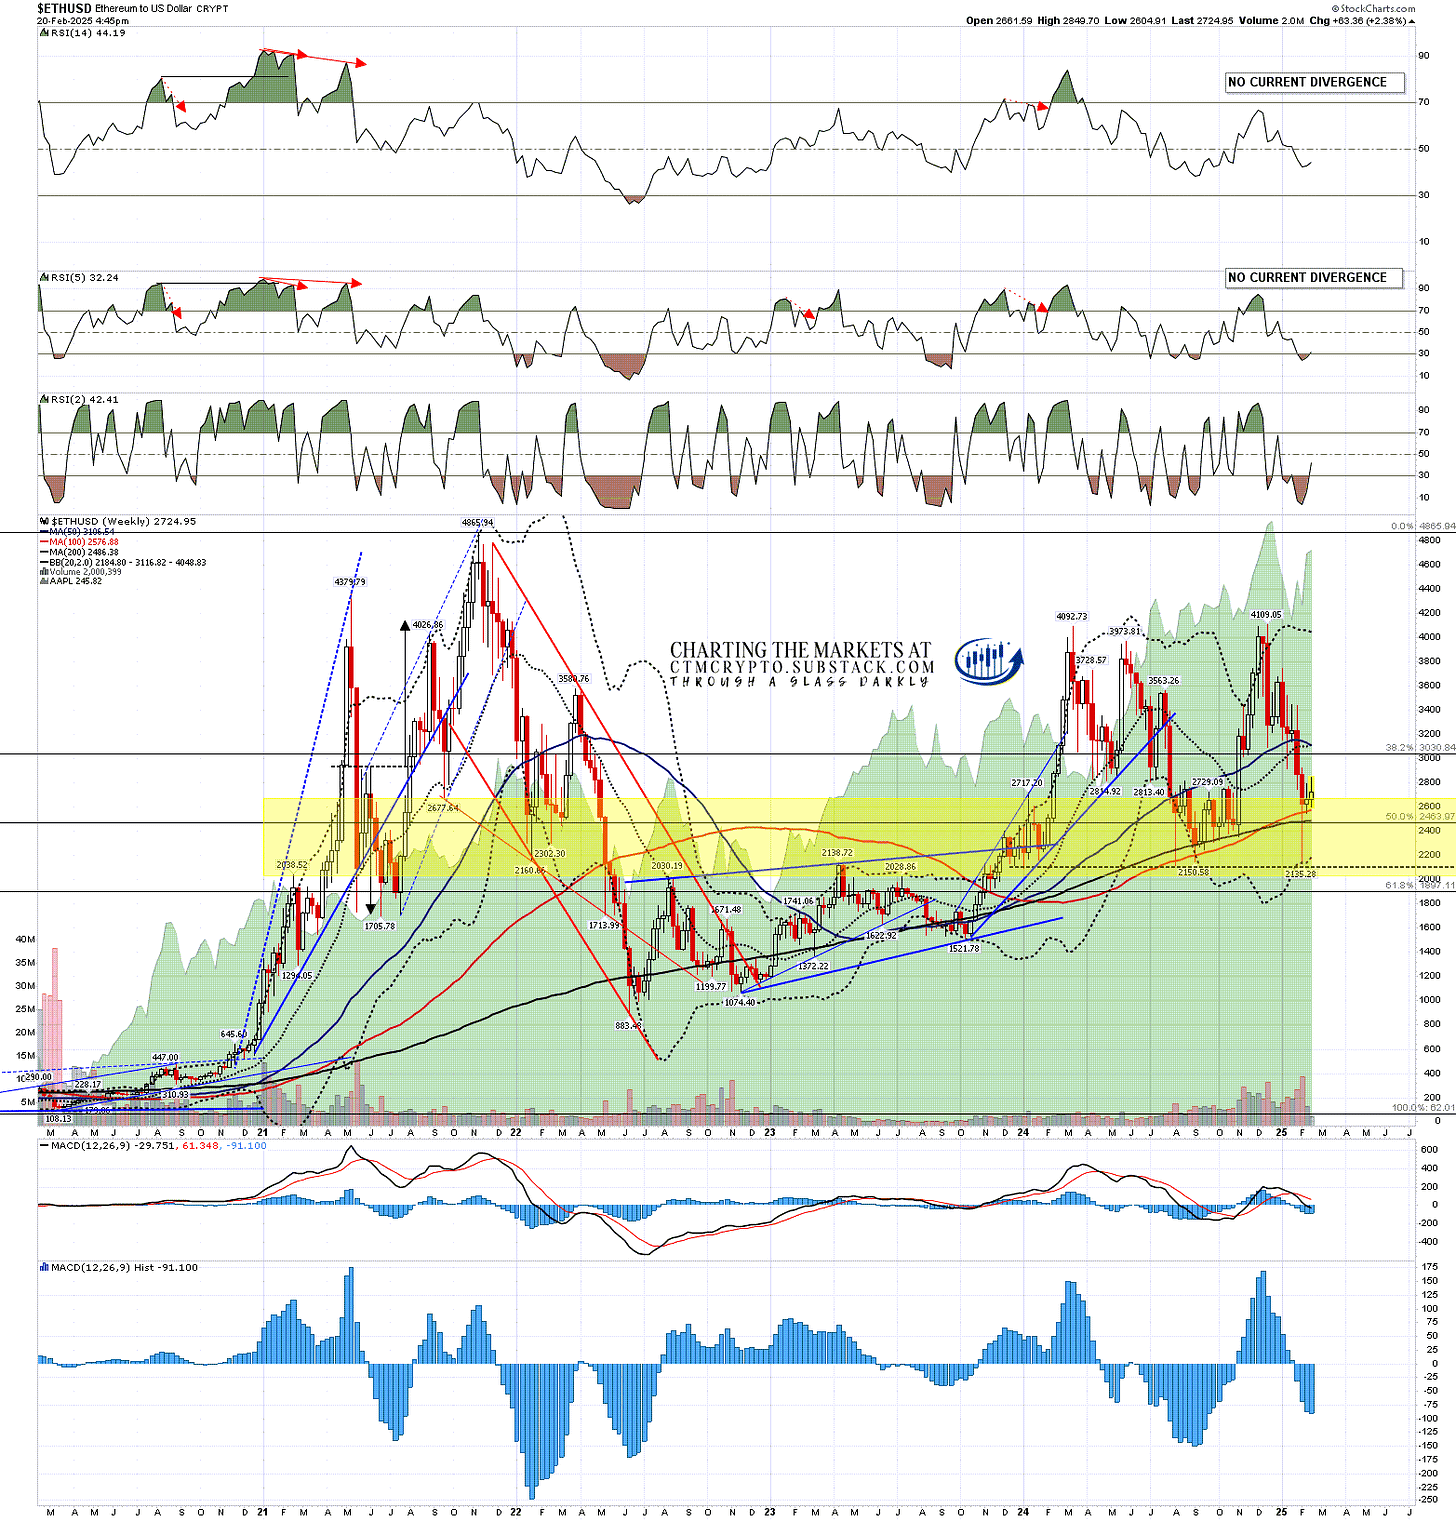
On Ethereum (ETHUSD) there was an H&S from the highs with a target at a retest of the 2121.38 low, and Ethereum spiked down to 2135.28 a few days ago. I’m treating that H&S target as reached.
On the bigger picture there is a very clear and strong support/resistance range from 2000 to 2600. Obviously that is already being tested and my lean would be towards seeing that area hold unless Ethereum has started a terminal relative decline, which I think is a possibility. As far as I’m aware, there’s little that can be done on Ethereum that can’t be done faster and cheaper on Solana, so there is a question mark in my mind over Ethereum’s long term future.
Of these three largest coins Ethereum is the only one that hasn’t made a new all time high so far in this bull market, and I’m wondering whether it will.
ETHUSD weekly chart:
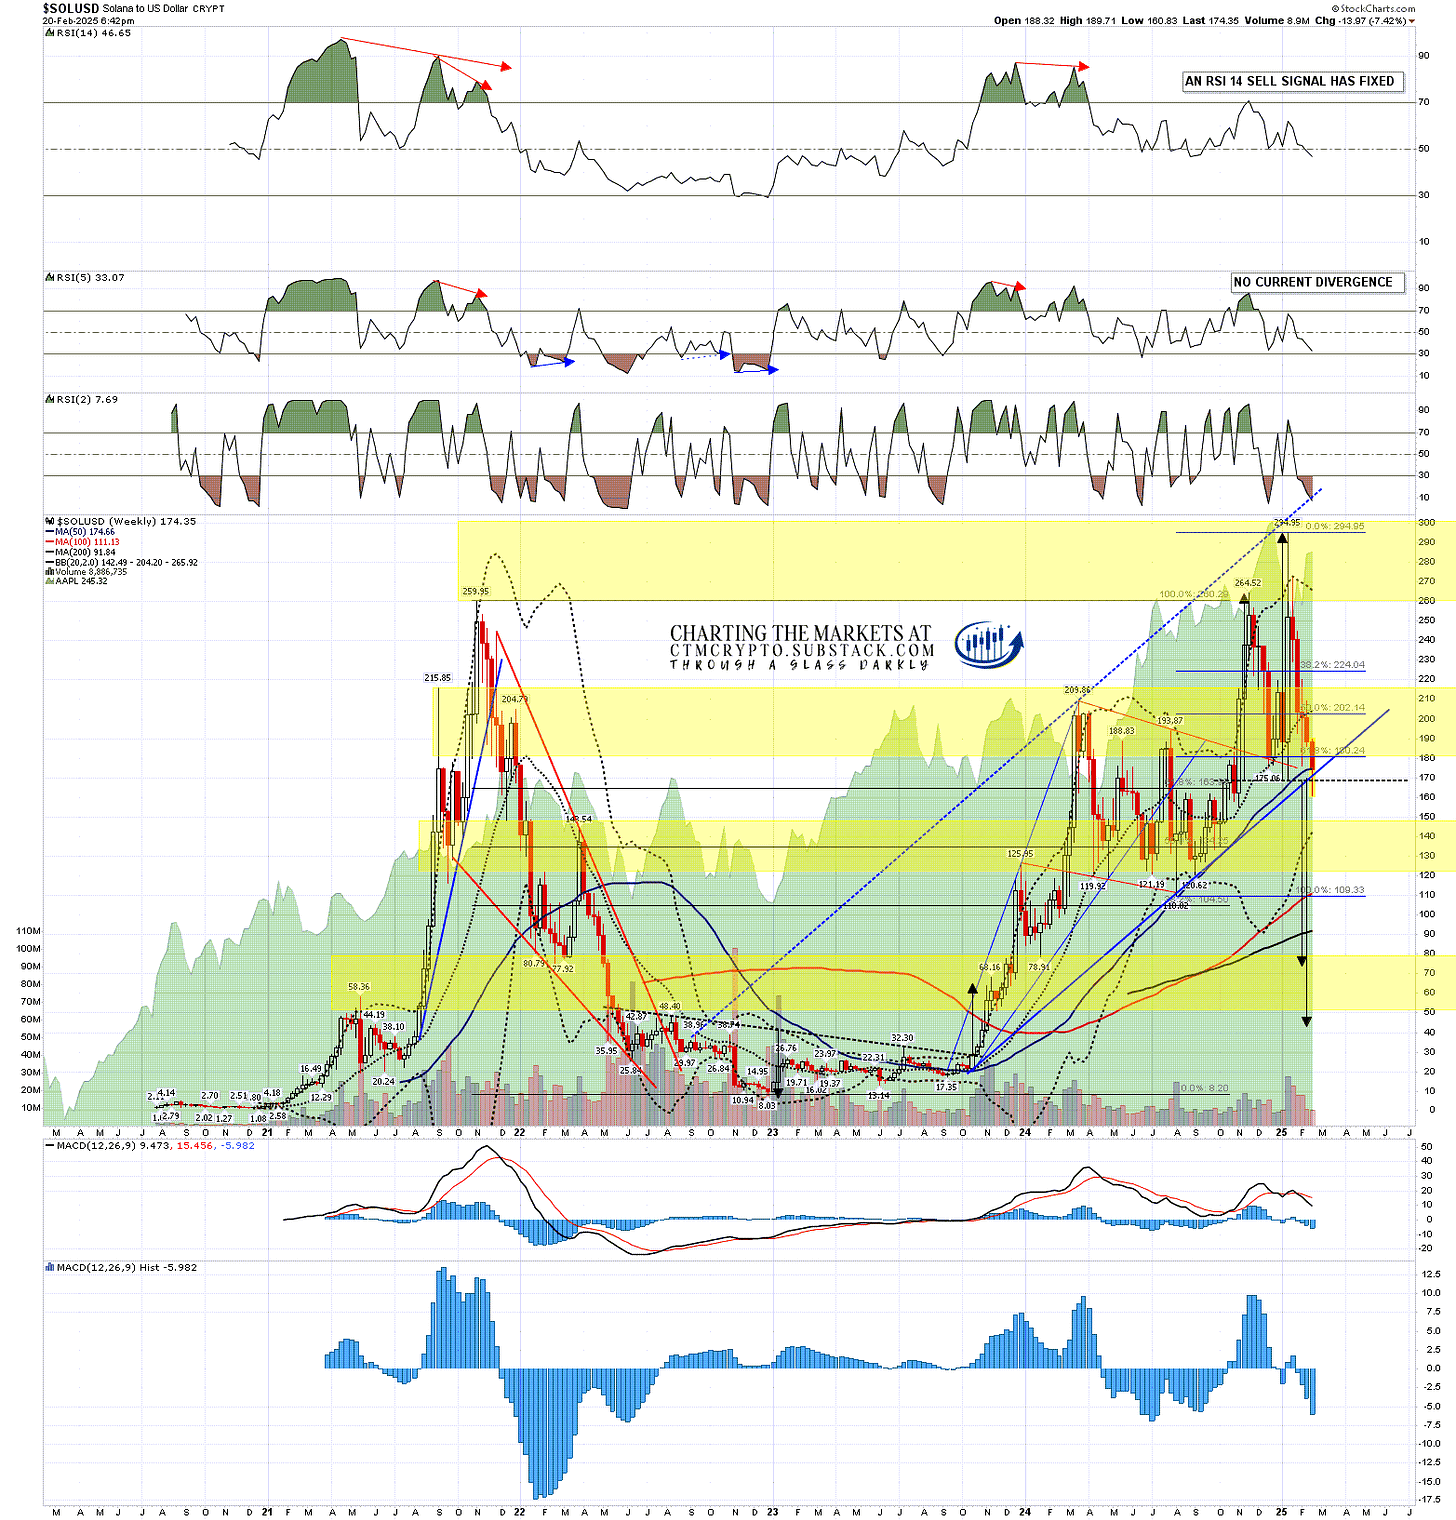
Solana (SOLUSD) has four obvious big support levels, and the highest level was a long shot. That would have been in effect a conversion of the 2021 high at 259.95 to support, and I’d have been considering that seriously if Solana had broken hard over 300. It didn’t though and that area was quickly lost.
The second level is the 180-216 support/resistance range. This has a strong record of holding on a weekly close basis, and still might, though the break down to $160 on the $LIBRA scandal news wasn’t encouraging. If that breaks then ……
The third level is the 120-150 support/resistance range and if the second level breaks this is the range that I would expect to be tested next and likely deliver a low.
The fourth level is the 50-80 support/resistance range and I’m not expecting this to be tested, not least because this was backtested and converted to support a year ago as Solana was starting the run that then saw it almost quadruple into December 2024. I’m including this last level only because there is a decent quality double top marked on the chart below that is trying to break down with a target in the 45 to 75 area.
I have seen a lot of oversized double tops like this form and break down over the years and these only very rarely reach target. If this pattern was on Ethereum, which does have serious question marks over its future then I would be considering this a bit more seriously but would still be doubtful.
Why has Solana been hammered so hard in recent weeks? Well it is the cheapest and fastest credible blockchain network and that’s a very good thing for future prospects. On the downside though, these qualities also make it a very attractive place to launch dubious or fraudulent memecoins for pumps and dumps, and the launch of the $TRUMP and $MELANIA memecoins in January was a dubious start to the year that was compounded by the launch and collapse of the (allegedly) scam memecoin $LIBRA last week.
Bigger picture though the fundamentals for Solana look solid and I’m expecting this to go a lot higher after this bullish consolidation completes. The memecoins are just background noise.
SOLUSD weekly chart:
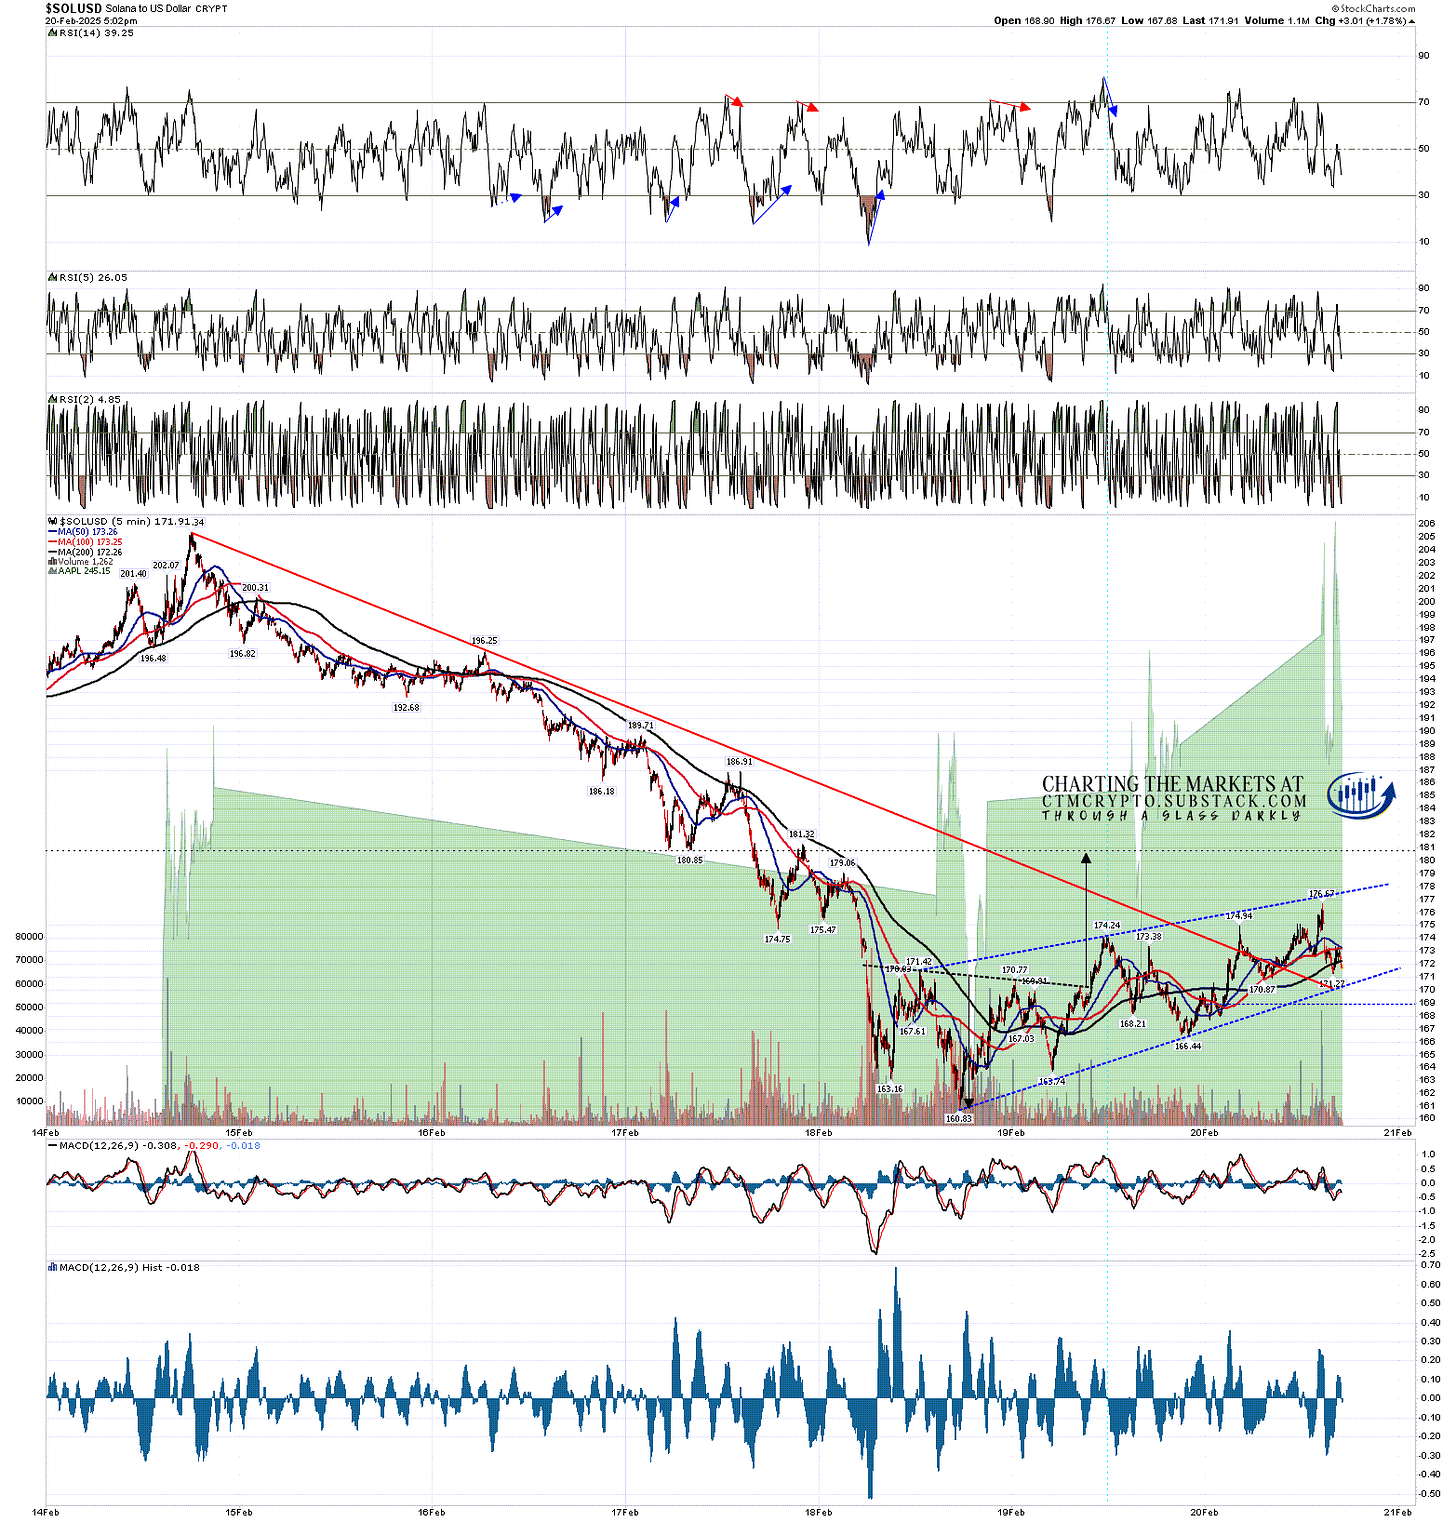
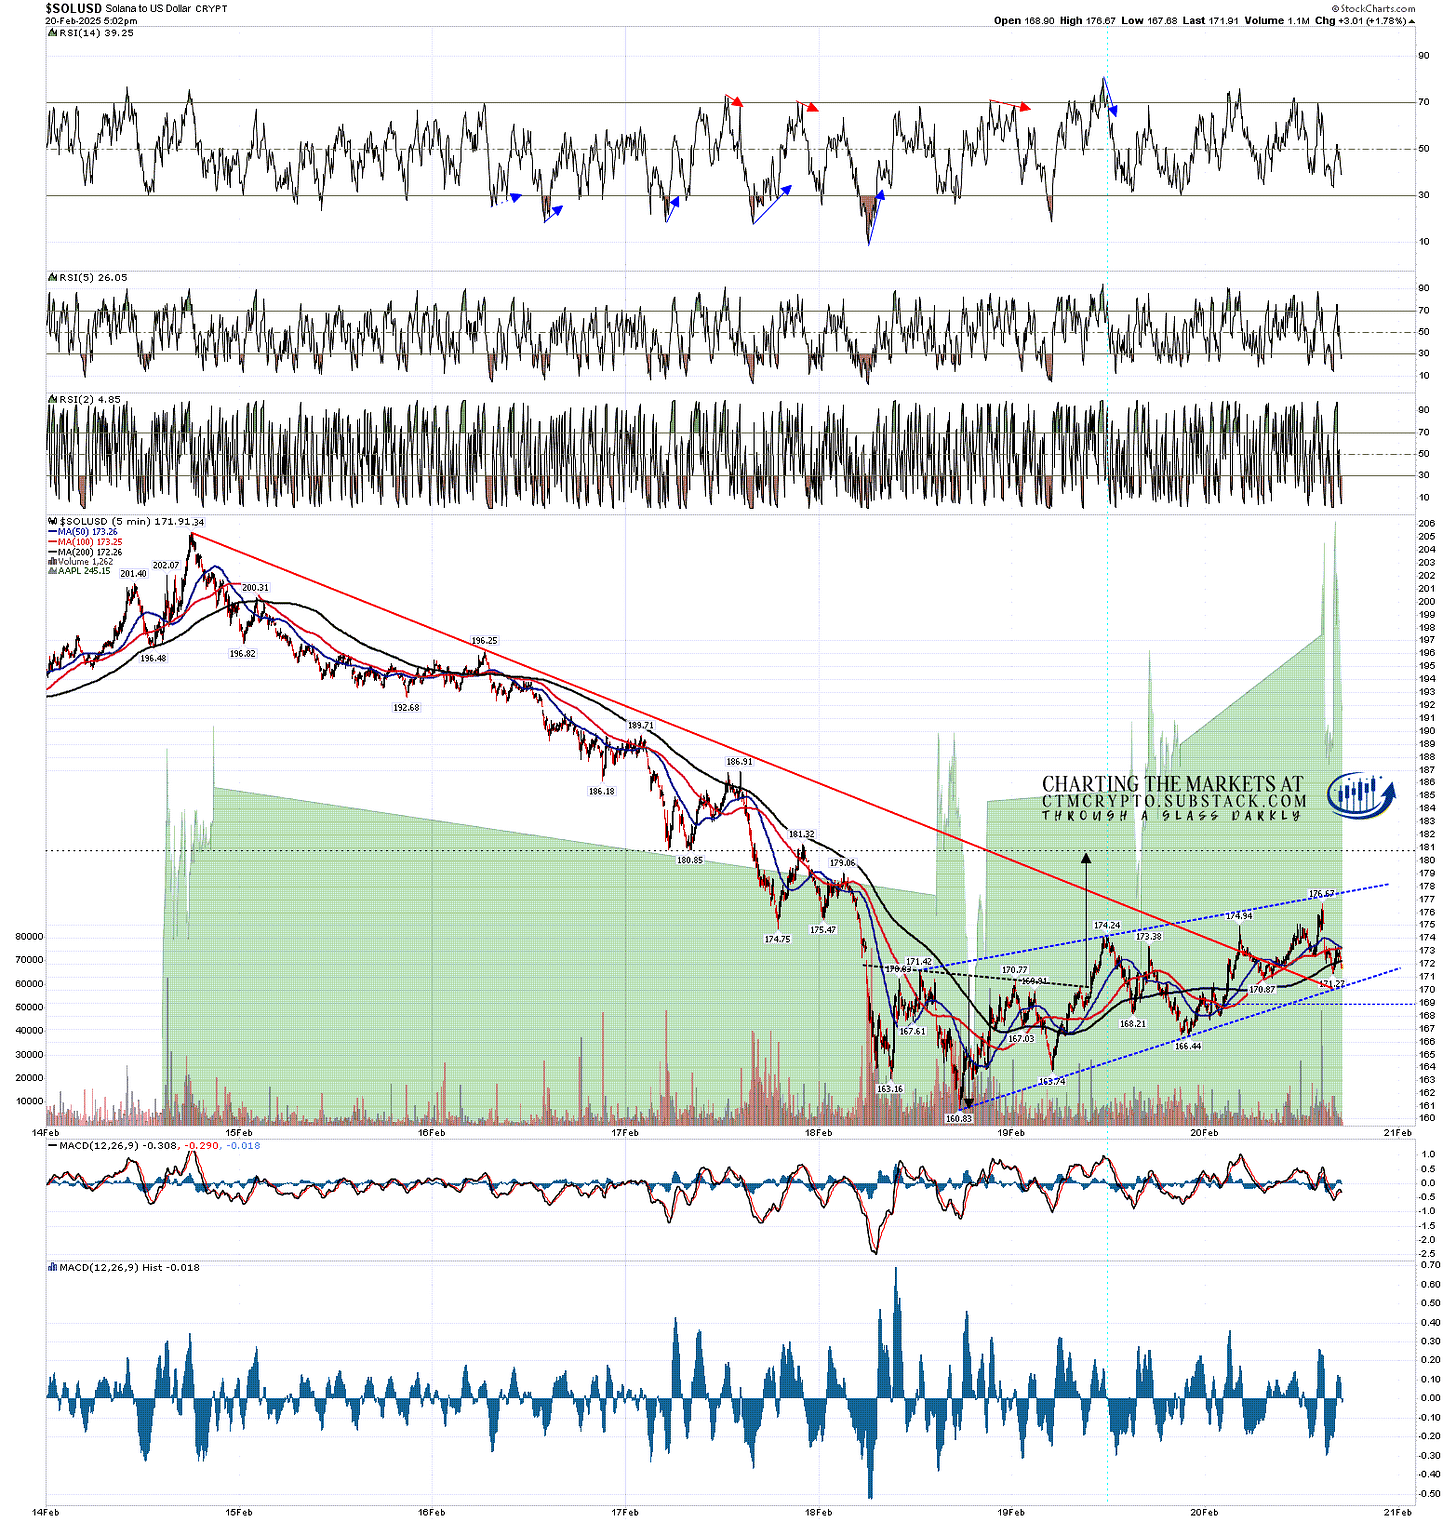
In the short term on Solana the low at 160.83 set up a possible falling wedge on Solana and the rally off that low is supported by an RSI 14 buy signal that has not yet reached target. These signals have a good track record and the obvious target would be the declining/wedge resistance trendline, currently in the 185 area.
SOLUSD 60min chart:
As it happens a high quality IHS also formed at the low and broke up with a target in the 181 area & supported by the hourly RSI 14 buy signal I really like that as a minimum target, though there is a loose bear flag look to this rally so far.
If Solana can close the week back over 180 then it could still hold the 180 to 216 range on a weekly close basis. A close below opens the 120 to 150 range for testing.
SOLUSD 5min chart:
As I mentioned at the start, on the bigger picture I am still leaning towards a retracement / consolidation on Crypto in the first half of 2025 and then strong new all time highs with a very possible bull market high pencilled in close to the end of the year. That scenario would be a good match with past Crypto bull markets.
If you’d like to see more of these posts and the other Crypto videos and information I post, please subscribe for free to my Crypto substack. I also do a premarket video every day on Crypto at 9.05am EST. If you’d like to see those I post the links every morning on my twitter, and the videos are posted shortly afterwards on my Youtube channel.
I'm also to be found at Arion Partners, though as a student rather than as a teacher. I've been charting Crypto for some years now, but am learning to trade and invest in them directly, and Arion Partners are my guide around a space that might reasonably be compared to the Wild West in one of their rougher years.


No comments:
Post a Comment