
At the start of last week I wrote a post looking at the case for a rally on US equity indices in the 12 trading day window into April 2nd, the planned day for US tariffs to be extended to most US trade partners. That rally delivered but hasn’t been quite as strong as I hoped, and I wrote another post on Monday in which I was looking at the bear flags forming on the US indices and talking about those moves topping out yesterday or today.
So here we are, the bear flags are all formed and today is the day I was expecting these to top out if that didn’t happen yesterday. We’ll see if that happens and if it does, then I have sketched out a possible ideal path that this reversal may take.
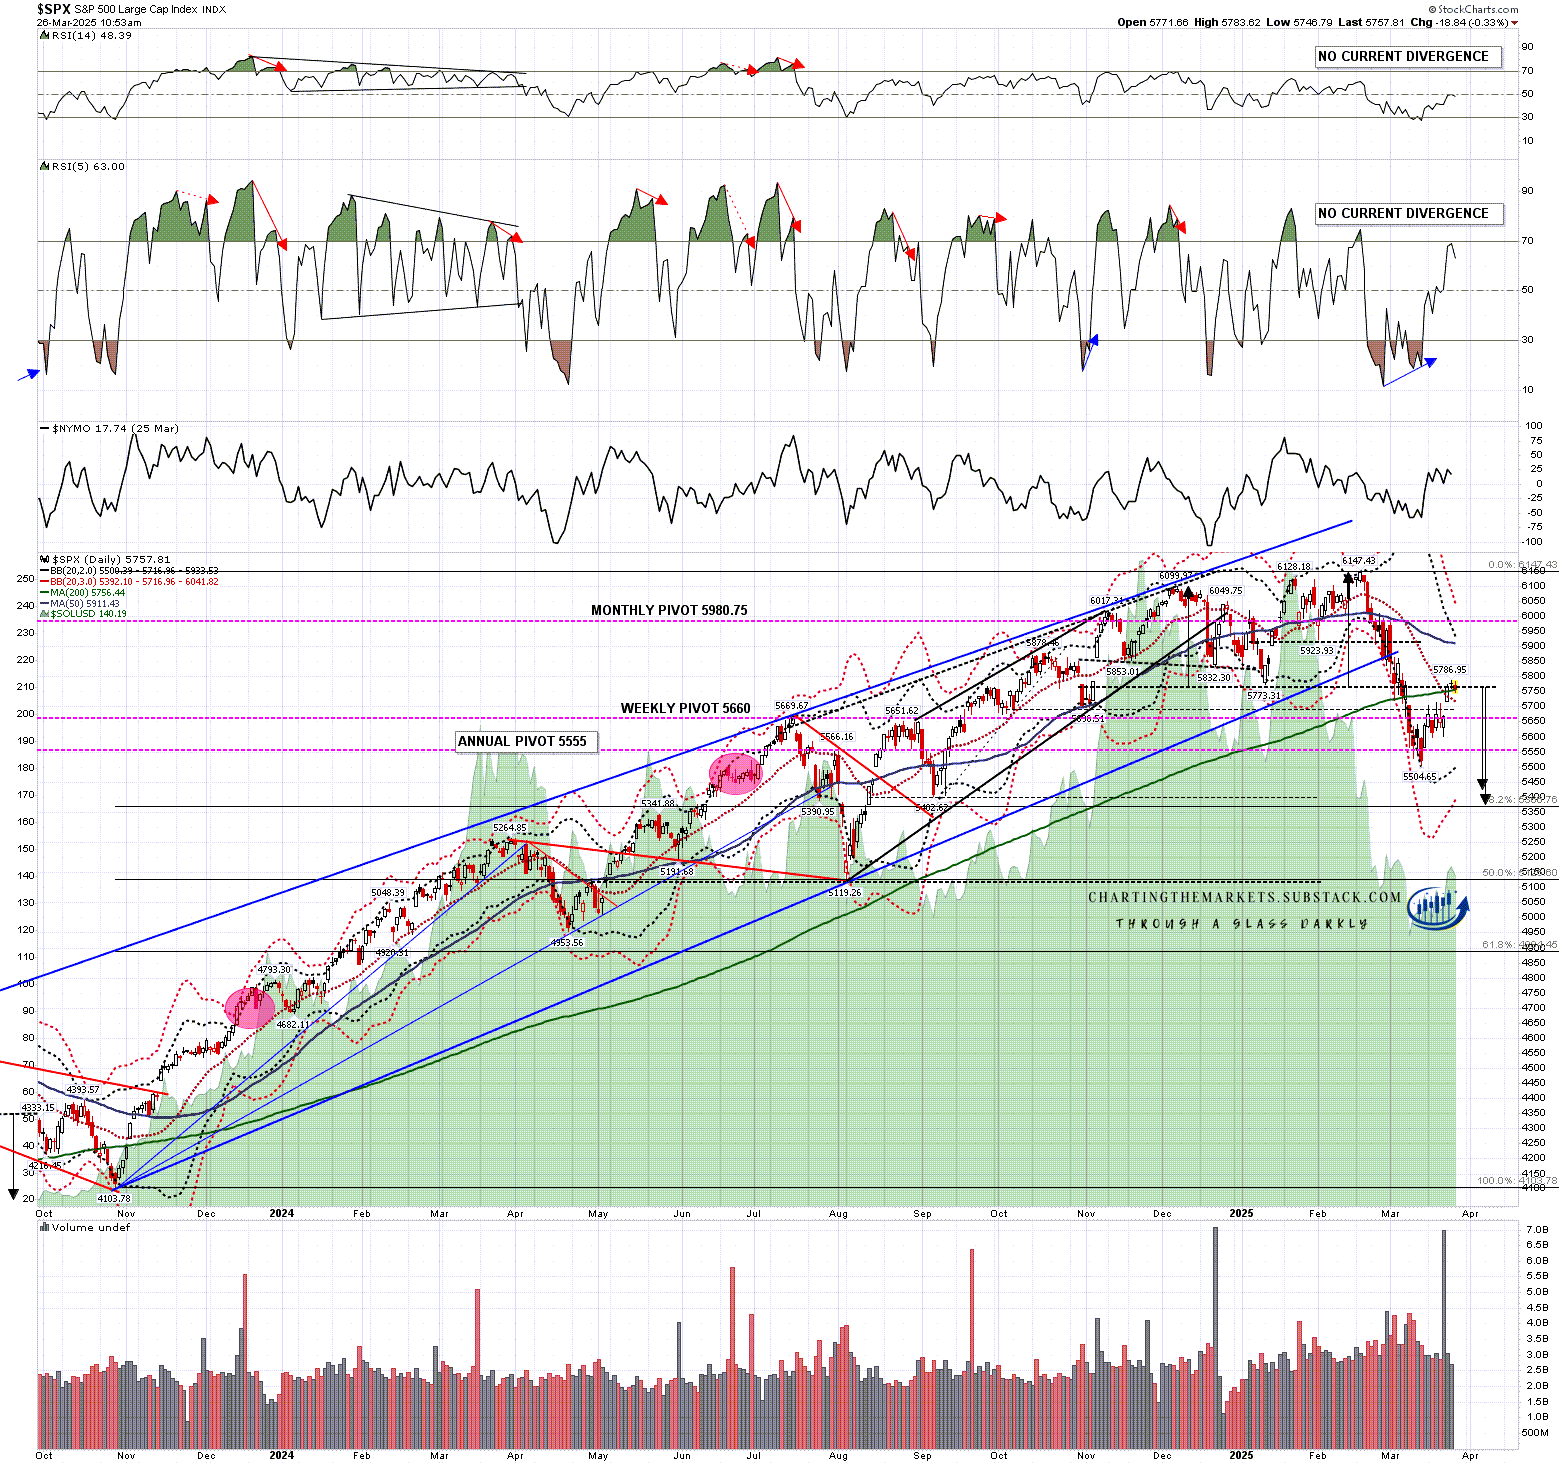
First though I’ll show the SPX daily chart where SPX broke back over the daily middle band, currently at 5716, on Monday and then the 200dma, currently at 5756, yesterday. If this is a bullish break then this would be where SPX would convert these levels back to support or, if this is a failed bullish break, SPX would reject back below these levels, and most likely, that would happen today.
SPX daily chart:
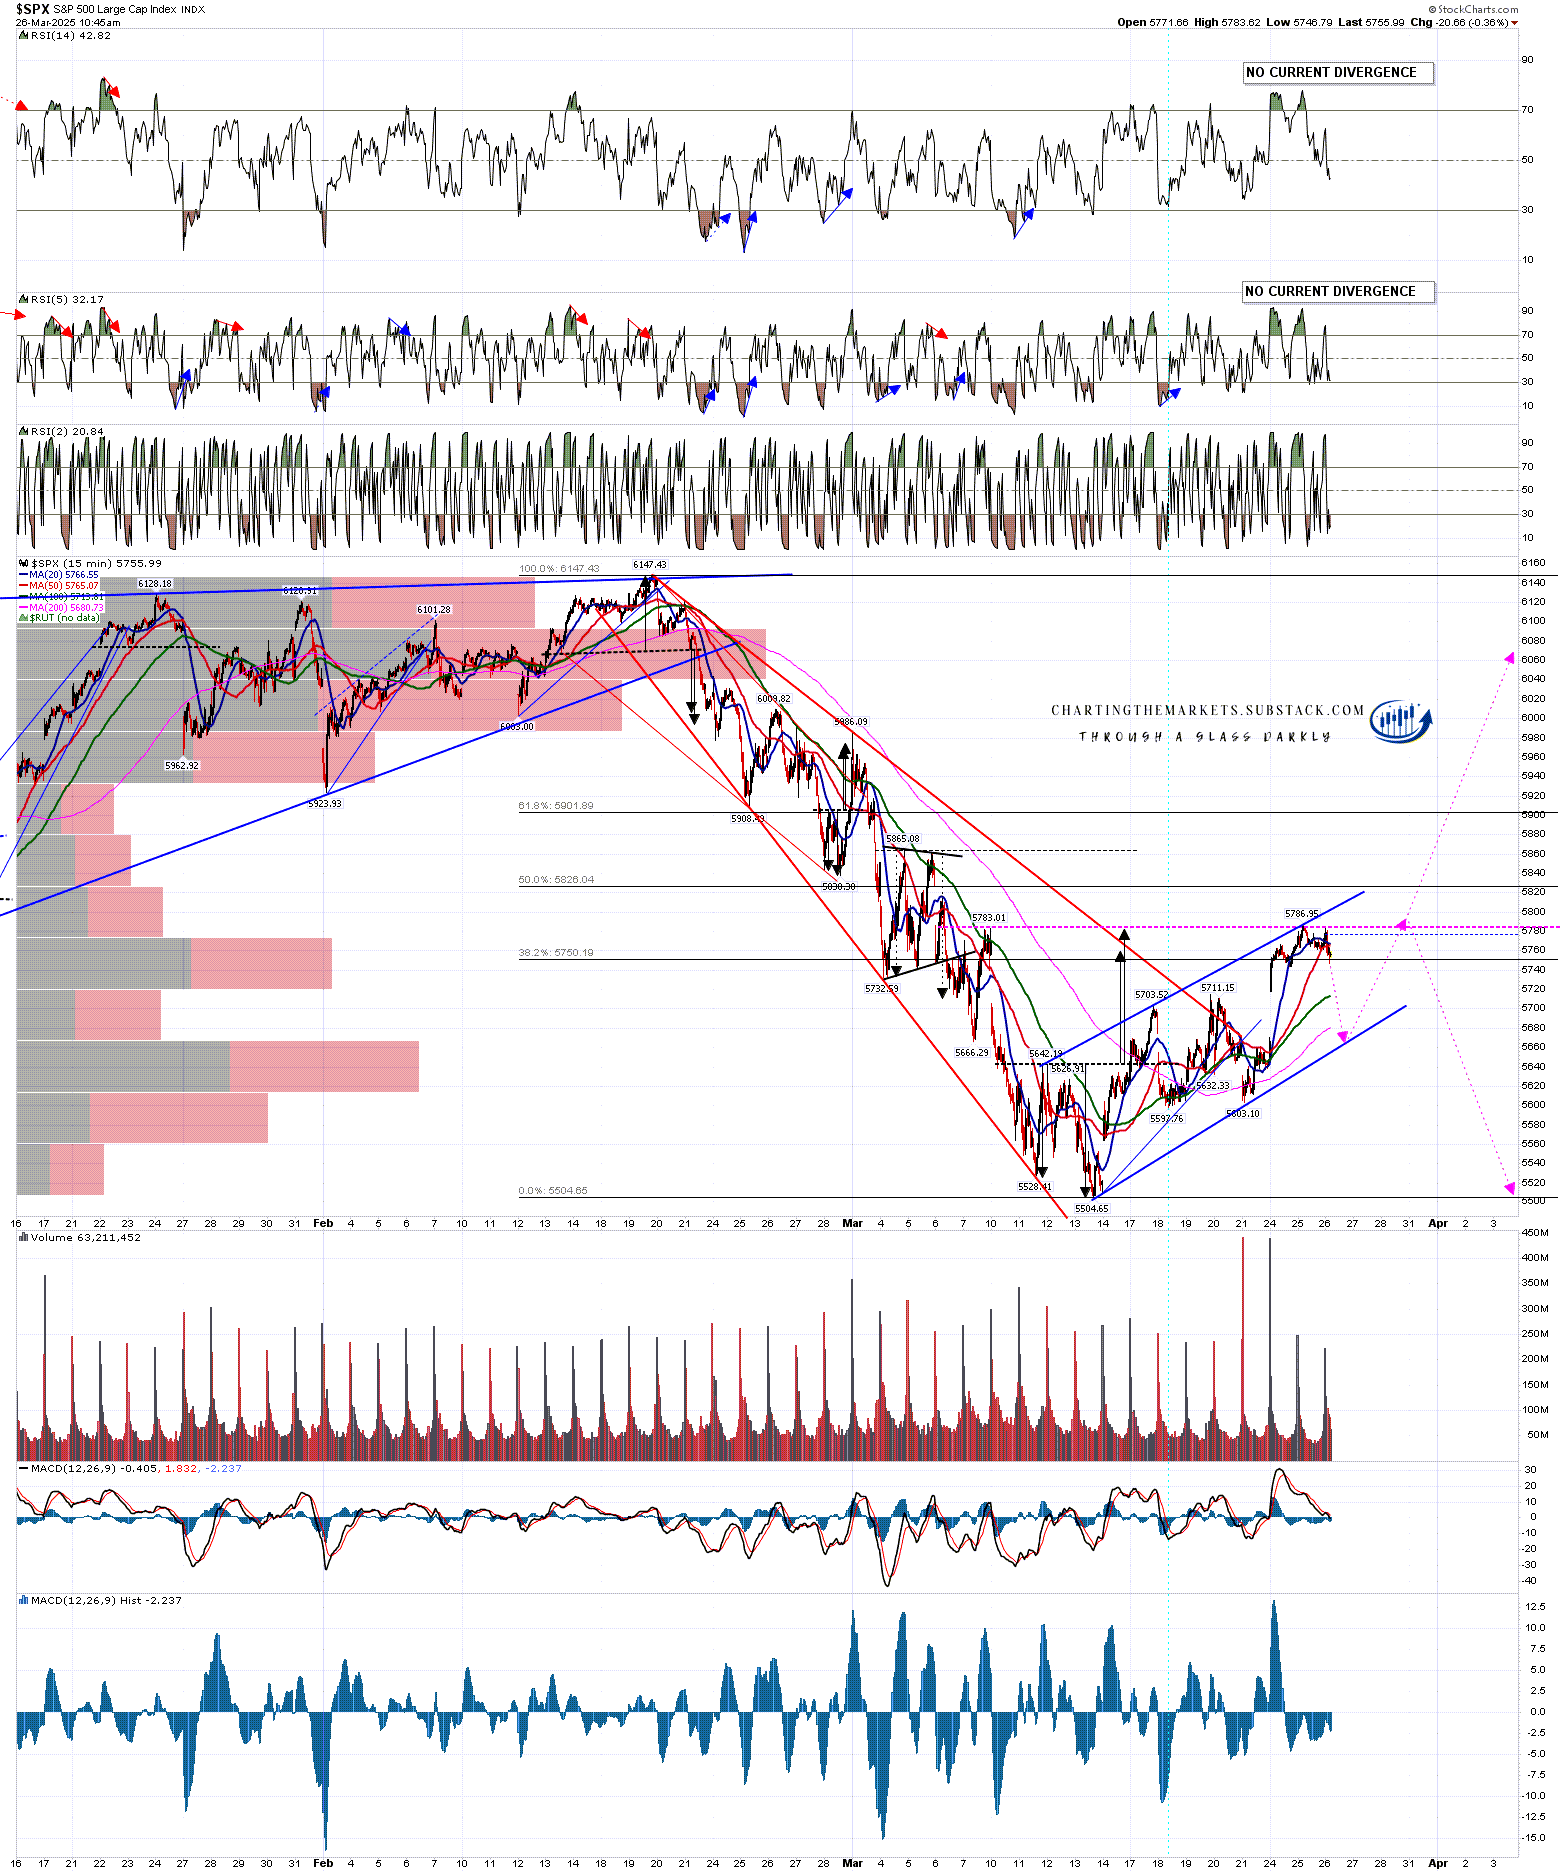
I laid out the main decline options in my premarket video today, and I’ve sketched my favorite of these out on the 15min charts below. Something to note here is that all of the indices below have reached possible IHS necklines so any initial decline may be forming a bullish IHS right shoulder for a break higher that could happen in the event that the current April 2 tariff plans are delayed or abandoned altogether. I don’t think that is that likely but the setup is there so I have sketched that in too. Since I did the premarket video ES has declined almost 40 handles and I suspect this move has now started.
These are not the only options, but are my preferred options. One notable alternative option is a direct return on all of these to retest the March lows.
On SPX I’d be looking for an initial decline back into the ideal right shoulder low area around 5666, then a retest of the current rally high at 5787, then either a break higher or, more likely, a break back down towards a retest of the March low at 5504.65.
SPX 15min chart:
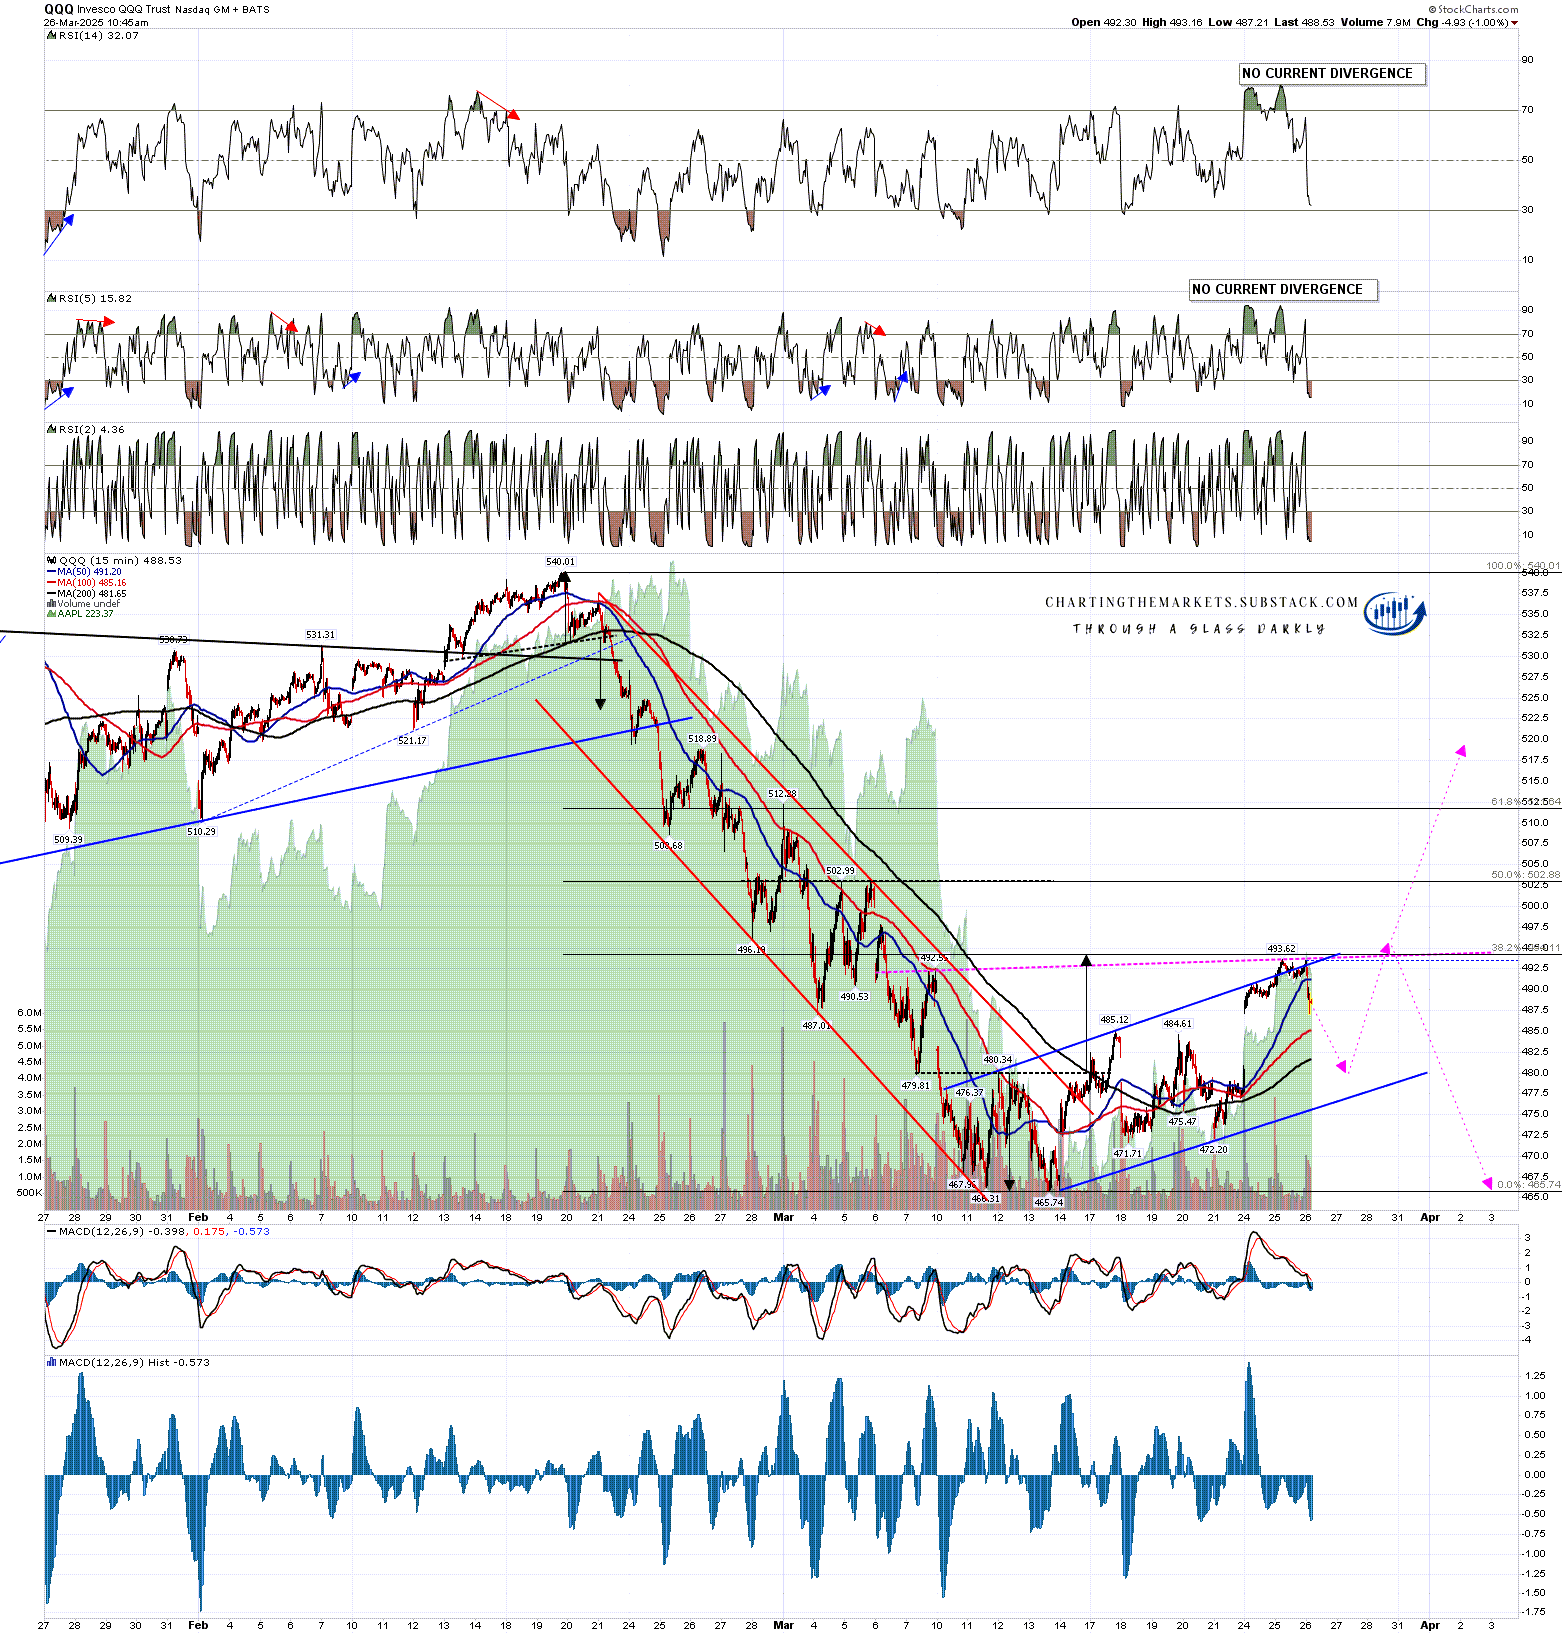
On QQQ I’d be looking for an initial decline back into the ideal right shoulder low area around 480, then a retest of the current rally high at 493/4, then either a break higher or, more likely, a break back down towards a retest of the March low at 465.74.
QQQ 15min chart:
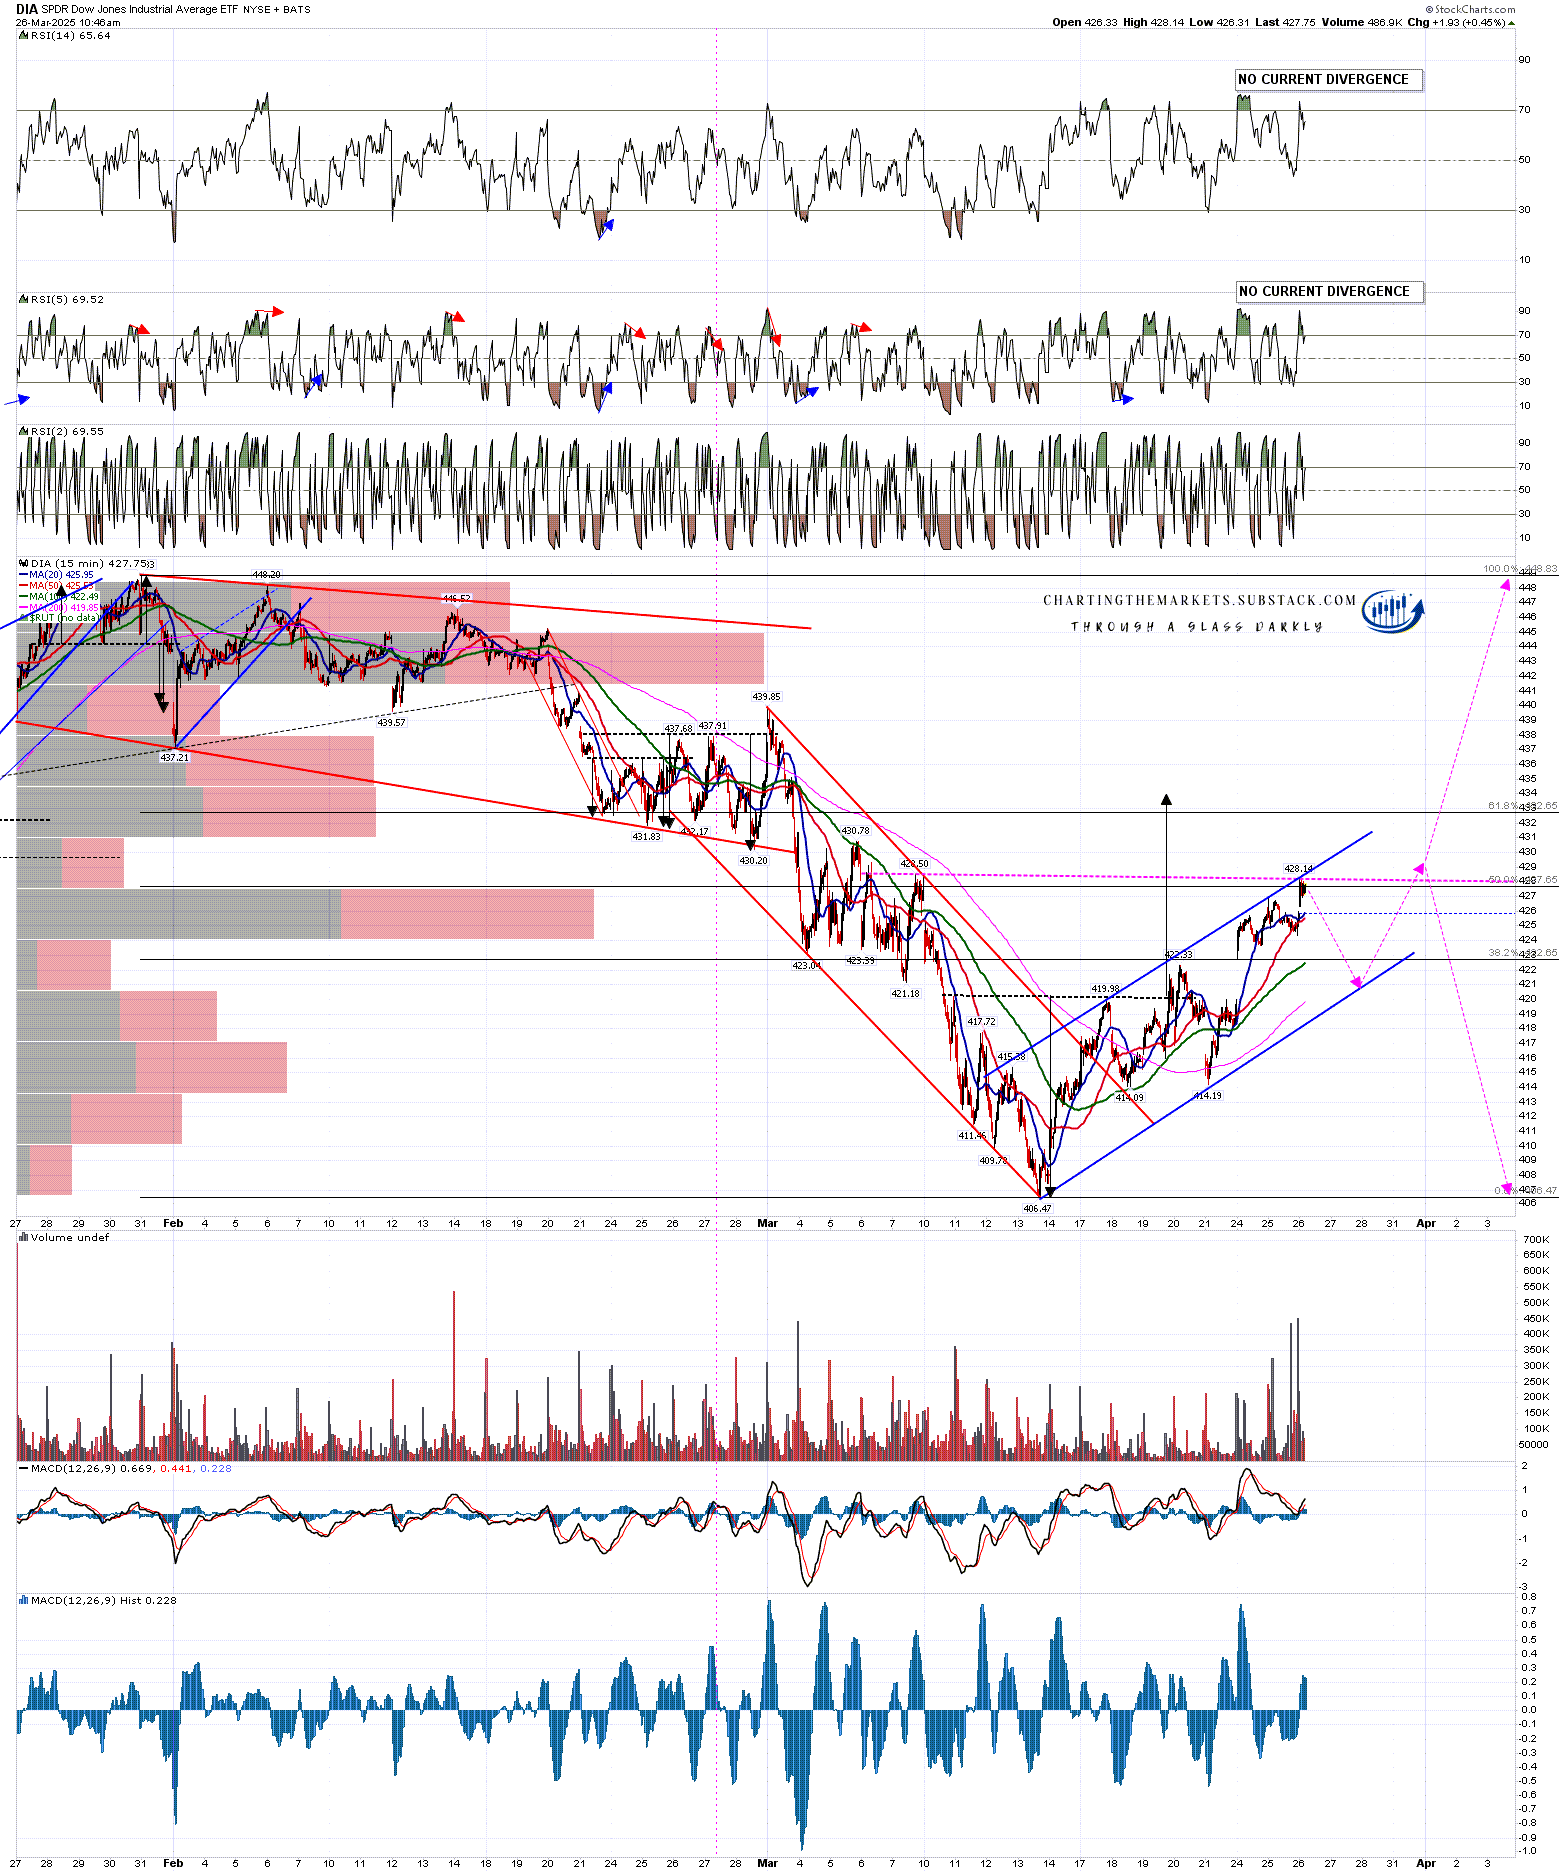
On DIA I’d be looking for an initial decline back into the ideal right shoulder low area around 421, then a retest of the current rally high at 428, then either a break higher or, more likely, a break back down towards a retest of the March low at 406.47.
DIA 15min chart:
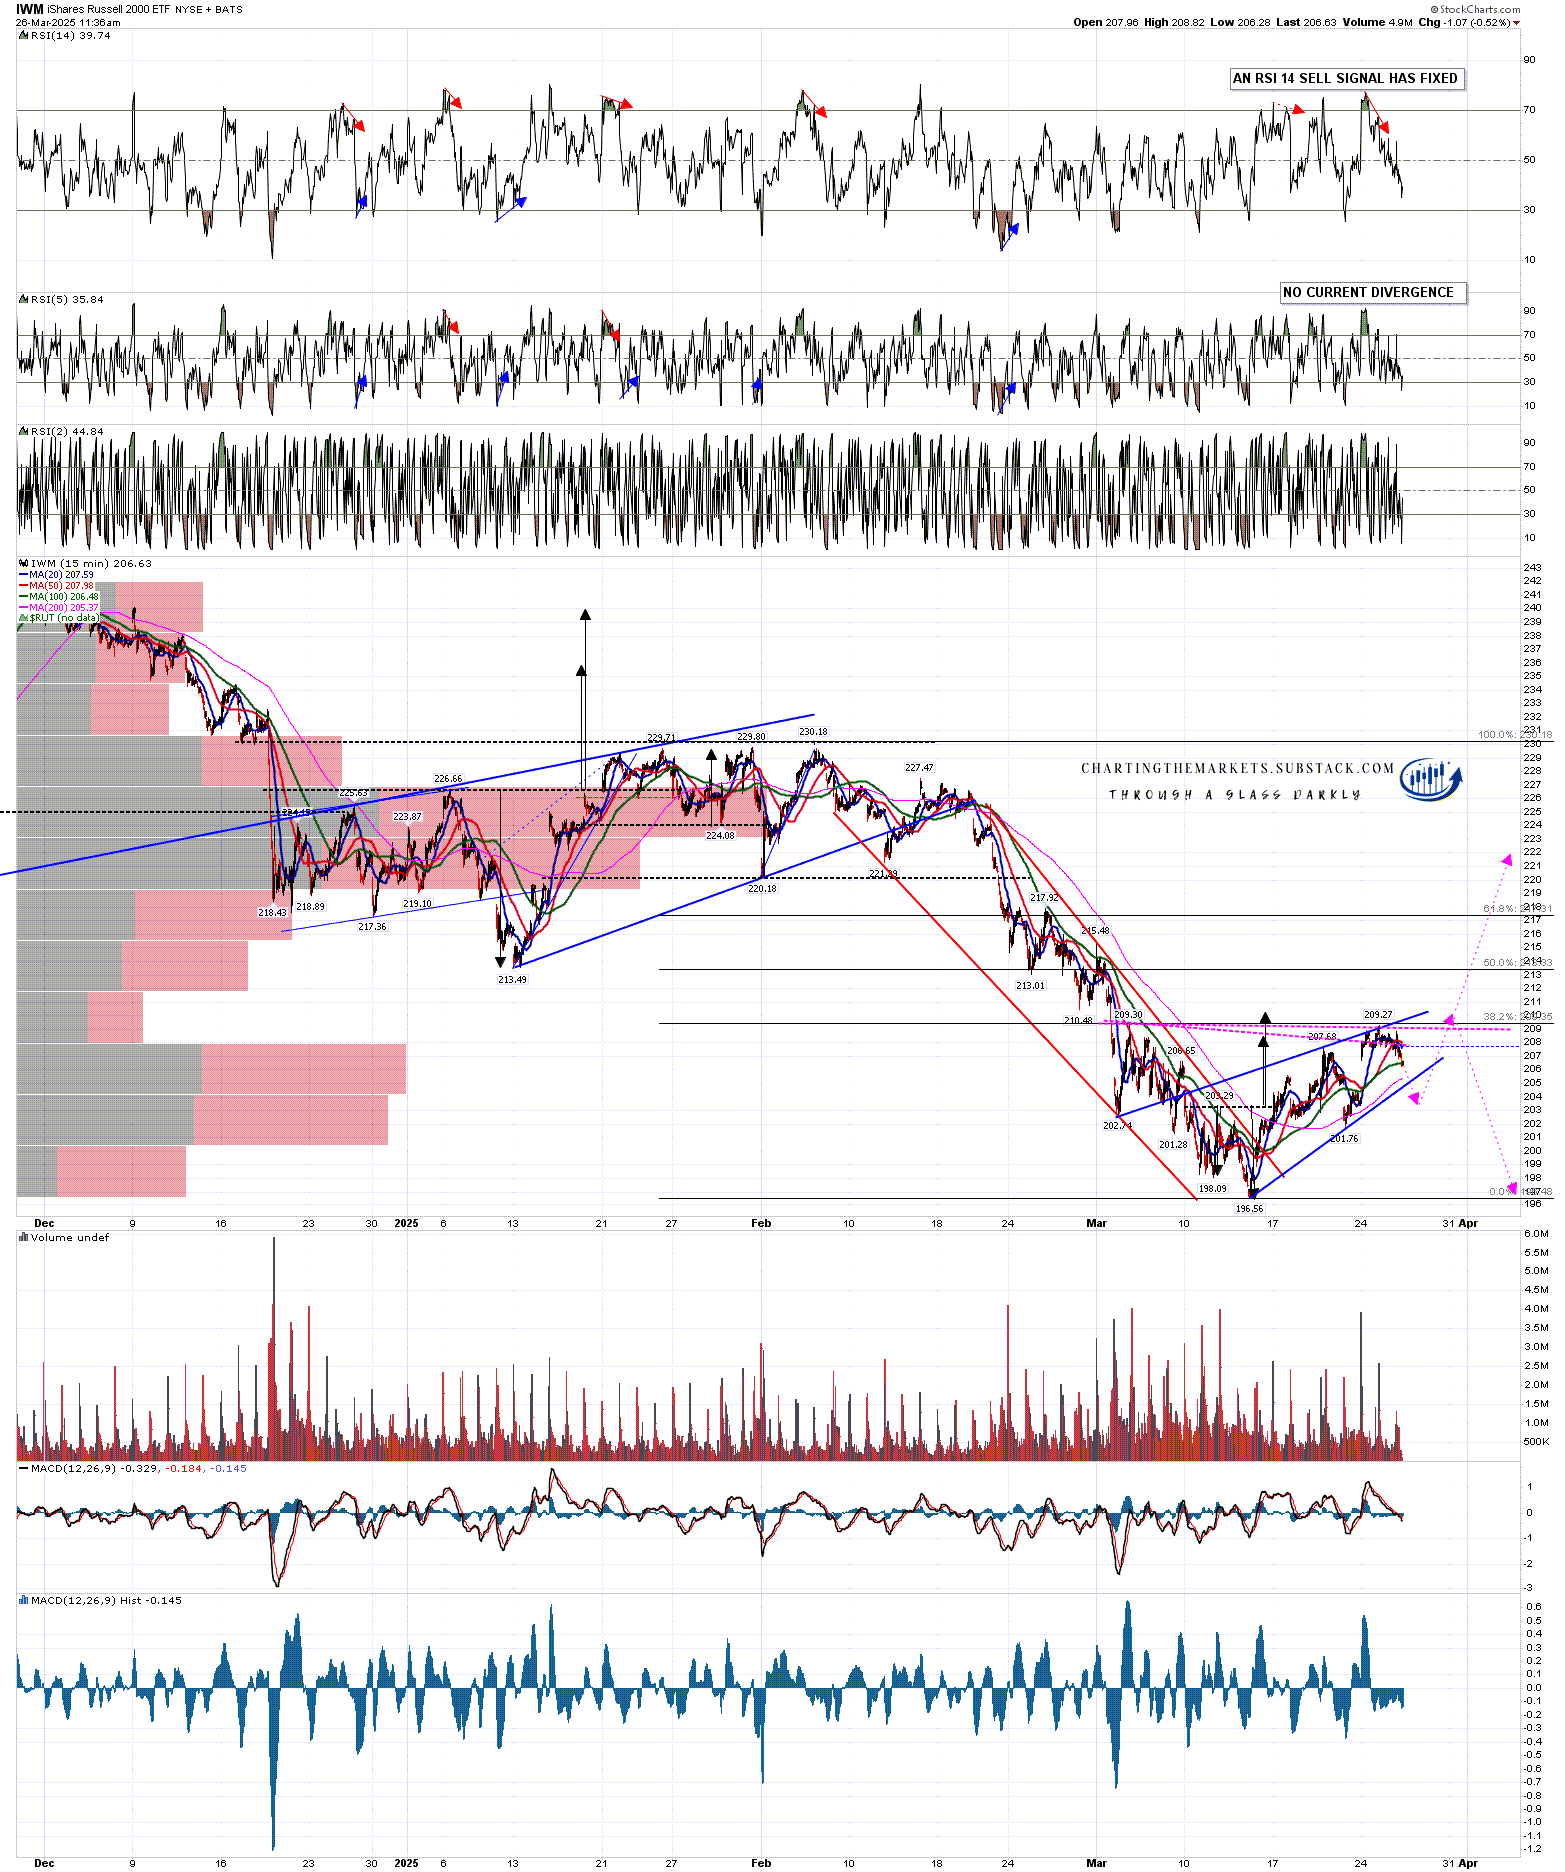
On IWM I’d be looking for an initial decline back into the ideal right shoulder low area around 202/3, then a retest of the current rally high at 209/10, then either a break higher or, more likely, a break back down towards a retest of the March low at 196.56.
IWM chart:
My working assumption here is that the April 2nd date for a major escalation of the trade war will go ahead as planned to a significant degree against most current US large trading partners, notably against Europe, which appears to be particularly detested by the Trump administration. If so, I‘m expecting that will have a significant impact on economic growth and the equity markets so I am planning a post either tomorrow or Friday looking at the lower targets that might then be reached on these US equity indices if we are seeing another big leg down on equities start here.
As I have been since the start of 2025 I’m still leaning on the bigger picture towards a weak first half of 2025 and new all time highs later in the year, very possibly as a topping process for a much more significant high. One way or another I think we’ll be seeing lower soon and I’m not expecting this to be a good year for US equities, not least because both of the last two years have been banner years for US equities. A third straight year of these kinds of gains looks like a big stretch. I could of course however be mistaken. UPDATE 11th March 2025 - I am wondering if this may be a bear market that dominates the whole of 2025.
If you like my analysis and would like to see more, please take a free subscription at my chartingthemarkets substack, where I publish these posts first. I also do a premarket video every day on equity indices, bonds, currencies, energies, precious commodities and other commodities at 8.45am EST. If you’d like to see those I post the links every morning on my twitter, and the videos are posted shortly afterwards on my Youtube channel.
No comments:
Post a Comment