
A week ago I wrote a post looking at the case for a rally on US equity indices in the 12 trading day window into April 2nd, the planned day for US tariffs to be extended to most US trade partners. That rally has delivered so far but hasn’t been as strong as I hoped, and I want to look today at the rally patterns that have been forming, and what I’m expecting to see over the rest of the rally window.
In my The Bigger Picture video yesterday I was looking at these rally patterns and saying that the initial bottoming pattern target might not all be reached as US indices appeared to be forming bear flags. I was saying that the next obvious move would be another leg up into new rally highs across the board, but that the rally might fail soon after, possibly on Tuesday or Wednesday this week.
In that video I was also looking at the likely impact of these tariffs, described that as being in a likely range between bad and very very bad, and looking at the obvious target areas on US indices if another big leg down starts at the end of the current rally. I’m planning a post looking at these tomorrow or Wednesday but that’s partly already covered in yesterday’s video if you want to see that now.
On to the rally. A week ago, based on previous instances of tests of the 3sd weekly lower bands, I was predicting a minimum two week rally or slightly less, and likely minimum 7% rally from the previous week’s lows. That minimum would see a rally high earliest in the middle of this week, and with the SPX March low at 5504.65, the high so far today at the time of writing, is a rally of 4.76% from the low. A rally of 7% would take SPX into the 5889 area but the pattern setup is suggesting that this rally may top out lower and sooner than that. Let’s have a look at those setups.
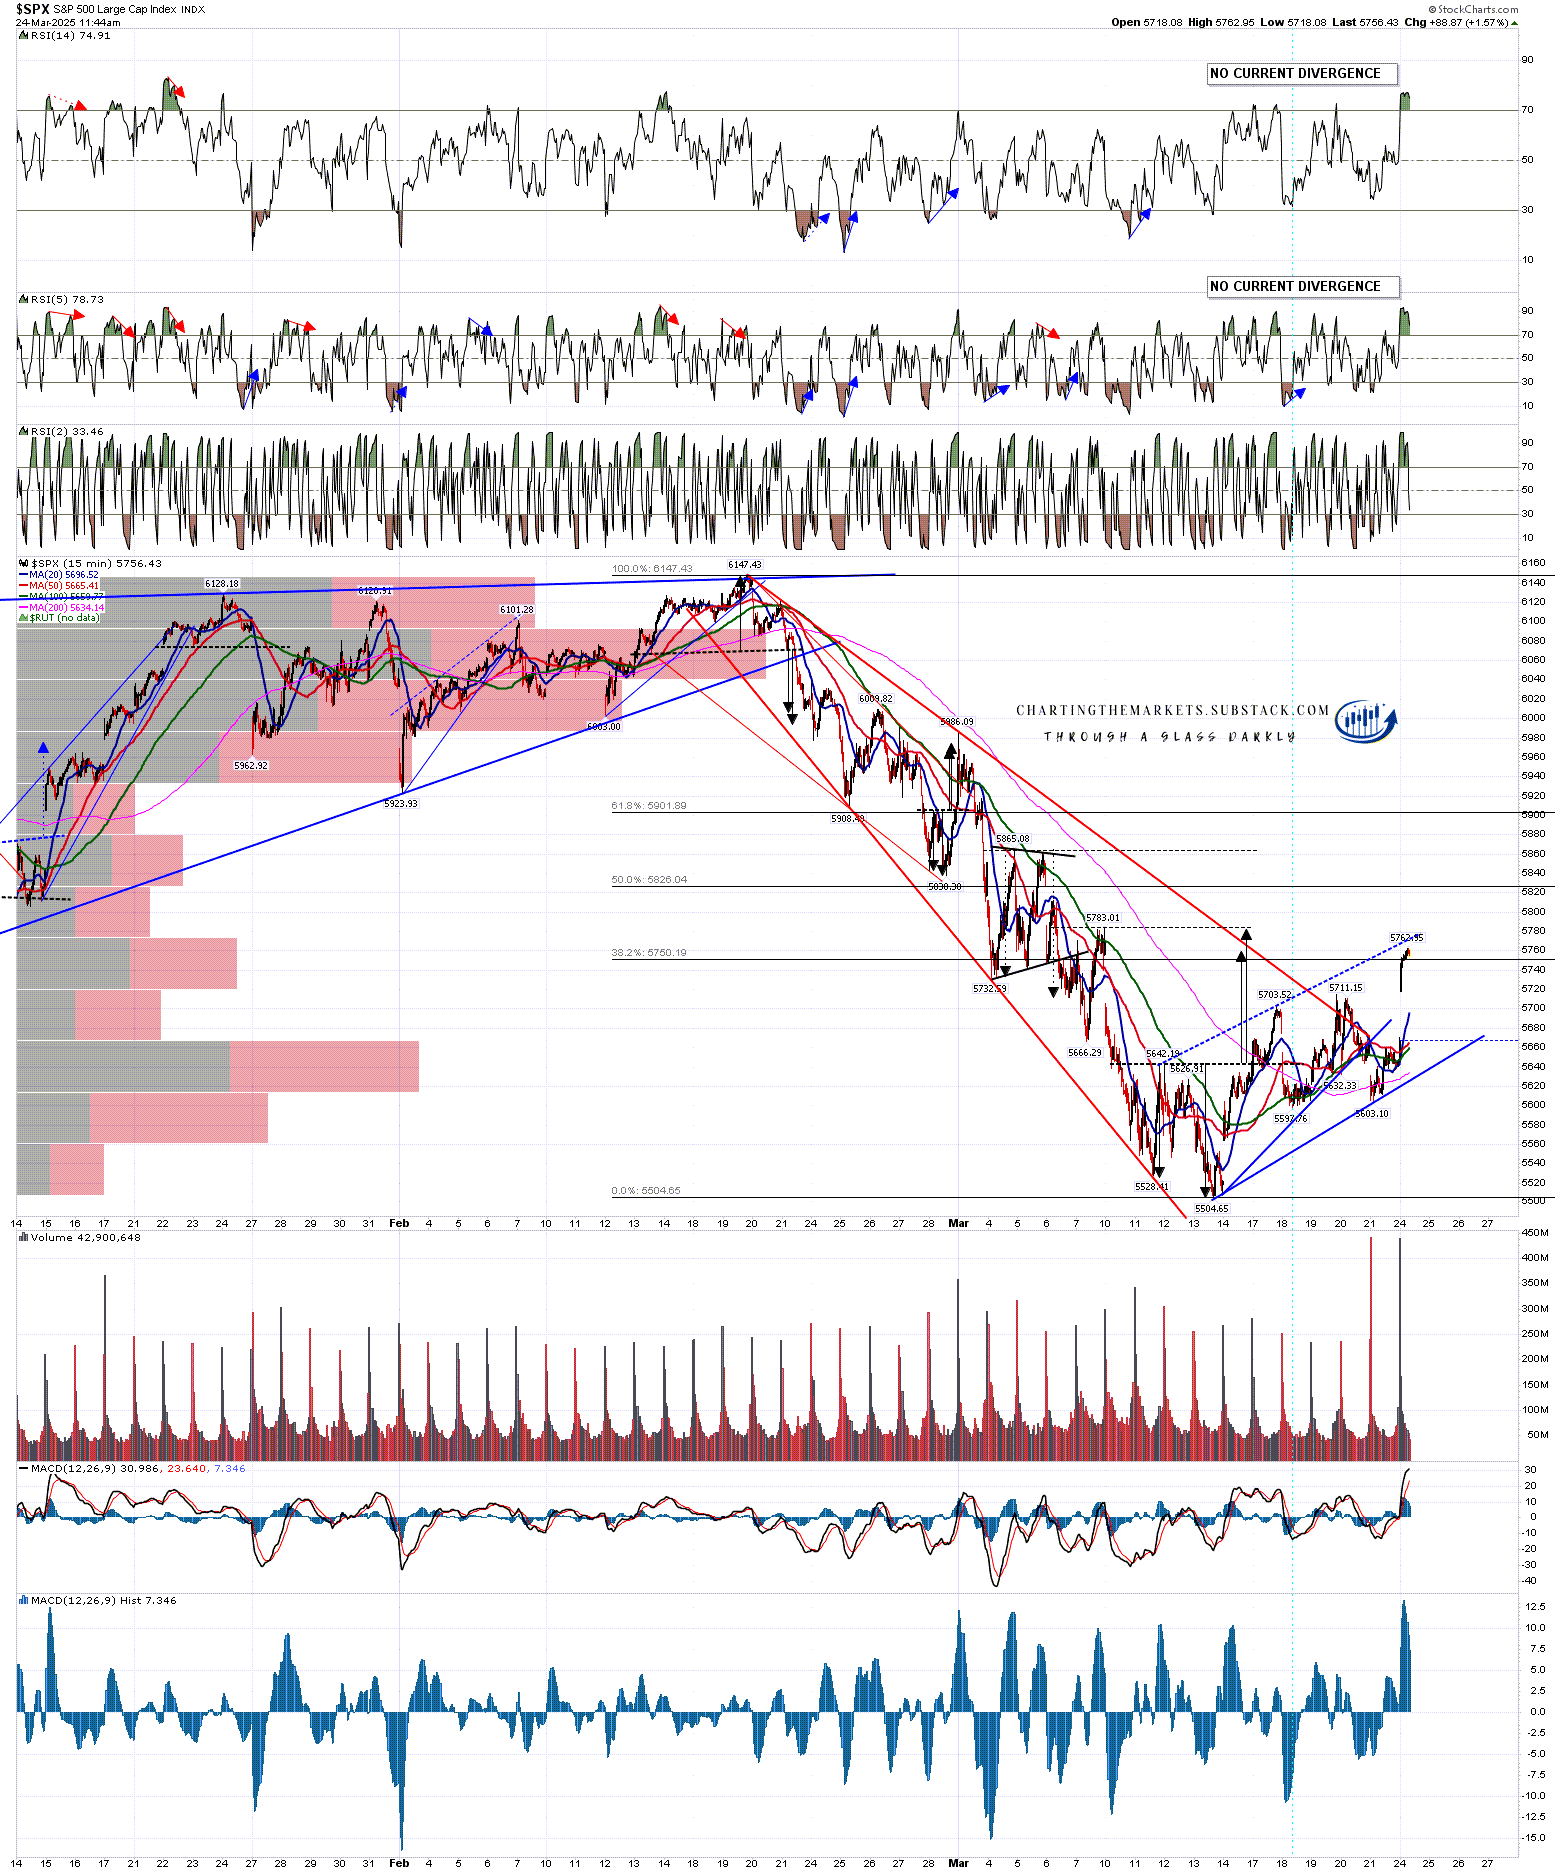
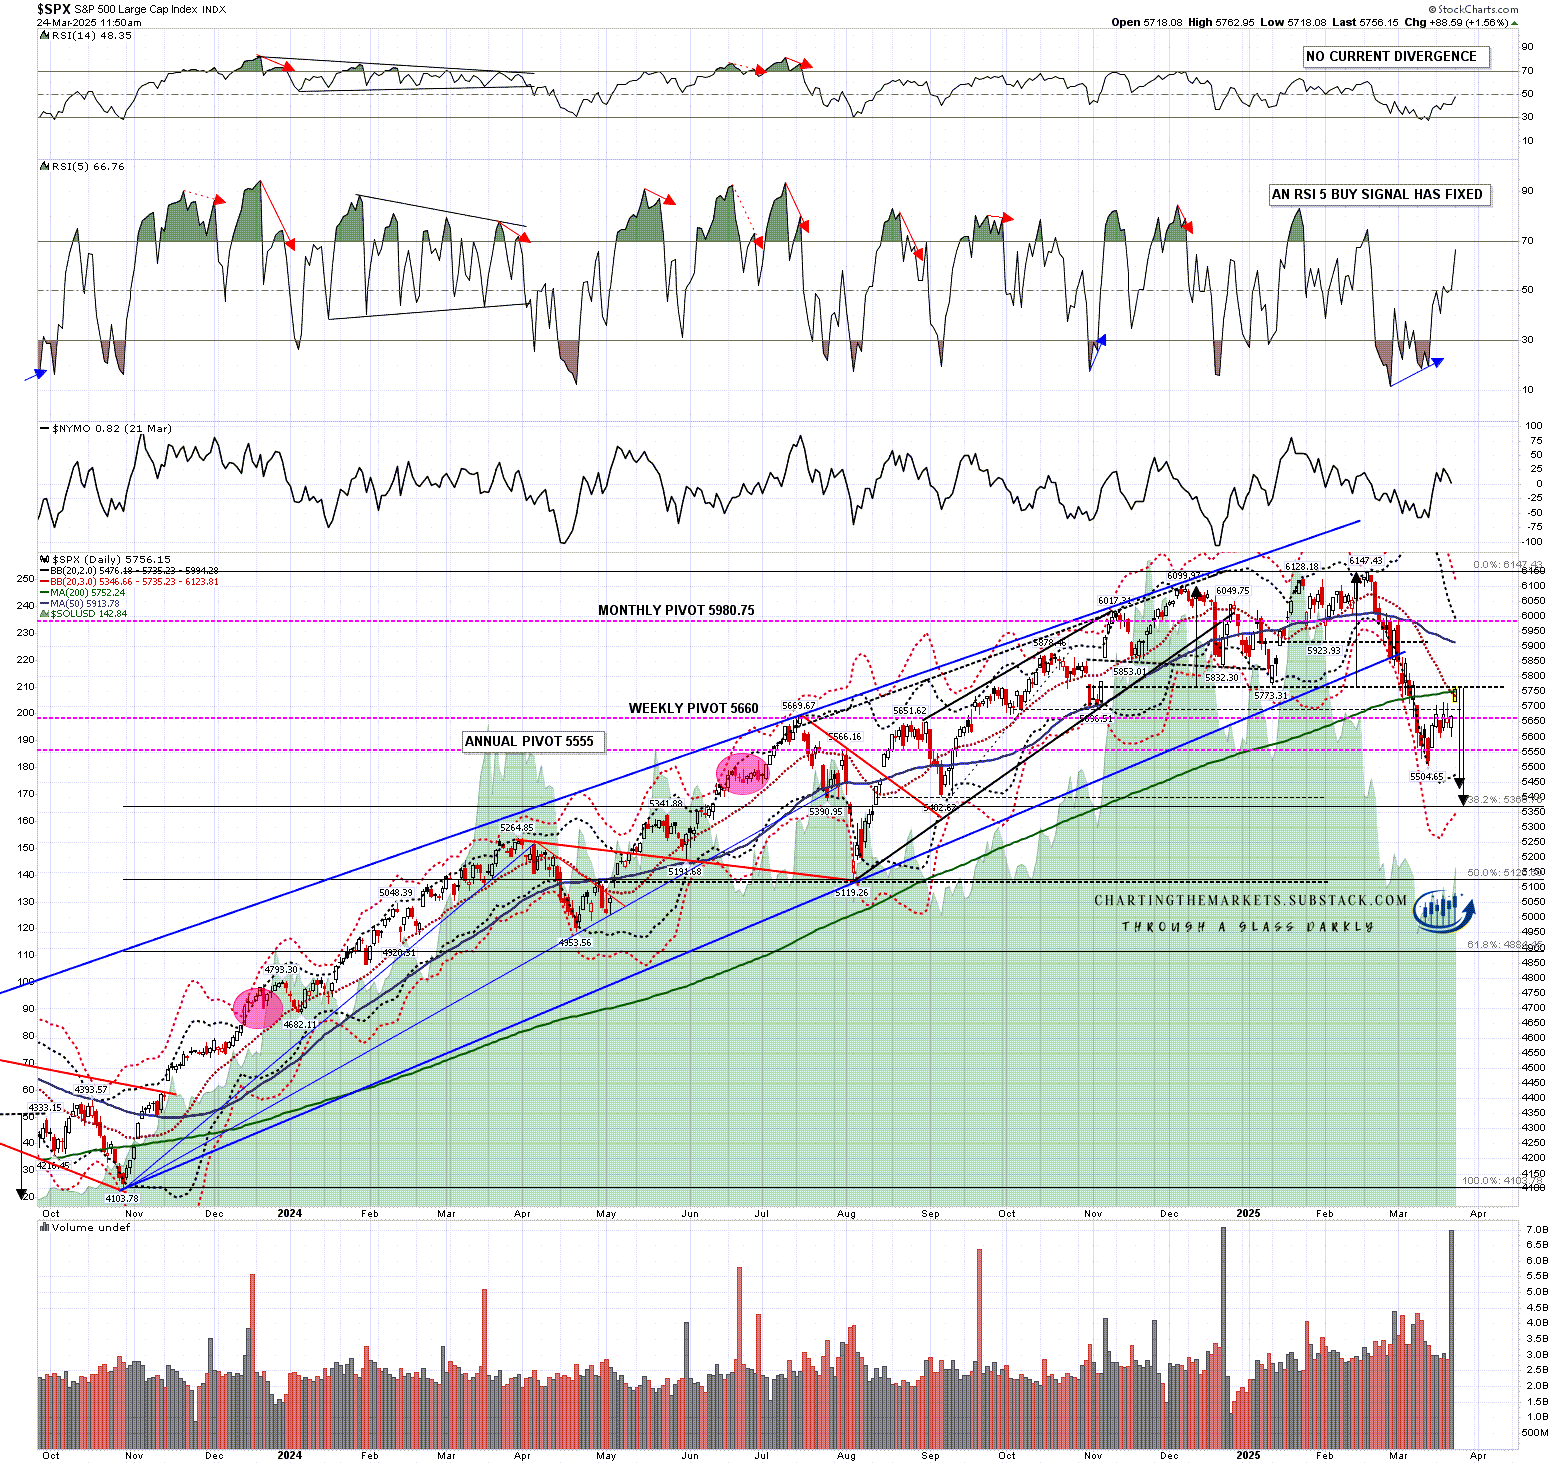
On the SPX chart a small double bottom had formed and broken up with a target in the 5760 to 5780 range. That made target this morning but a very possible bear flag rising wedge has been forming and the obvious trendline resistance for that is now slightly higher than price, currently in the 5775-80 area.
There was an old hourly RS14 buy signal fixed, which reached the possible near miss target this morning, and a fixed daily RSI 5 buy signal which will reach the possible near miss target at the close today if price remains strong for the rest of the day.
SPX 15min chart:
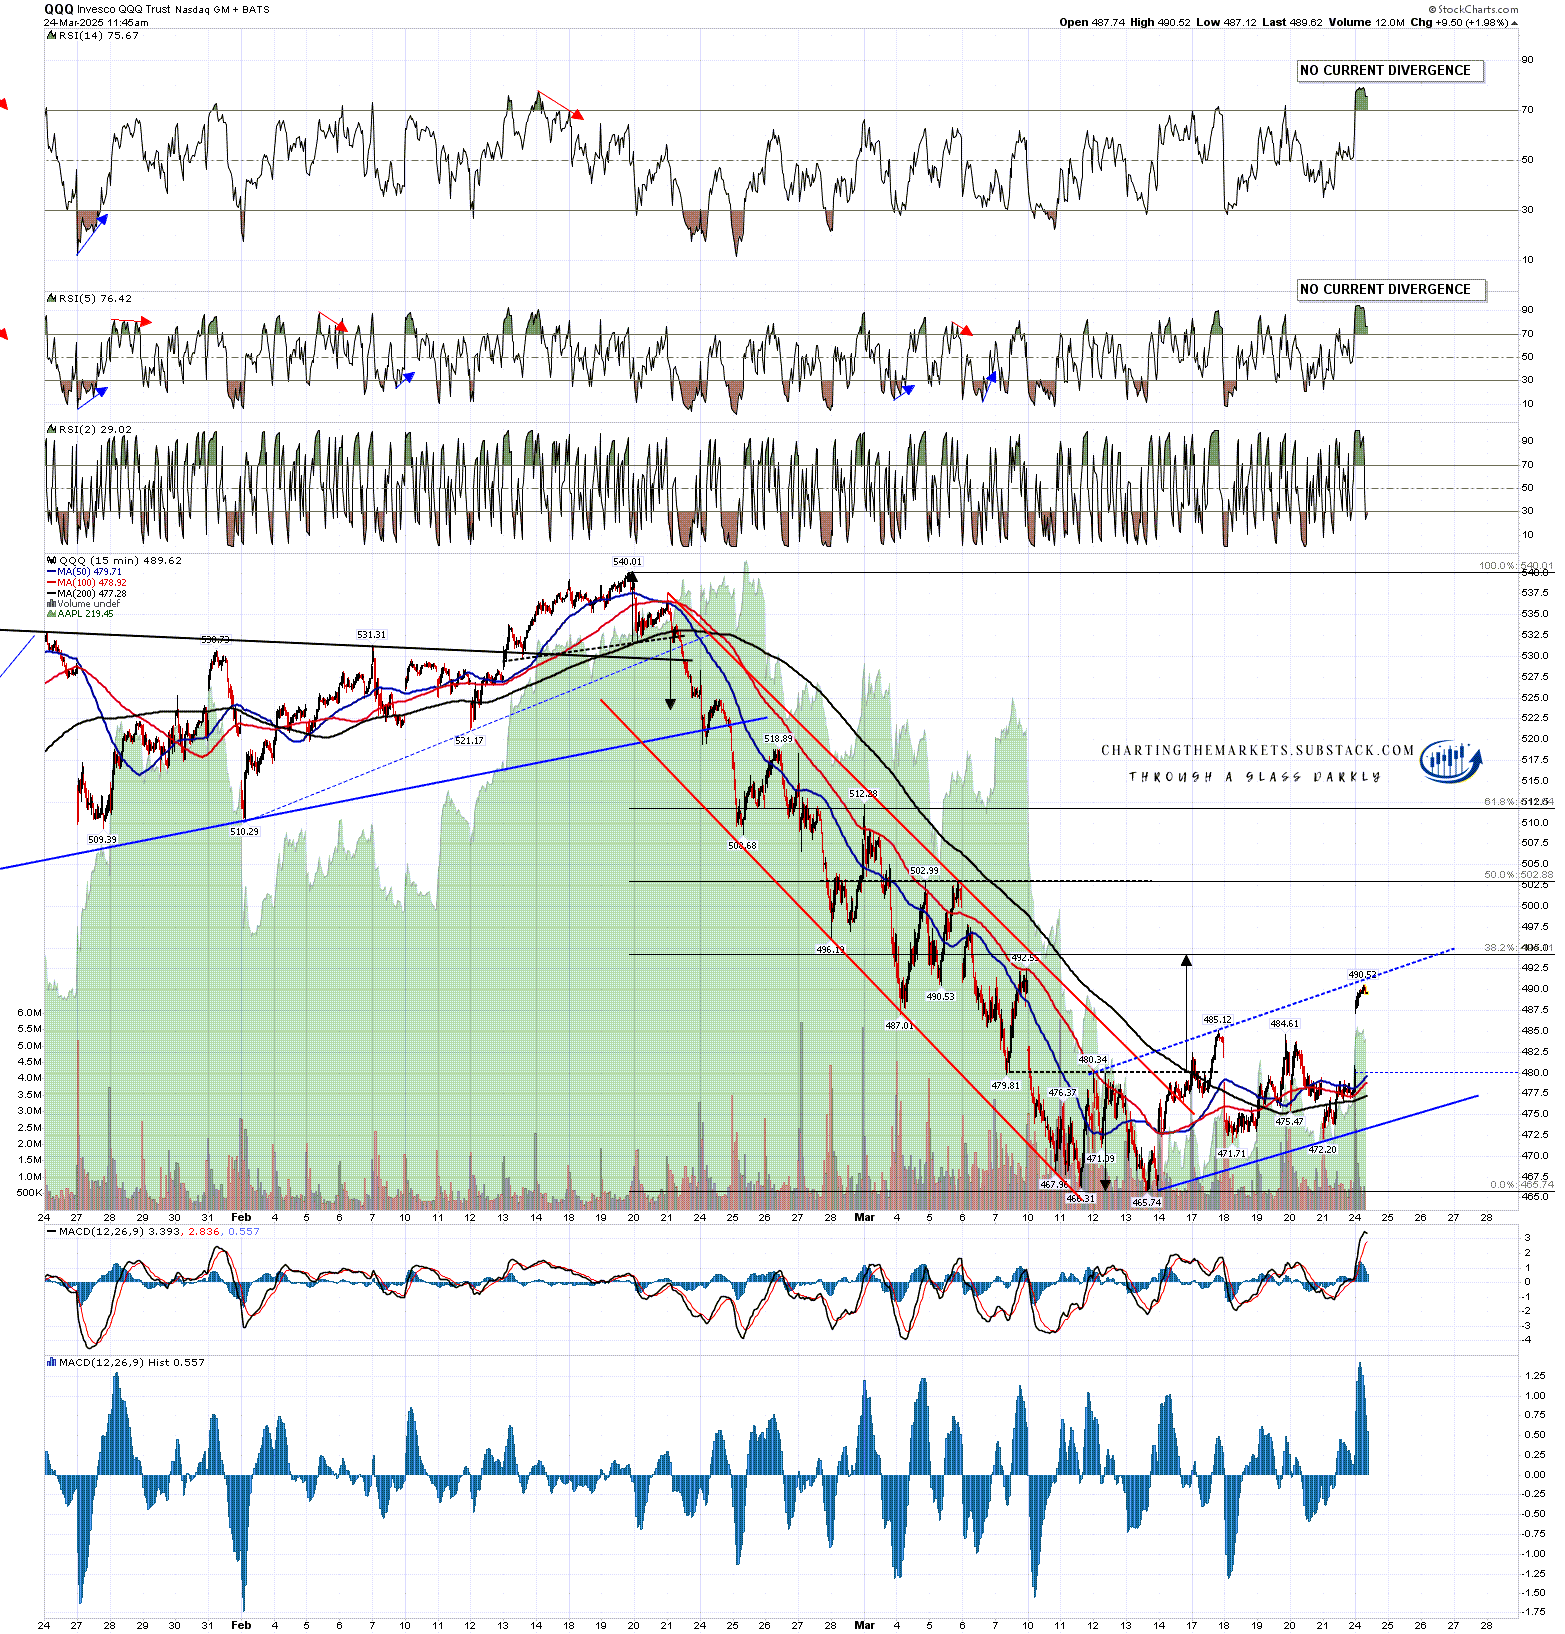
On the QQQ chart a small double bottom had formed and broken up with a target in the 495 area. That hasn’t made target yet, and may not, but a very possible bear flag rising megaphone has been forming and the obvious trendline resistance for that is now slightly higher than price, currently in the 493 area.
There was an old hourly RS14 buy signal fixed, which reached the possible near miss target this morning, and a fixed daily RSI 5 buy signal which will reach the possible near miss target at the close today if price remains strong for the rest of the day.
QQQ 15min chart:
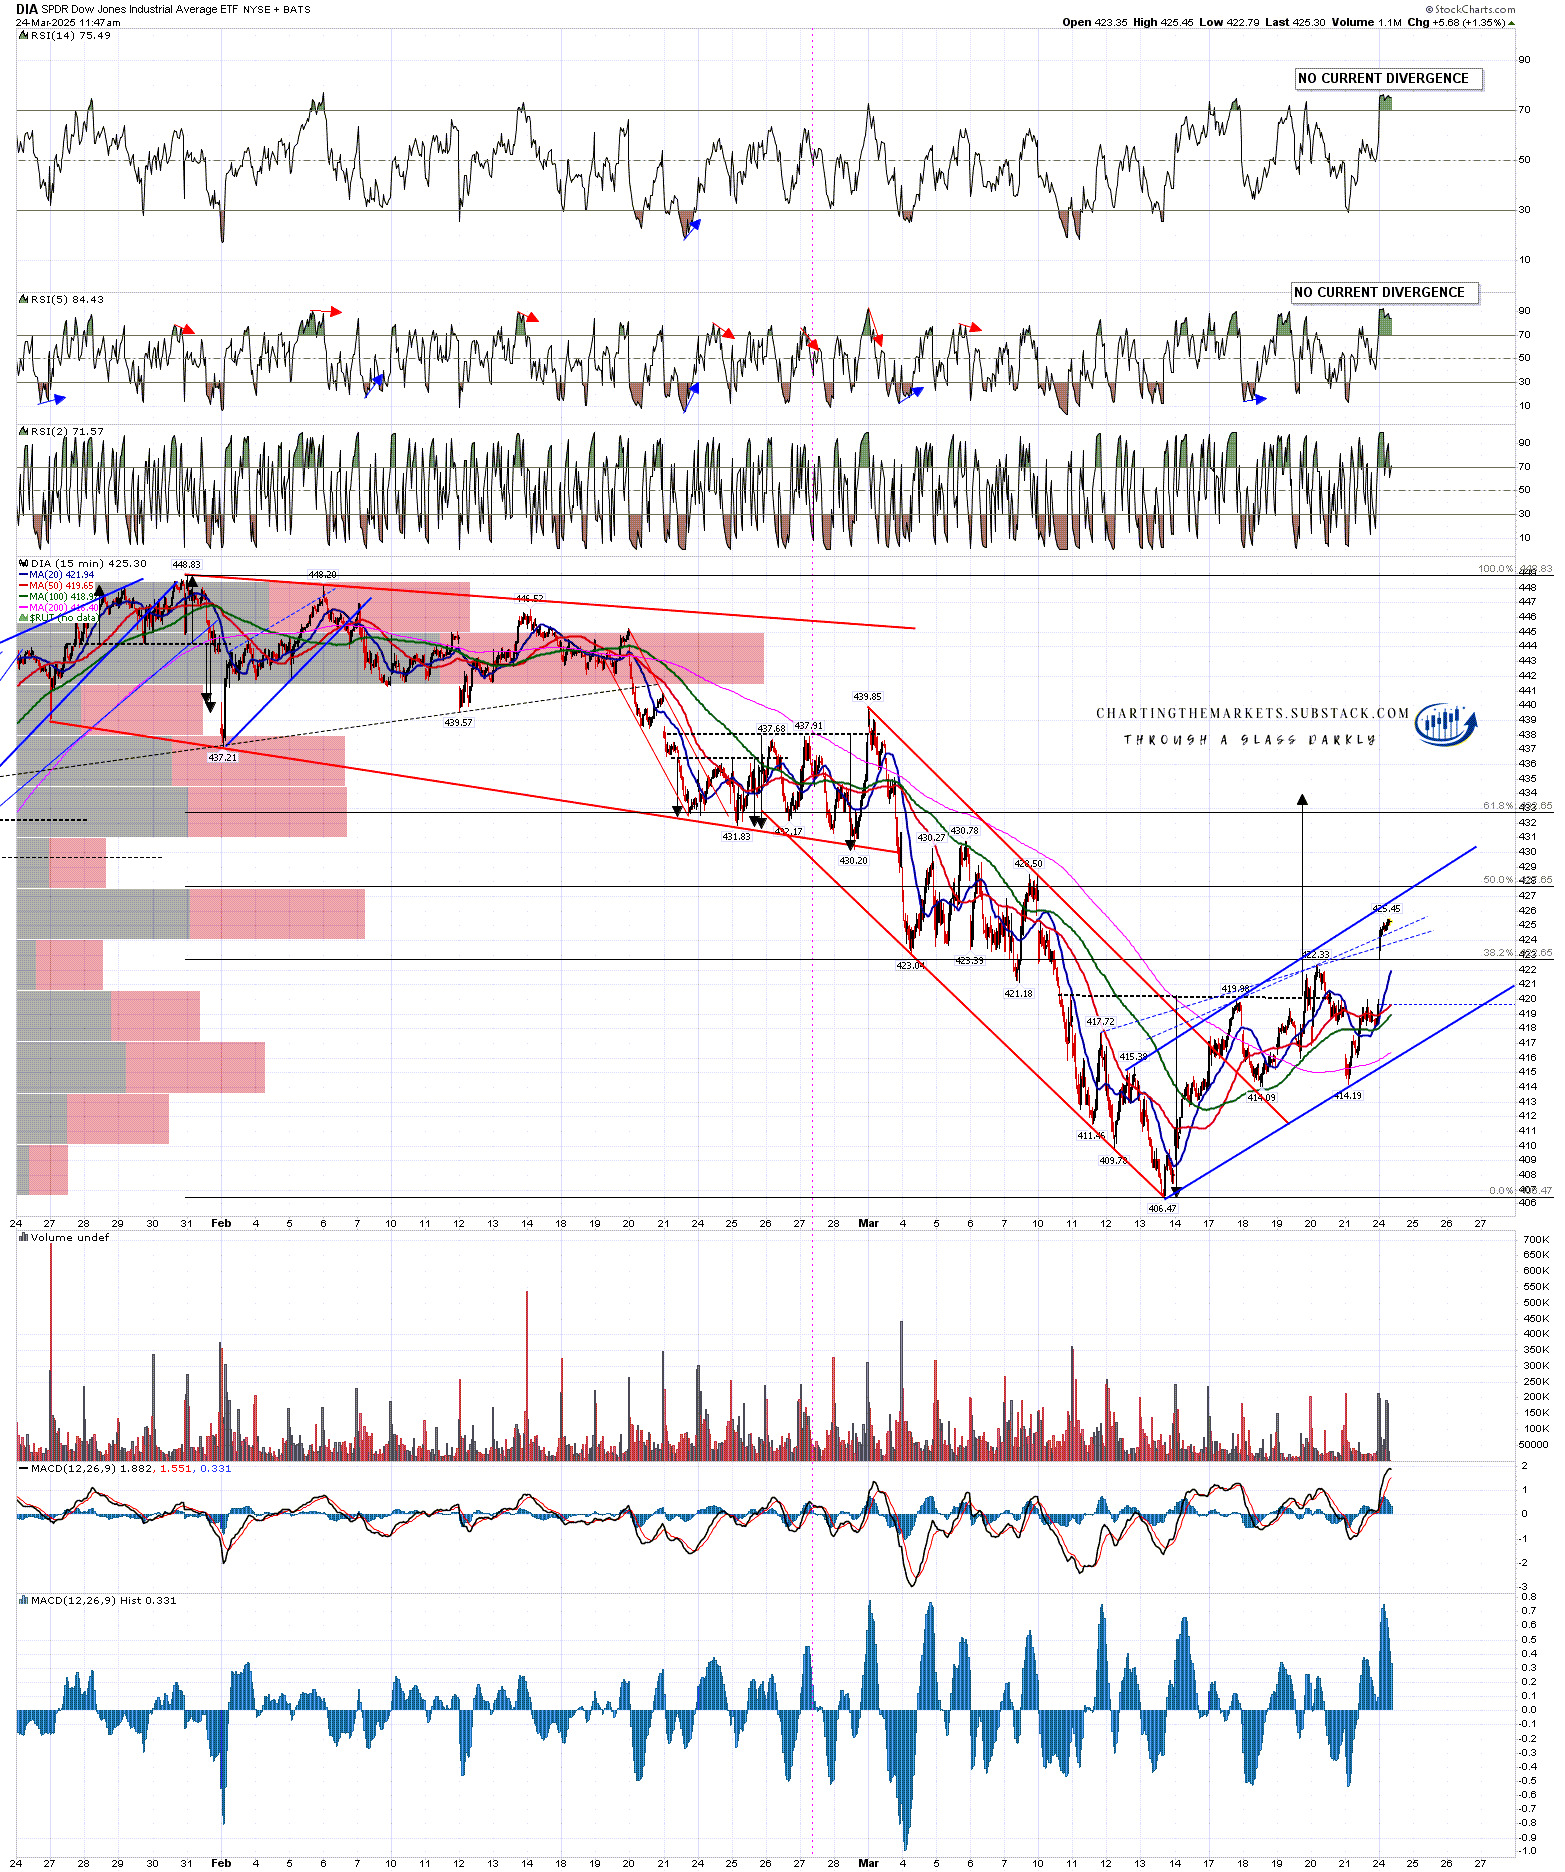
On the DIA chart there was no reversal pattern formed a week ago but I suggested then that an IHS right shoulder might form and then the IHS break up with a target in the 434 area. That happened but DIA is a long way short of that target and I am doubtful about that delivering. A very possible bear flag rising megaphone wedge has been forming and the obvious trendline resistance for that is now slightly higher than price, currently in the 427 area.
There was an old hourly RS14 buy signal fixed, which reached the possible near miss target this morning. A daily RSI 5 buy signal had previously also fixed but had already failed by the time the rally started.
DIA 15min chart:
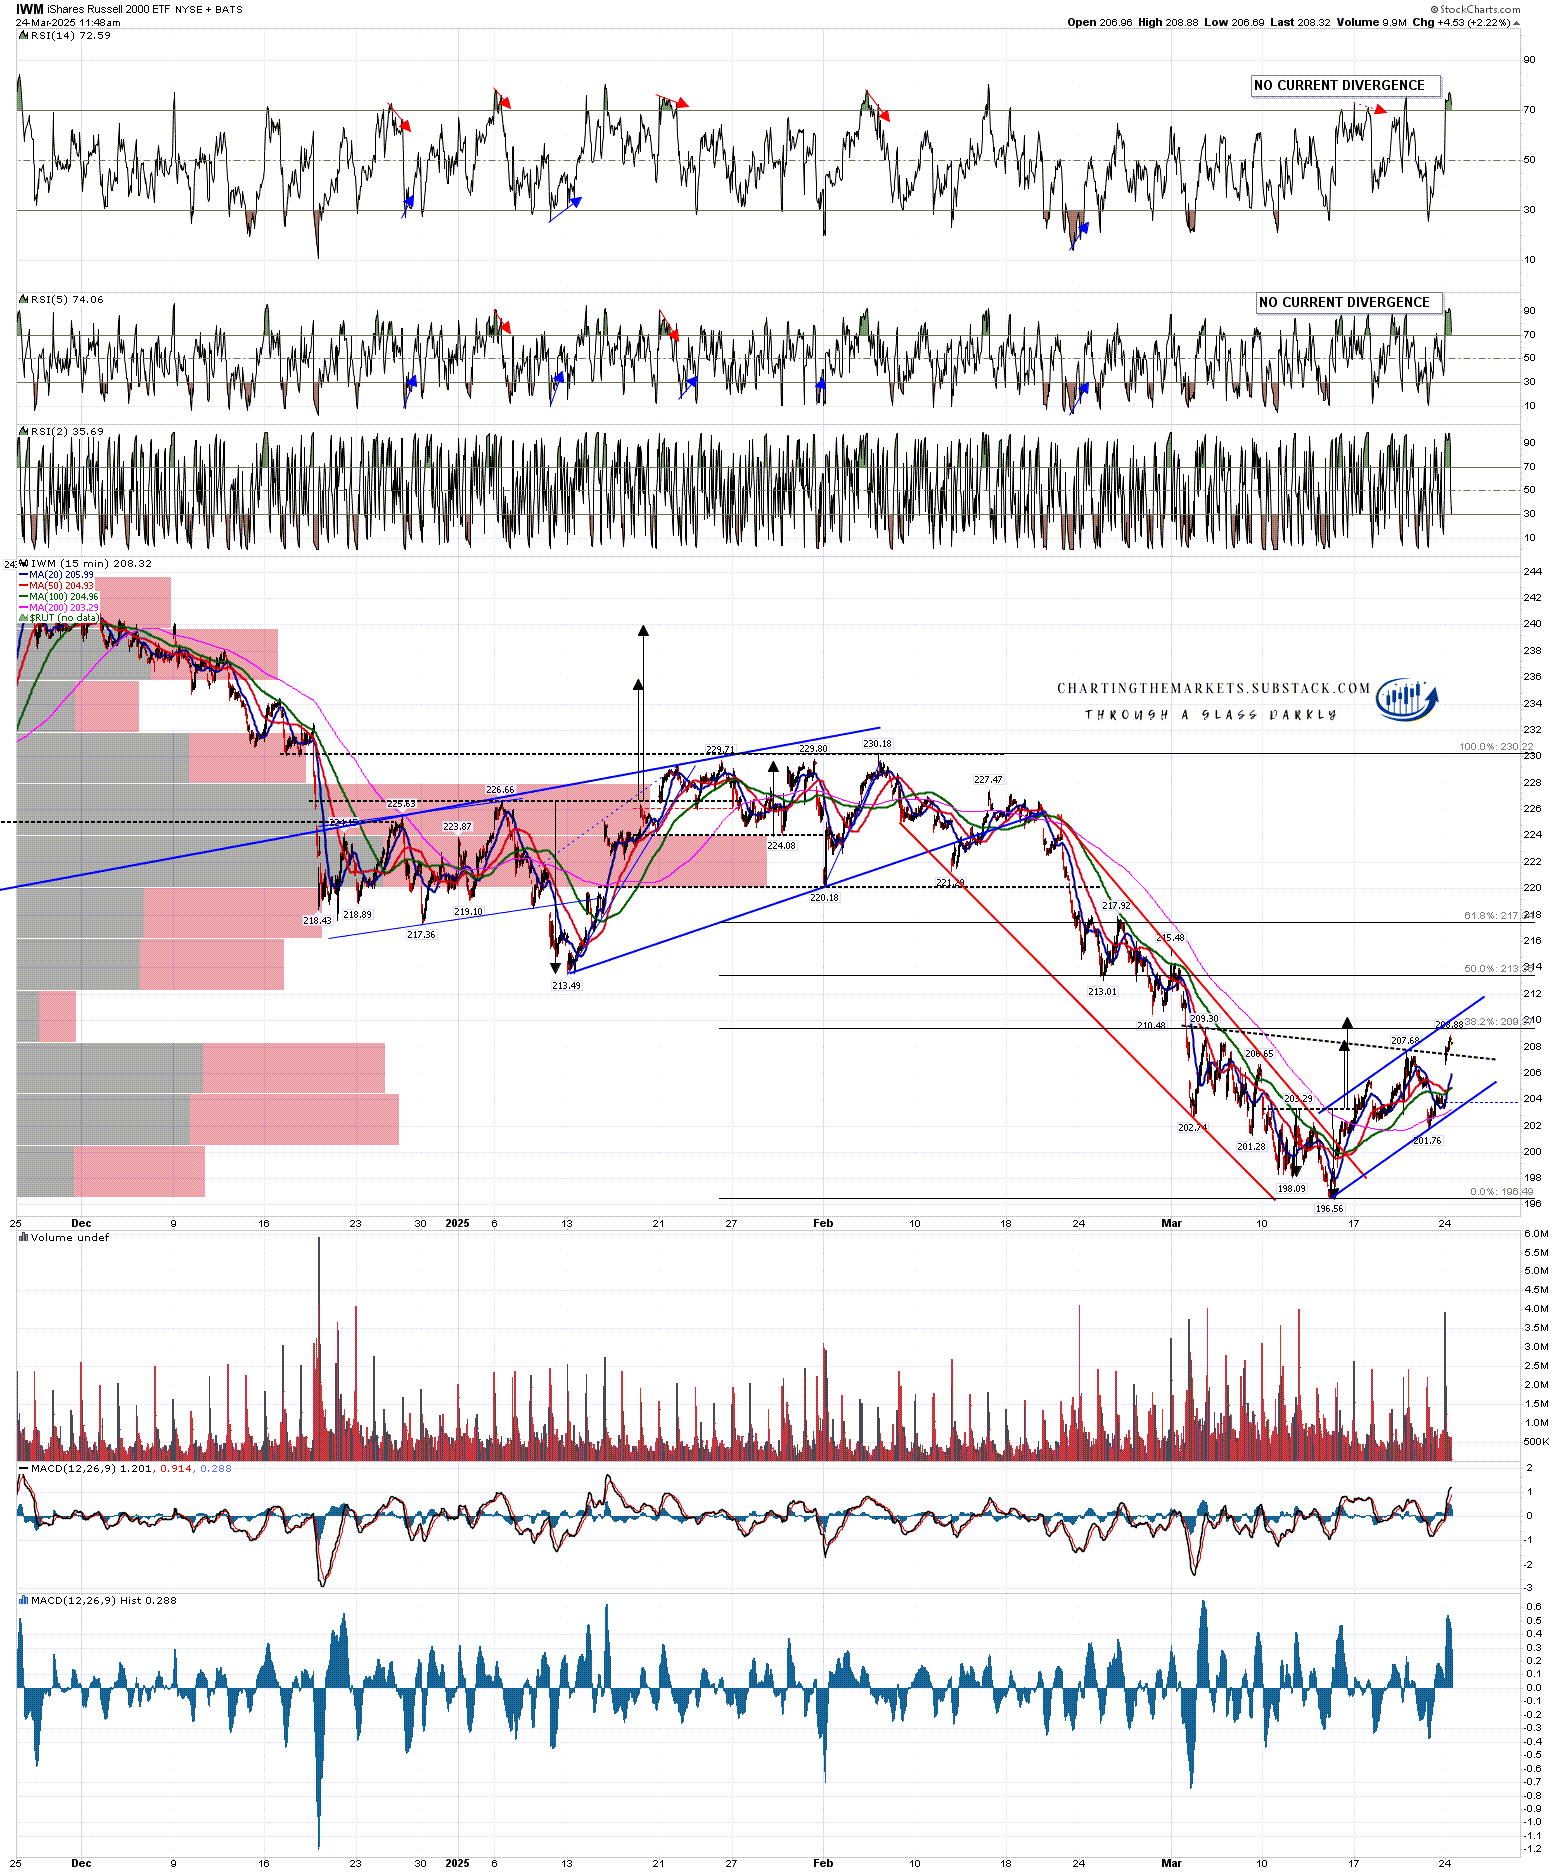
On the IWM chart a small double bottom had formed and broken up with a target in the 208.5 to 210 range. That has reached the target area this morning. A very possible bear flag rising channel has been forming and the obvious trendline resistance for that is now slightly higher than price, currently in the 210 area.
There was an old hourly RS14 buy signal fixed, which reached the possible near miss target this morning, and a fixed daily RSI 5 buy signal which will reach the possible near miss target at the close today if price remains strong for the rest of the day.
IWM 15min chart:
A week ago I was saying that the key rally target and resistance would likely be the daily middle bands. Those are all now being tested this morning. If we see closing breaks above those today then a rejection back below would likely happen tomorrow or, if not tomorrow, then on Wednesday.
SPX daily chart:
Are there options to form larger IHS patterns to take the rally much higher on SPX, QQQ and IWM? Yes, and I have marked in the one on the IWM chart that has actually already formed and broken up with a target in the 220 area. In the absence of some very good news in the next few days though, I’m not taking these seriously, though I will be watching them.
Overall equity indices have now reached an area where most of the initial bottoming patterns have now reached target, and if we see a strong close today, then all of the daily and hourly buy signals will also have reached at least the possible near miss target.
As I have been since the start of 2025 I’m still leaning on the bigger picture towards a weak first half of 2025 and new all time highs later in the year, very possibly as a topping process for a much more significant high. One way or another I think we’ll be seeing lower soon and I’m not expecting this to be a good year for US equities, not least because both of the last two years have been banner years for US equities. A third straight year of these kinds of gains looks like a big stretch. I could of course however be mistaken. UPDATE 11th March 2025 - I am wondering if this may be a bear market that dominates the whole of 2025.
If you like my analysis and would like to see more, please take a free subscription at my chartingthemarkets substack, where I publish these posts first. I also do a premarket video every day on equity indices, bonds, currencies, energies, precious commodities and other commodities at 8.45am EST. If you’d like to see those I post the links every morning on my twitter, and the videos are posted shortly afterwards on my Youtube channel.
No comments:
Post a Comment