
In my last post on Friday I was looking at the overall picture on Crypto and the current setup on Bitcoin (BTCUSD), Solana (SOLUSD) and Ethereum (ETHUSD) which is still in the balance but looking decent this morning, though some key resistance levels still need to be broken to open the upside for a decent rally.
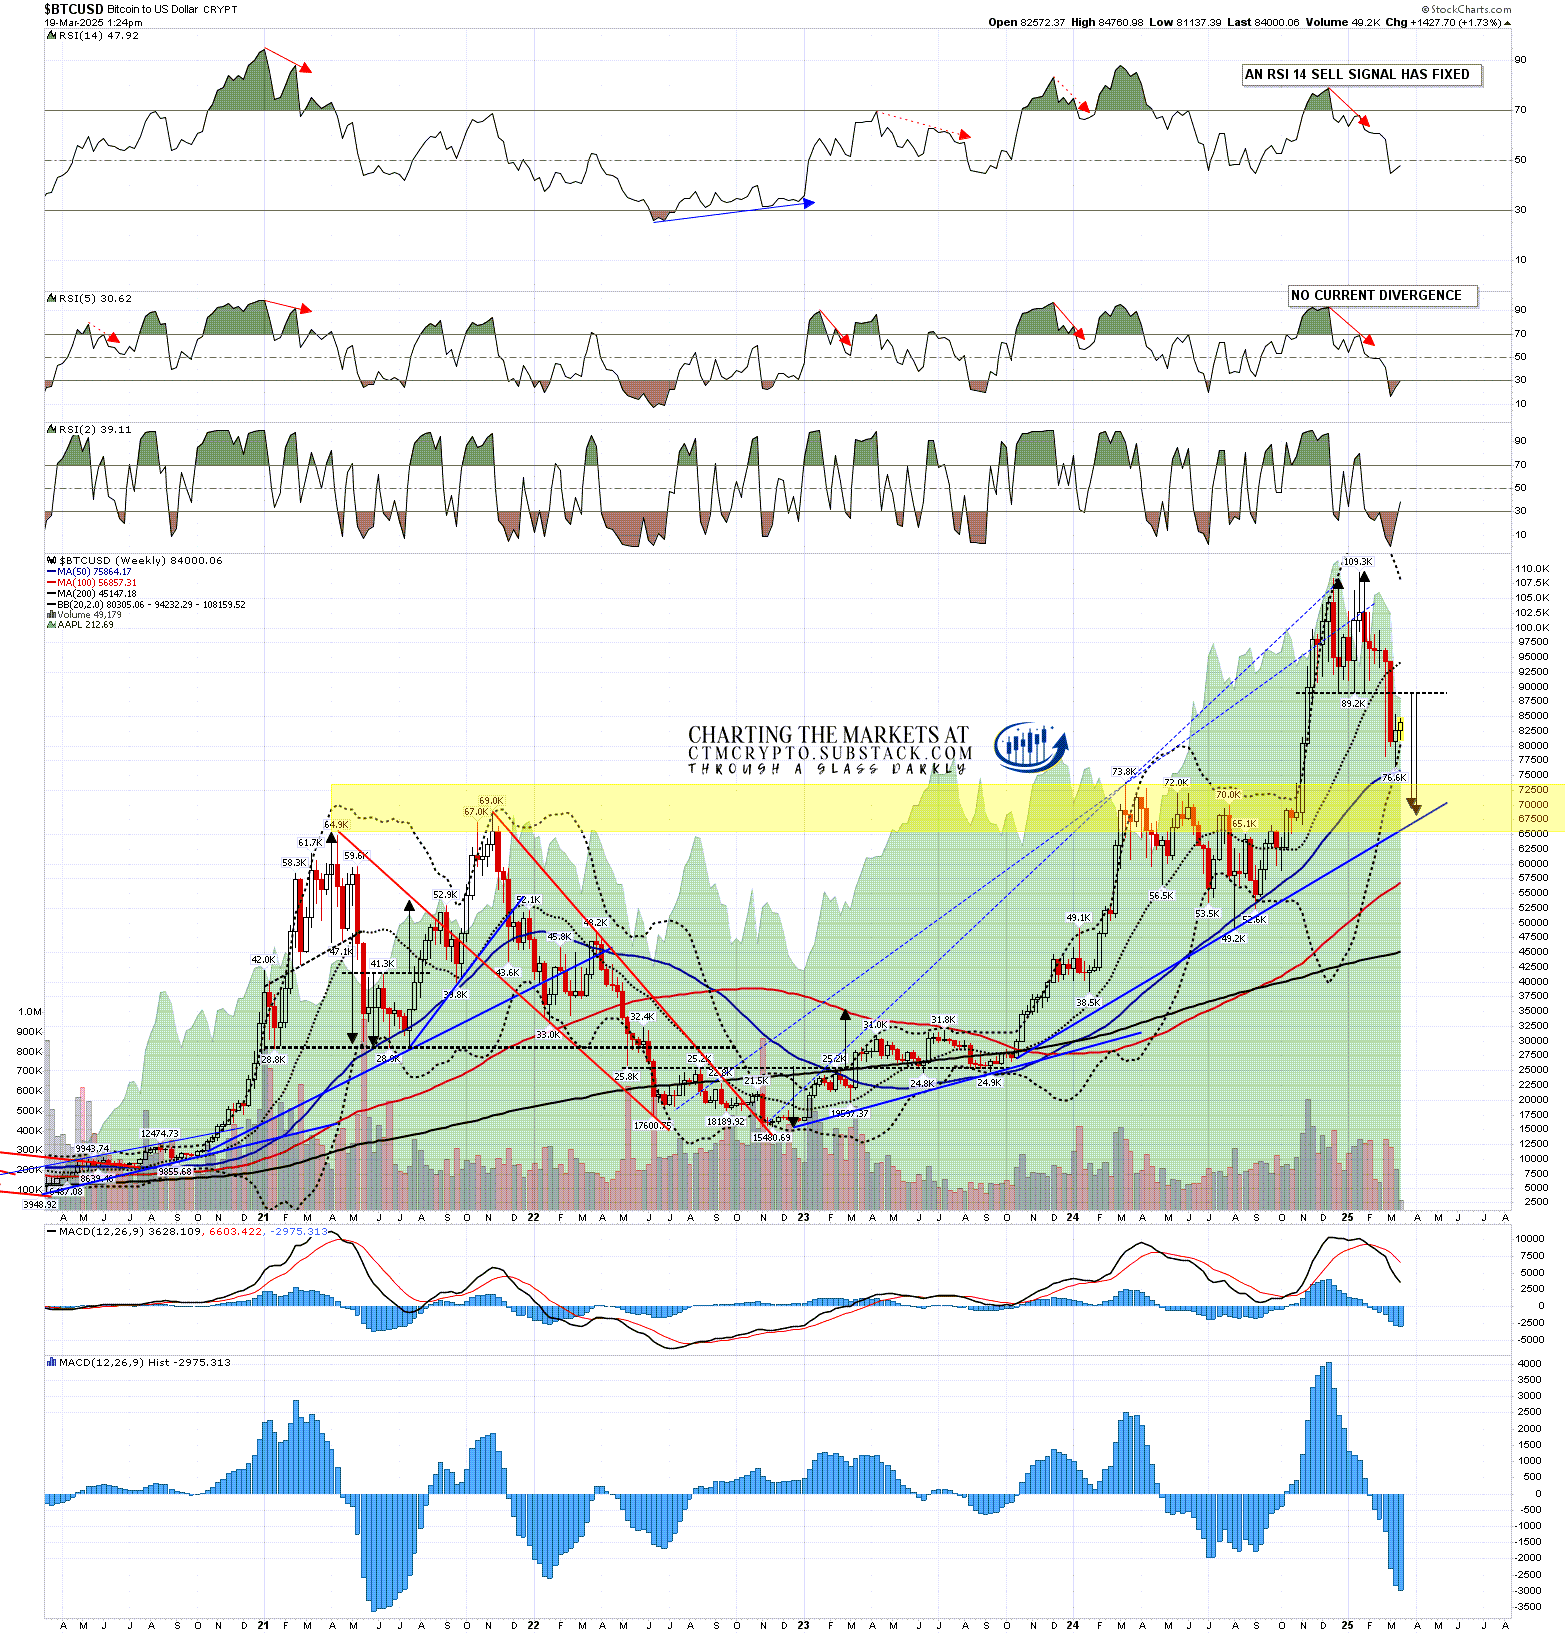
Looking at the bigger picture again there is a double top setup on Bitcoin that has broken down with a target in the 69k to 70k area, and I am still expecting that target to be reached after any rally here.
I would also note on the weekly chart below that Bitcoin is rallying (so far at least) at the weekly middle band, which is a very obvious and historically strong support level.
BTCUSD weekly chart:
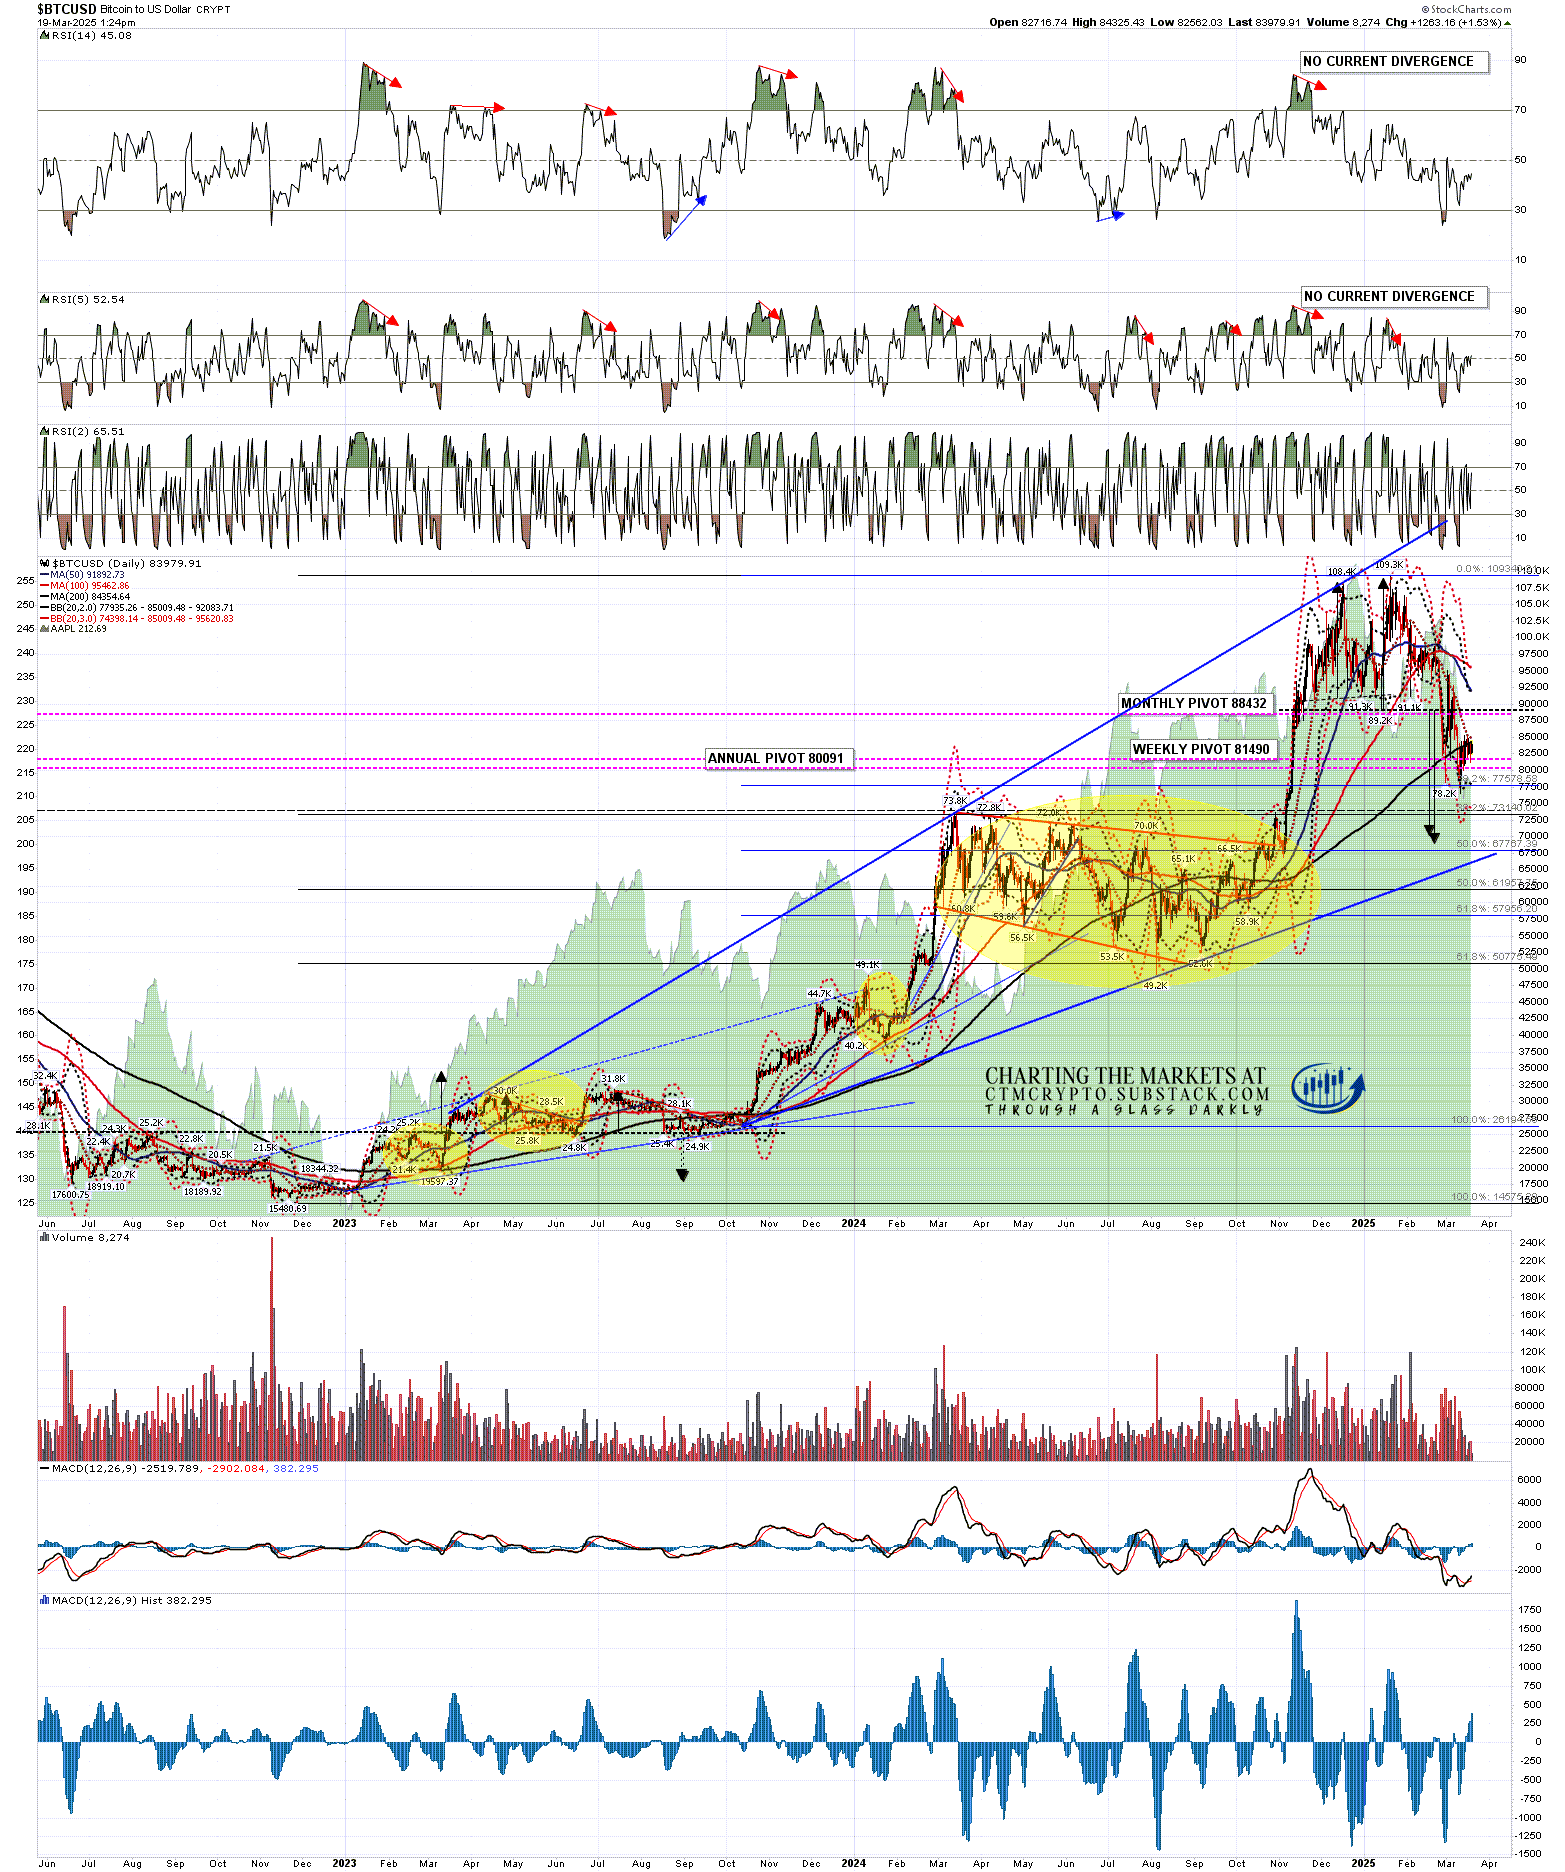
On the daily chart Bitcoin has been stalled so far at a big double resistance level, the 200dma currently at 84359, and the daily middle band, currently at 85055. This is the obvious level for this rally to fail and must be broken and converted to support for the rally to procced higher.
BTCUSD daily chart:
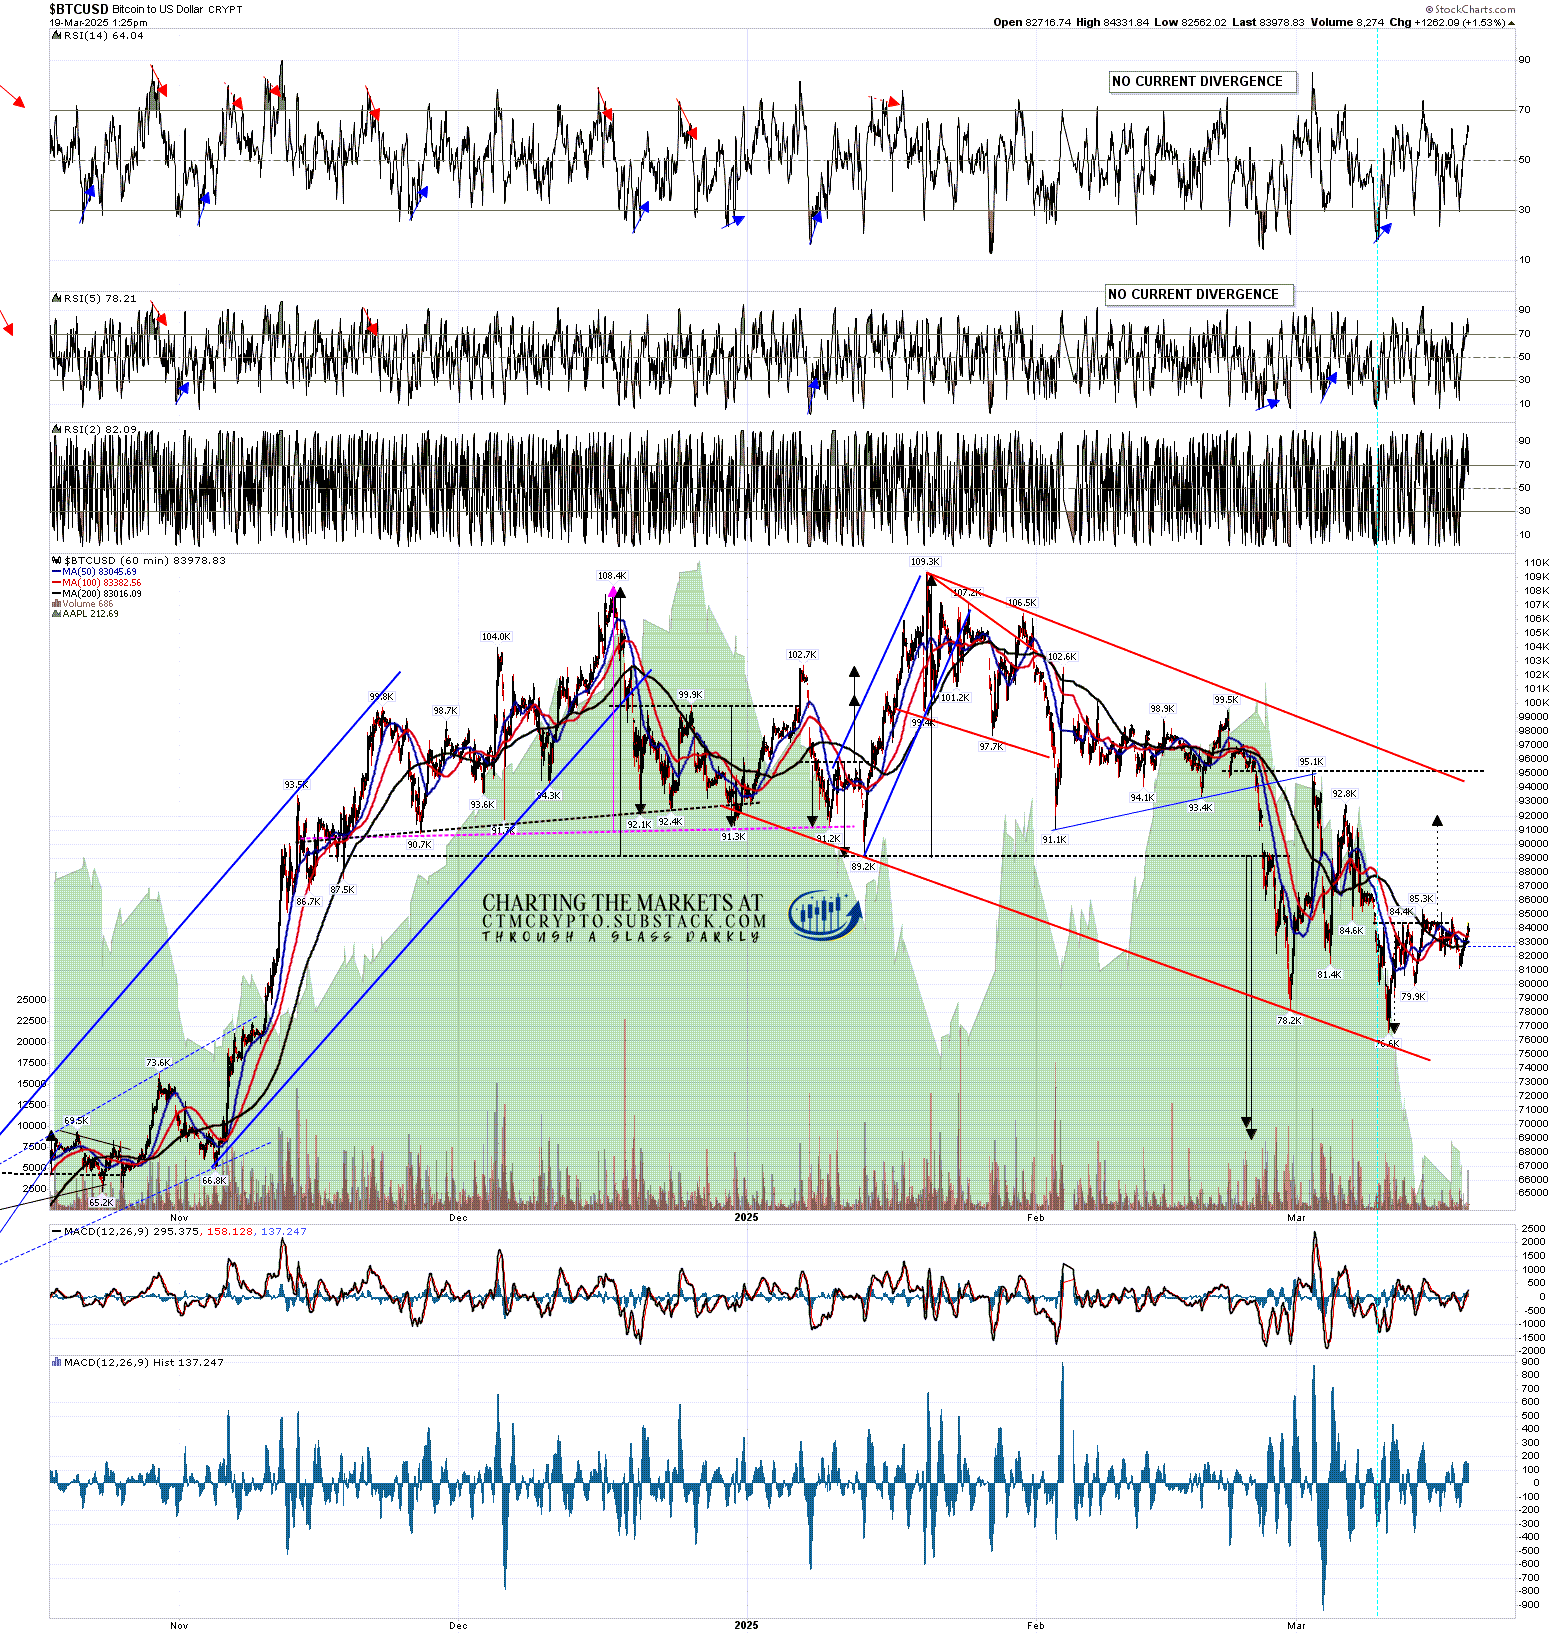
On the hourly chart a clear IHS has broken up with a target in the 92000 area, and I’ll also be watching declining resistance from the all time high, currently in the 95000 area.
If Bitcoin trades below the IHS right shoulder low at 79.9k then the IHS fails and a retest of the last significant low at 76.6k becomes likely. With the obvious target below in the 69k to 70k area there would be a high risk that Bitcoin would then head there directly.
BTCUSD 60min chart:
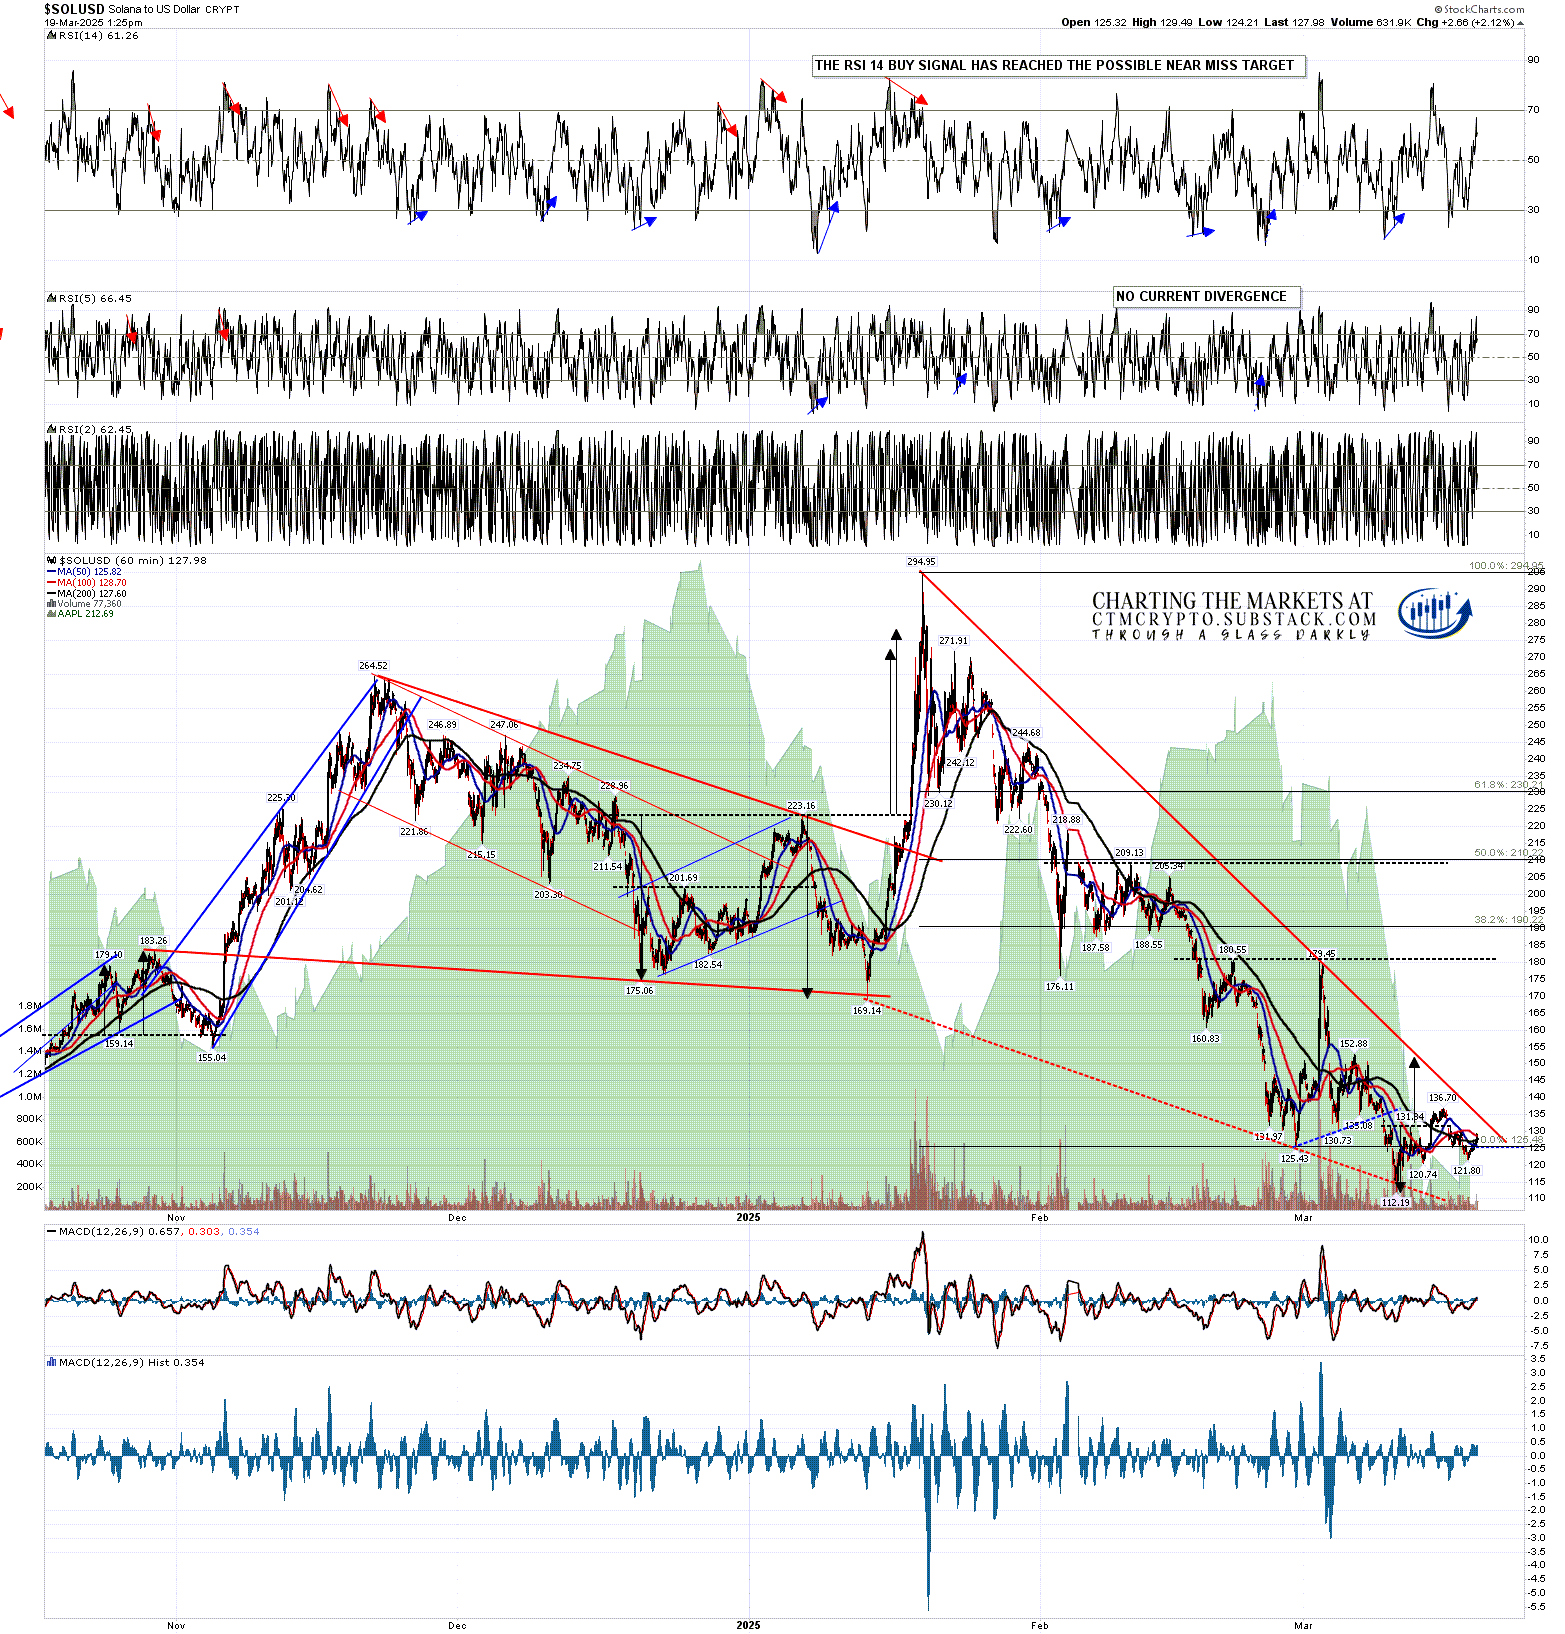
There is also strong resistance on the Solana daily chart, and again that is at two big resistance levels that are close to intersecting. The first level is the daily middle band, currently at 136 and a level that has already been tested and held once since the current low at 112.19. The second level is declining resistance from the all time high, currently in the 137 area and close to crossing the daily middle band. These are the obvious levels for this rally to fail at, and must be broken and converted to support for the rally to procced higher.
SOLUSD daily chart:
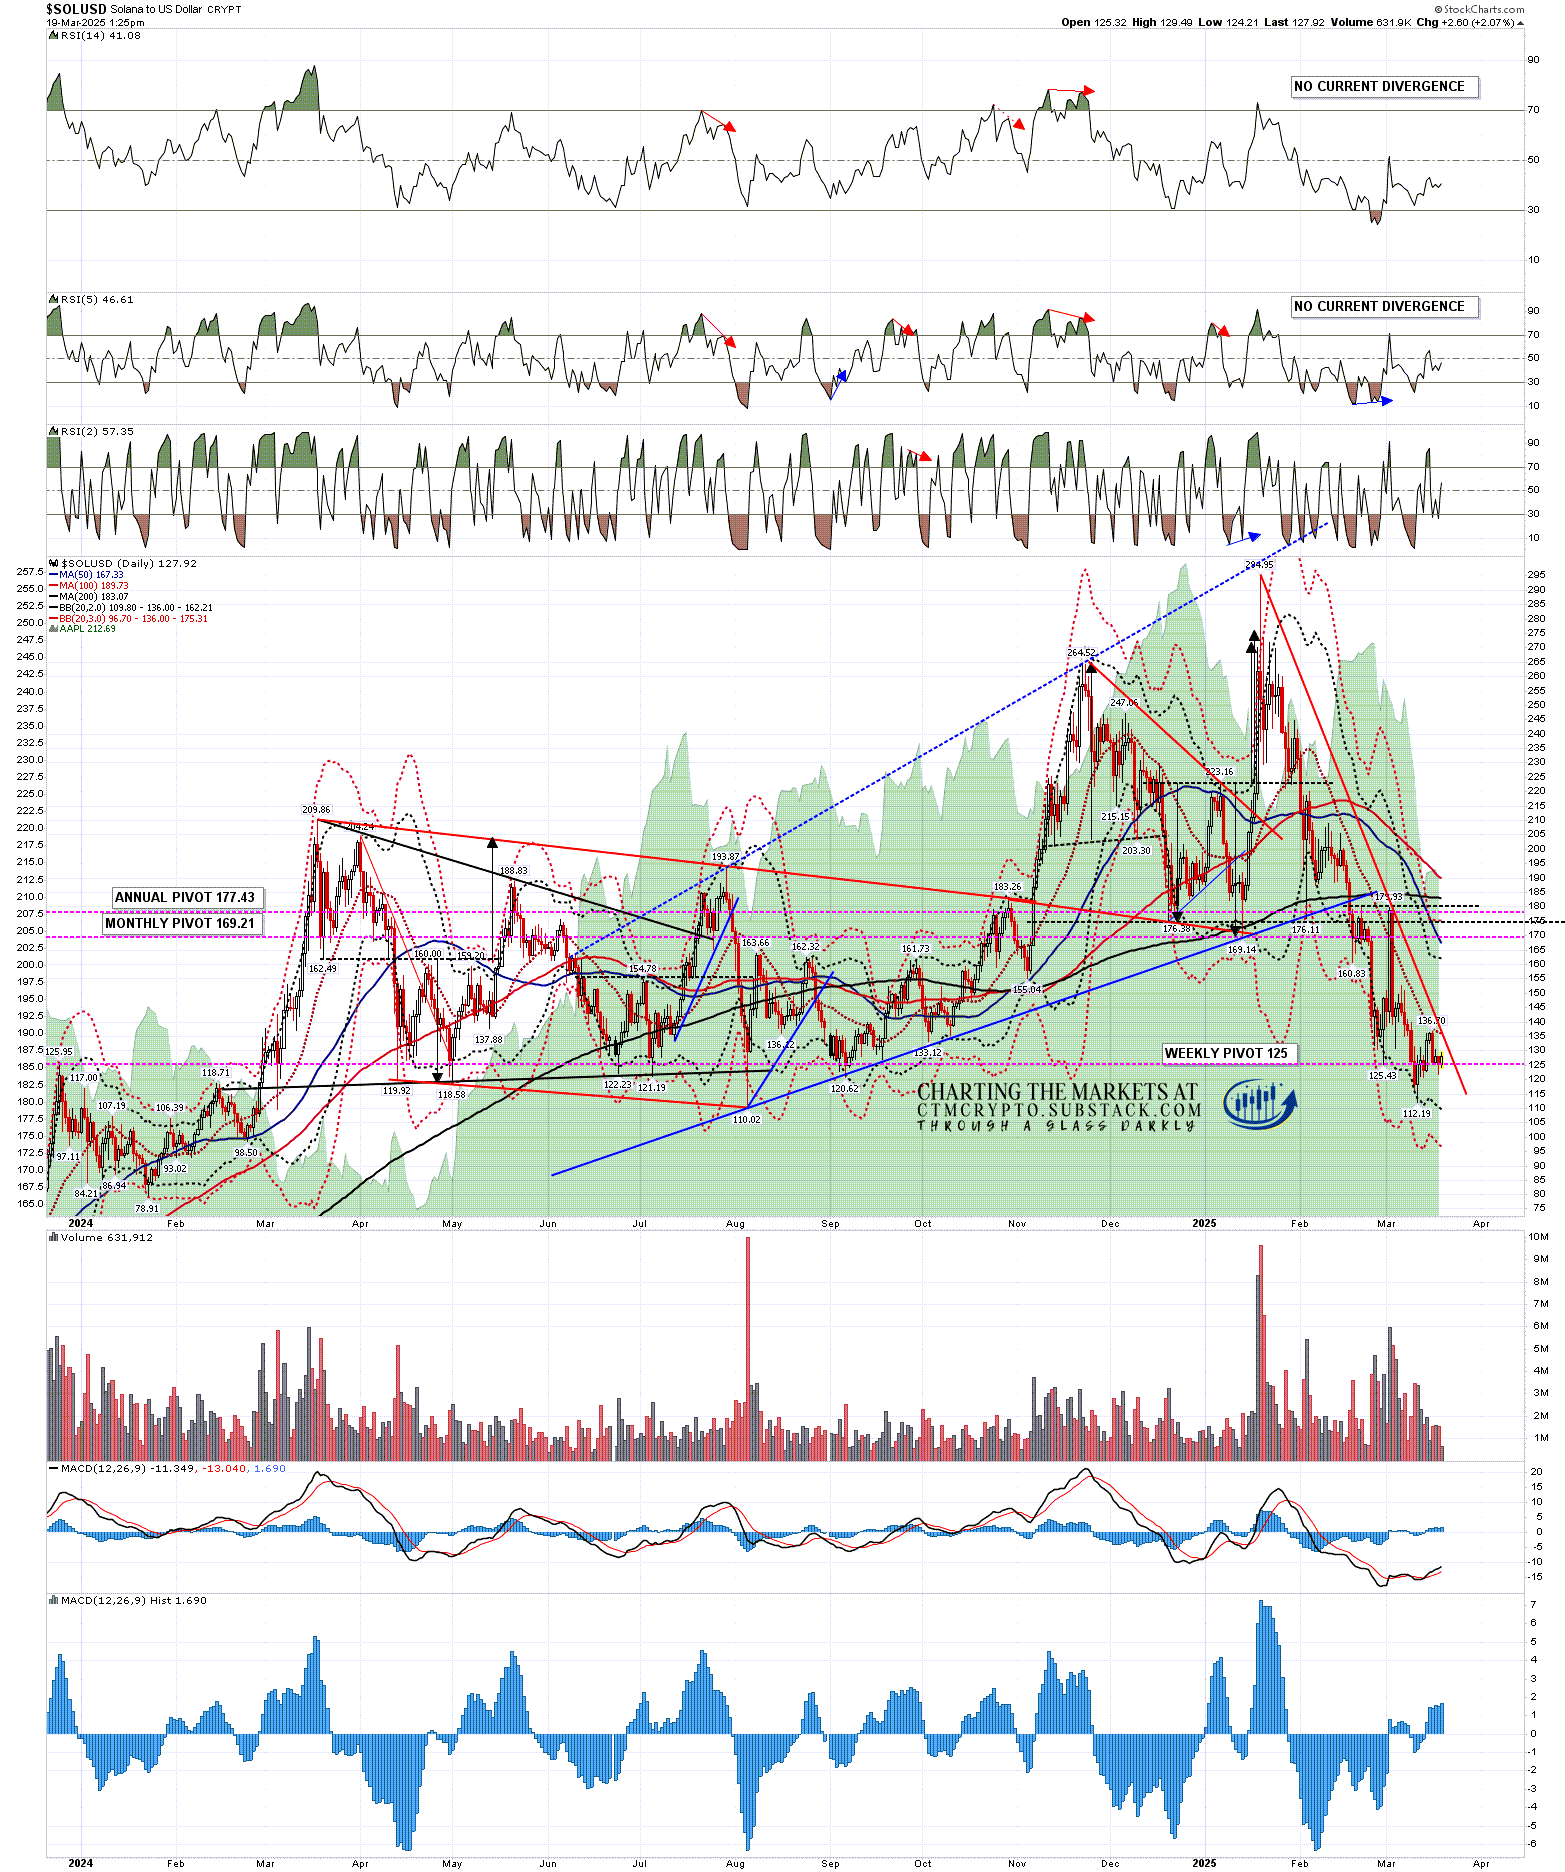
On the hourly chart a clear IHS has formed and broken up with a target in the 152 area. If Solana goes higher then I would be watching the last rally high at 179.45 as a possible target.
If Solana trades below the IHS right shoulder low at 120.74 then the IHS fails and a retest of the last significant low at 112.19 becomes likely.
SOLUSD 60min chart:
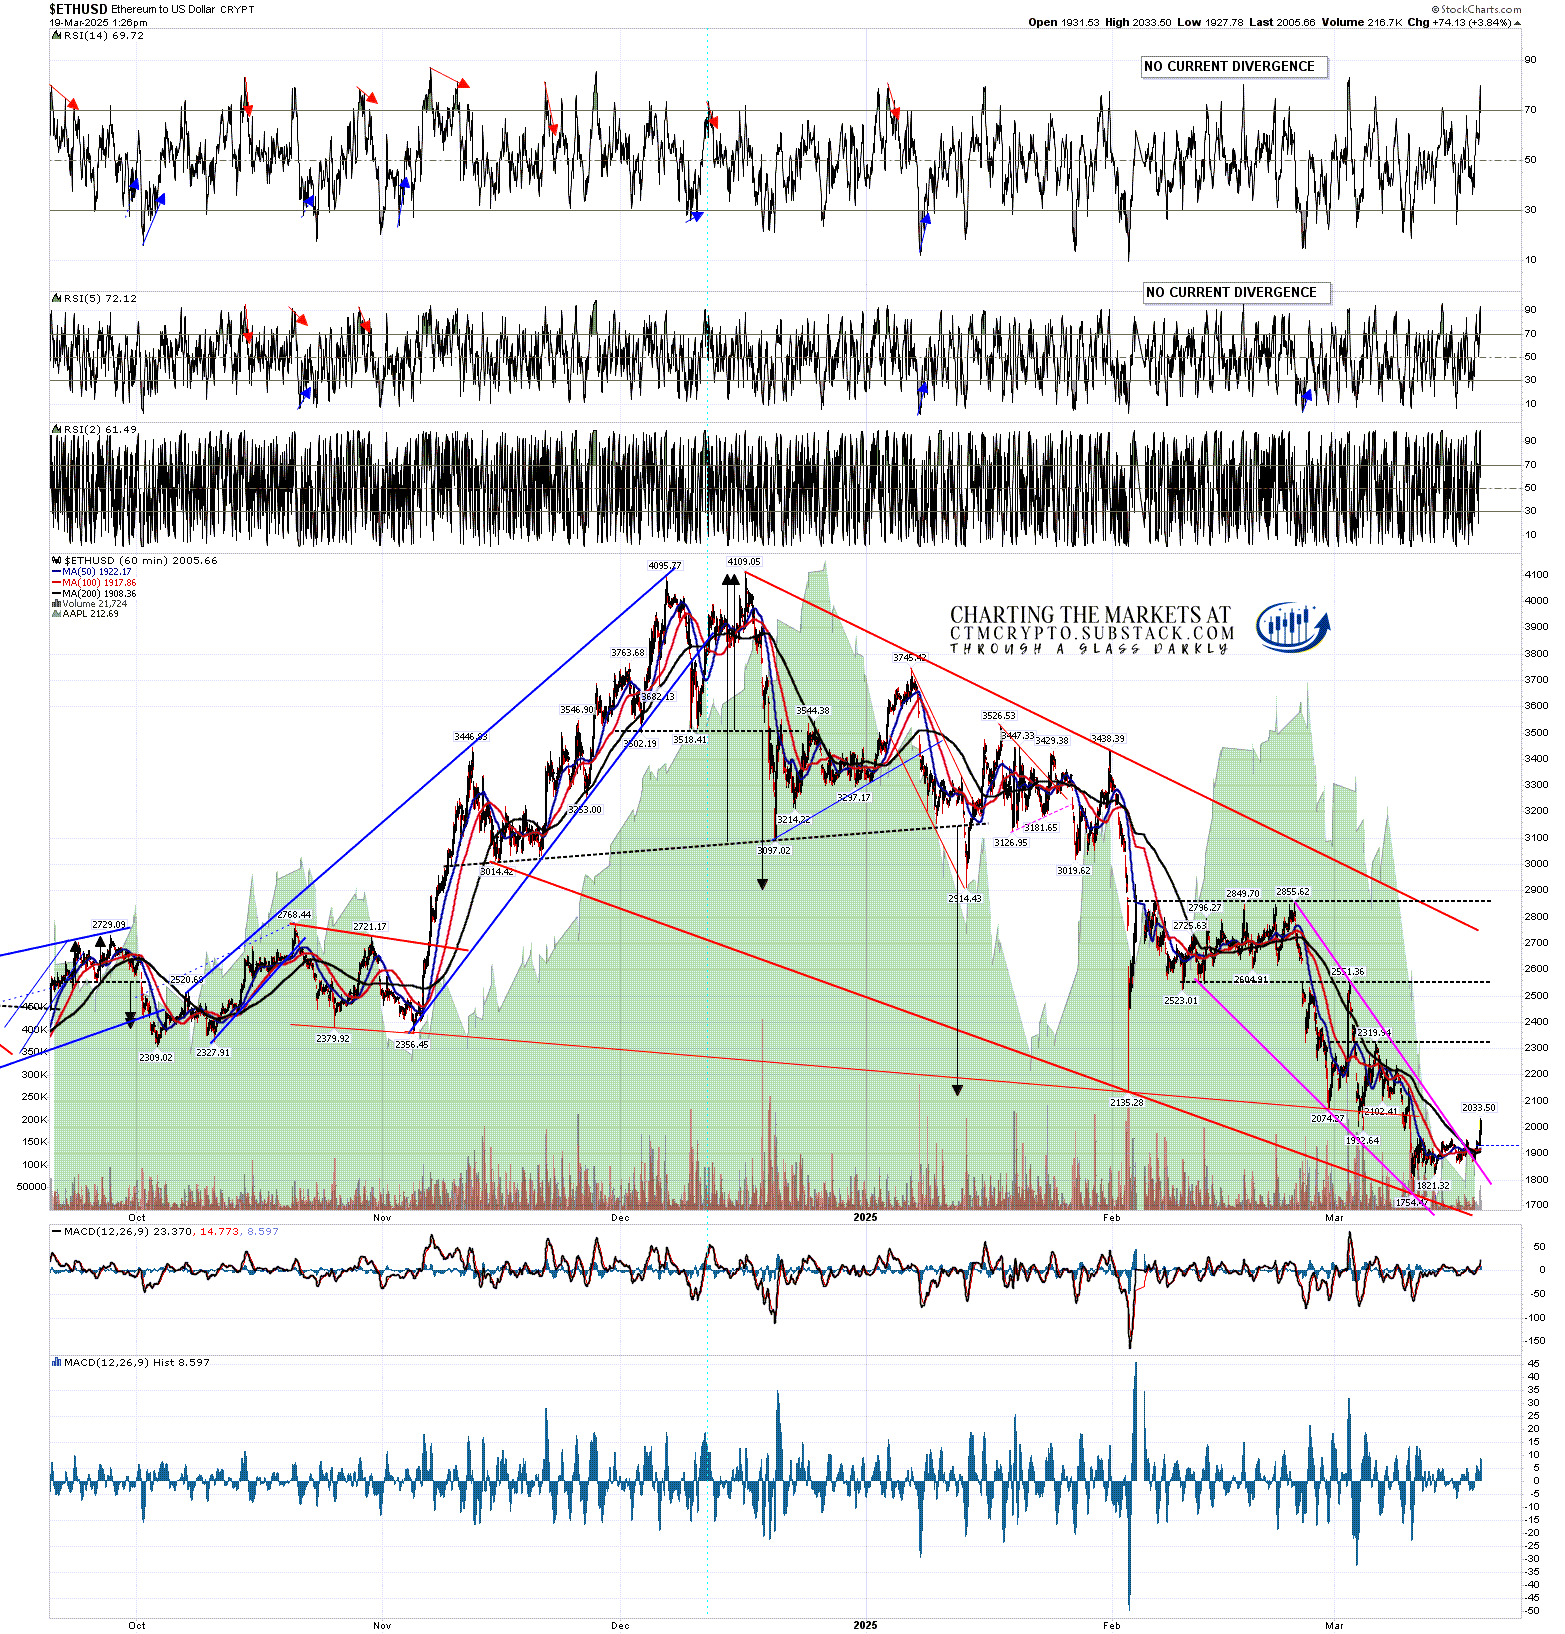
There is no current reversal pattern on Ethereum but the short term falling wedge has broken up since Friday and the rally is looking good so far. Ethereum is now testing important resistance at the daily middle band, currently at 2065, and if that is broken and converted to support, then the obvious target would be declining resistance from the all time high, currently in the 2800 area and currently declining at about 100 dollars per week.
ETHUSD 60min chart:
I really like this rally setup, particularly given the even more attractive rally setup on all of the main US equity indices. There is an ideal rally window into the scheduled big escalation of the trade war on April 2nd, and the setup is very nice. Any setup can fail however and if these rally setups fail, then the chances are that they will fail together.
On the bigger picture I think that talk of the next bear market on Crypto having already started is premature. It’s possible but there’s no compelling evidence for that so far. I think Bitcoin likely has some more downside coming but I think Solana and Ethereum may already be starting to make their lows for this move.
So far this year I have been and am still leaning towards seeing weakness in the first half of the year and renewed strength in the second half of 2025, with a very possible bull market high on Crypto pencilled in close to the end of the year. That scenario would be a good match with past Crypto bull markets. Is it possible that I am mistaken? Always, but we can only ever try to identify the higher probability paths in the future. Only time can show us the path that is actually taken. Still, I’m with Confucious who said ‘study the past, if you would divine the future’.
If you’d like to see more of these posts and the other Crypto videos and information I post, please subscribe for free to my Crypto substack. I also do a premarket video every day on Crypto at 9.05am EST. If you’d like to see those I post the links every morning on my twitter, and the videos are posted shortly afterwards on my Youtube channel.
I'm also to be found at Arion Partners, though as a student rather than as a teacher. I've been charting Crypto for some years now, but am learning to trade and invest in them directly, and Arion Partners are my guide around a space that might reasonably be compared to the Wild West in one of their rougher years.

No comments:
Post a Comment