- WE'RE JUST RANDOM SPECKS OF DUST IN A TORNADO TO THE MARKETS .......
- CHARTISTS MUST PUT ALL BIAS ASIDE AND LET THE CHARTS DO THE TALKING OR WE'LL SEE ONLY WHAT WE WANT TO SEE
- This blog has a copy of all header posts that I publish anywhere, so that those interested in seeing what my thoughts are on the markets can find them easily.
- I will be answering questions and responding to comments, so feel free to respond to any posts and I will see your comment even if it is not on the most recent post.
- If you're interested in seeing any intraday charts I post, I do that on twitter, and my twitter handle is @shjackcharts.
- The charts in the posts are as large as I can practically make them. if you would like to look at one more closely, click on it, and the link will take you to a larger version at screencast. If you click on that again, you will get a full page version, and can use the resizing function on your browser to enlarge parts of interest further.

Thursday 29 August 2024

Weighing The Options For Equities

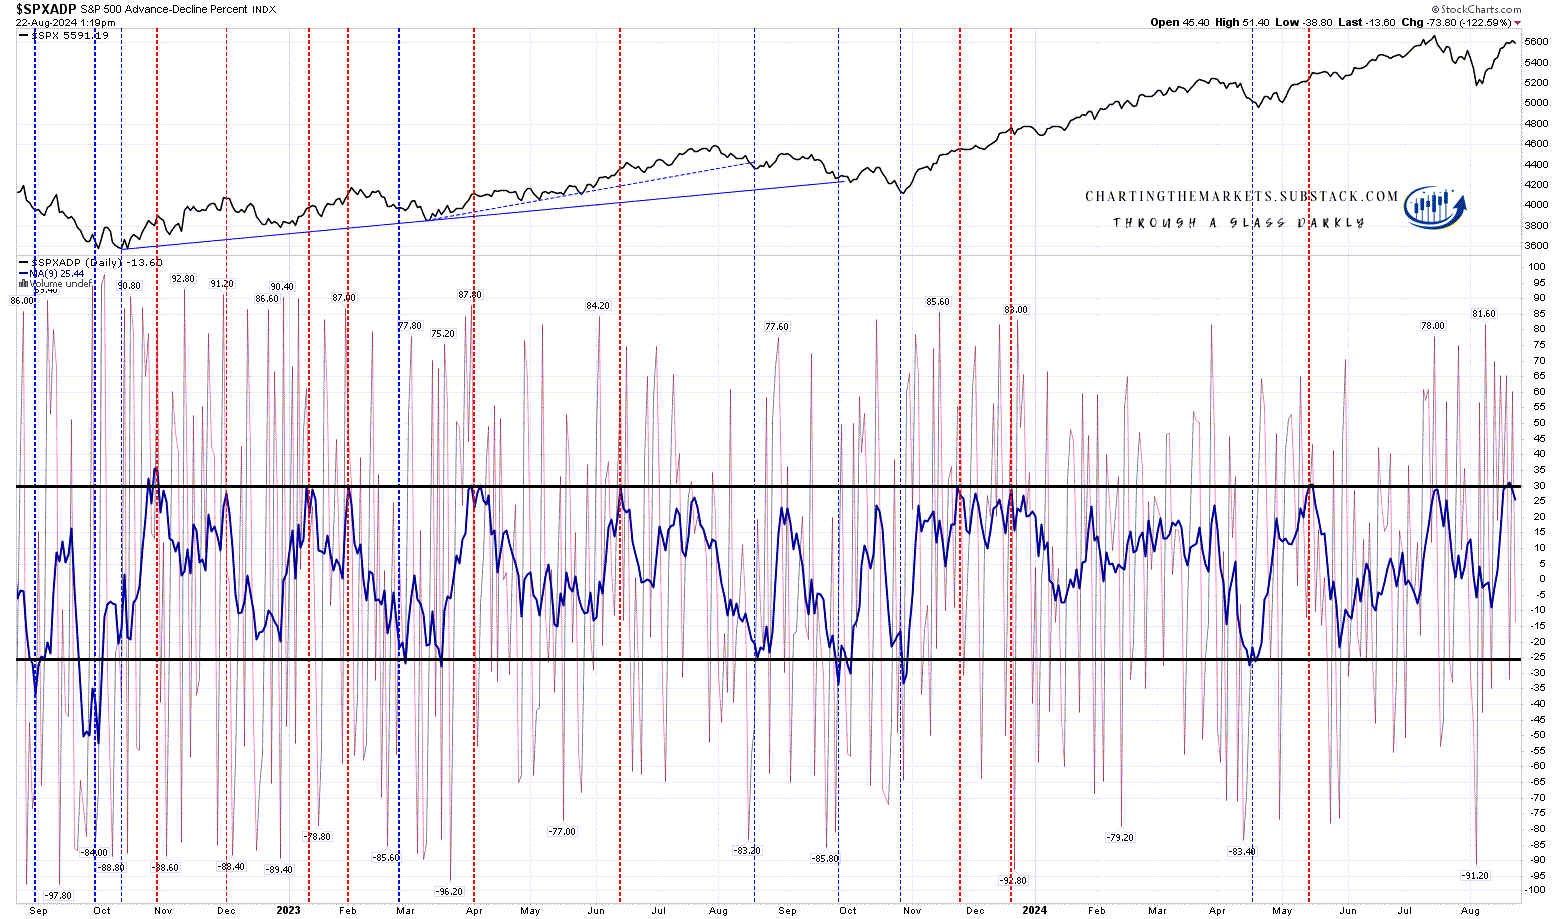
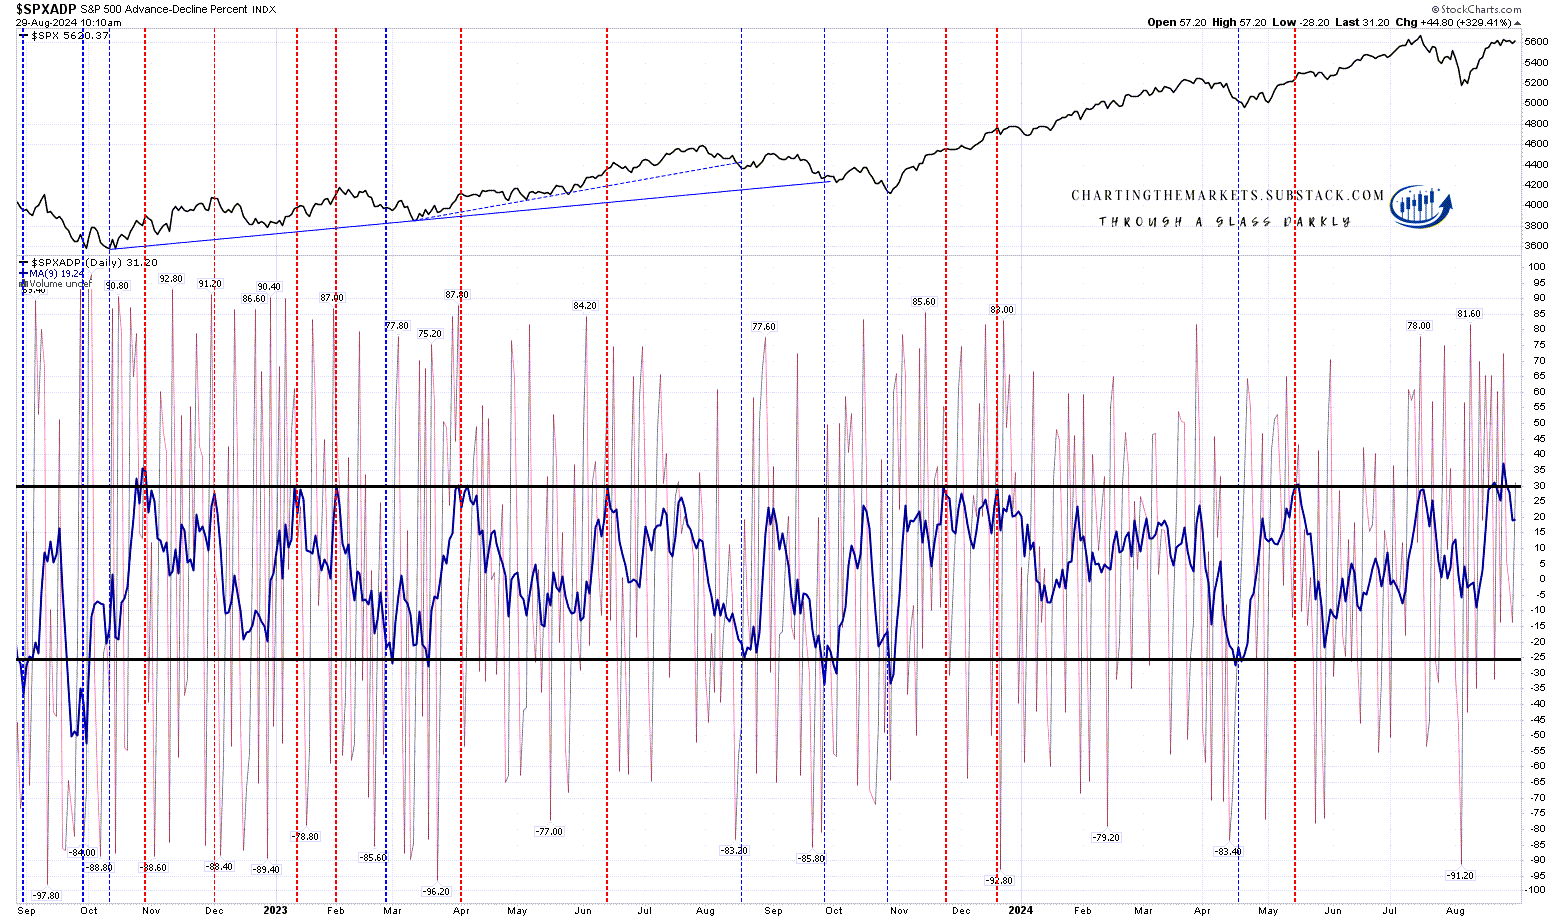
I posted the SPXADP chart a few days ago, and since then it has punched above the 30 level on the chart. What does that mean? Well about 50% of the time that means that a short term high is very close, sometimes for a serious high, but more often just a retracement that would look for close to or at the -25 level on the chart. The rest of the time would be continuation, sometimes into a short term high not long after, but often just a move higher.

A double punch above the 30 level, as we may see that here, would strongly favor retracement or at least a period of consolidation in the weeks afterwards.

SPXADP daily chart:

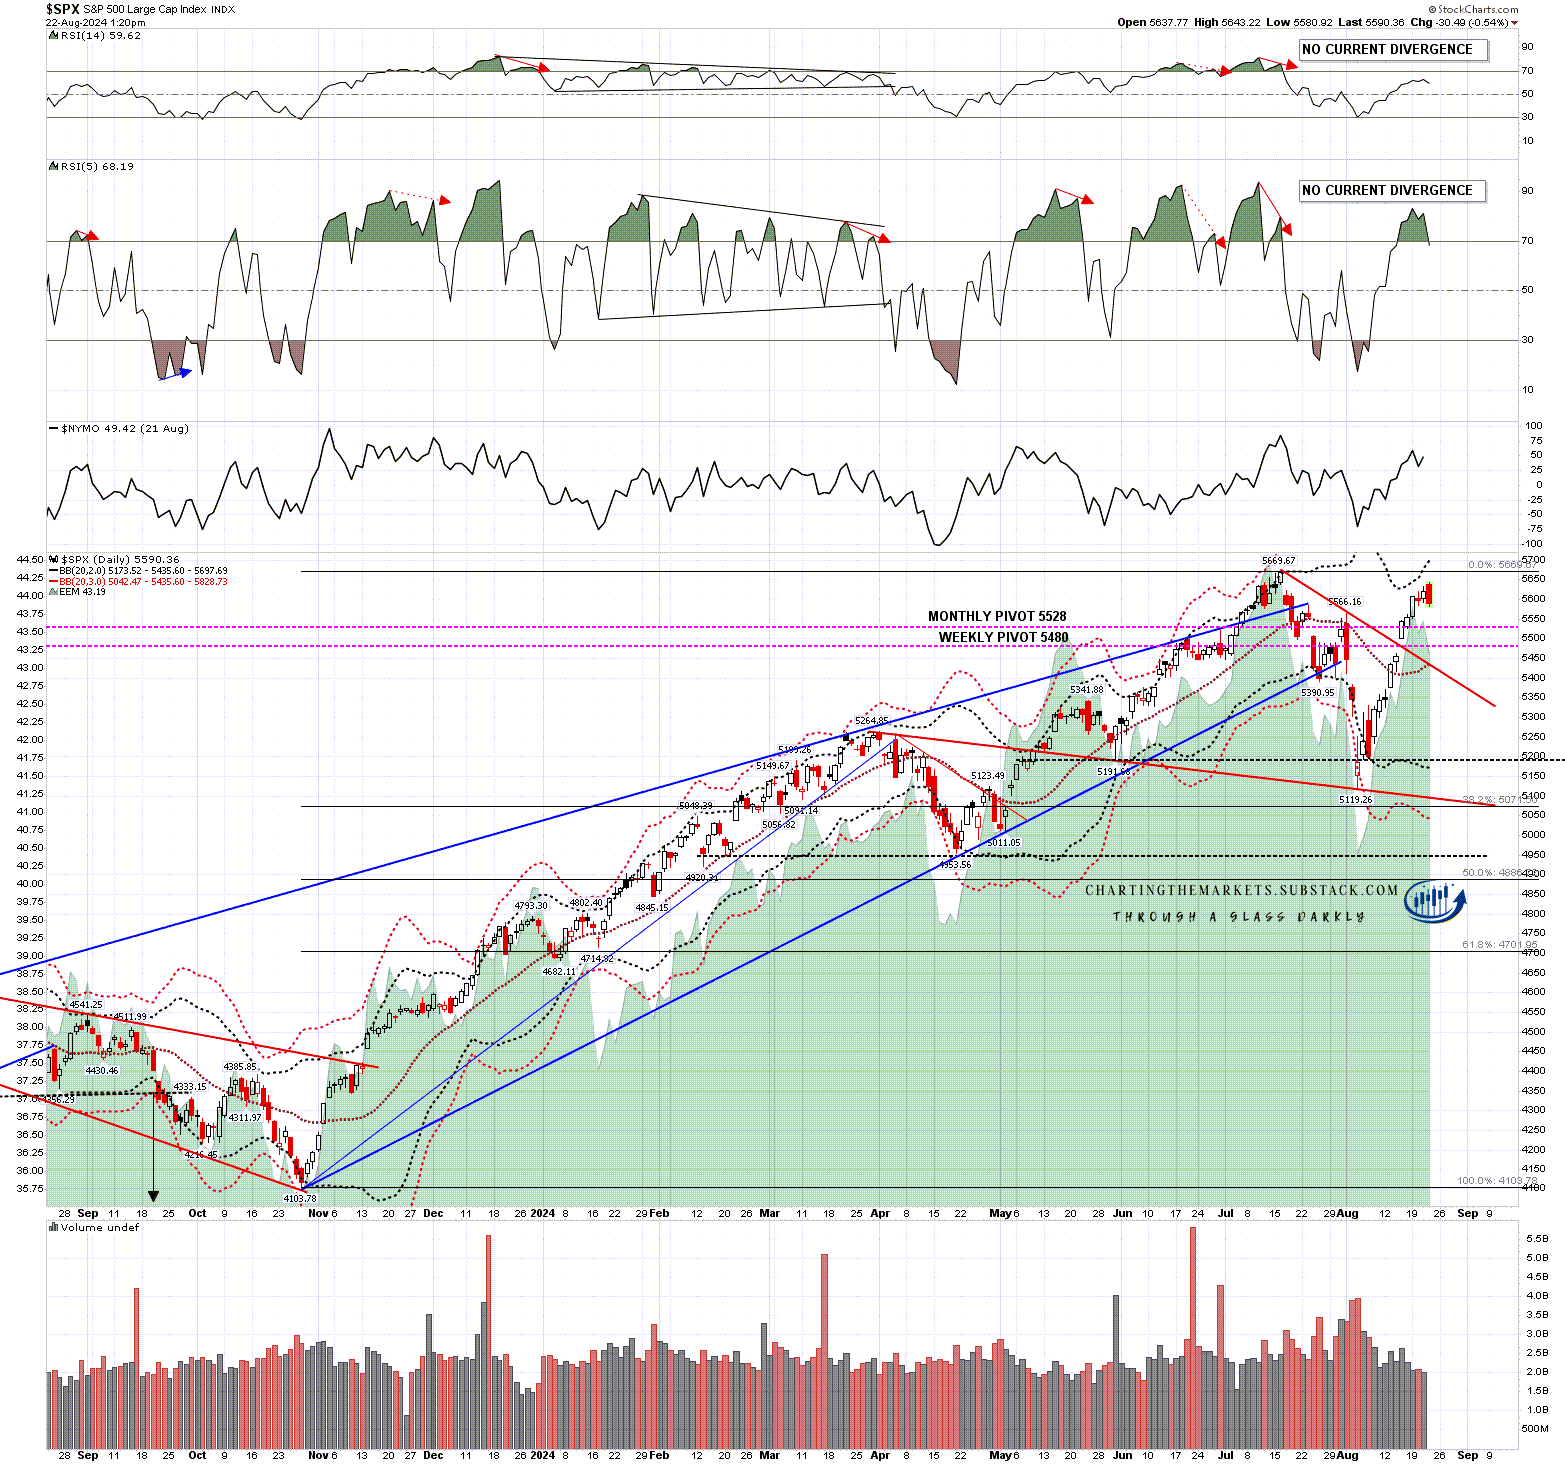
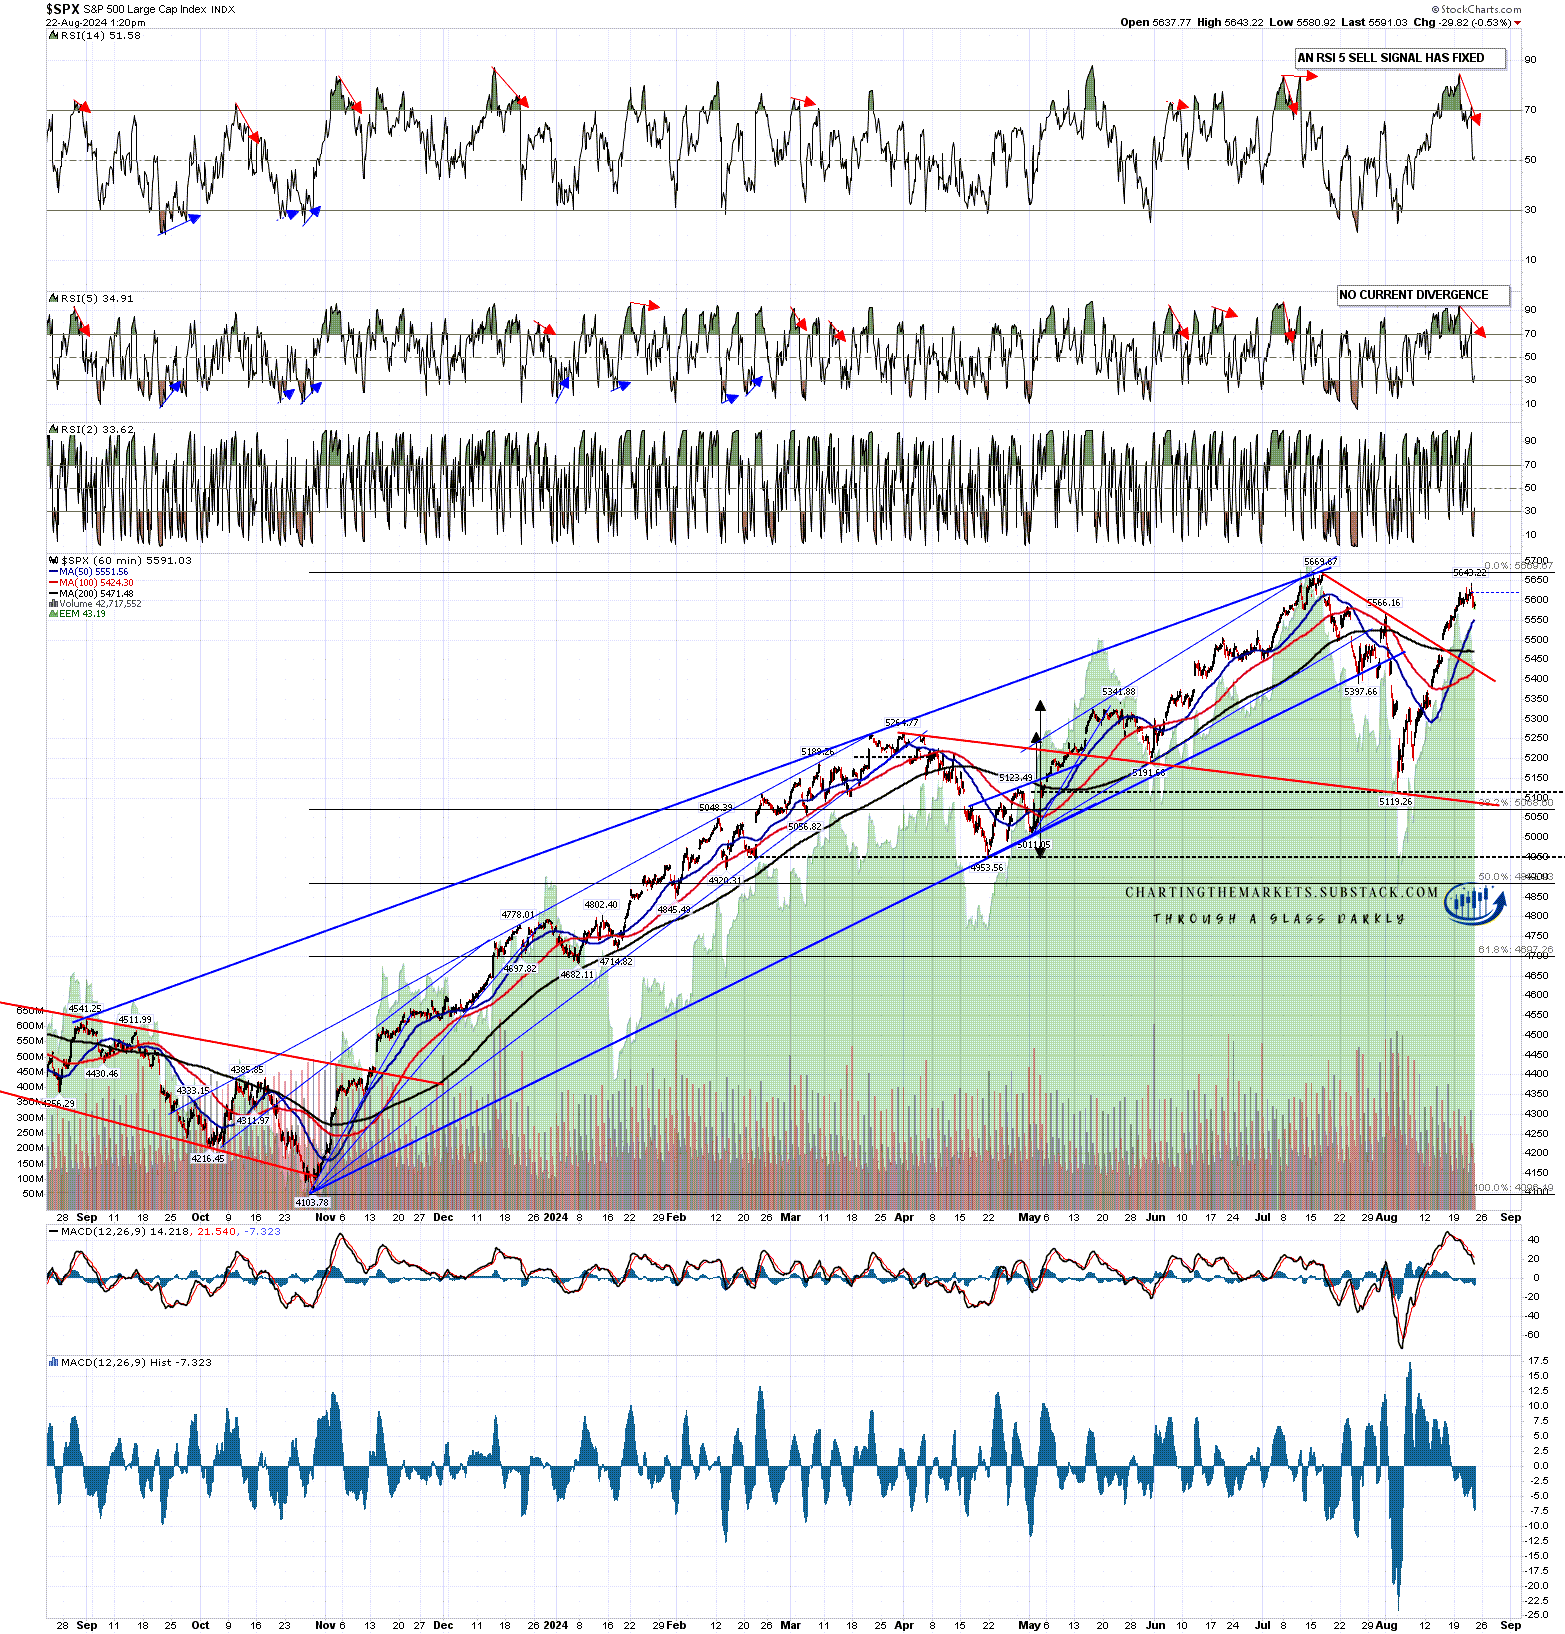
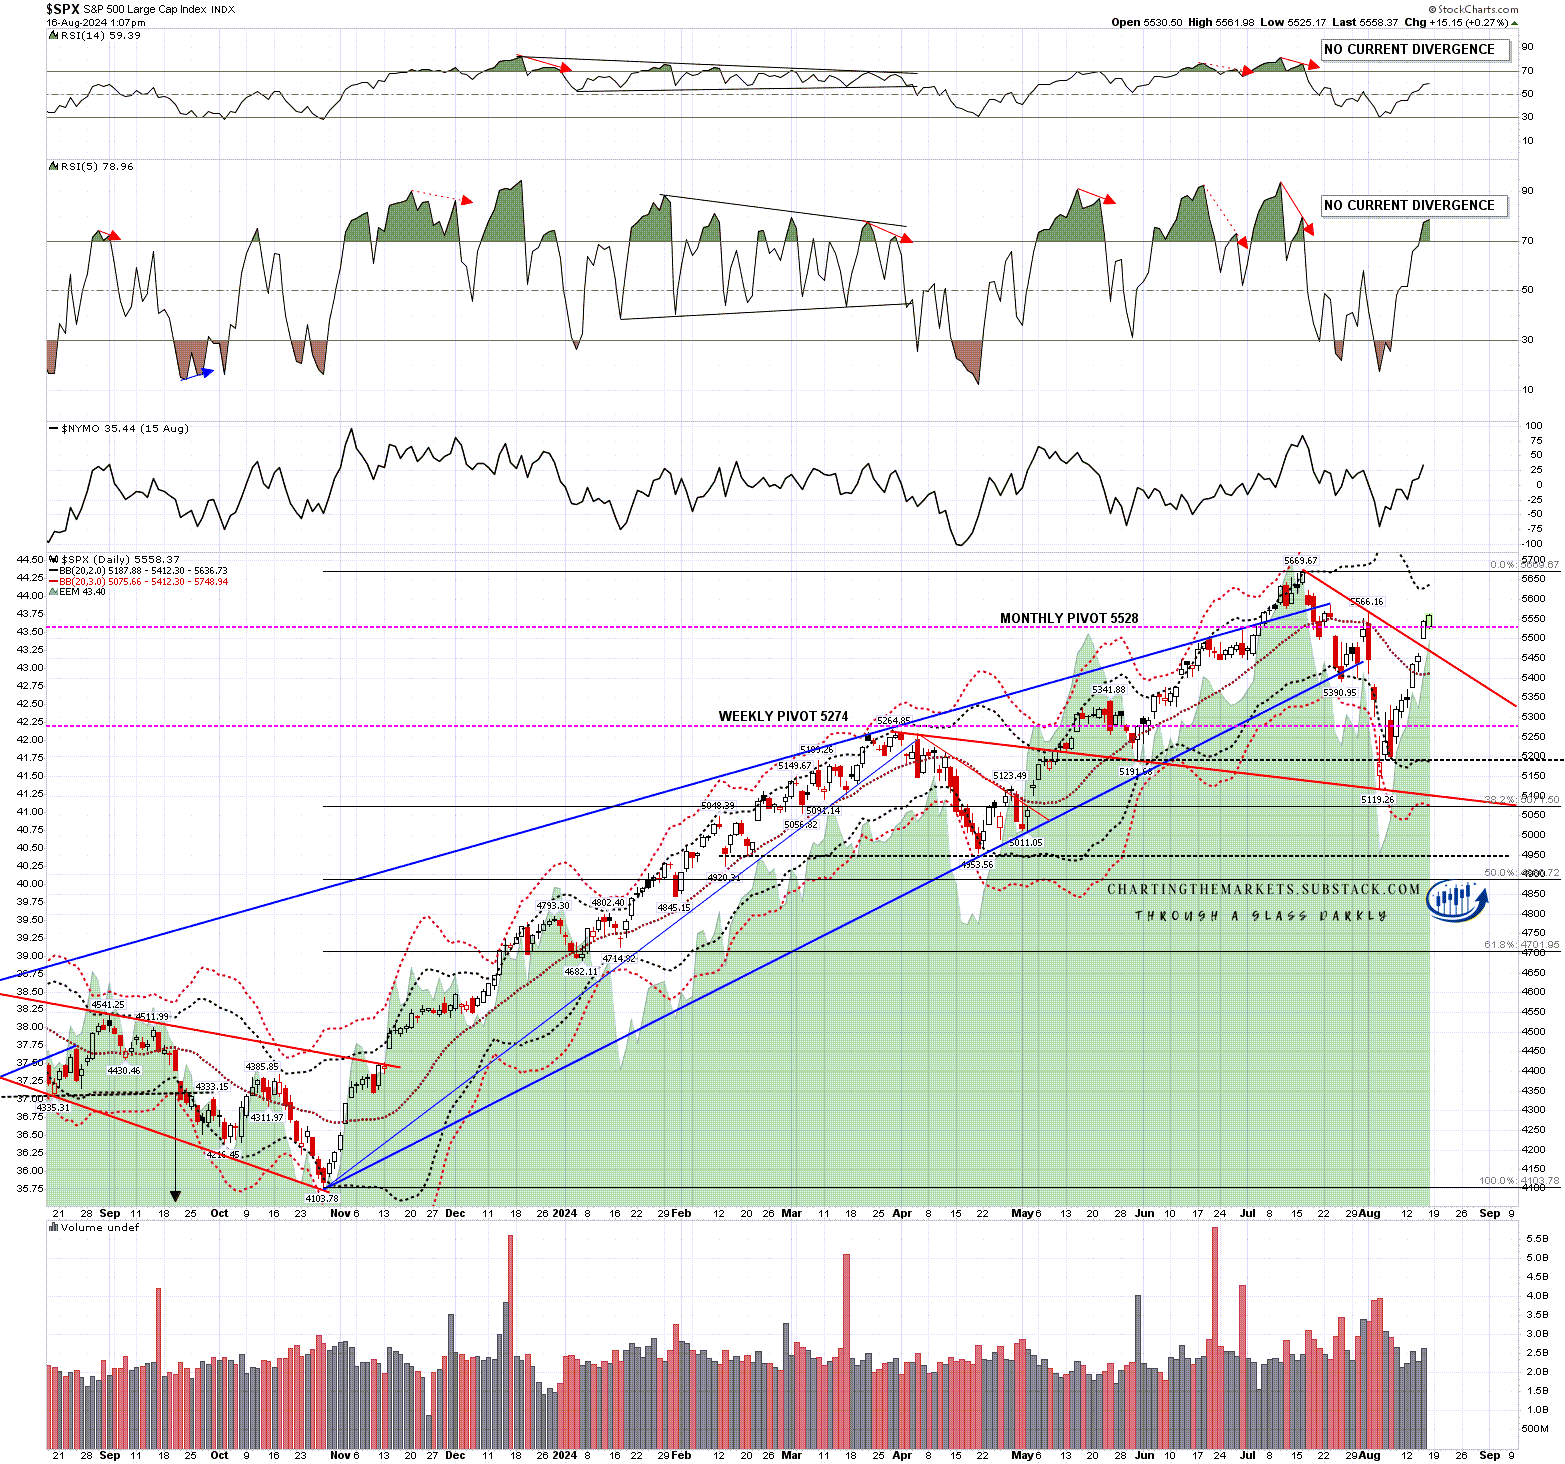
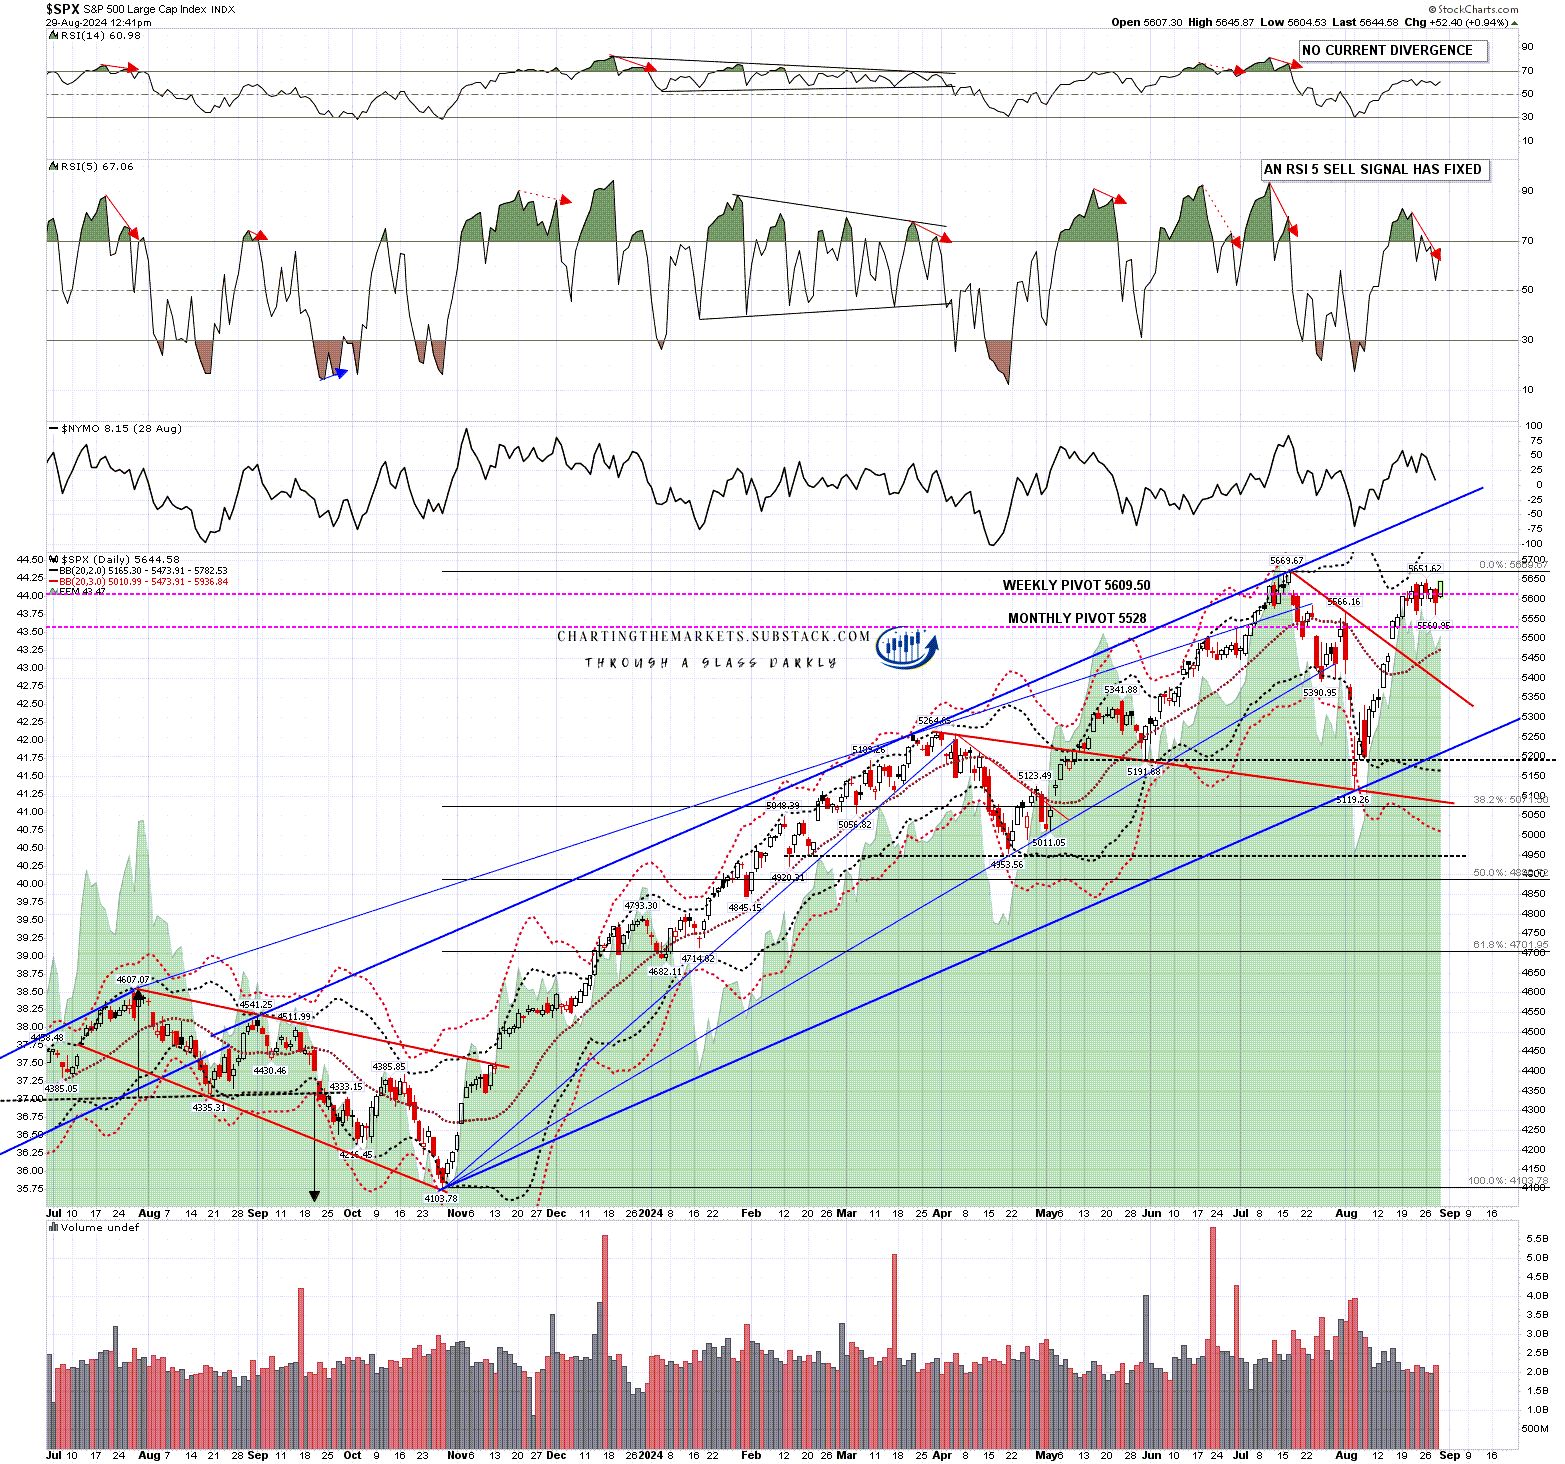
So what is the setup for a decent retracement from this area? Not bad actually. I mentioned when SPX dropped sharply into the 5119.26 low that if SPX was topping out for a significant high, then 70% of the time that would involve a high retest, and SPX is close to that high retest, which will set up a good quality double top pattern.

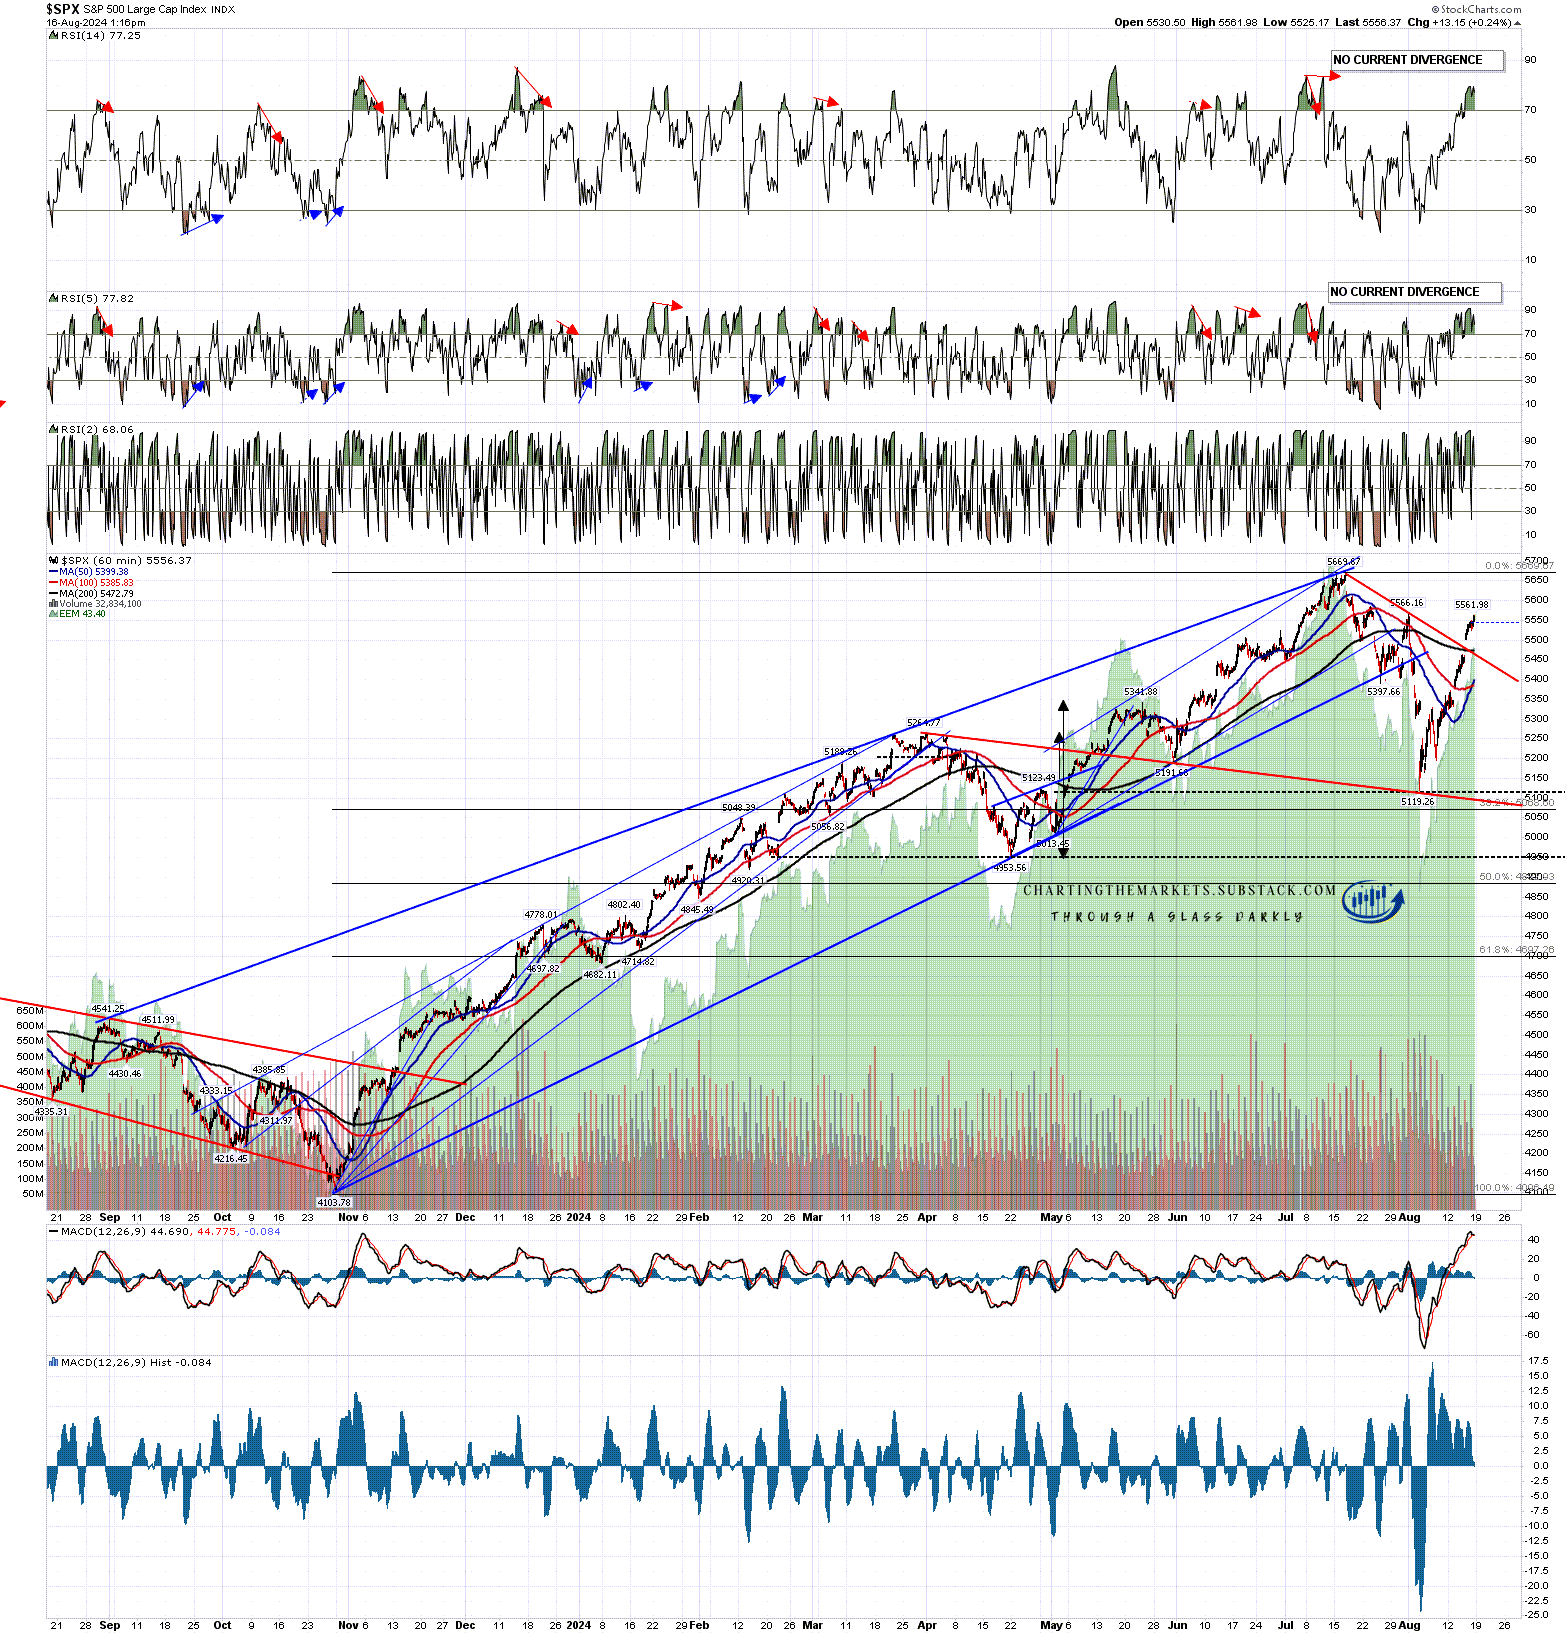
On yesterday’s decline a daily RSI 5 sell signal fixed on SPX and this has a target on the daily RSI 5 back in the 30-5 area. These are good signals though I would note that during the collapse upwards over the last year only four of the six of these signals that fixed reached target.

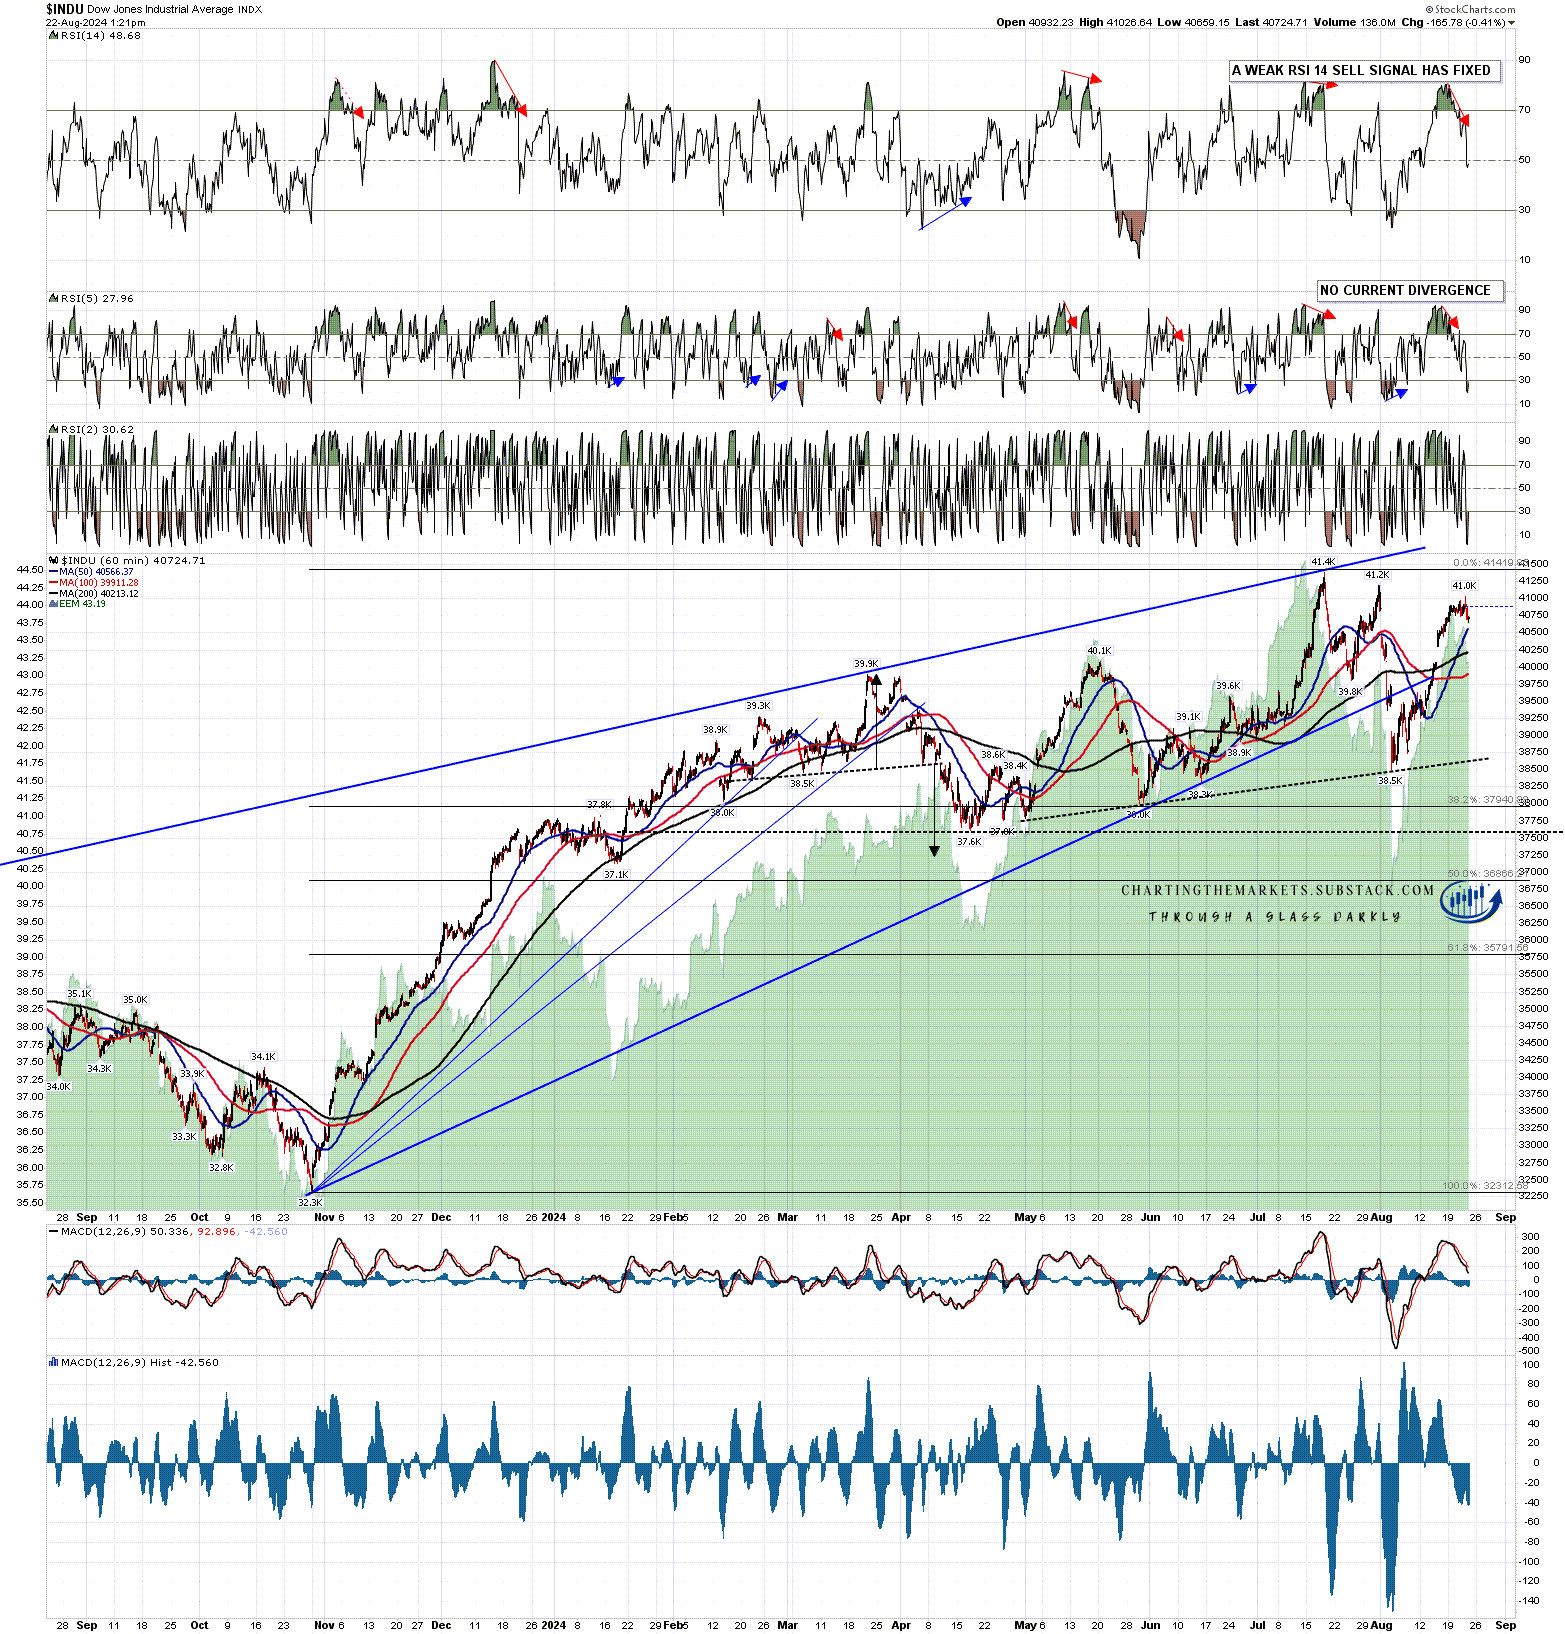
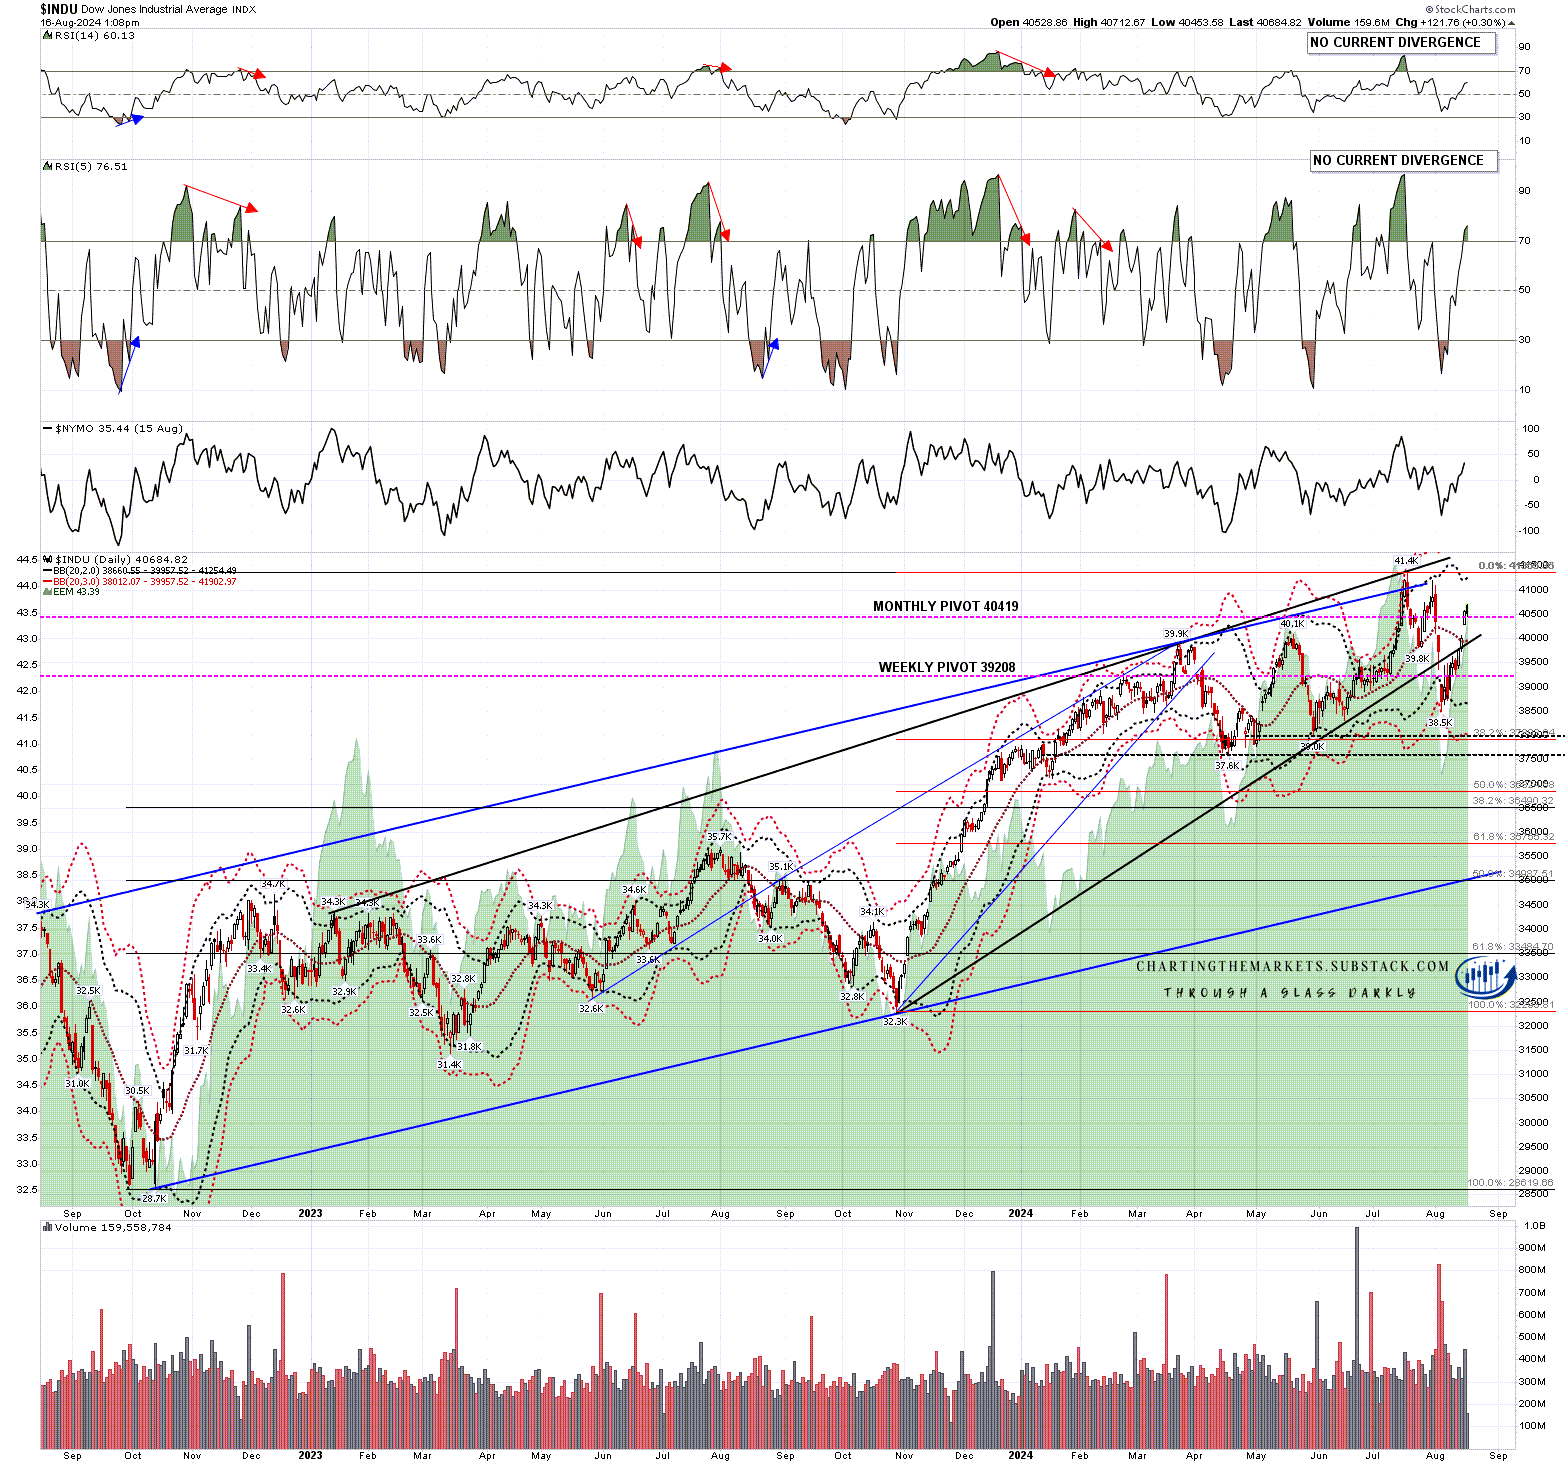
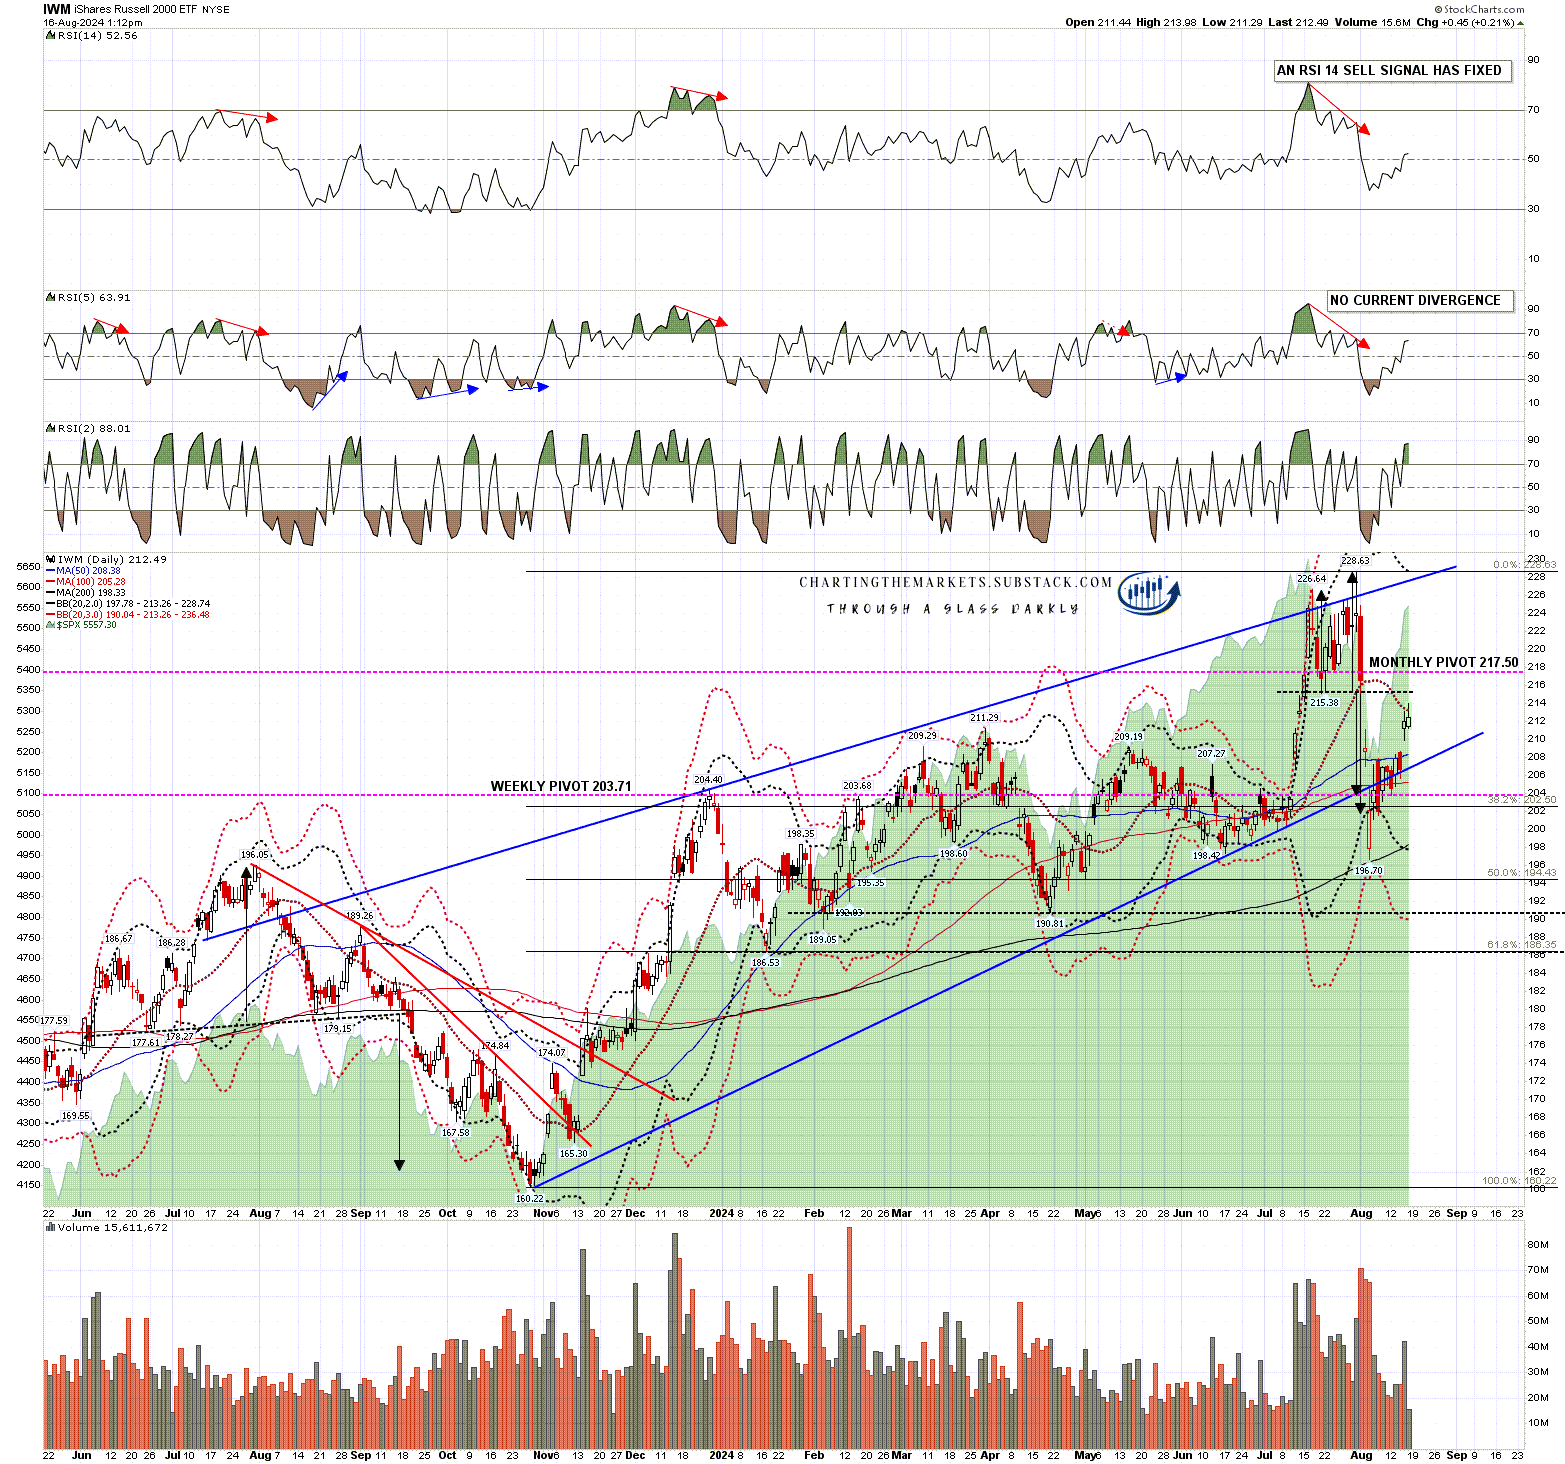
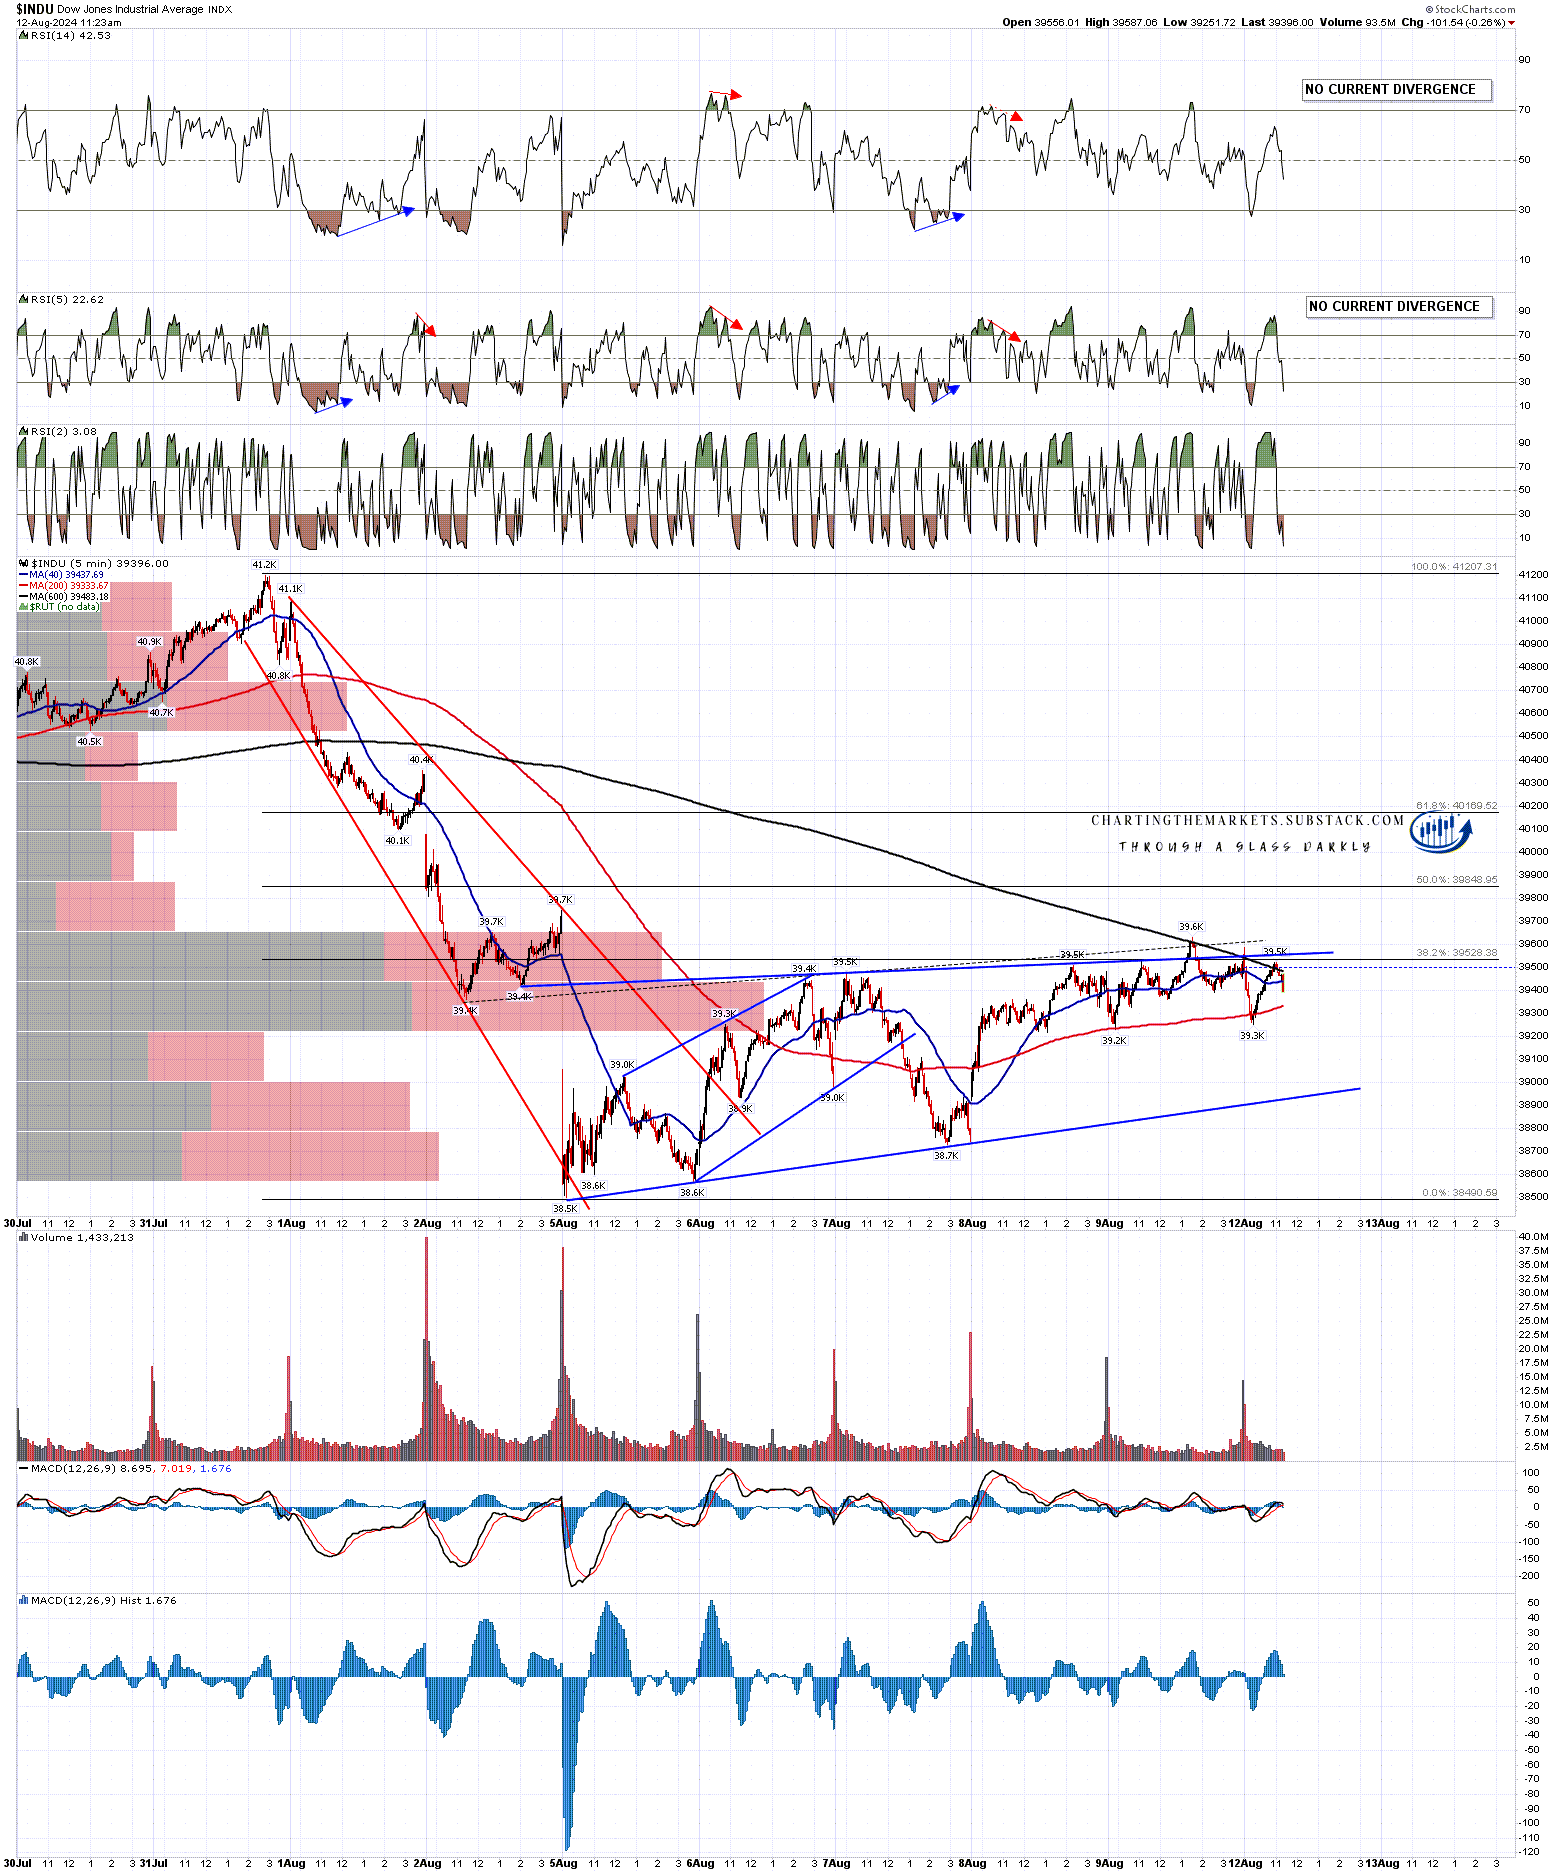
Another possible daily RSI 5 sell signal is brewing on Dow and that hasn’t fixed yet, and if IWM retests the short term high at 222.45, another would start brewing there too.

I had my doubts about seeing much downside action in the month before the presidential election, but looking at these historically since 2000, that looks very possible (more detail on this in the conclusion) and September is also traditionally one of the weakest months of the year.

On the bull side I would mention that there is a high quality rising wedge established from the October 2023 low and the next obvious target within the wedge would be the wedge resistance trendline, currently in the 5890 area. If there is no imminent retracement coming, then that trendline would be the obvious next target.

SPX daily BBs chart:

On SPX I’m expecting to see a full retest of the all time high soon, and with Labor Day on Monday and likely bullish holiday tape into and immediately after that, I’m thinking that retest likely happens by Wednesday at the latest. That would set up another possible large double top to join the one already set up on Dow.
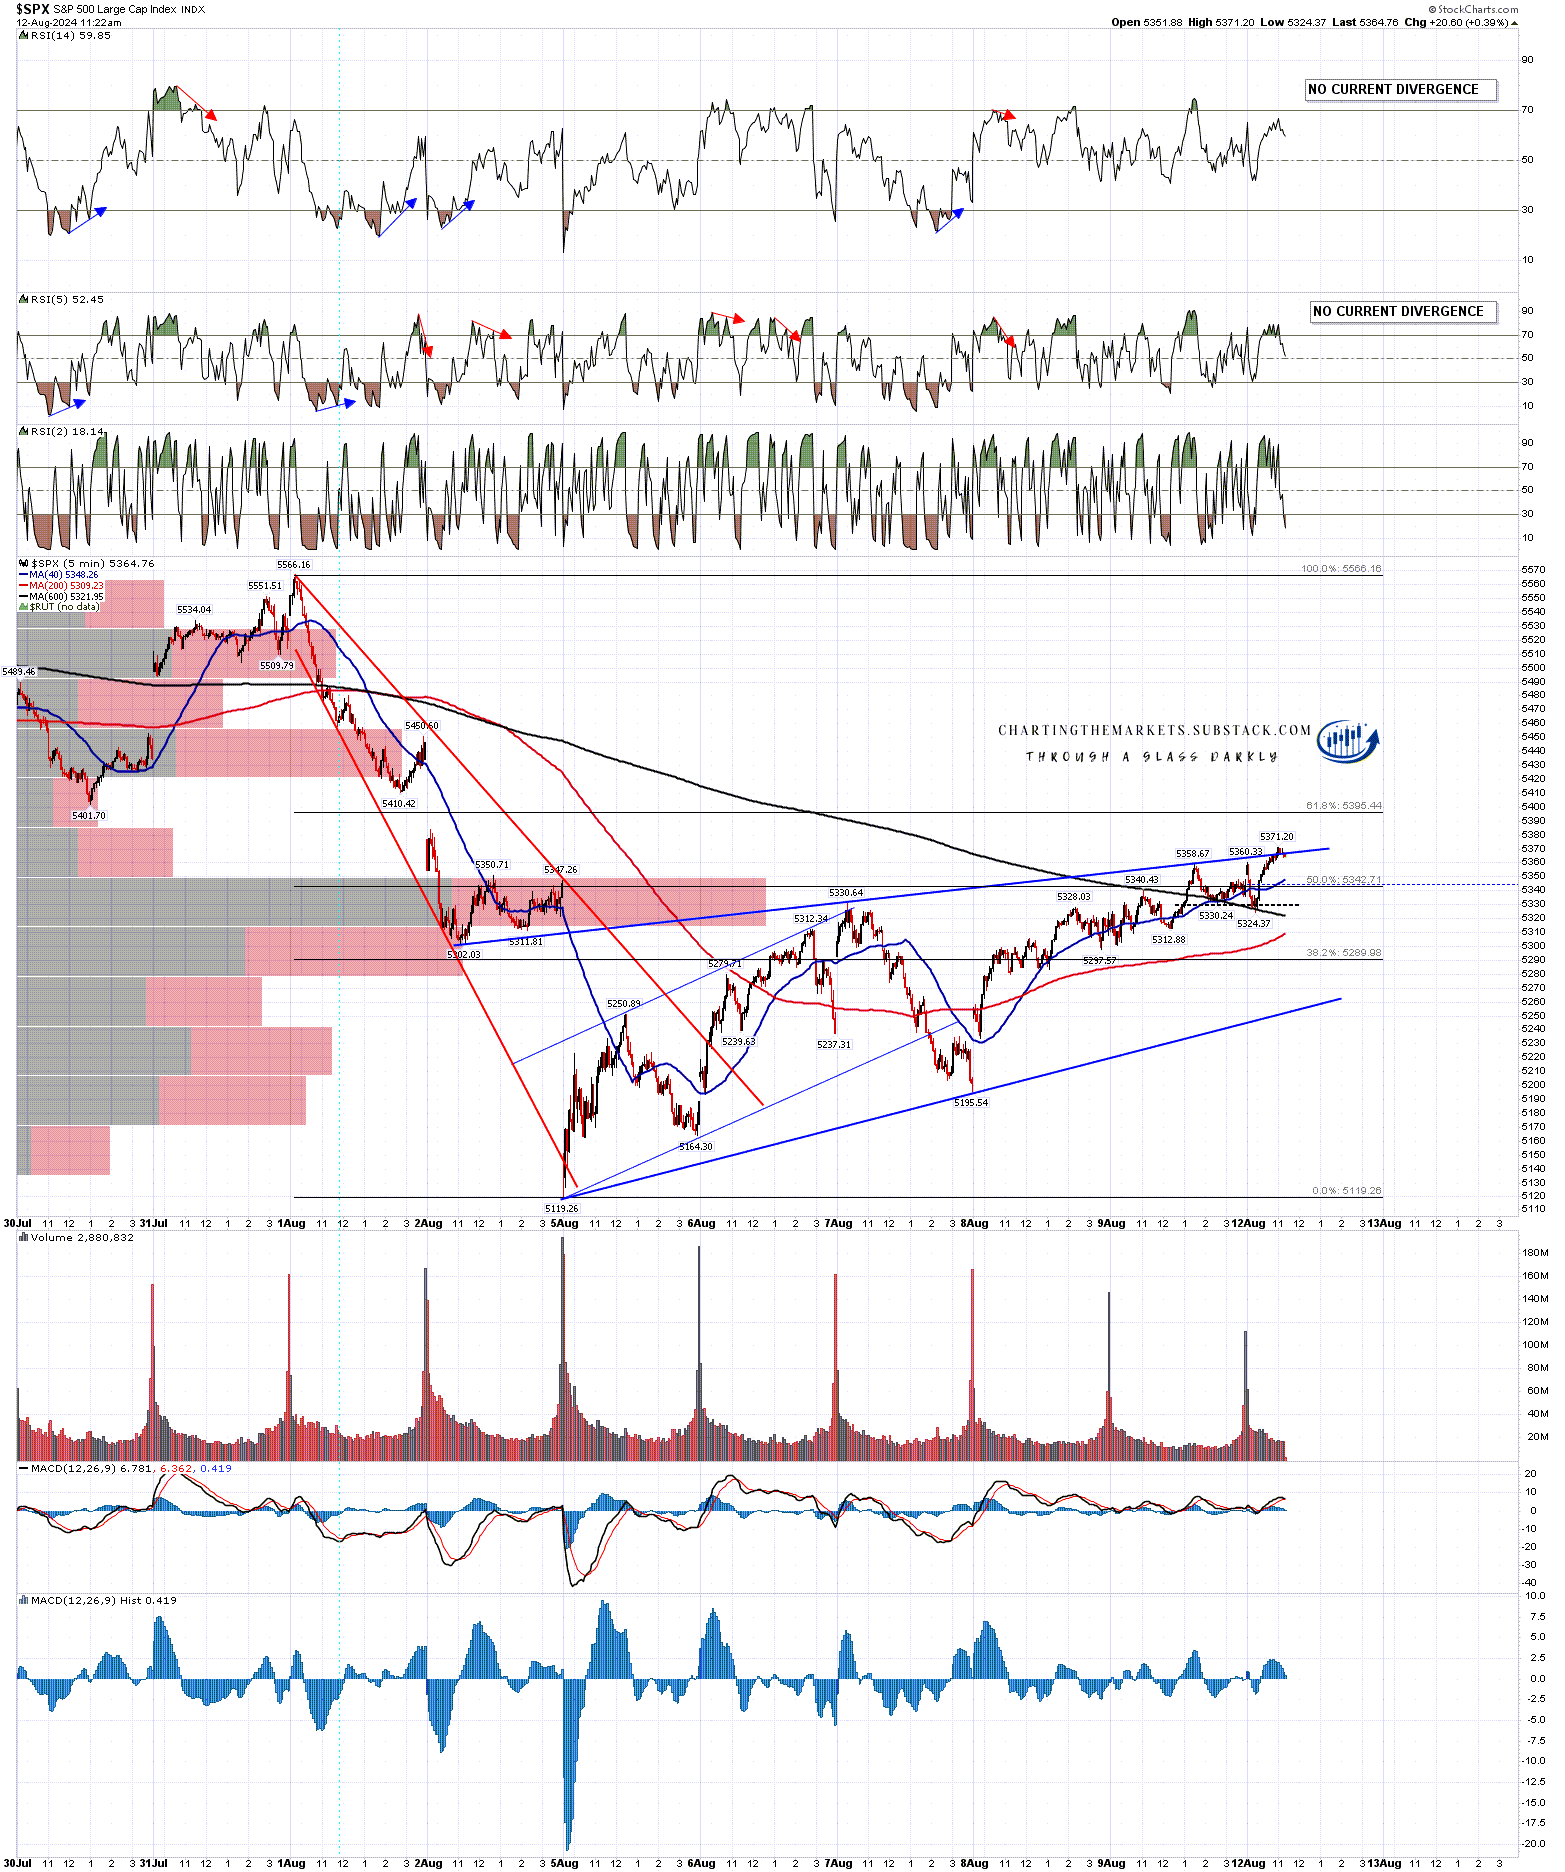
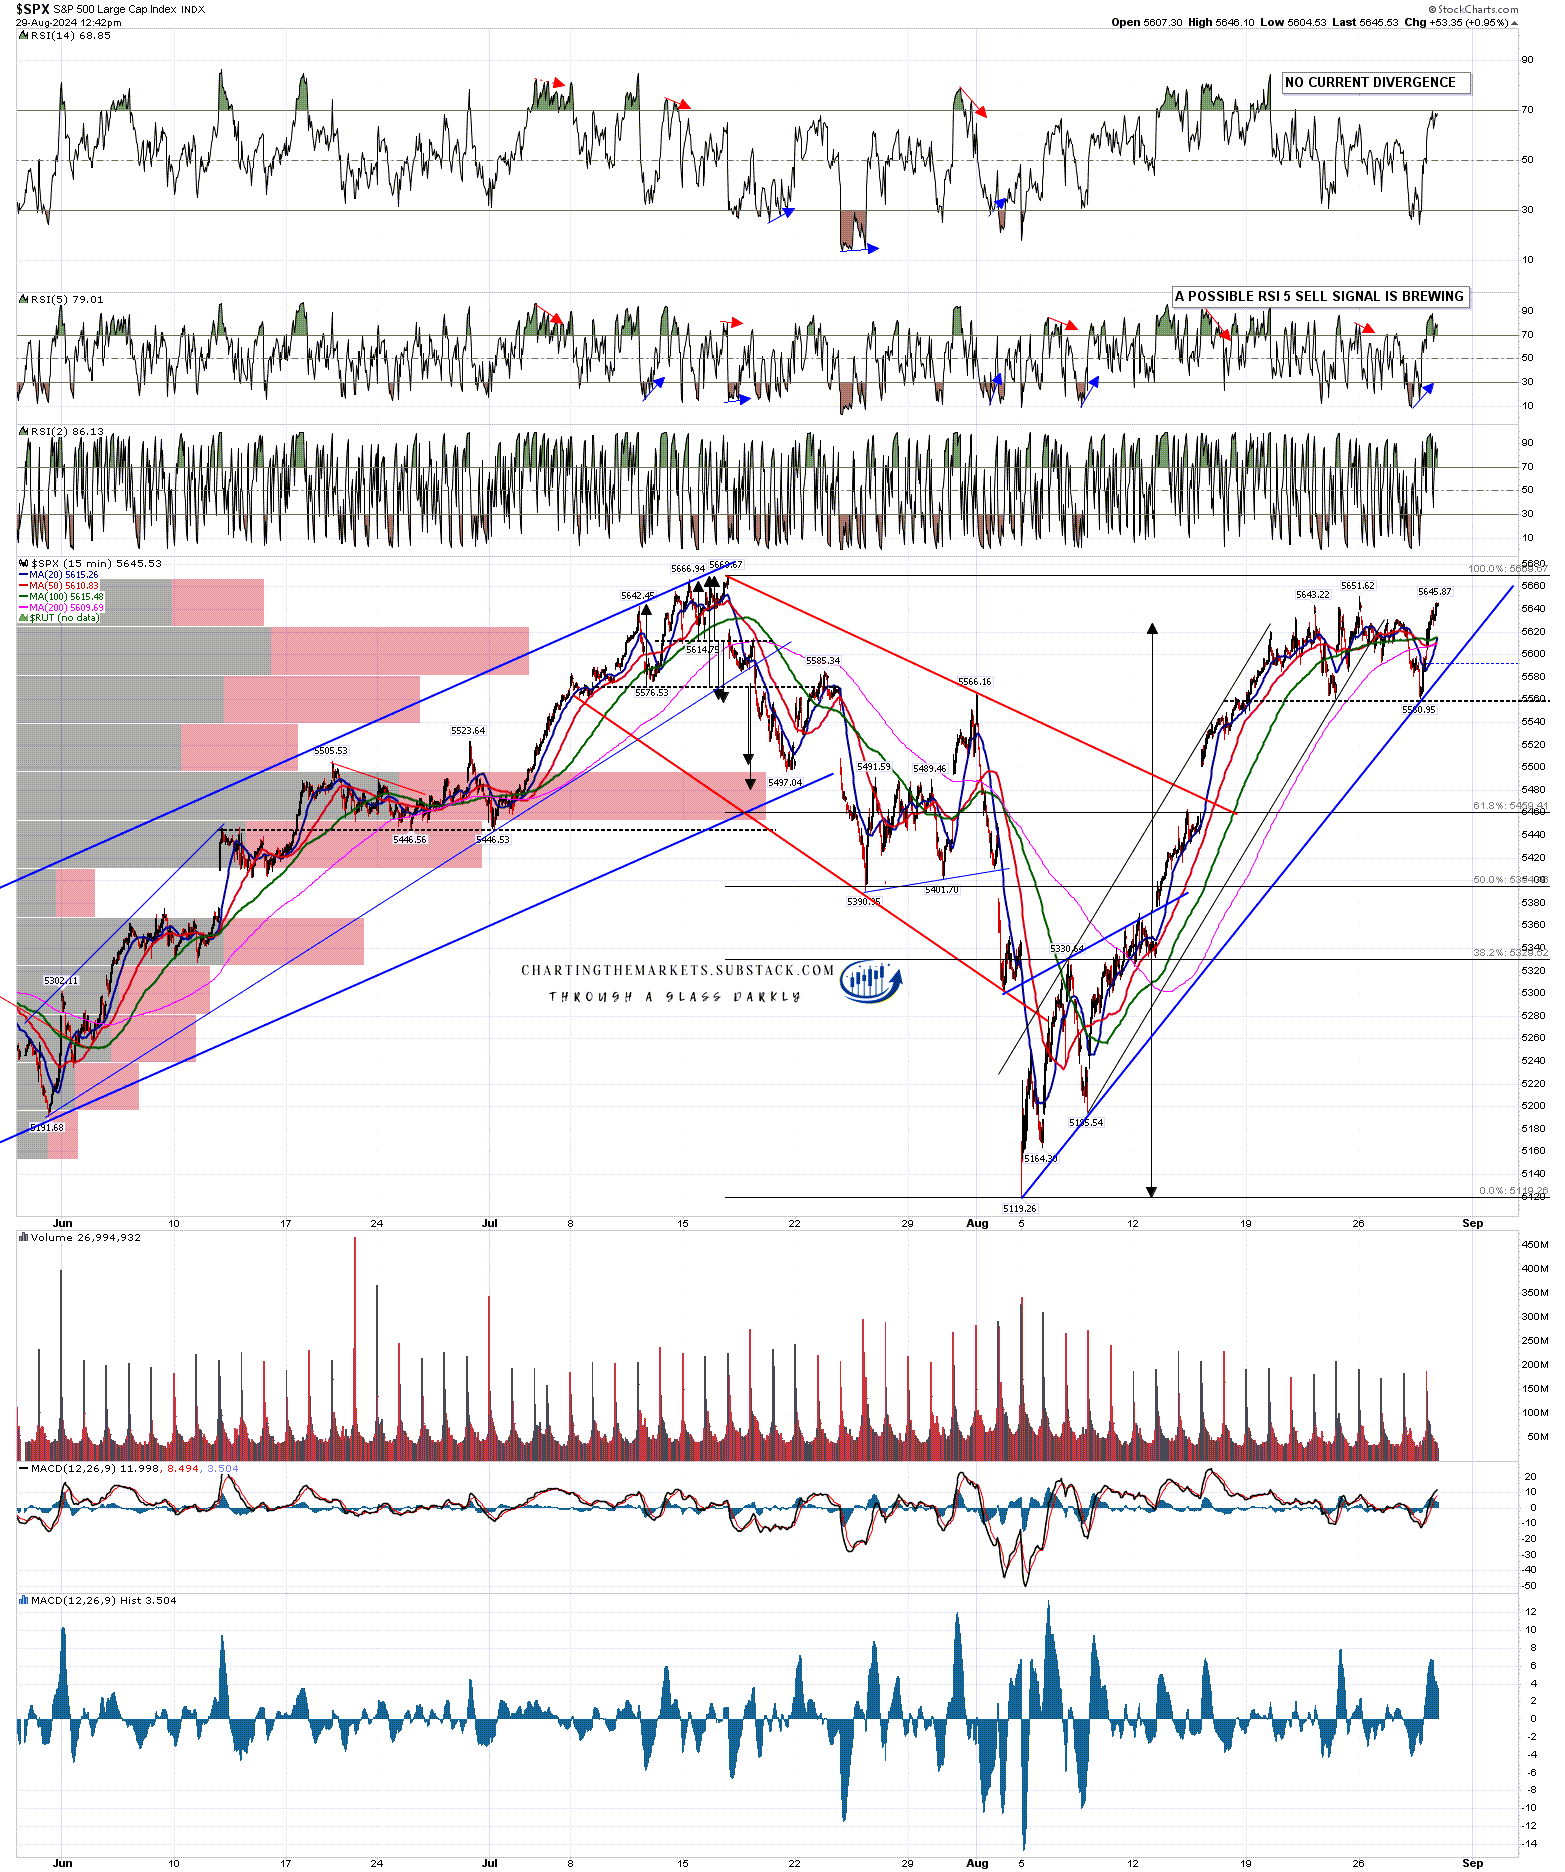
SPX 15min chart:

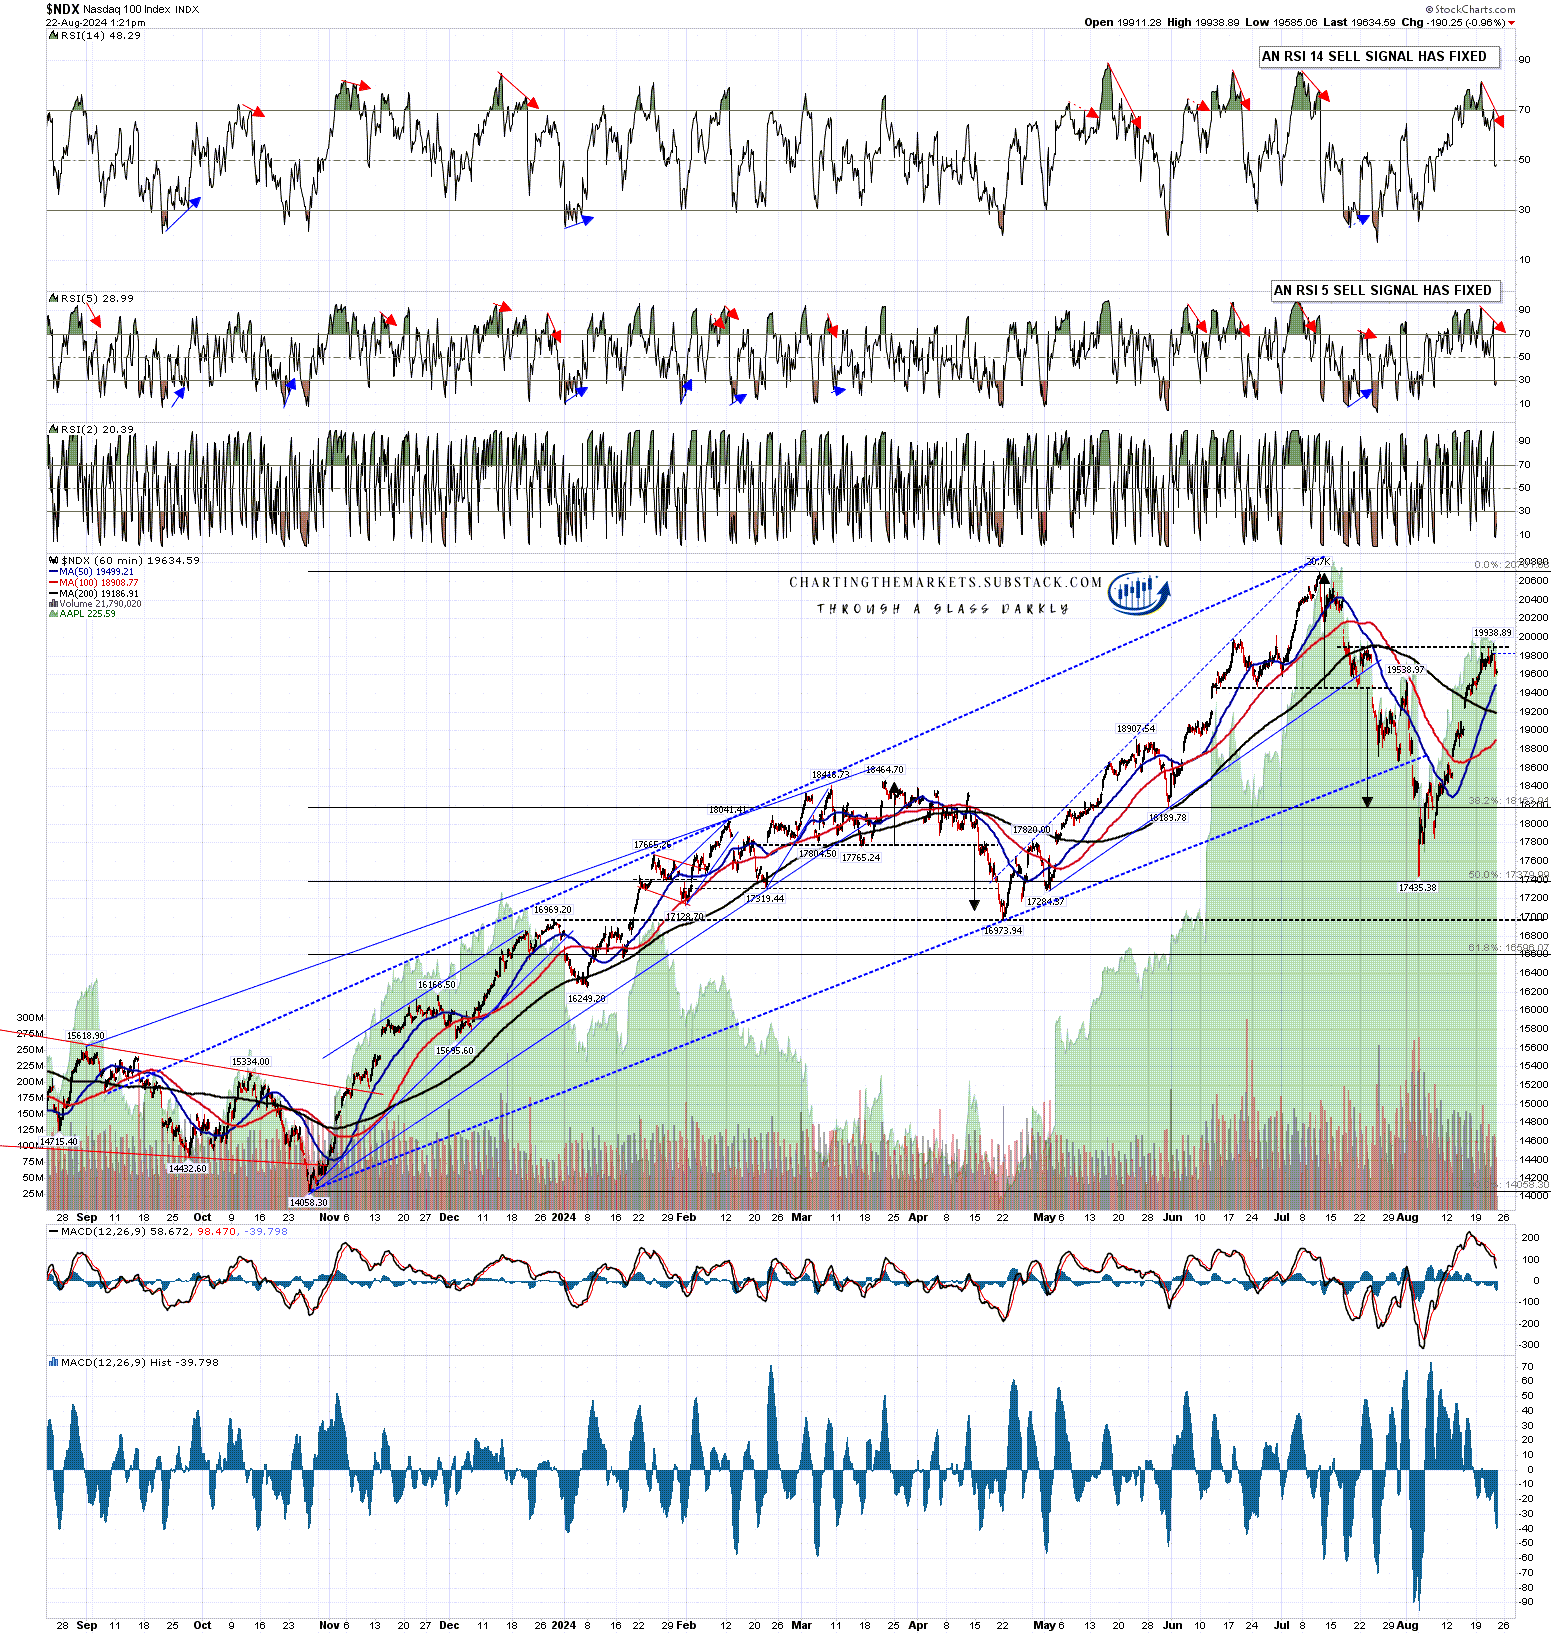
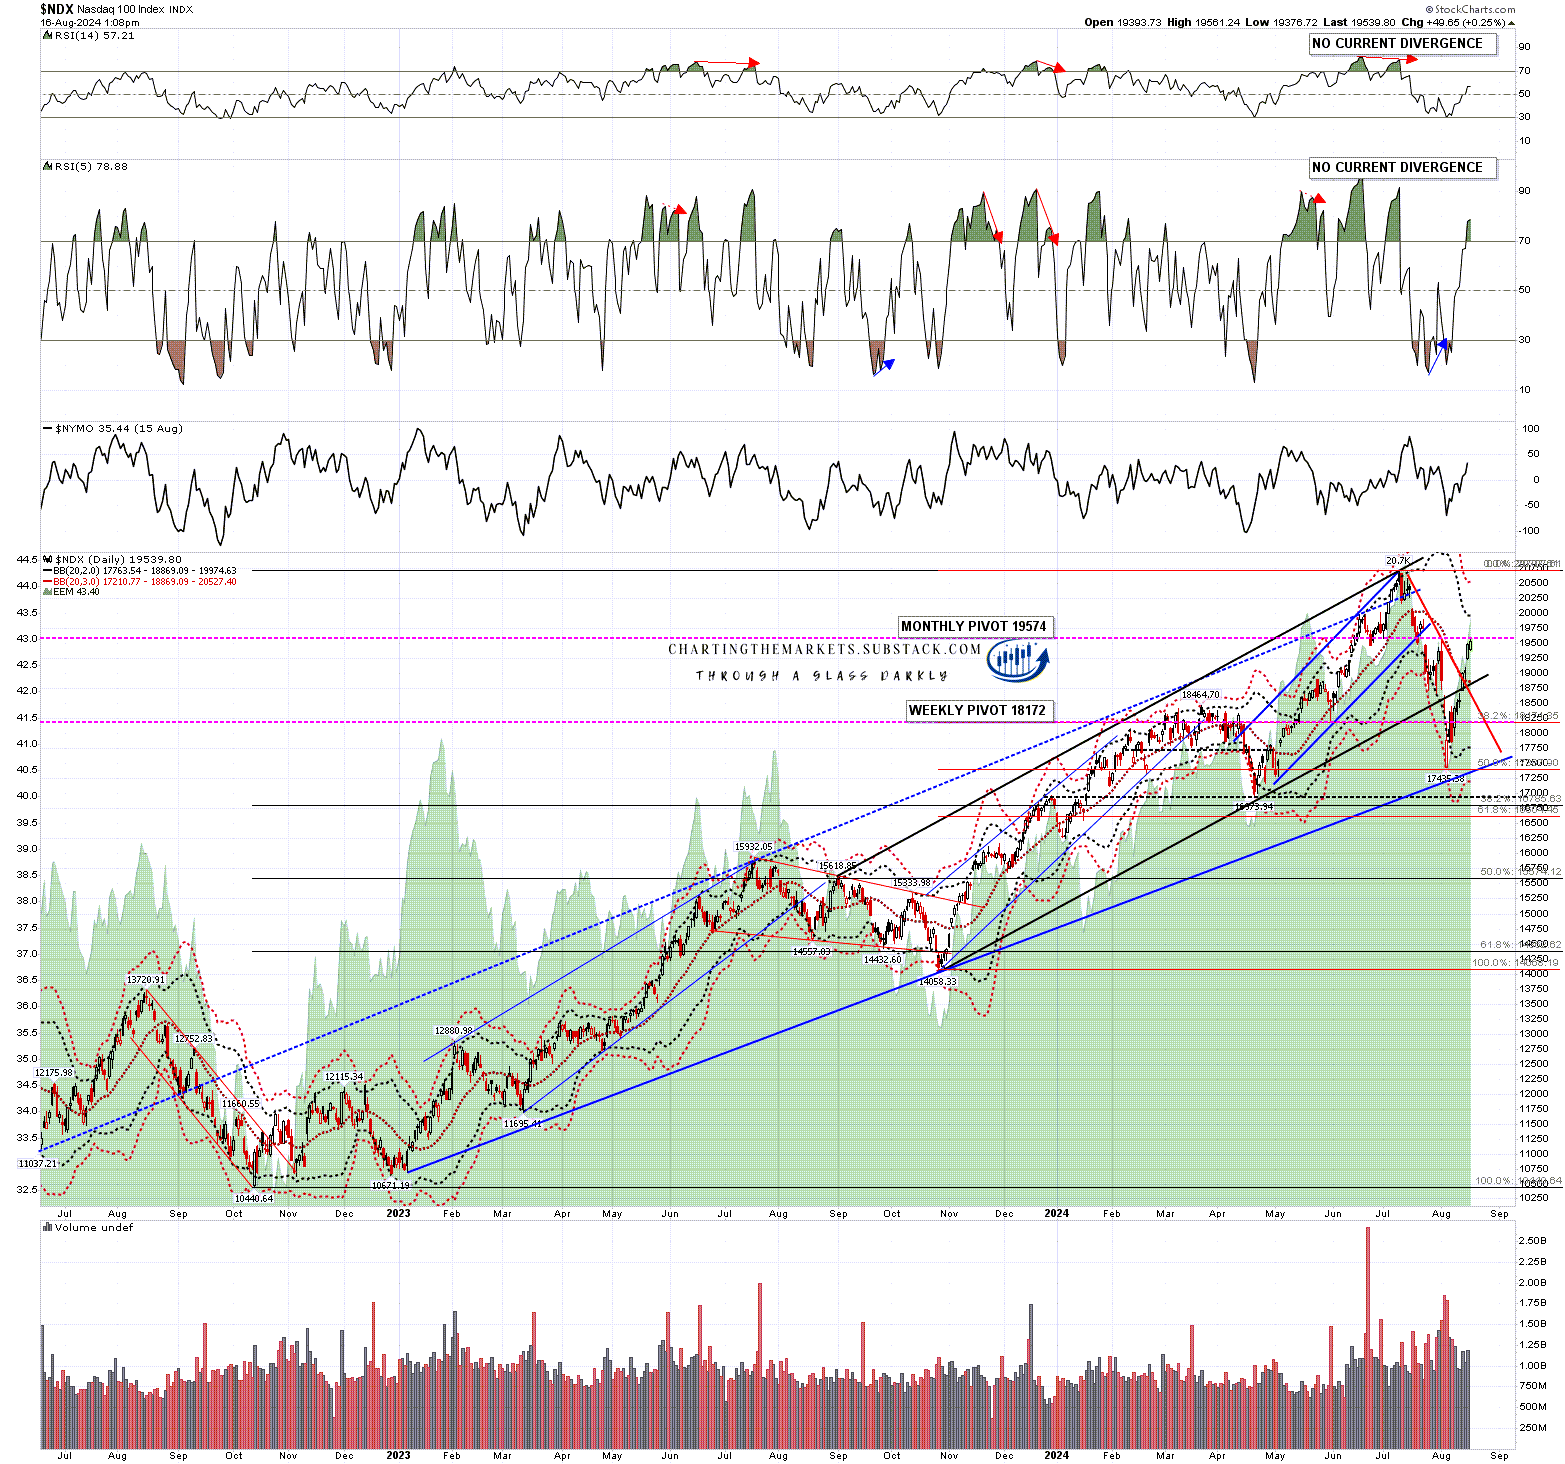
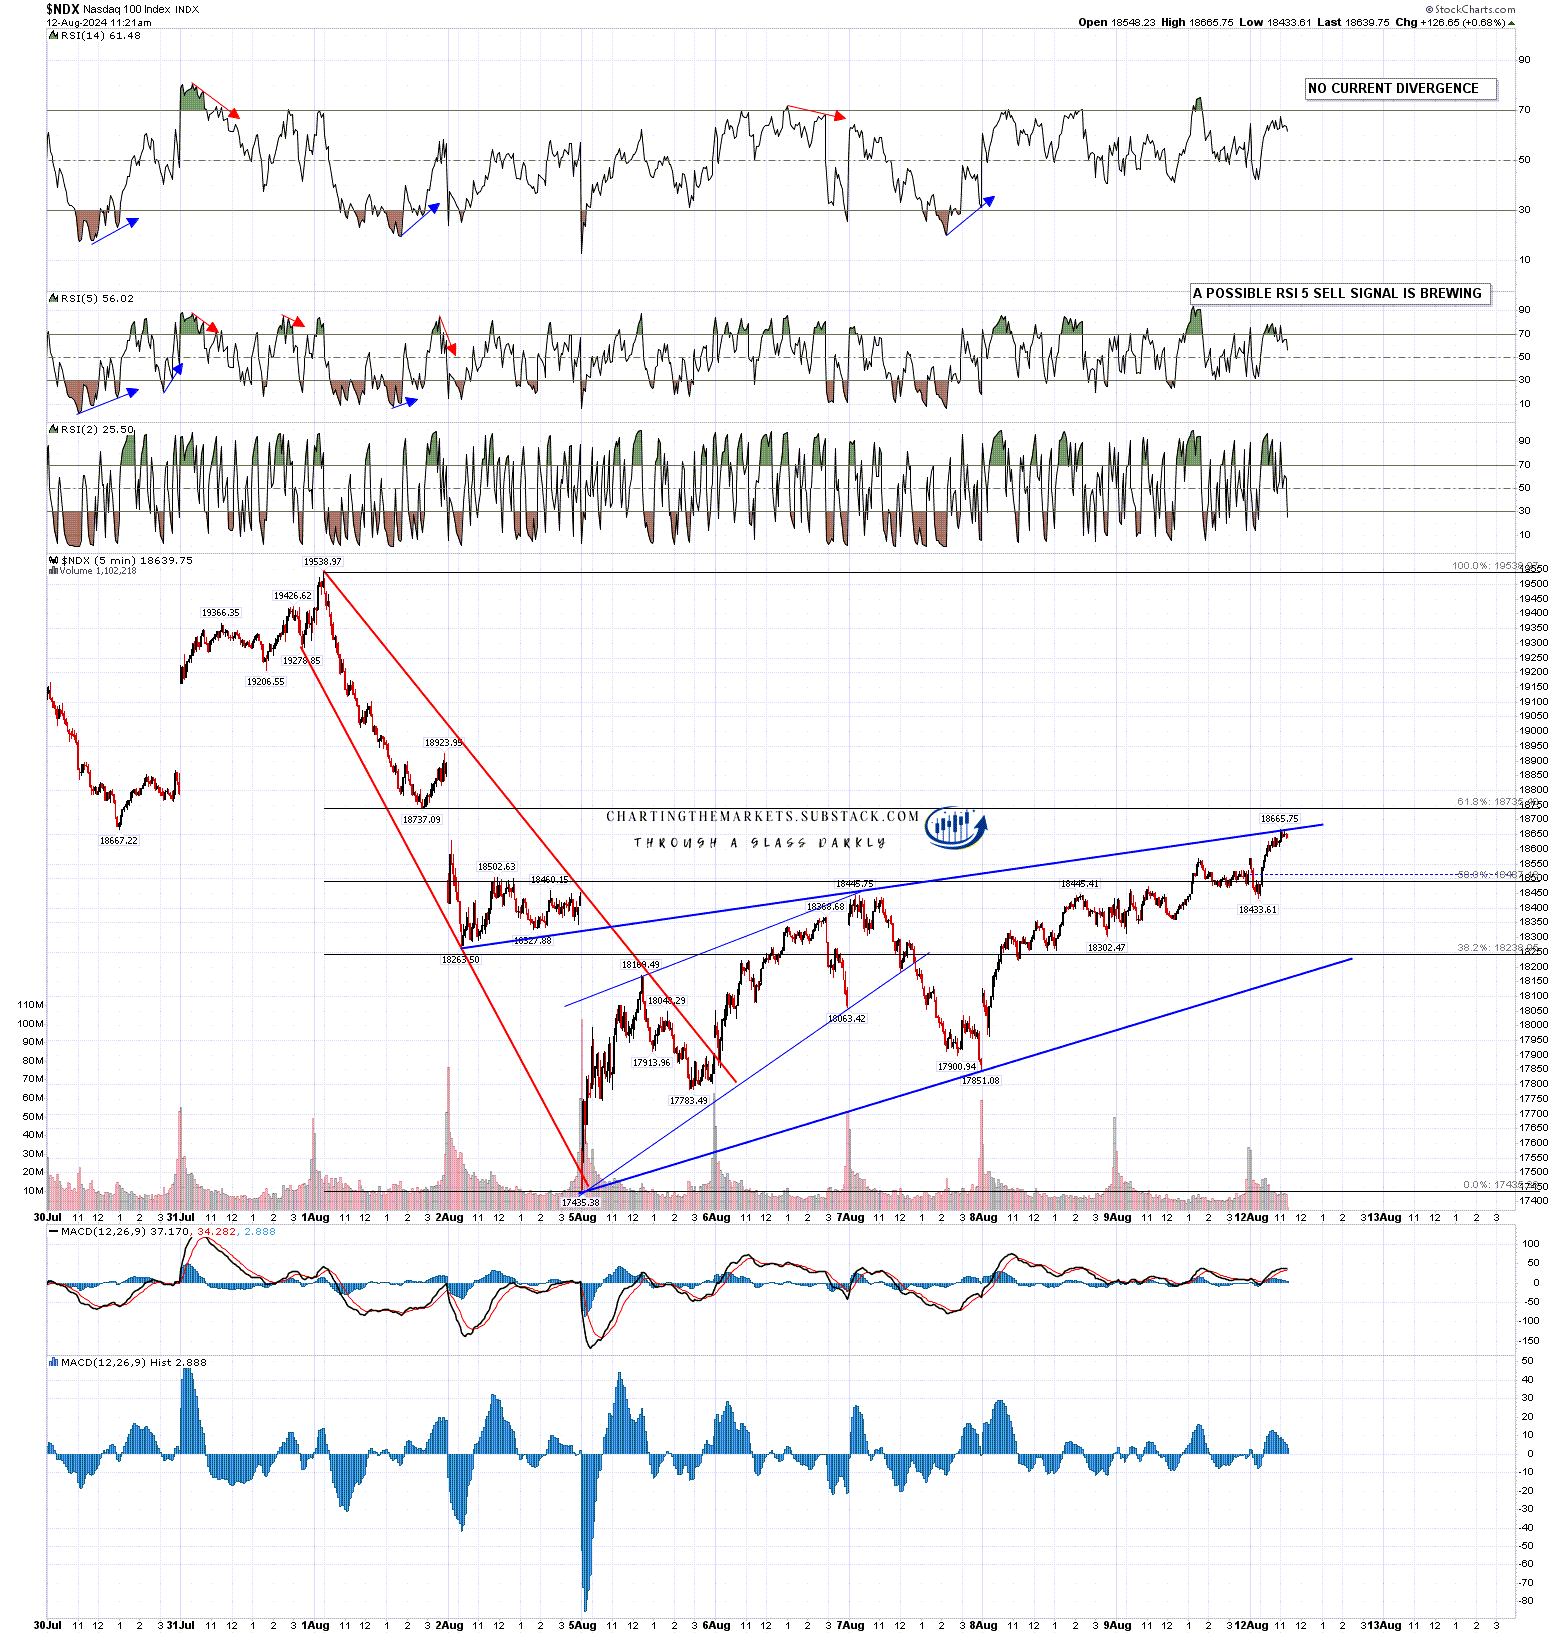
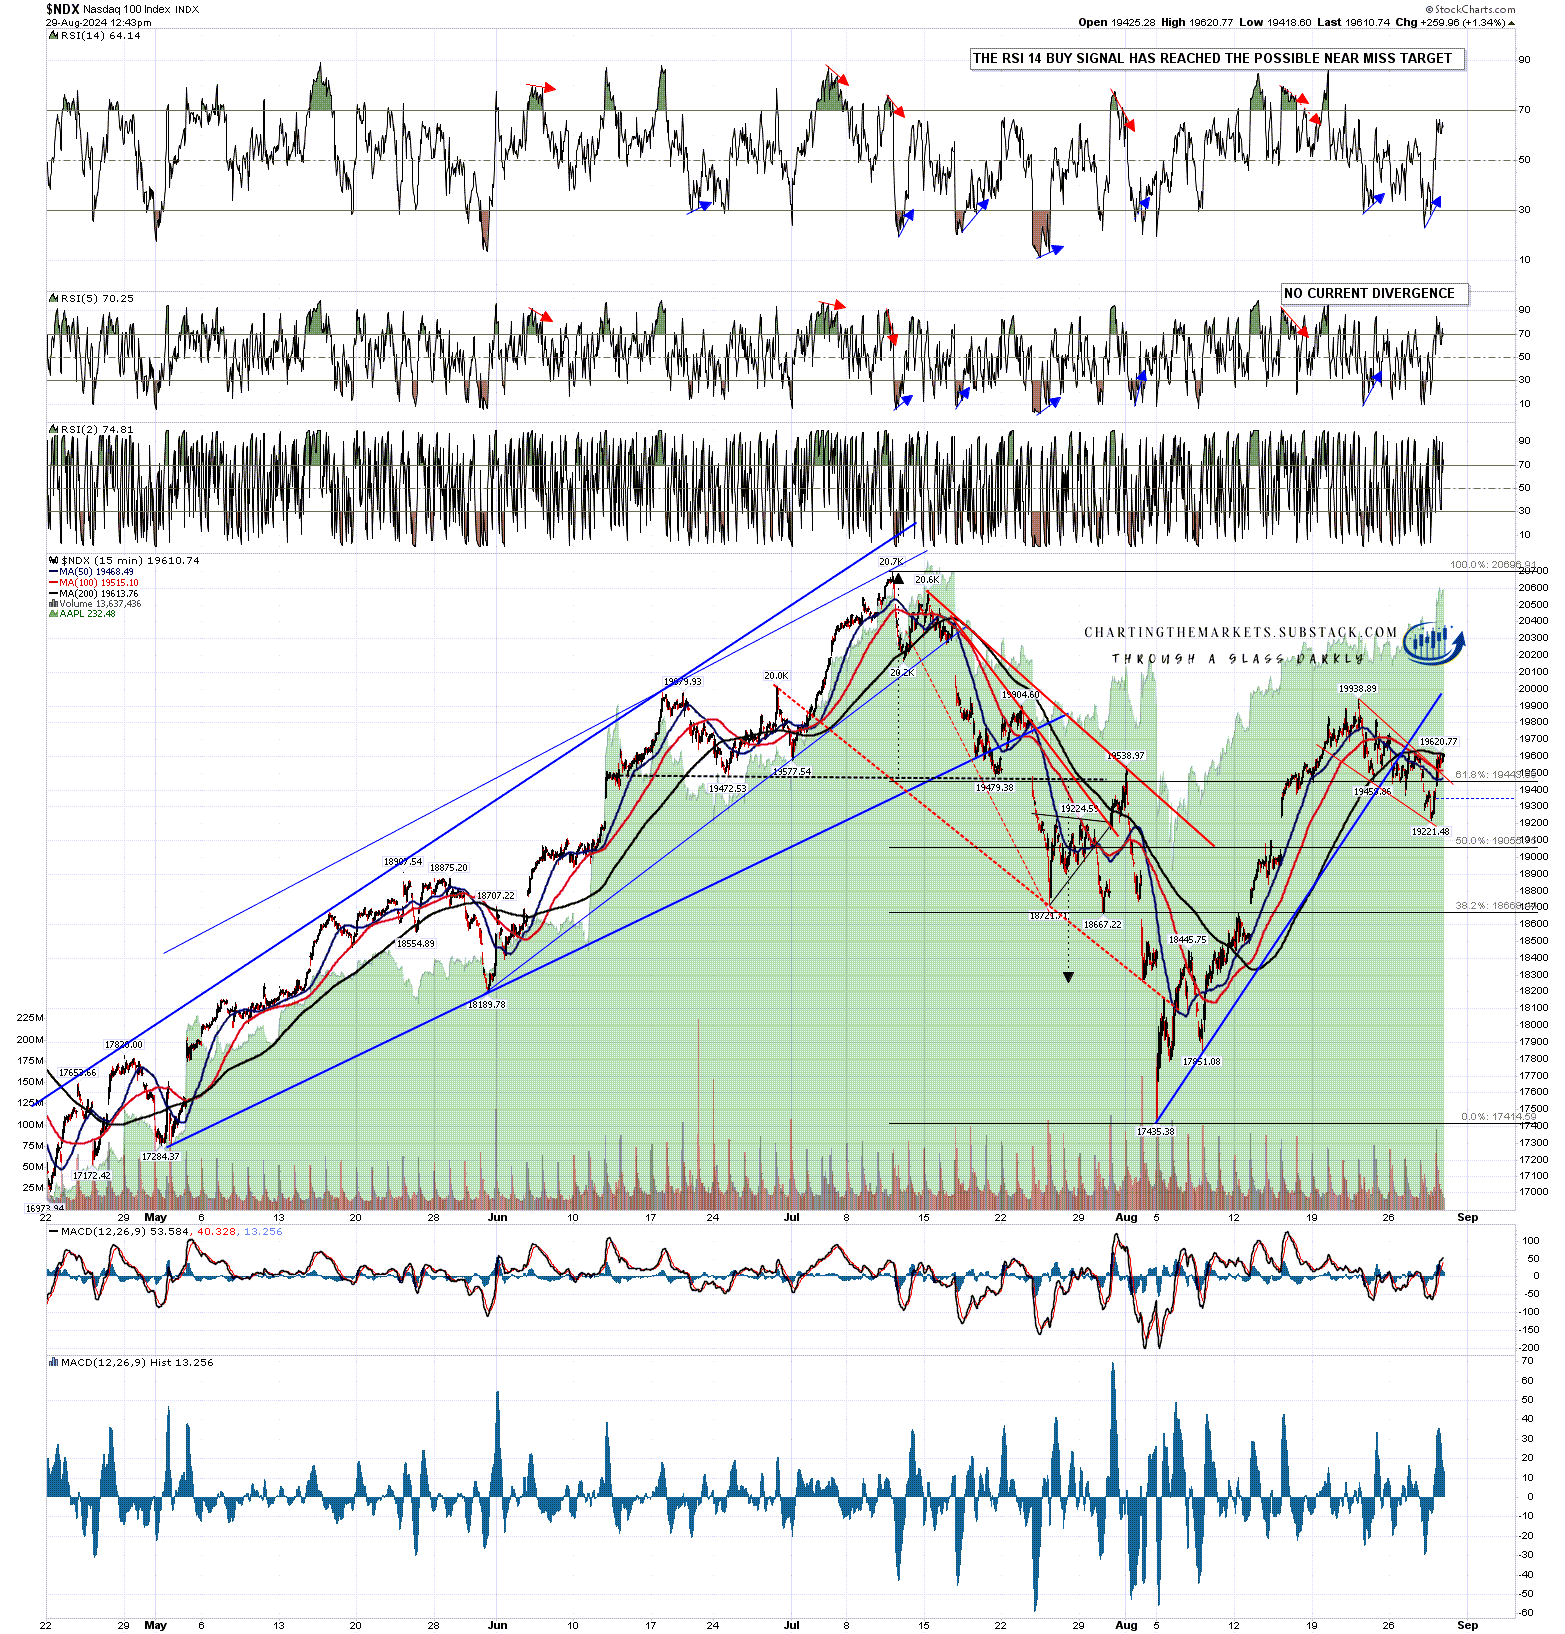
I’m more doubtful about seeing the all time high retested on NDX, as it has been trailing the other indices for the last few weeks, and has failed to catch much of a bid even after a solid beat on NVDA yesterday, but the bull flag that has formed this week and has now broken up is suggesting that a retest of the short term high on 19,938.89 is likely soon. NDX is the only one of the main indices that is not close to a daily RSI divergence, as it has been too weak.

NDX 15min chart:

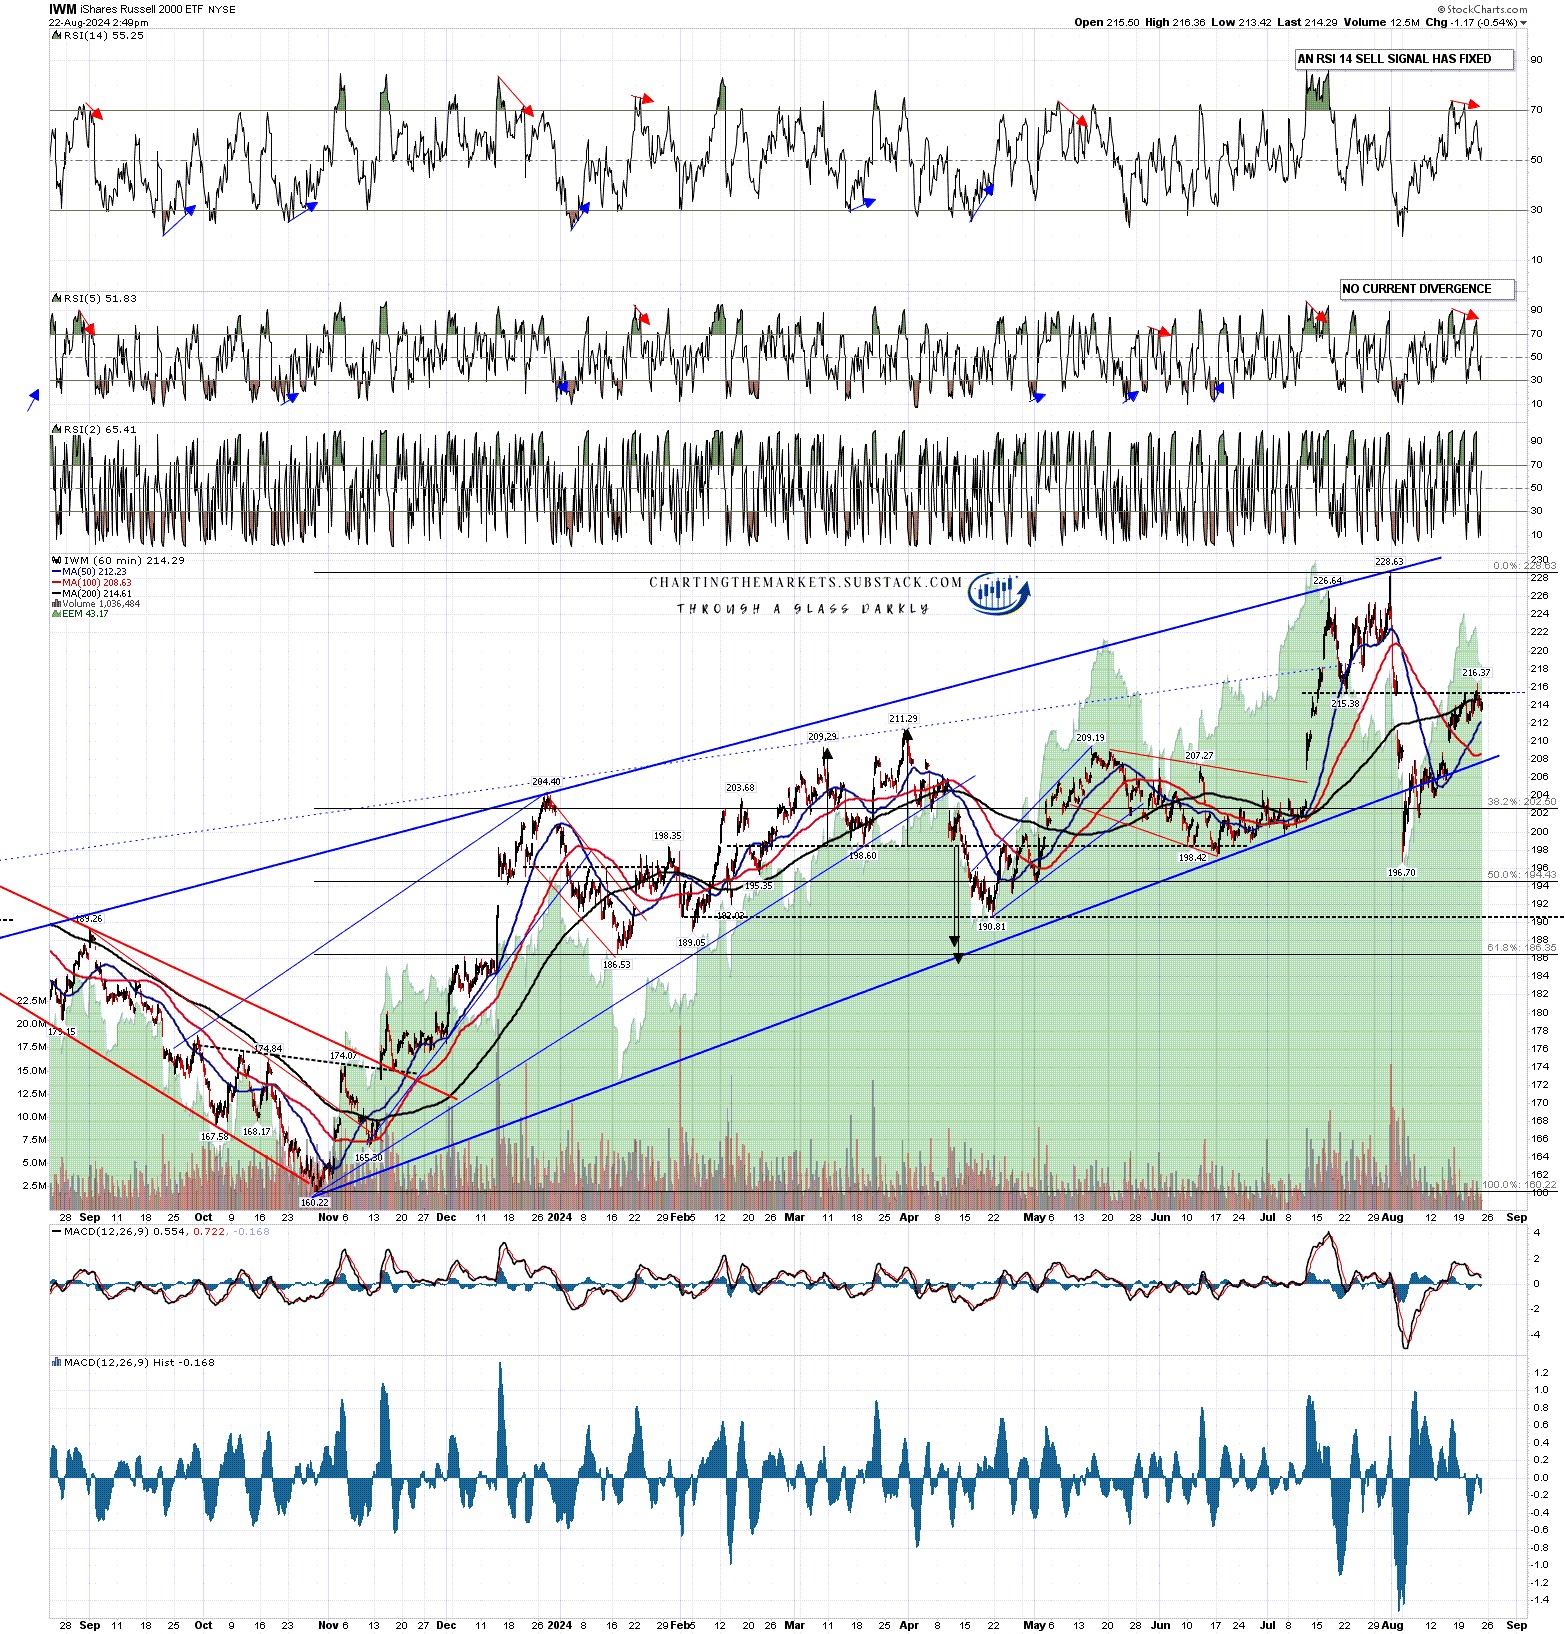
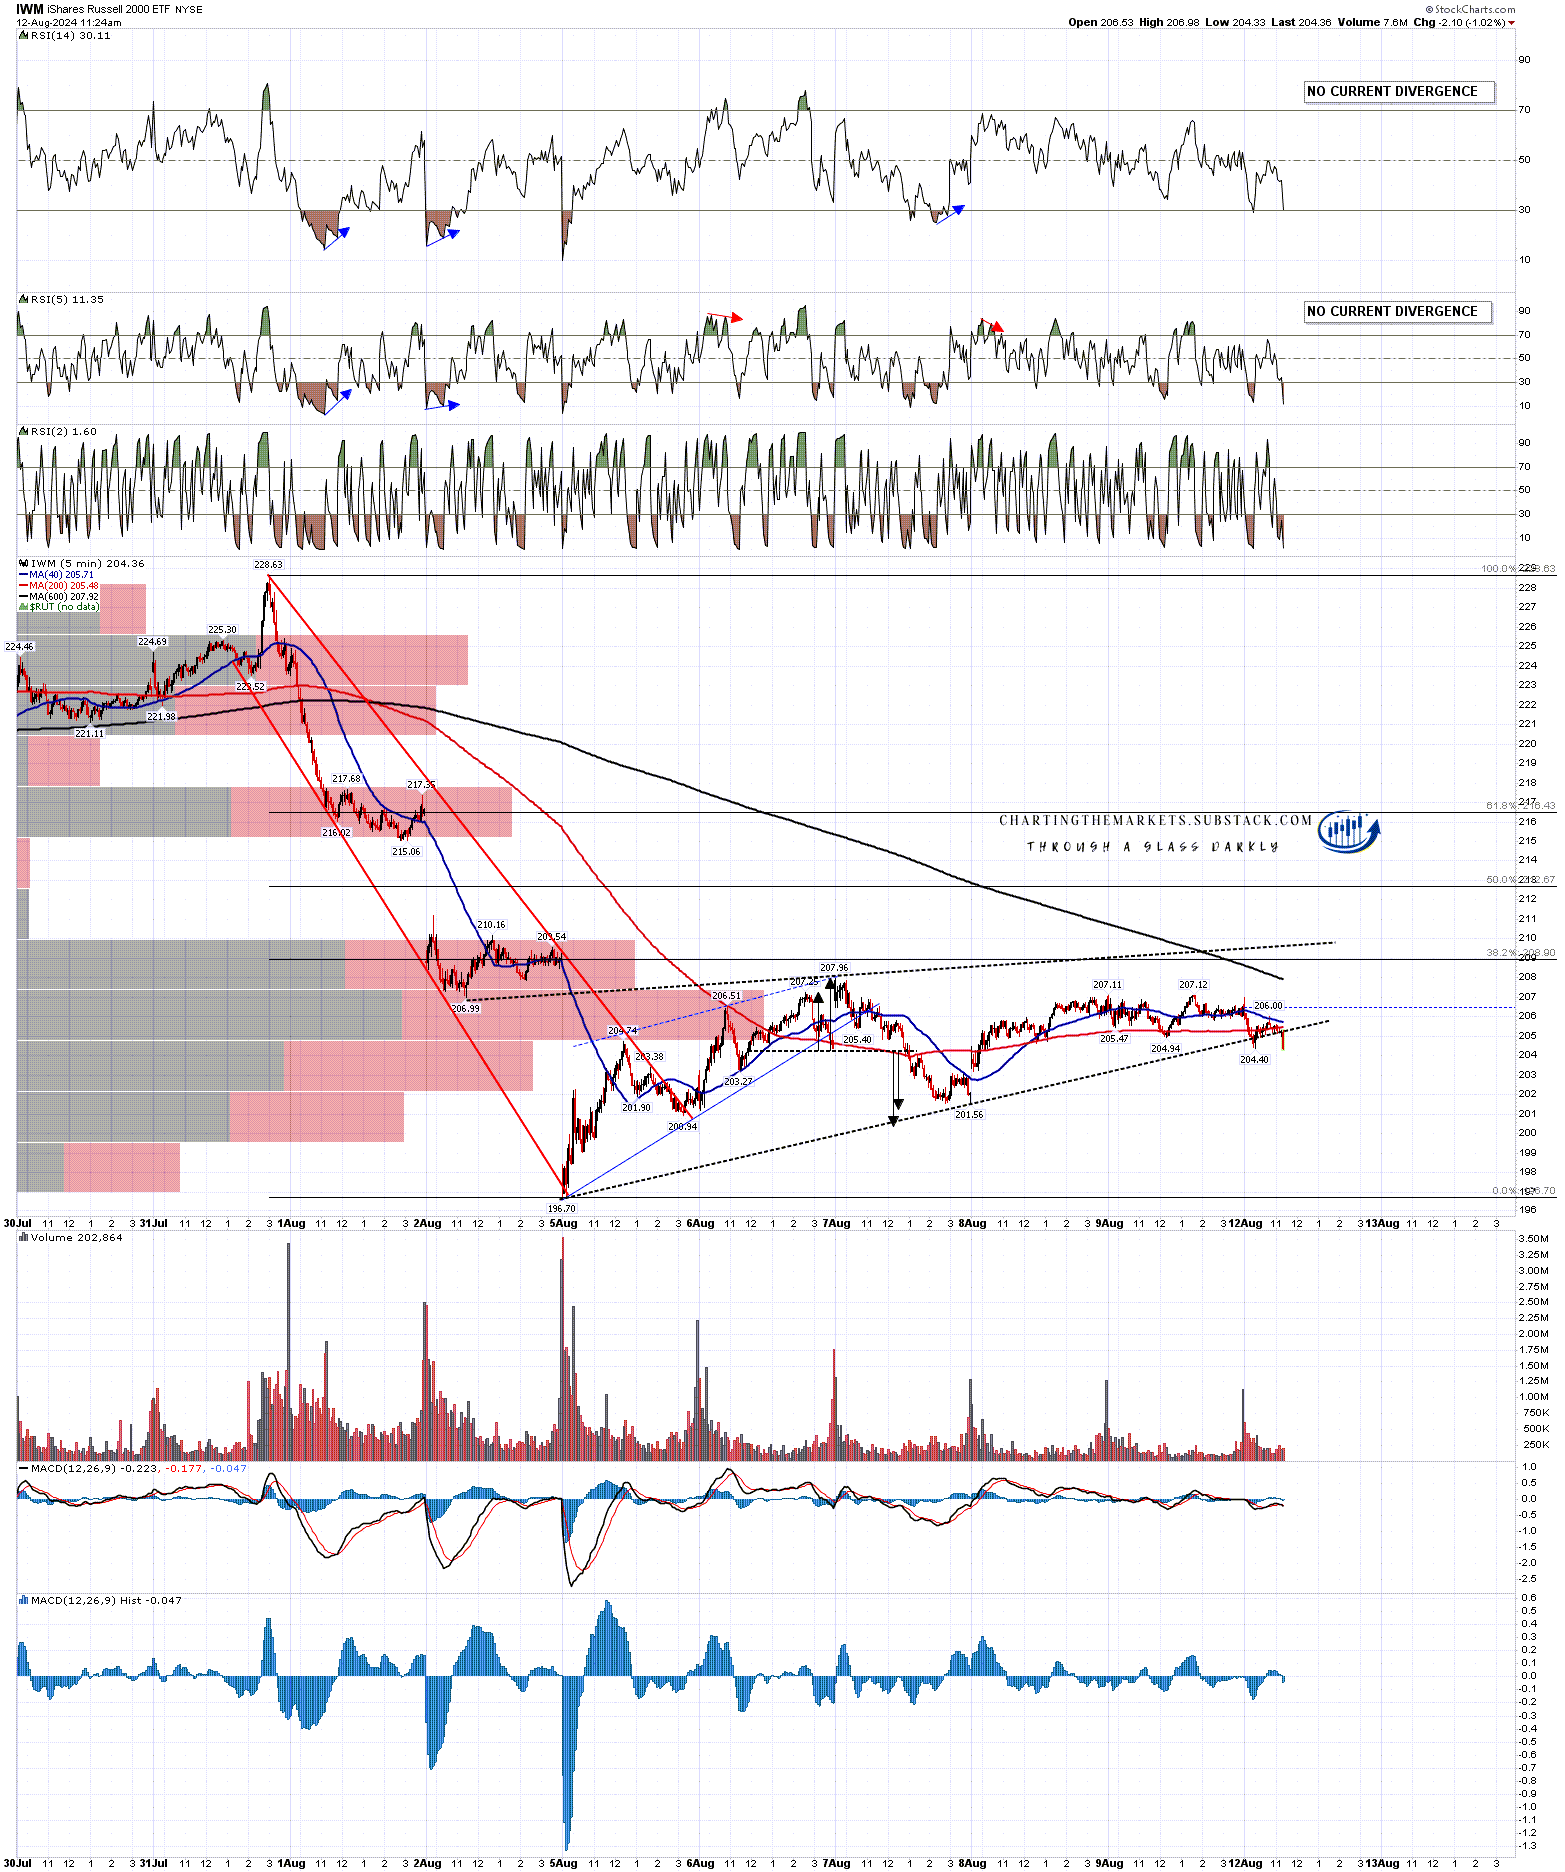
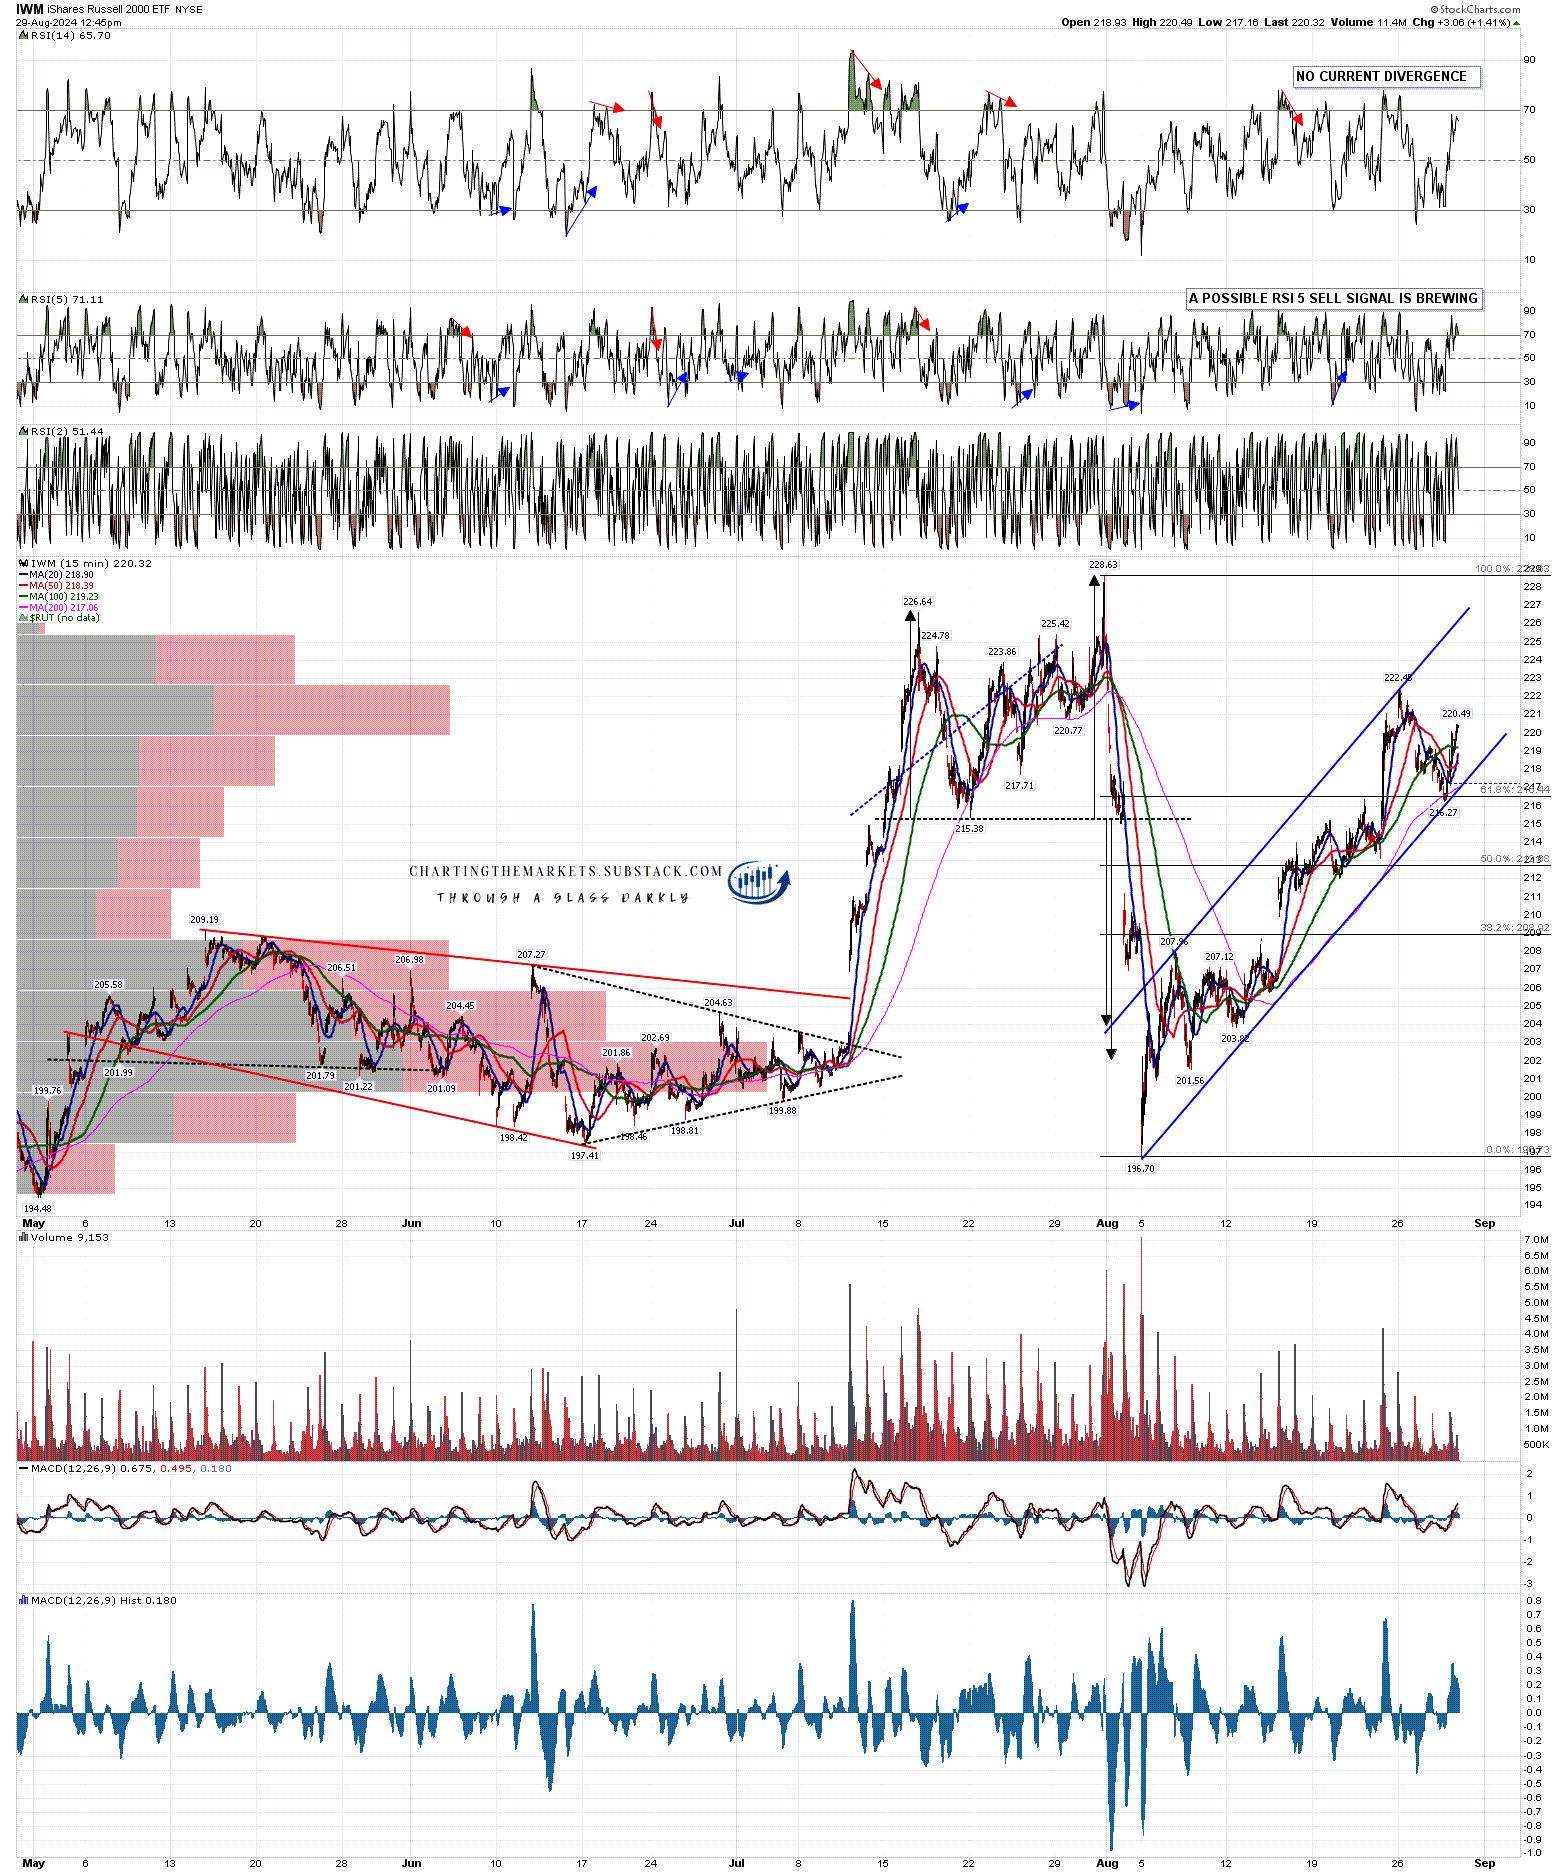
IWM has formed a high quality rising channel from the early August low, so on a full retest of the last high at 222.45 a possible daily RSI 5 sell signal will start brewing, and the next obvious target within the channel would be channel resistance, currently in the 226.5 area, and close to the retest of the 2024 high at 228.63. As channel resistance is rising rapidly, a retest of 228.63 could easily be done within that rising channel, and that retest would set up a possible third solid large double top setup on IWM.

IWM 15min chart:

Overall this is a decent setup for a significant high forming here, though ideally we would see all time high retests soon on SPX and IWM soon to strengthen that further.

Could we see a very sharp retracement into the presidential election? It wouldn’t be unprecedented at all. The elections in 2000 and 2008 took place in strong bear markets, and there was a long consolidation into the election in 2004, and sharp retracements into all of the the 2012 and 2016 and 2020 elections. That means that in the last 24 years at least, it would be unusual not to see a bearish election September. The best any election September has achieved in that time is a small gain, most of these have closed down. We’ll see.

If you like my analysis and would like to see more, please take a free subscription at my chartingthemarkets substack, where I publish these posts first and do a short premarket review every morning.

Monday 26 August 2024

Break Up On Crypto

All the new weekly pivots are on the daily charts posted below.

The last few days I have been watching the resistance at the daily middle band on all three of BTCUSD (Bitcoin), ETHUSD (Ethereum) and SOLUSD (Solana). An H&S pattern had formed and broken down on Solana, and another was still forming on Ethereum. If resistance at those daily middle band held then the setup was likely to break down further, into targets of 119 on Solana and 2,250 on Ethereum. On a sustained break up over those daily middle bands, and the failure of the H&S pattern on Solana on a break back up over the H&S right shoulder high at 152.17.

I posted an inflection point on Avalanche on my twitter on Wednesday last week on Avalanche, with a nice touch of an over falling wedge resistance and a well formed bear flag, and both broke up later that day. I did wonder then if that was a sign that the others would break up as well, and they all did on Thursday and Friday.

On Bitcoin there has been a clear and sustained break over the daily middle band, now at 60,325, then the 50dma, now at 61,925, with Bitcoin currently converting broken resistance at the 200dma, now at 63,420. Above there is an obvious target at overall bull flag resistance now in the 70,000 area.

BTCUSD daily chart:

On the hourly chart Bitcoin has made the smaller bull flag target at 62.7k and the rising support trendline is now in the 62,000 area.

BTCUSD 60min chart:

On Ethereum there has been another clear break over the daily middle band, now at 2,637, a retest of the prior short term high, and the obvious resistance above is at the 50dma, now at 2,972, and the 200dma, now at 3,255. On a sustained break above both the obvious next target would be at declining and possible bull flag resistance, now in the 3,850 area.

ETHUSD daily chart:

On the hourly chart the marginal higher high over 2780.36 still leaves a possible double top setup with double top support at 2,536.65. I’m not expecting this to deliver but I’ll be watching it until Ethereum kills the setup by going higher. In the short term an hourly RSI 14 sell signal has fixed but is already close to target.

ETHUSD 60min chart:

Solana broke strongly over the daily middle band, now at 148.32, the 200dma, now at 151.46, and the 50dma, now at 155.57, and is now at the daily upper band. Some consolidation may be needed here, but after that the obvious next target would be bull flag resistance, currently in the 191 area.

SOLUSD daily chart:

The Solana H&S that broke down a few days ago failed on the move back over the right shoulder high at 152.17, and that failure has a target at a retest of 163.66. That target hasn’t been reached yet and I’m expecting that retest soon.

SOLUSD 60min chart:

There is some bearish potential here short term, but the break last week from the inflection point was bullish, and those daily middle bands are now support. The overall patterns are bullish and as long as the daily middle bands hold as support, the short term outlook will remain bullish into likely retests of the all time high on Bitcoin, and retests of the 2024 highs on Ethereum and Solana at 4092.73 and 209.86 respectively.

If you like my Crypto analysis and would like to see more, please take a free subscription at my Crypto substack, where I publish these posts first and do a short premarket review every morning.

Thursday 22 August 2024

Everything's Eventual

Finally some signs of a genuine, can be seen with the naked eye, retracement on equity indices today. I was talking in this morning’s premarket video about the possibility of setting up some decent quality hourly RSI 14 sell signals on SPX and NDX for the first time since the all time highs were made and they set up and fixed this morning into the decline that we have been watching today.

I have been muttering that without retracements there are no chart patterns, and this delivers a shot at finally seeing some of those form, and also a shot at setting up decent possible negative divergences on the daily RSI 14 or RSI 5 charts, again for the first time since the all time highs were made.

One interesting chart I look at most days and that is worth showing is the daily $SPXADP chart, where a hit of the 30 level marked with a line tends to be a decent indicator that at least a retracement is close, and that was signalling this one, though in fairness that has been the case since Monday.

SPXADP daily chart:

I was giving the obvious first target for any retracement at the monthly pivot level, at 5528 on SPX and 5570. At the time of writing the LOD is at 5563, and with plenty of room left in the hourly sell signals here, I think that has a decent chance of being hit:

SPX daily BBs chart:

In terms of those hourly sell signals I have a rare show of unanimity on the US index charts that I mainly watch, with full hourly RSI 14 sell signals fixed this morning on SPX, NDX, and IWM, and a weak one on Dow. These have been delivering nicely so far and none have yet made target.

On SPX both RSI 14 and RSI 5 sell signals fixed on the hourly chart this morning, and the RSI 5 sell signal has reached target. SPX is close to a test of the first decent hourly support at the 50 hour MA, currently at 5554, and there is a strong support zone below that in the 5470-5500 area, supported by the 50dma currently at 5479.

SPX 60min chart:

On NDX both RSI 14 and RSI 5 sell signals fixed on the hourly chart this morning, and the RSI 5 sell signal has reached target. NDX is pausing at a significant resistance zone just under 20,000, I’m watching the test of the 50dma, tested at the low today, and below that there is a possible breakaway gap in the 19,100-225 area that I’m watching, supported by the 200dma currently at 19,181.

NDX 60min chart:

On IWM both RSI 14 and RSI 5 sell signals fixed on the hourly chart yesterday afternoon, and the RSI 5 sell signal has reached target. I am mainly watching support at the 50 hour MA, and the daily middle band, both currently in the 212 area.

IWM 60min chart:

On IWM both a weak RSI 14 and a full RSI 5 sell signal fixed on the hourly chart yesterday afternoon, and the RSI 5 sell signal has reached target. I am watching the 50 hour MA now at 40,584, and the possible breakaway gap at 40,050 to 40,300, supported by the daily middle band now at 40,094.

We’ll see how far these retracements, but this is well overdue, and a decent retracement here will make it far easier to discern what may be coming next.

INDU 60min chart:

I’ve been saying all week in my premarket videos that if we see all time high retests without any meaningful retracement to form patterns, then these high retests would be unlikely to be the second highs of possible large double top patterns. I’m still doubtful about that, but today’s retracement improves the chances of getting a discernible pattern before we see those all time high retests which, on SPX and Dow particularly, will likely be seen in the next two or three weeks at most.

I’ve been setting up my new base at Substack over the last couple of weeks and I have set up three substacks to cover different areas of my work. These are as follows:

Equity indices & futures with a premarket webinar every morning. Weekly & monthly pivots posted every weekend. My main base for writing posts: -

Charting The Markets Substack

My Charting Substack

By Springheel Jack

Crypto posts, charts & a premarket webinar every day. Weekly & monthly pivots posted every Monday: -

CTM Crypto Substack

Chart The Markets Crypto Substack

By Springheel Jack

Bigger picture on equity indices, bonds, currency pairs & commodities. Two webinars a week, all the supporting charts on Sundays, and regular posts:

CTM The Bigger Picture

Classical chartist. The aim of the technical analyst is to identify beforehand what will seem obvious afterwards.

These are all the three I will be setting up for now. There will be plenty of free content across them & all are welcome.

Wednesday 21 August 2024

Crypto Still In The Inflection Point

Last week I was writing about the inflection point that Crypto had reached short term, and they are still in that same inflection point, with a decision really needed in the next day or two if Crypto are going down any further, so a couple of days more uncertainty will considerably increase the odds of a break up.

The overhead resistance is, mostly, at the daily middle bands. I say mostly because BTCUSD (Bitcoin) has already broken back above it on Monday and tested the 50dma, though it failed there and closed back below the daily middle band yesterday and so failed to confirm Monday’s break above.

BTCUSD daily chart:

On the hourly chart the setup looks like a small bull flag that has broken up with a target in the 62.7k area, but in the absence of a sustained break over the daily middle band, Bitcoin may go a bit lower first.

BTUSD 60min chart:

On the daily chart ETHUSD (Ethereum) is so far failing at the daily middle band and ….

ETHUSD daily chart:

…. on the hourly chart a very attractive H&S setup has formed that on a sustained break below the 2520 area would look for the 2255 area. The right shoulder is now significantly longer than the left and if this is going to break down as an obvious H&S I’d be expecting that to happen today or tomorrow. After that the odds of at least a short term high retest on Ethereum are considerably higher.

ETHUSD 60min chart:

SOLUSD (Solana) has also clearly been failing at the daily middle band so far and on Solana there is also ….

SOLUSD daily chart:

…. a clear H&S that has already broken down with a target in the 119 area. Solana has mostly been trading a 138 to 149 range since then, but until Solana can fail the H&S with a move that exceeds the right shoulder high at 152.17, the 119 target is very much still in play.

SOLUSD 60min chart:

If you are enjoying my crypto posts please make sure you subscribe (for free) at my Crypto SubStack below:

I'm also to be found at Arion Partners, though as a student rather than as a teacher. I've been charting Cryptos for some years now, but am learning to trade and invest in them directly, and Arion Partners are my guide around a space that might reasonably be compared to the Wild West in one of their rougher years. 

Friday 16 August 2024

Crime Scene Bear

There have been a couple of very decent looking short setups here on SPX and NDX this week, and both times the markets just ripped up through them. The bear flags formed and broke up, the SPX, NDX and INDU broke back up over their daily middle bands and are now testing their monthly pivots, while multiple hourly sell signals that had fixed at these obvious resistance levels failed, including two each on ES and NQ. Altogether it was an ugly week for the bears.

From Propaganda-Panda on DeviantArt:

So what now? Well I had mentioned that the very nice support trendline established on SPX at the retracement low might well be the support trendline on a bigger picture bull flag and, if so, that bull flag has now broken up with a target at the retest of the all time high at 5669.67. I’m expecting to see a retest of that ATH within a few days, though that might of course be the second high of an even bigger picture double top.

Are there any obvious alternatives? Yes, we might see a lower low from this area while an expanded double top formed, but I think that is the lower probability option.

SPX hourly chart:

Three of the four main US equity indices I follow look very similar to each other. SPX broke back over the daily middle band and is now testing the monthly pivot, already most of the way back to a retest of the all time high.

SPX daily BBs chart:

Dow also broke back over the daily middle band and is now testing the monthly pivot, already most of the way back to a retest of the all time high.

INDU daily BBs chart:

NDX also broke back over the daily middle band and is now testing the monthly pivot, already over 61.8% of the way back to a retest of the all time high.

NDX daily BBs chart:

Russell 2000 / IWM has been the laggard this time, with a retracement slightly over 50% of the decline so far and currently testing resistance at the daily middle band for a second day.

IWM daily BBs chart:

SPX and Dow have been leading the way up from the low, with NDX somewhat behind and IWM lagging at the rear, so this very much isn’t a tech led move.

IWM still looks like a bear flag and is testing the first big resistance at the daily middle band. I’m not reading too much into that but it is one data point to support a possible hard fail here to form expanded bull flags but, if I owned it, I wouldn’t be betting the crime scene bear image above on that happening. Better odds that we see new all time highs directly from here and see whether resistance is found there.

In the short term I was looking at new hourly sell signals across the board this morning on ES, NQ, RTY, YM, Dax and ESTX50, and with SPX, NDX and Dow testing their monthly pivots, this would be a good place to see some retracement, or at least some consolidation, before that run at the all time time retests on those three indices. We’ll see how that goes.

Everyone have a great weekend :-)

I’ve been setting up my new base at Substack over the last few days and I have set up three substacks to cover different areas of my work. These are as follows:

Equity indices & futures with a premarket webinar every morning. Weekly & monthly pivots posted every weekend. My main base for writing posts: -

Charting The Markets Substack

My Charting Substack

By Springheel Jack

Crypto posts, charts & a premarket webinar every day. Weekly & monthly pivots posted every Monday: -

CTM Crypto Substack

Chart The Markets Crypto Substack

By Springheel Jack

Bigger picture on equity indices, bonds, currency pairs & commodities. Two webinars a week, all the supporting charts on Sundays, and regular posts:

CTM The Bigger Picture

Classical chartist. The aim of the technical analyst is to identify beforehand what will seem obvious afterwards.

These are all the three I will be setting up for now. There will be plenty of free content across them & all are welcome.

Thursday 15 August 2024

Either/Or Setup on Crypto Here

In the short term there are very clear bull and bear scenarios here on Crypto, clearest on SOLUSD (Solana), though on the bigger picture these are still likely bull flags forming.

In terms of that larger picture, resistance is still at the daily middle bands, and on BTCUSD (Bitcoin) that is currently in the 61,246 area. A sustained break above that likely signals that the move to retest the all time high at 73.8k is in progress.

BTCUSD daily chart:

On the 15min chart on Bitcoin a possible shorter term bull flag triangle is forming. The short term downside scenario here would be that this flag expands into a wedge or channel, with an ideal downside target in the 56,500 to 57,000 area.

BTCUSD 15min chart:

On ETHUSD (Etherum) the overall bull flag setup is messier, but the daily middle band is also clear resistance, currently in the 2827 area.

ETHUSD daily chart:

On the 15min chart Ethereum has formed and broken down slightly from a small double top with a target in the 2450-70 area. If reached there is a possible asymmetric double top or H&S neckline support in the3 2500 area. A break below would open a target in the 2250-2300 area.

ETHUSD 15min chart:

On Solana the overall bull flag setup is very nice, and daily middle band resistance is currently in the 156 area. A sustained break above opens the next target at bull flag resistance in the 192.5 area, and a further break above that would have a target at a retest of the 2024 high at 209.86.

SOLUSD daily chart:

The 15min chart on Solana has a clear either/or setup here, and one of these two setups is likely to play out to target within days.

The bear scenario is the possible H&S that I’ve been looking at in my premarket webinars all week. A sustained break below 141 would look for the 119 area, and open a possible retest of the August low at 110.02. If this H&S is going to break down, I would expect that break today or tomorrow.

The bull setup is a small double bottom that on a sustained break back above 152.17 would have a target in the 162.25 area, effectively however a retest of the August high at 163.66.

SOLUSD 15min chart:

I have set up three substacks for my publishing from now on, and you can find all of my work, charts, posts & webinars/videos there. Those substacks are as follows: 

https://chartingthemarkets.substack.com/ - Most of these posts & premarket video & charts.

https://ctmthebiggerpicture.substack.com - Bigger picture posts and weekend webinar & charts, postmarket videos.

https://ctmcrypto.substack.com - My Crypto posts, premarket webinars and charts.

I'm also to be found at Arion Partners, though as a student rather than as a teacher. I've been charting Cryptos for some years now, but am learning to trade and invest in them directly, and Arion Partners are my guide around a space that might reasonably be comparable to the Wild West in one of their rougher years. 


Monday 12 August 2024

Bull Flags on Crypto ....... Unless

A decent looking low on crypto was made a few days ago. On the bigger picture these are likely bull flags forming on BTCUSD (Bitcoin), and SOLUSD (Solana), and probably on ETHUSD (Ethereum) as well, though the setup is muddier there. All three are still below their daily middle bands though and, while that remains the case, we could still see lower lows before they likely go higher.

SOLUSD daily chart:

So how are they looking short term? Well Bitcoin had a decent looking retracement over the last couple of days that looks like a small bull flag forming.

BTCUSD 15min chart:

Ethereum has also retraced and also looks like a small bull flag, with the best looking bull flag setup of the three.

ETHUSD 15min chart:

On Solana though, this looks more interesting. While this might also be a small bull flag forming, Solana came down and tested a possible H&S neckline, and may be forming the right shoulder on an H&S that would have an ideal right shoulder high in the 155 area.

If this H&S were to complete and break down then the H&S target would be in the 119 area, opening a possible retest of the low at 110. Could that be the second low of a double bottom? Just about, though it would be oversized.

SOLUSD 15min chart:

There’s no strong reason to look for a low retest on Solana here, with a better case to be made for low retests on both Bitcoin and Ethereum, but if we were to see that possible H&S on Solana deliver then we might well see those low retests on Bitcoin and Ethereum as well of course. The inflection point trading range is 142-156. A sustained break either way likely settles the direction of the next move.

My friend Matt has a company helping people navigate their way through the cryptosphere. His website is now up and running and worth checking out. I’m not a part of that operation but I am a member and it is an excellent service.

Bear Flag Trio

On Thursday last week I wrote a post looking at the possible four larger bear flags that could form on SPX, NDX, Dow & IWM after the sharp decline on Wednesday afternoon. Of those four, there are three decent looking larger bear flags that have since formed, and this morning we are watching the inflection point where these flags may break down into retests of the retracement lows made on Monday last week.

On SPX the obvious larger flag resistance trendline I drew on Thursday was hit perfectly on Friday and overthrown slightly today.

SPX 5min chart:

On NDX the possible larger bear flag resistance I drew on Thursday was hit perfectly this morning.

NDX 5min chart:

On Dow the trendline I drew on Thursday was hit, but an alternate to that trendline is a better fit, and that has been hit and overthrown.

INDU 5min chart:

The one that didn’t hit was IWM, though that could be developing a triangle, and it still of course has a target at the lows from the original bear flag that broke down on Wednesday.

IWM 5min chart:

So there we have it, three out of the four larger bear flags that I proposed on Thursday morning have formed, and we will see now whether these break down into low retests. It is a decent setup and, as ever, the market will decide.

There are some supporting RSI sell signals on the futures charts, with weak 60min sell signals fixed on ES, NQ and YM. We’ll see how that goes.

ES Sep Daily:

I’ve been setting up my new base at Substack over the last few days and I have set up three substacks to cover different areas of my work. These are as follows:

Equity indices & futures with a premarket webinar every morning. Weekly & monthly pivots posted every weekend. My main base for writing posts: -

Crypto posts, charts & a premarket webinar every day. Weekly & monthly pivots posted every Monday: -

Bigger picture on equity indices, bonds, currency pairs & commodities. Two webinars a week, all the supporting charts on Sundays, and regular posts:

These are all the three I will be setting up for now. There will be plenty of free content across them & all are welcome.

Thursday 8 August 2024

Winding Roads

My post yesterday was close to the rally high so far and all the bear flags I showed broke down shortly afterwards and continued down the rest of the day. 

Now on a break down from a bear flag the target is the retest of the prior low, but there are other options, notably when the flag that has broken down is just the first leg of a larger bear flag that is still forming, so I’ll talk about that today. 

On SPX there was a strong break of the bear flag yesterday, 5min RSI 14 buy signals fixed near the lows on all of SPX, NDX, IWM and Dow, and played out this morning. A weak 5min RSI 14 sell signal has now fixed on SPX and it may be that the indices will turn back down here into the retest of Monday’s lows. 

There is the option here though that the bear flag that broke down was just the A wave of an ABC rally bear flag and, if so, I have drawn in the obvious target trendline for a larger bear flag wedge, currently in the 5343 area very close to the 50% retracement of the decline. If SPX makes a new rally high from here then that is a likely area that I will be watching. 

SPX 5min chart:

On the NDX 5min chart there is an equivalent scenario with an ideal trendline target on a possible larger bear flag wedge pattern currently in the 18,550 area, slightly over the 50% retracement of the decline. 

NDX 5min chart:

On IWM and Dow the rallies have been weaker, but there are equivalent setups on both with trendline targets close to the 38.2% fib retracements of the decline. On IWM that target is in the 208.75 area. 

IWM 5min chart:

On Dow that target is currently in the 39,550 area. 

INDU 5min chart:

Obviously if the larger flags form there is the caveat that I mentioned yesterday that 30% of the time bear flags break up rather than down, and the flag itself can be the reversal pattern, but that is of course the lower probability option. 

My last chart of the day is to show a possible bigger picture bull flag forming on the SPX chart. I’ve been looking for obvious target trendlines and levels if equity indices go lower and came across this very interesting possible bull flag wedge support trendline on SPX. I’ve show that as a red dashed trendline running from the late March high, through the June low, into Monday’s low, and this would in my view be a classic bull flag wedge support trendline, so I’m considering it seriously. 

If we do see a retest of Monday’s low, and that holds, then that may make the second low of a double bottom and the bigger target would be the flag wedge resistance currently in the 5500 area and, on a break above that, a possible double bottom target likely in the 5580 - 5650 range. A hard break of this support trendline would open lower targets. 

SPX daily BBs chart:

You can now find my work at chartingthemarkets.substack.com and on my twitter (shjcharts). I’m still configuring my substacks for the rest of the week and while I’m doing that my premarket webinars are free to all, with the links posted shortly before on my twitter). I’m planning to get into a routine of doing a premarket webinar every day on cryptos at 8.45am EST, with the first one done this morning, and a premarket webinar every day on equity indices and futures at 9.00am EST.