
In the short term there are very clear bull and bear scenarios here on Crypto, clearest on SOLUSD (Solana), though on the bigger picture these are still likely bull flags forming.
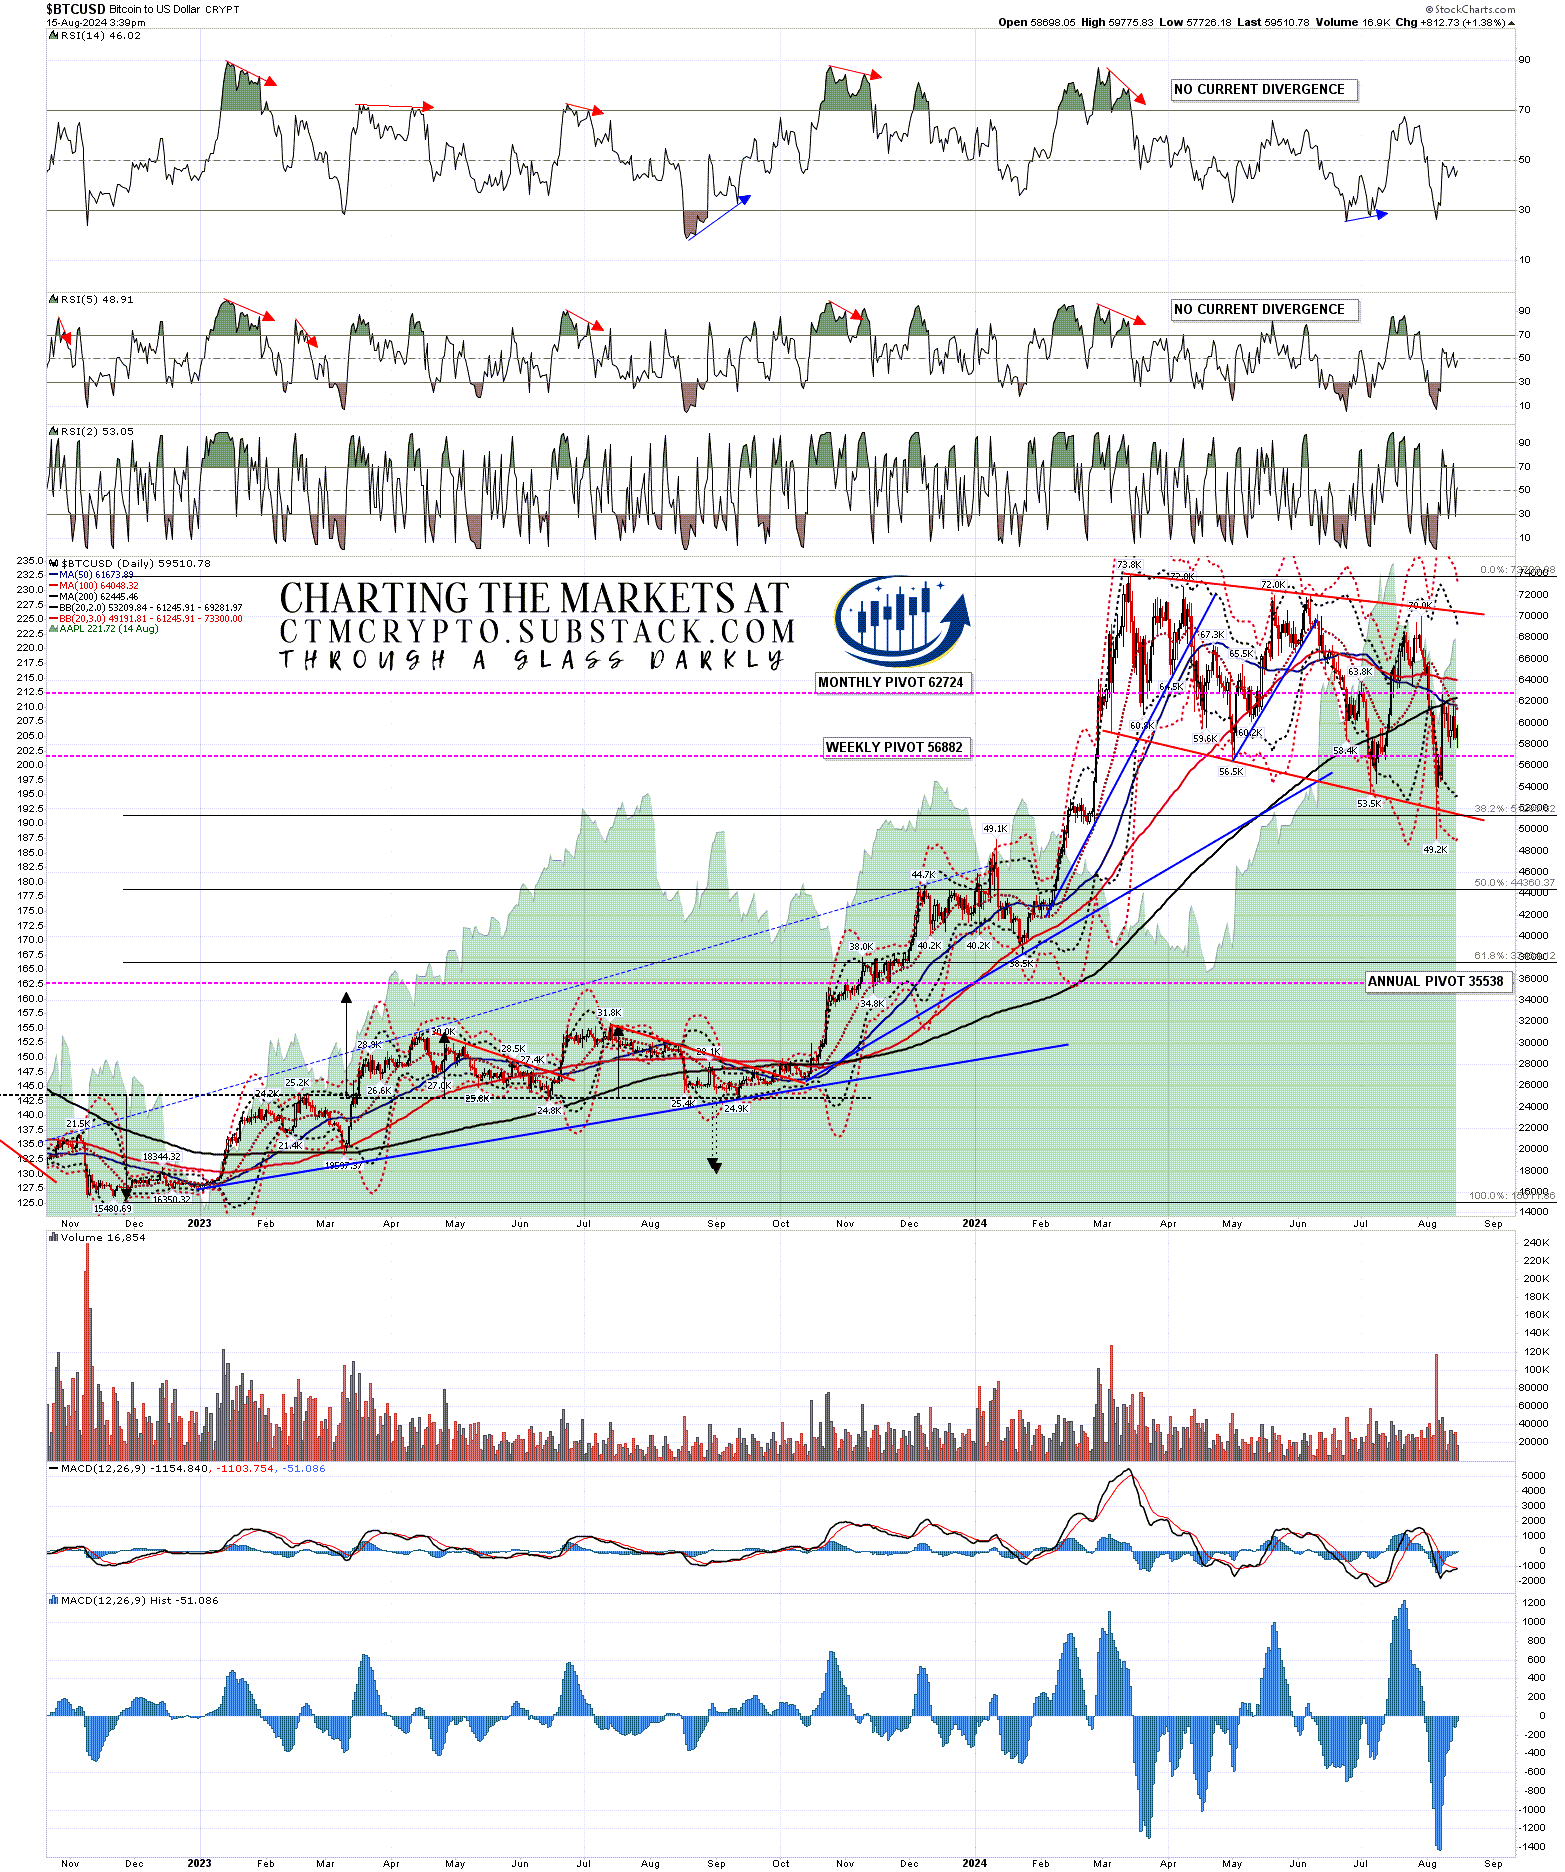
In terms of that larger picture, resistance is still at the daily middle bands, and on BTCUSD (Bitcoin) that is currently in the 61,246 area. A sustained break above that likely signals that the move to retest the all time high at 73.8k is in progress.
BTCUSD daily chart:
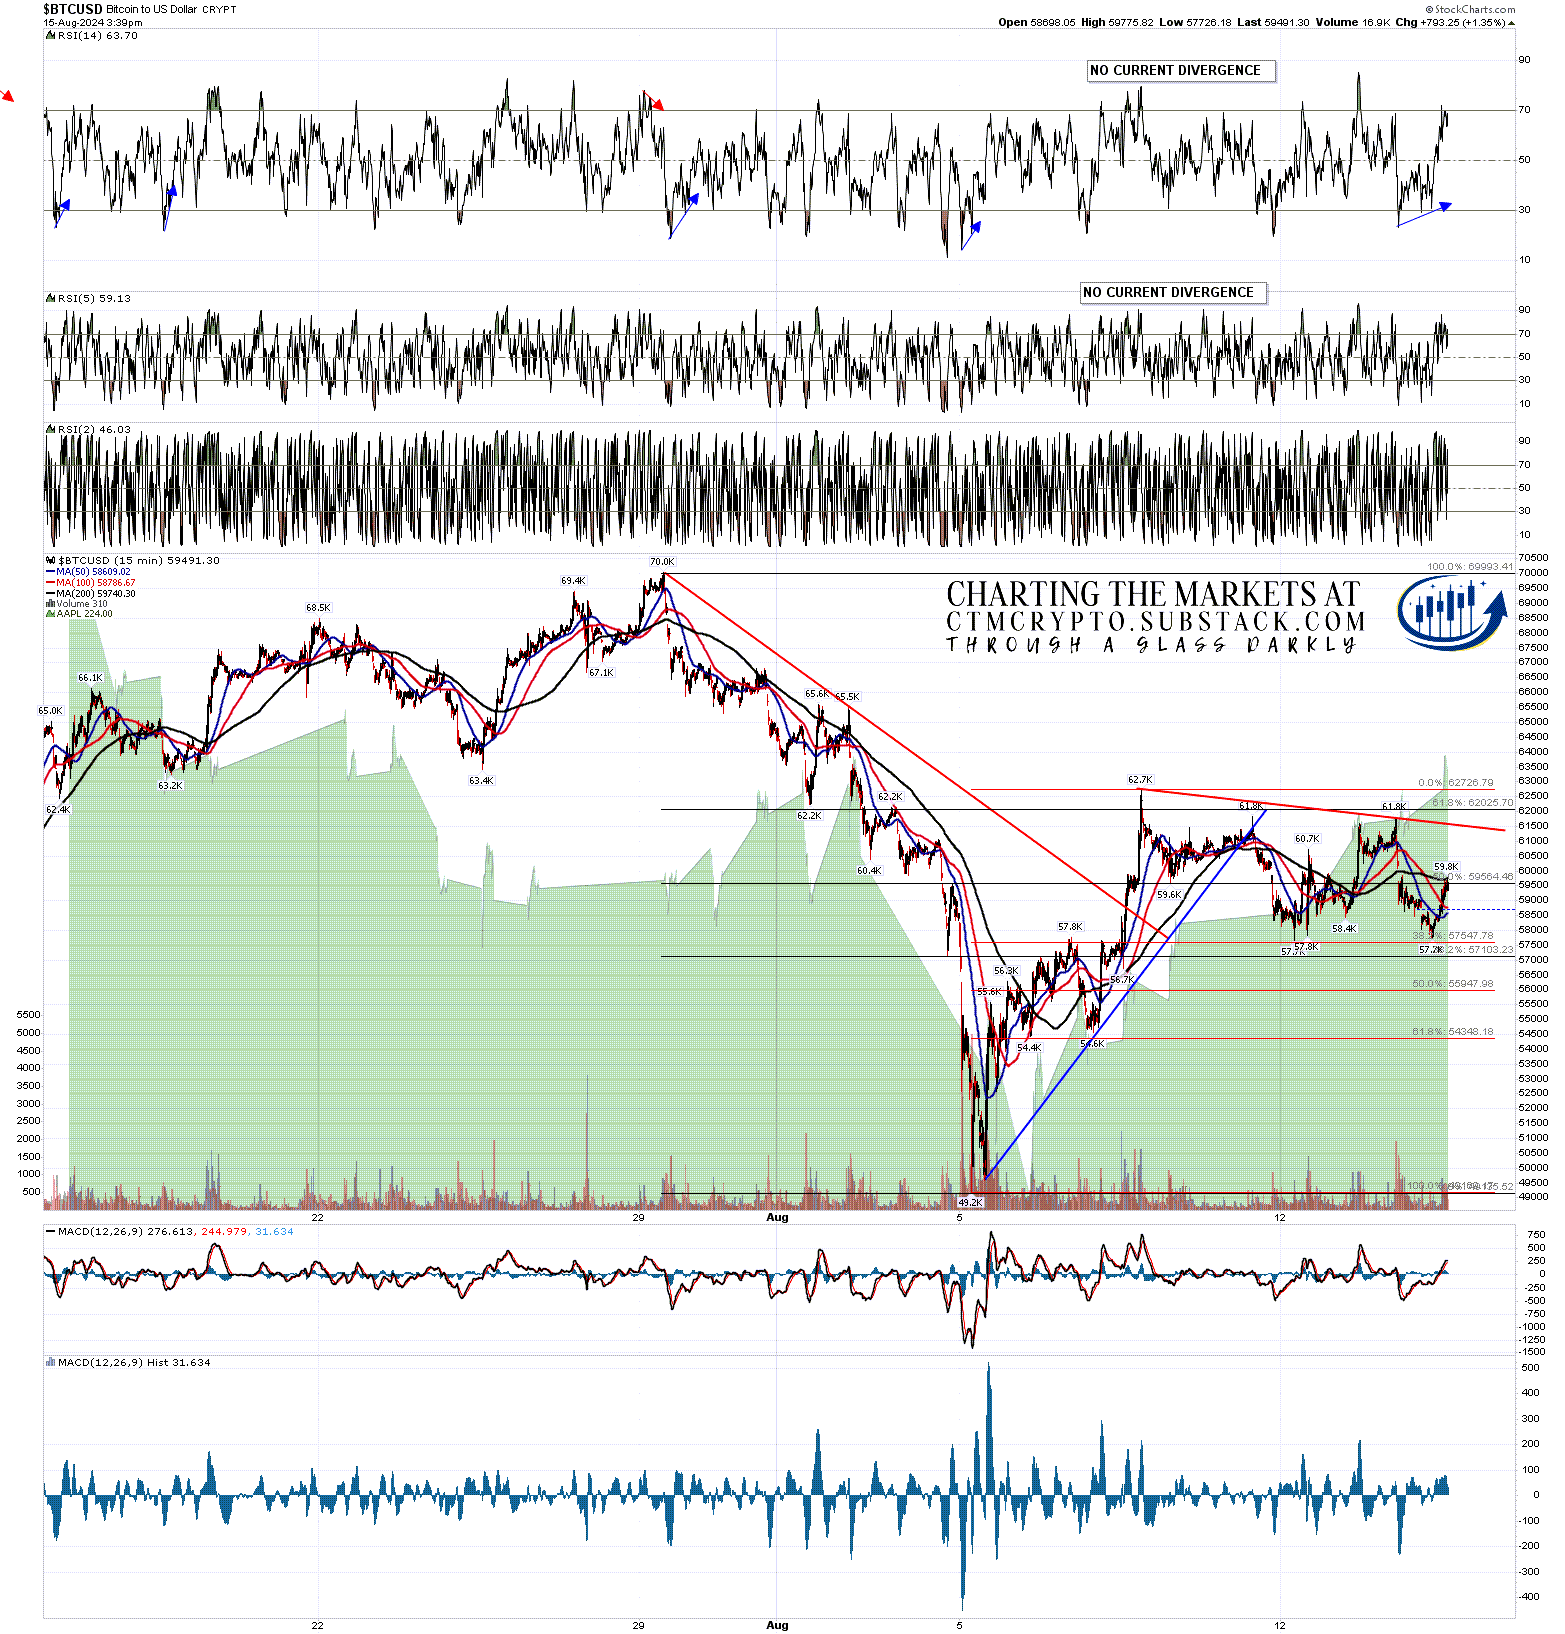
On the 15min chart on Bitcoin a possible shorter term bull flag triangle is forming. The short term downside scenario here would be that this flag expands into a wedge or channel, with an ideal downside target in the 56,500 to 57,000 area.
BTCUSD 15min chart:
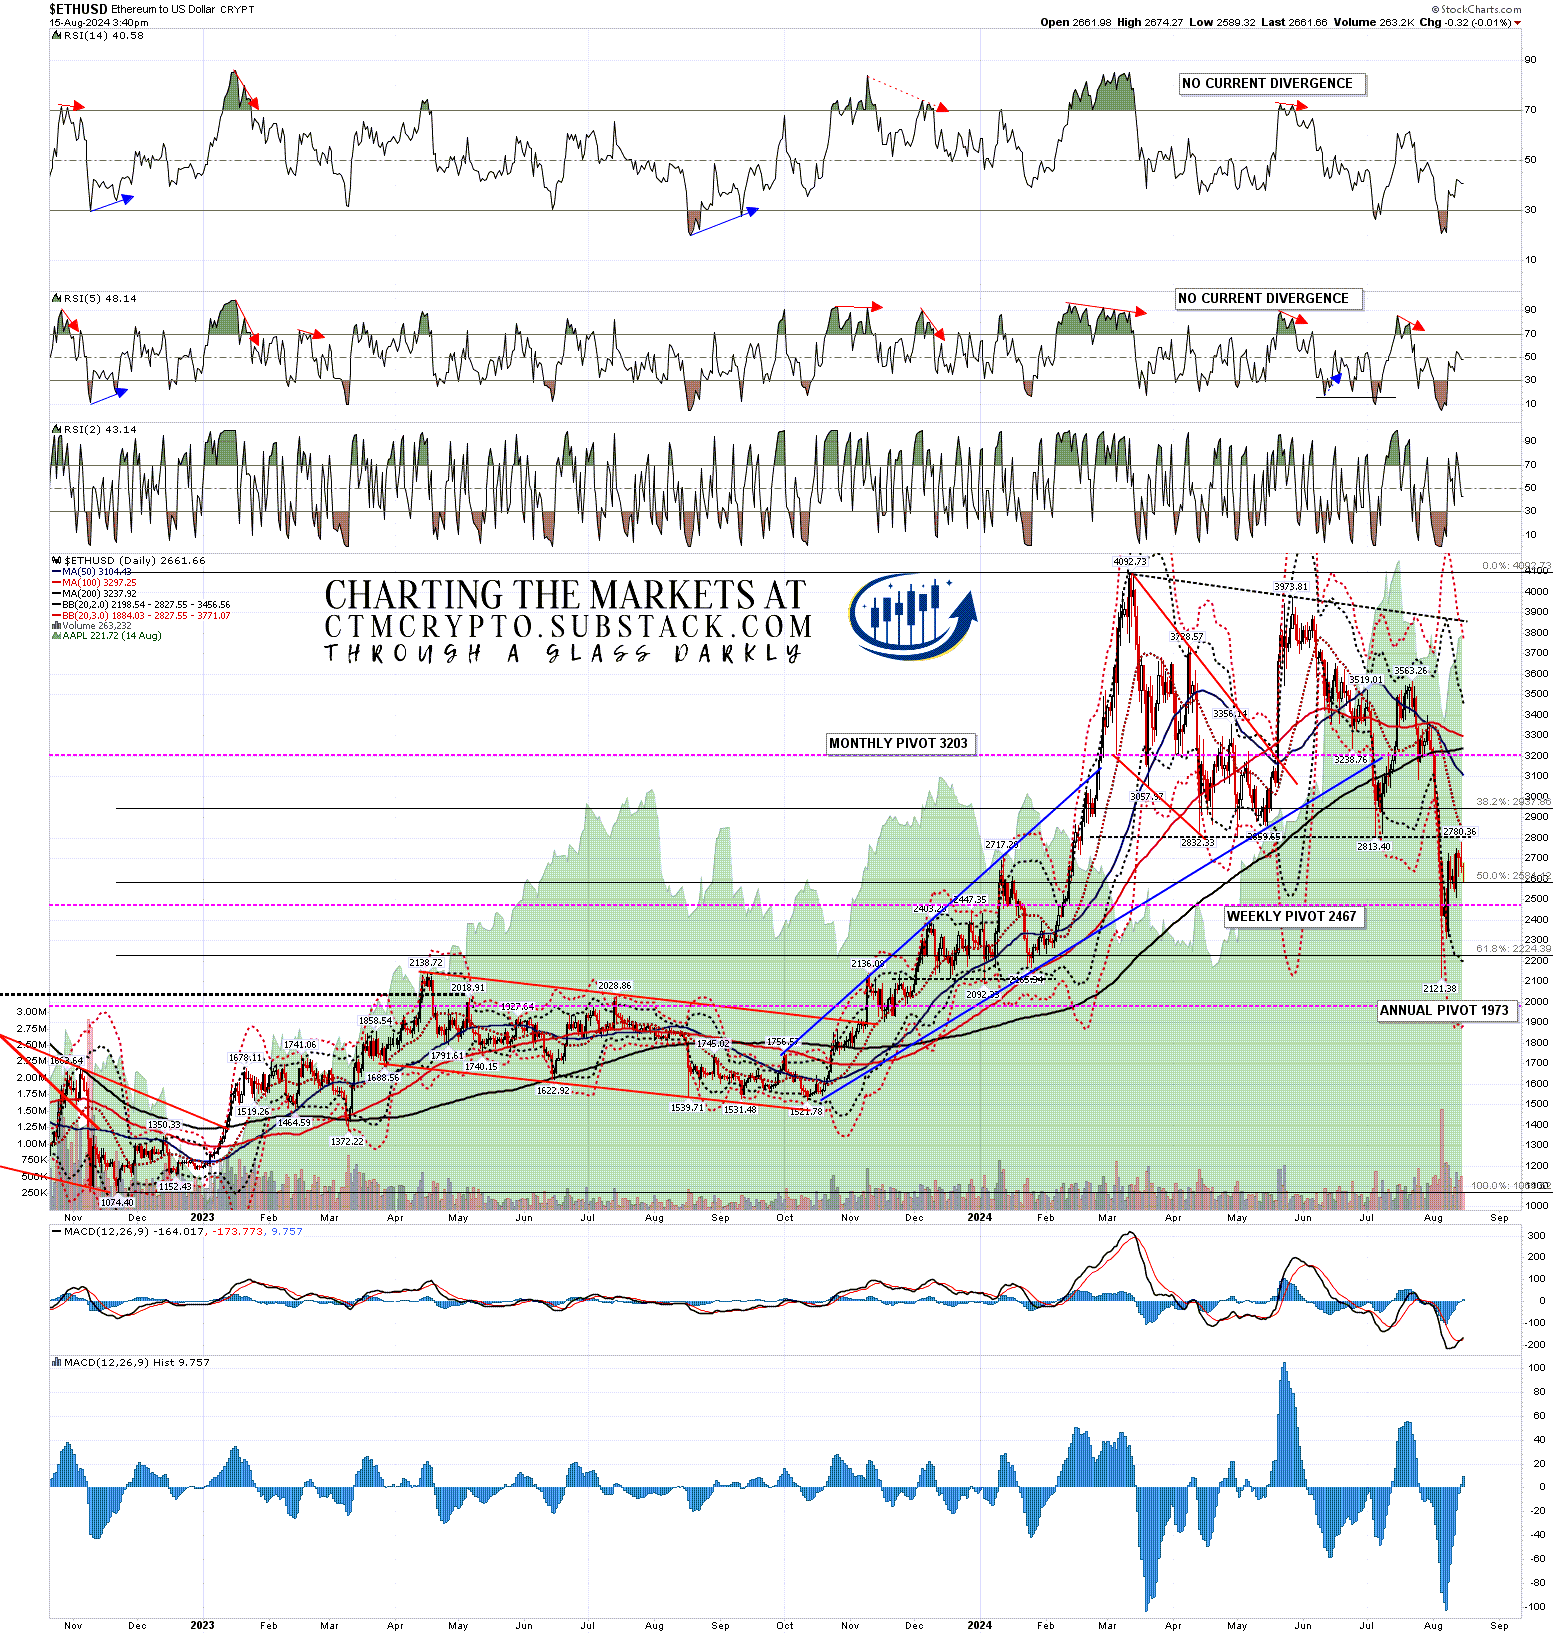
On ETHUSD (Etherum) the overall bull flag setup is messier, but the daily middle band is also clear resistance, currently in the 2827 area.
ETHUSD daily chart:
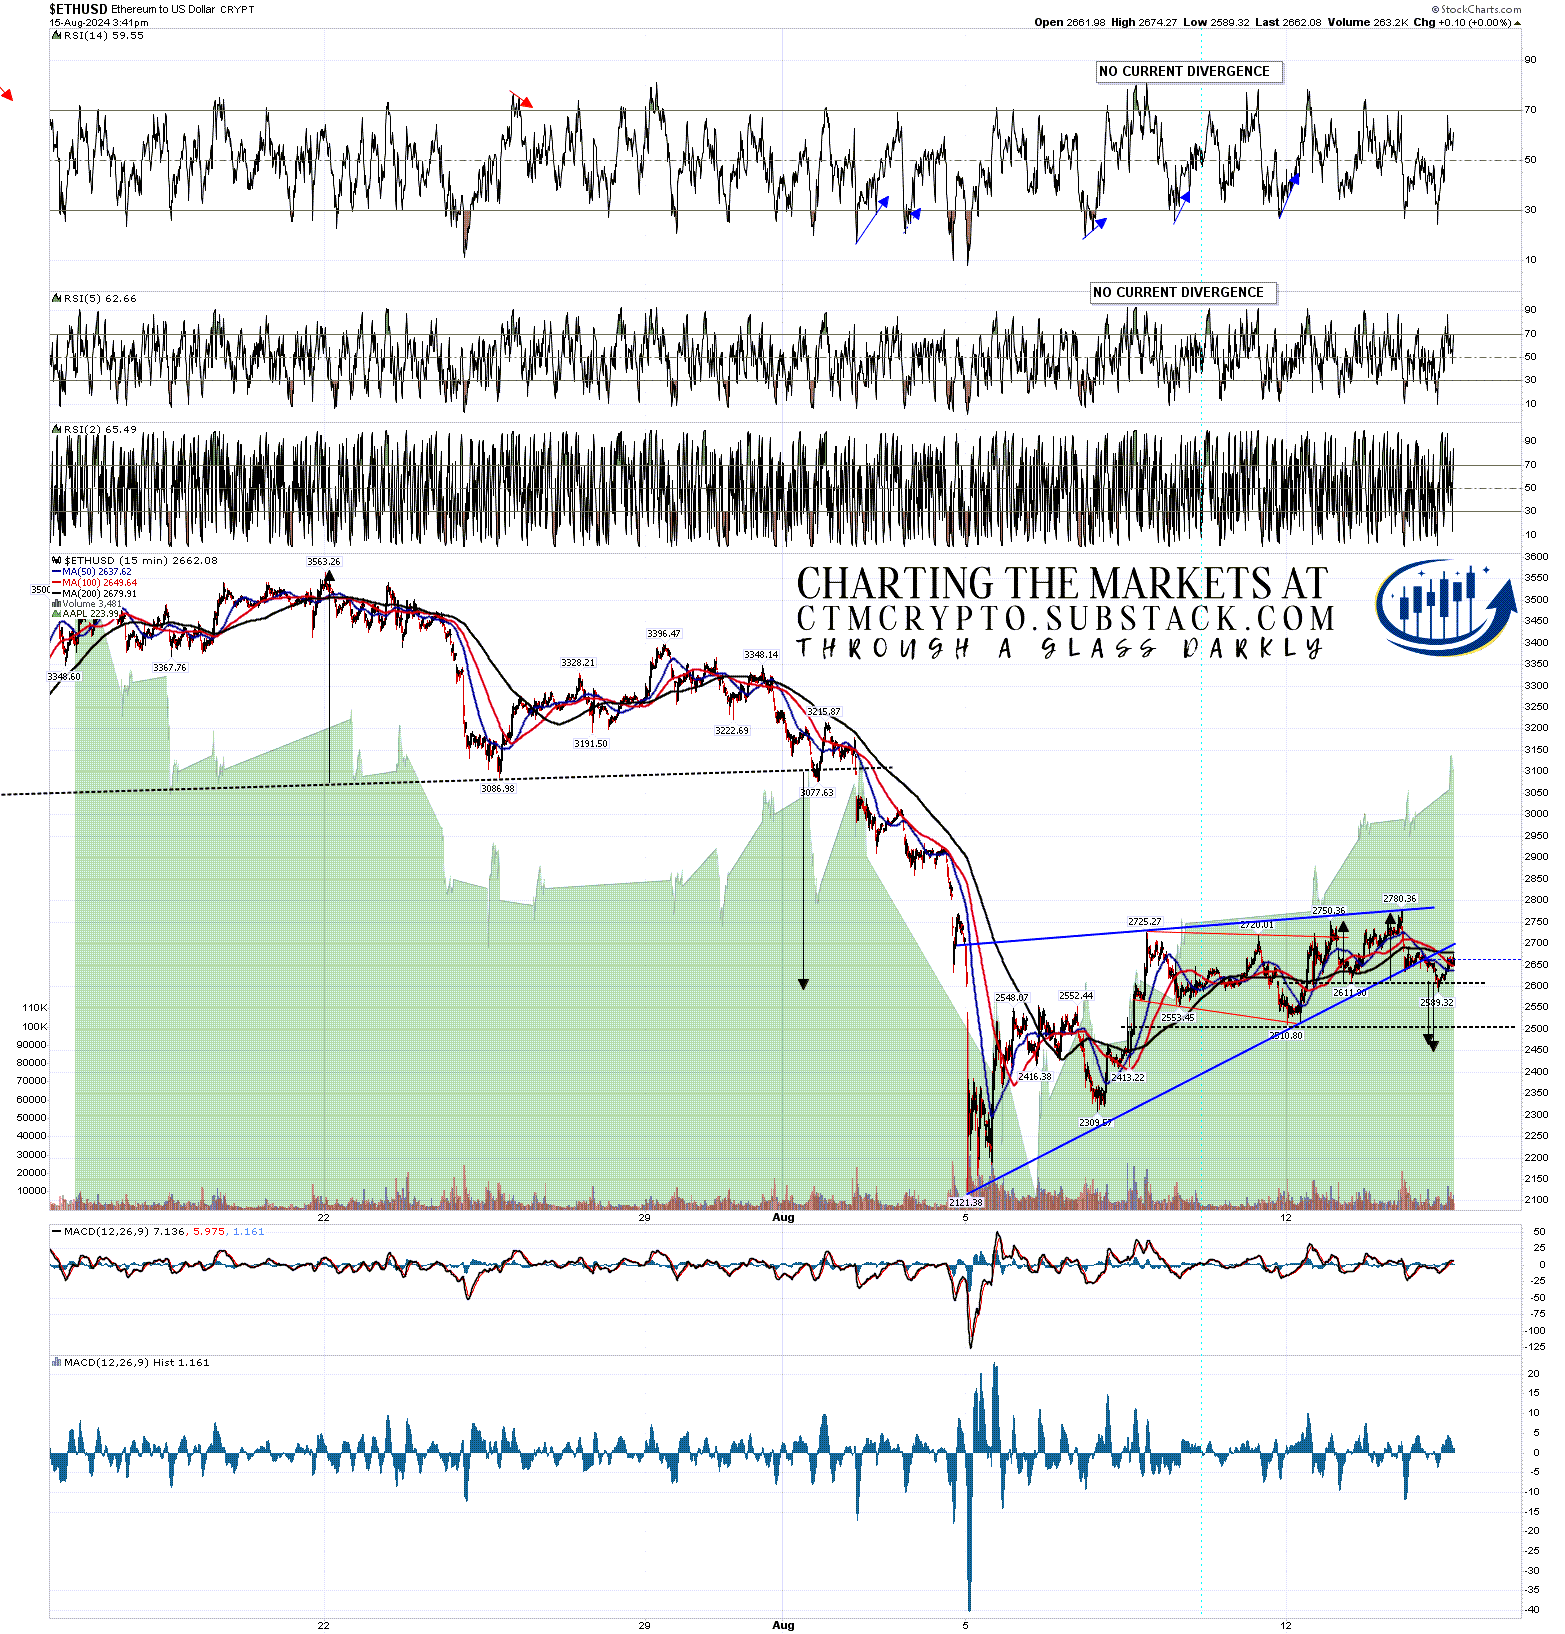
On the 15min chart Ethereum has formed and broken down slightly from a small double top with a target in the 2450-70 area. If reached there is a possible asymmetric double top or H&S neckline support in the3 2500 area. A break below would open a target in the 2250-2300 area.
ETHUSD 15min chart:
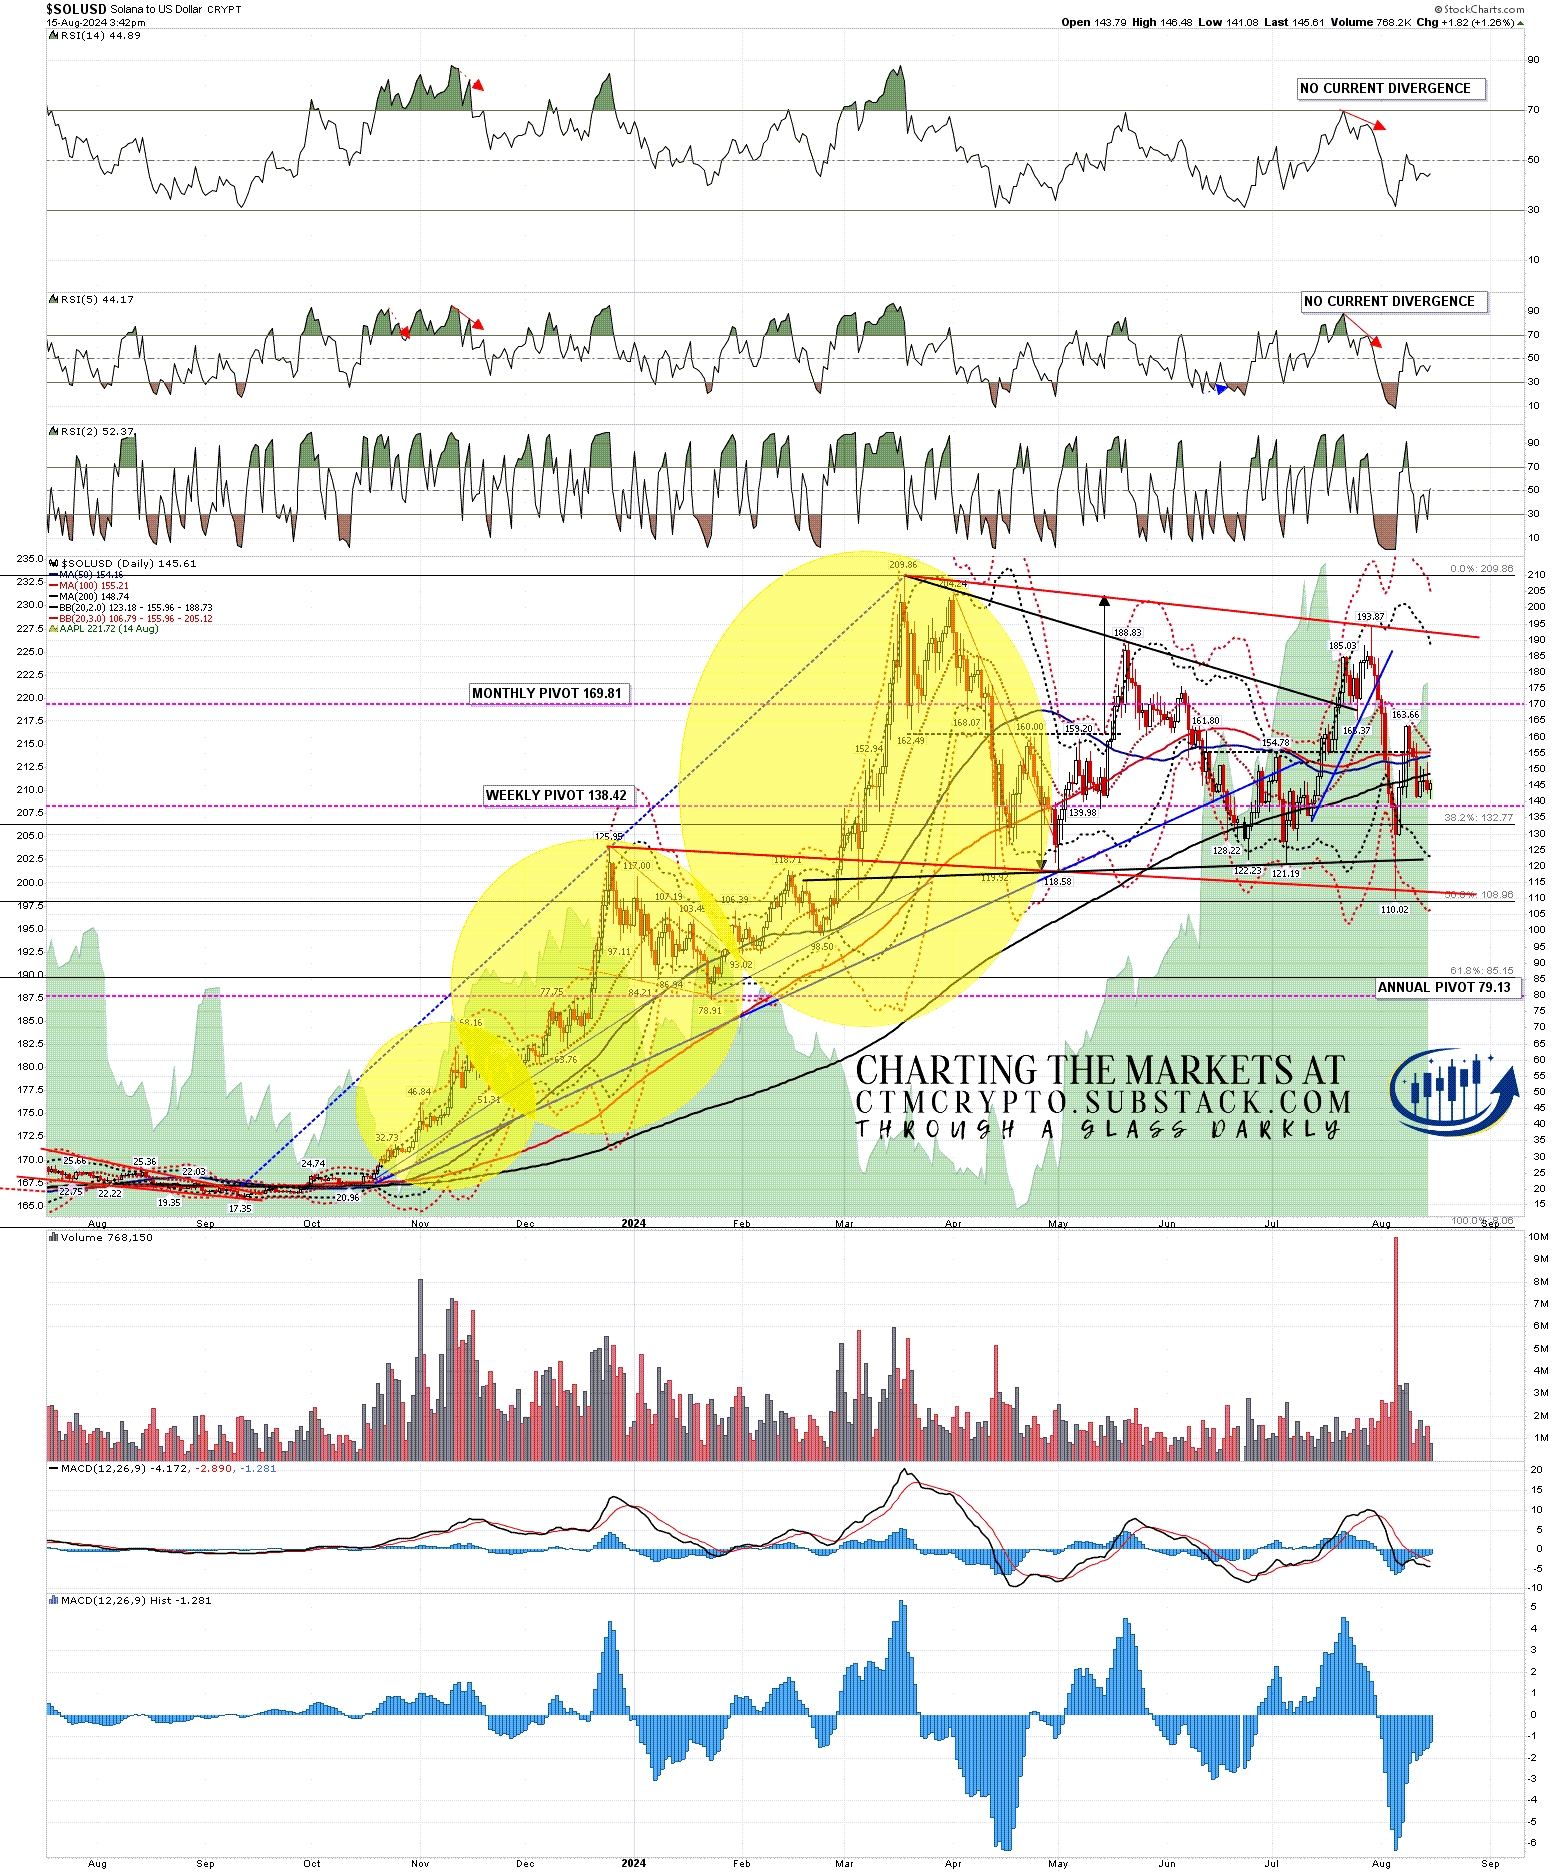
On Solana the overall bull flag setup is very nice, and daily middle band resistance is currently in the 156 area. A sustained break above opens the next target at bull flag resistance in the 192.5 area, and a further break above that would have a target at a retest of the 2024 high at 209.86.
SOLUSD daily chart:
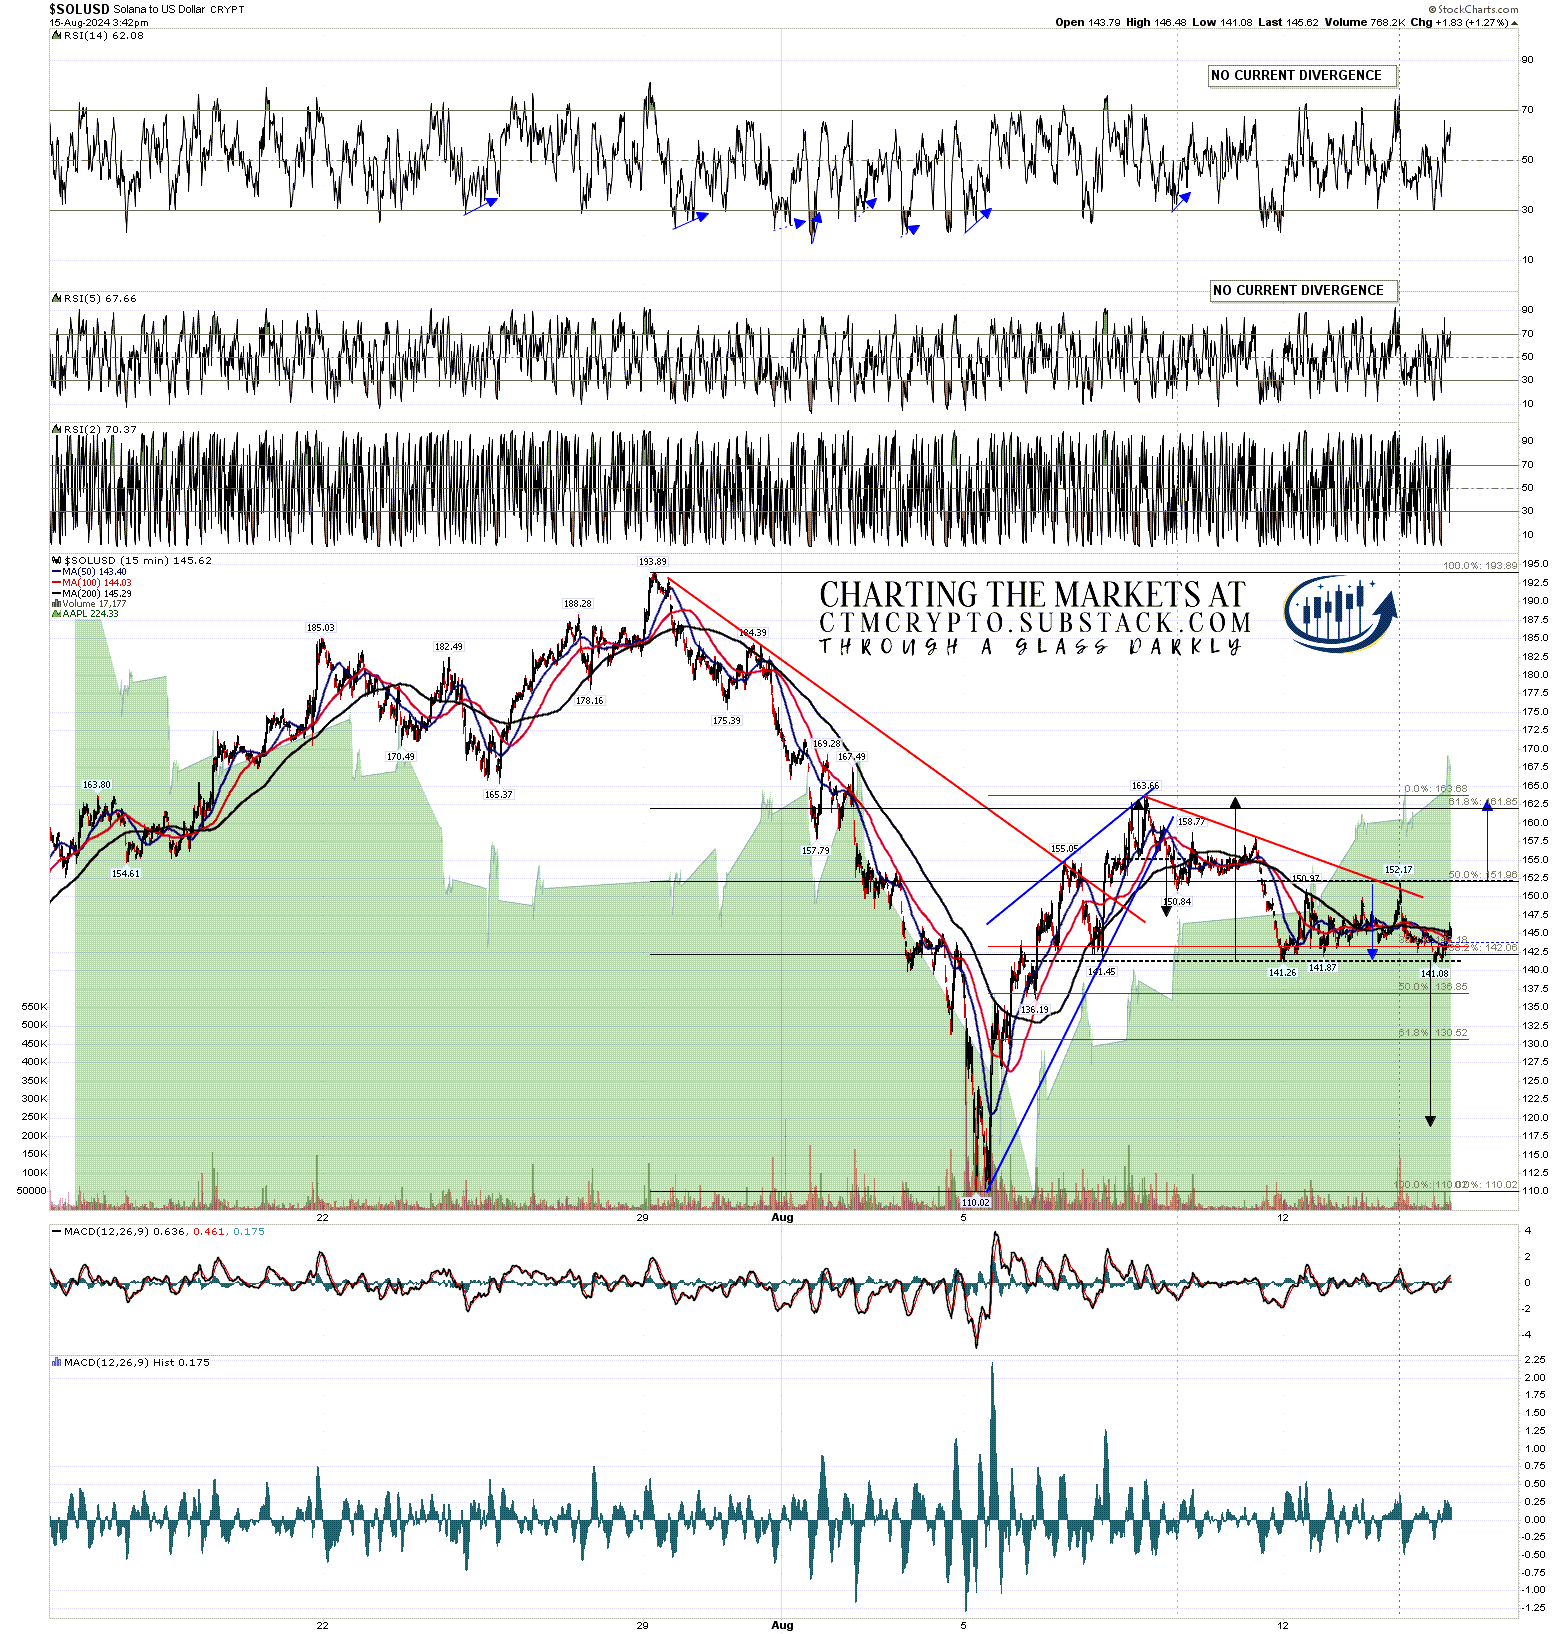
The 15min chart on Solana has a clear either/or setup here, and one of these two setups is likely to play out to target within days.
The bear scenario is the possible H&S that I’ve been looking at in my premarket webinars all week. A sustained break below 141 would look for the 119 area, and open a possible retest of the August low at 110.02. If this H&S is going to break down, I would expect that break today or tomorrow.
The bull setup is a small double bottom that on a sustained break back above 152.17 would have a target in the 162.25 area, effectively however a retest of the August high at 163.66.
SOLUSD 15min chart:
I have set up three substacks for my publishing from now on, and you can find all of my work, charts, posts & webinars/videos there. Those substacks are as follows:
https://chartingthemarkets.substack.com/ - Most of these posts & premarket video & charts.
https://ctmthebiggerpicture.substack.com - Bigger picture posts and weekend webinar & charts, postmarket videos.
https://ctmcrypto.substack.com - My Crypto posts, premarket webinars and charts.
I'm also to be found at Arion Partners, though as a student rather than as a teacher. I've been charting Cryptos for some years now, but am learning to trade and invest in them directly, and Arion Partners are my guide around a space that might reasonably be comparable to the Wild West in one of their rougher years.

No comments:
Post a Comment