There have been a couple of very decent looking short setups here on SPX and NDX this week, and both times the markets just ripped up through them. The bear flags formed and broke up, the SPX, NDX and INDU broke back up over their daily middle bands and are now testing their monthly pivots, while multiple hourly sell signals that had fixed at these obvious resistance levels failed, including two each on ES and NQ. Altogether it was an ugly week for the bears.
From Propaganda-Panda on DeviantArt:
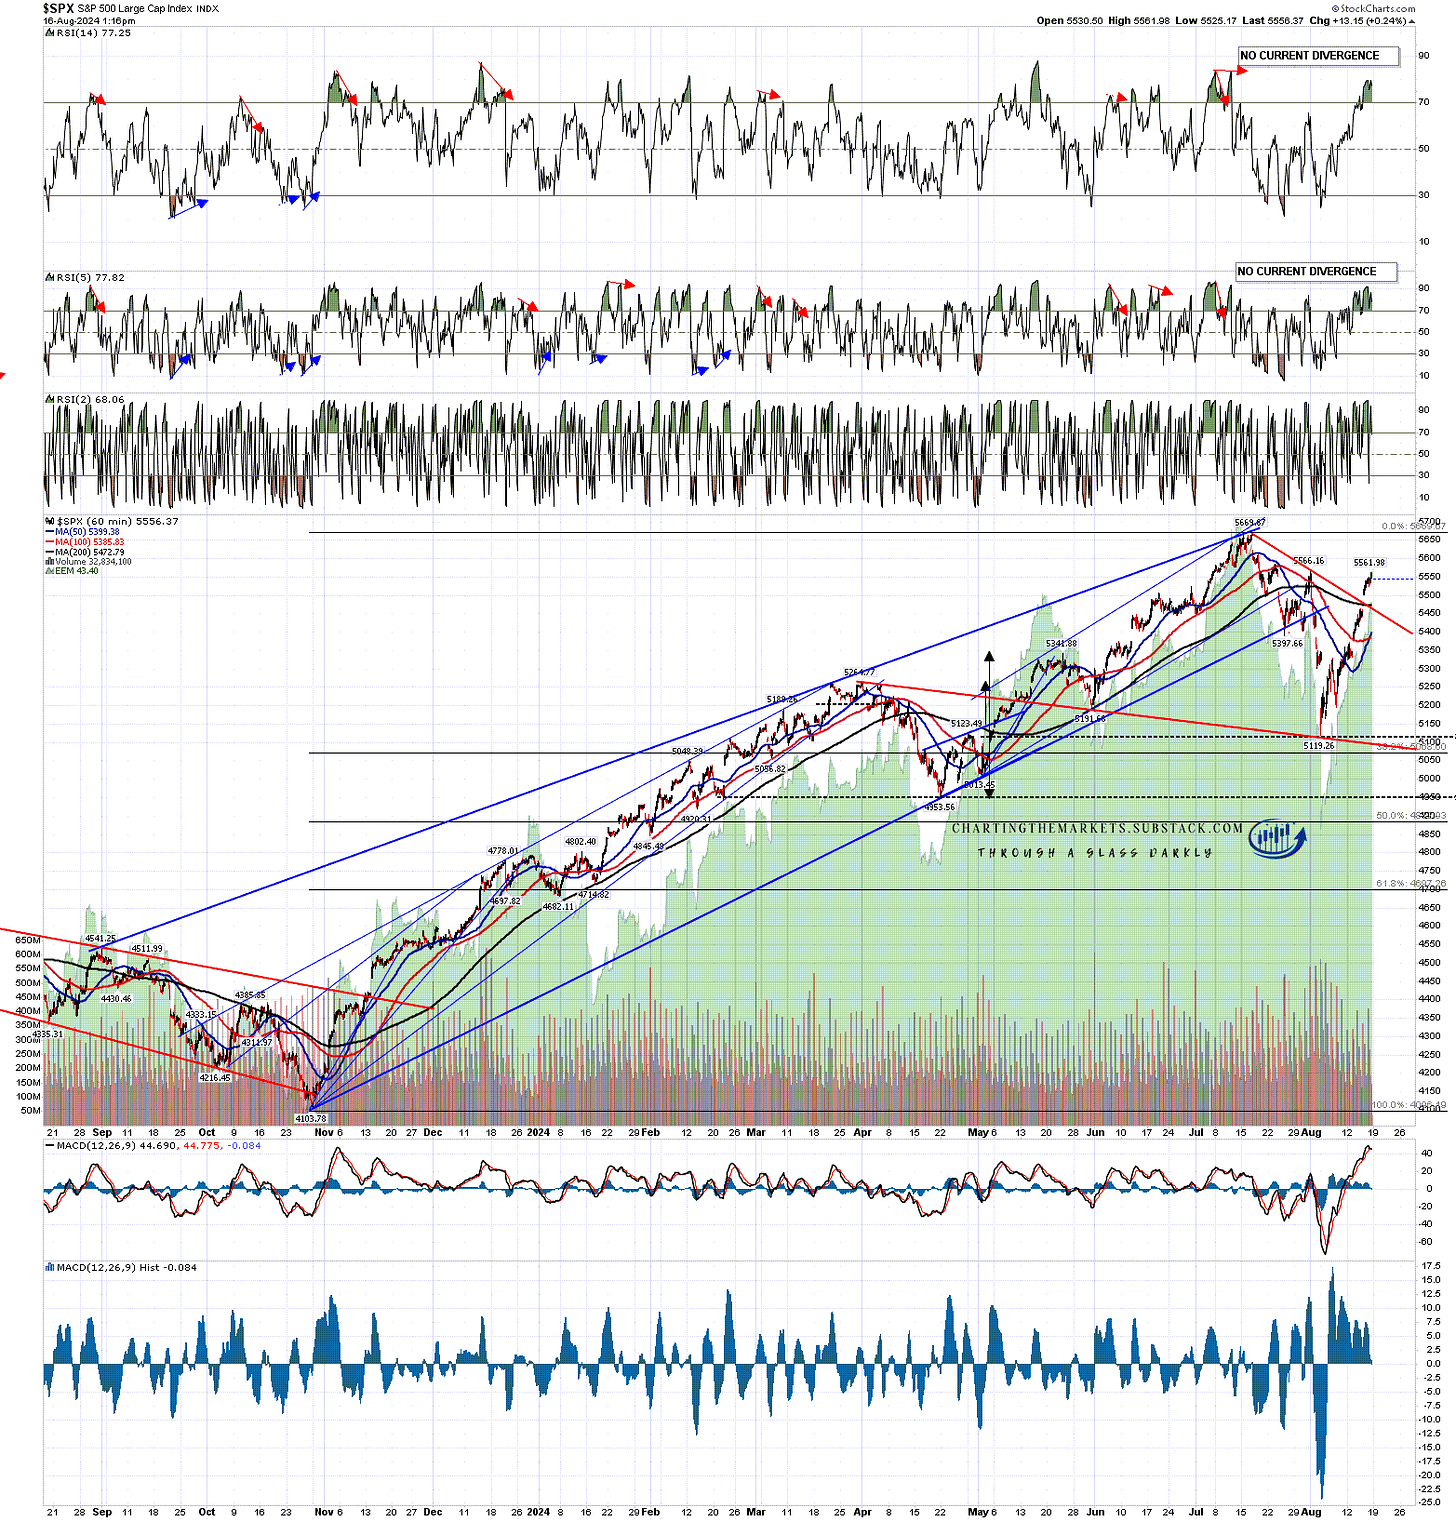
So what now? Well I had mentioned that the very nice support trendline established on SPX at the retracement low might well be the support trendline on a bigger picture bull flag and, if so, that bull flag has now broken up with a target at the retest of the all time high at 5669.67. I’m expecting to see a retest of that ATH within a few days, though that might of course be the second high of an even bigger picture double top.
Are there any obvious alternatives? Yes, we might see a lower low from this area while an expanded double top formed, but I think that is the lower probability option.
SPX hourly chart:
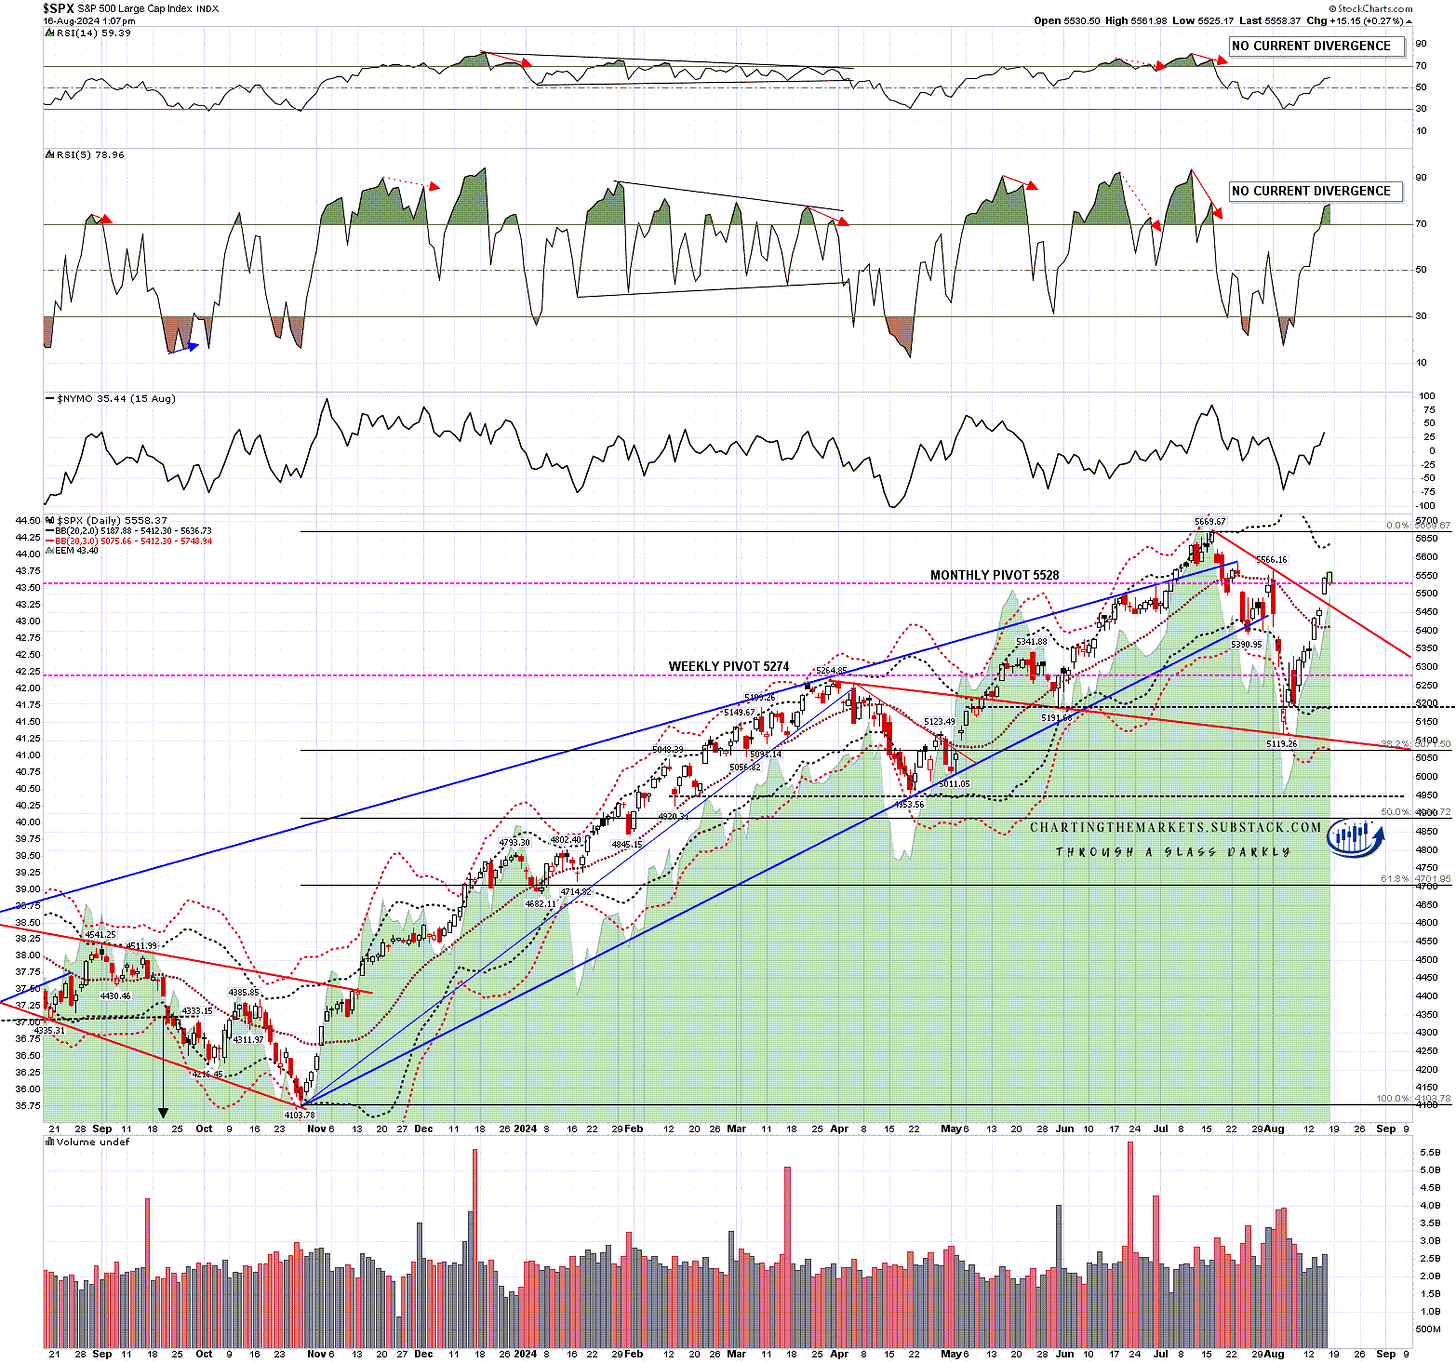
Three of the four main US equity indices I follow look very similar to each other. SPX broke back over the daily middle band and is now testing the monthly pivot, already most of the way back to a retest of the all time high.
SPX daily BBs chart:
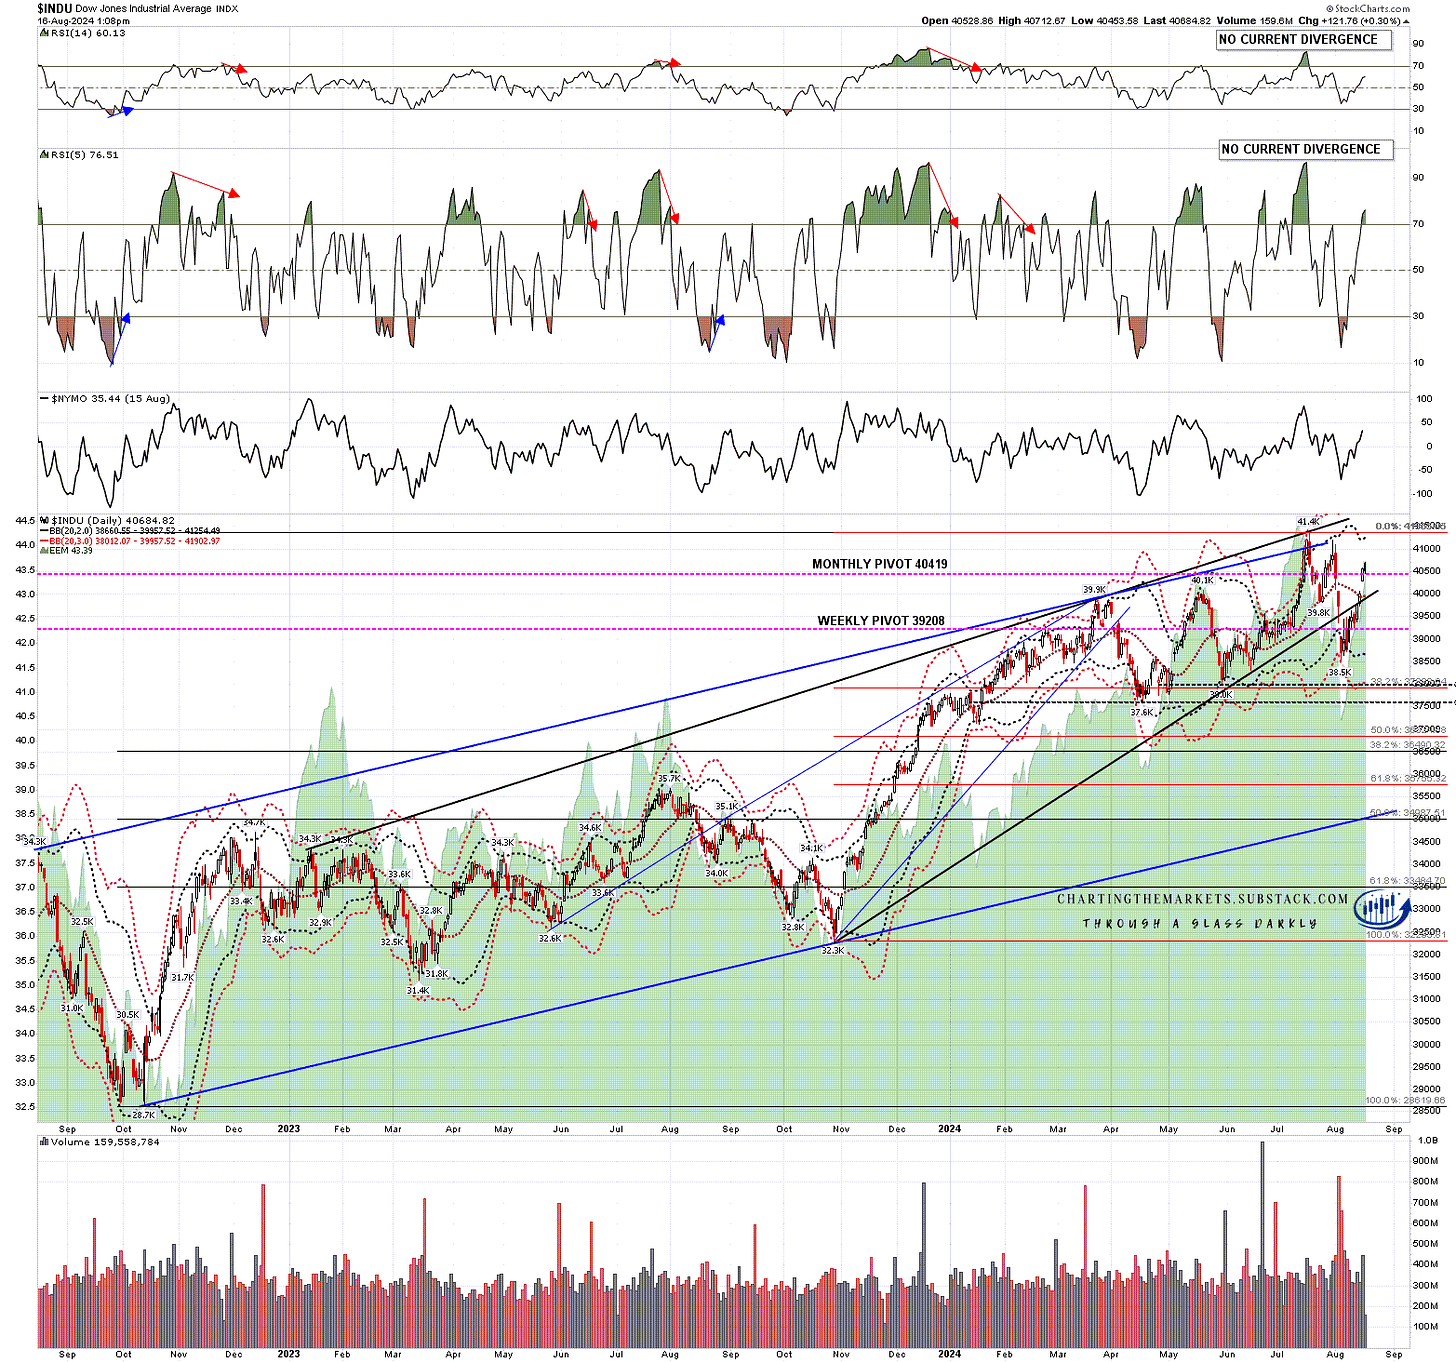
Dow also broke back over the daily middle band and is now testing the monthly pivot, already most of the way back to a retest of the all time high.
INDU daily BBs chart:
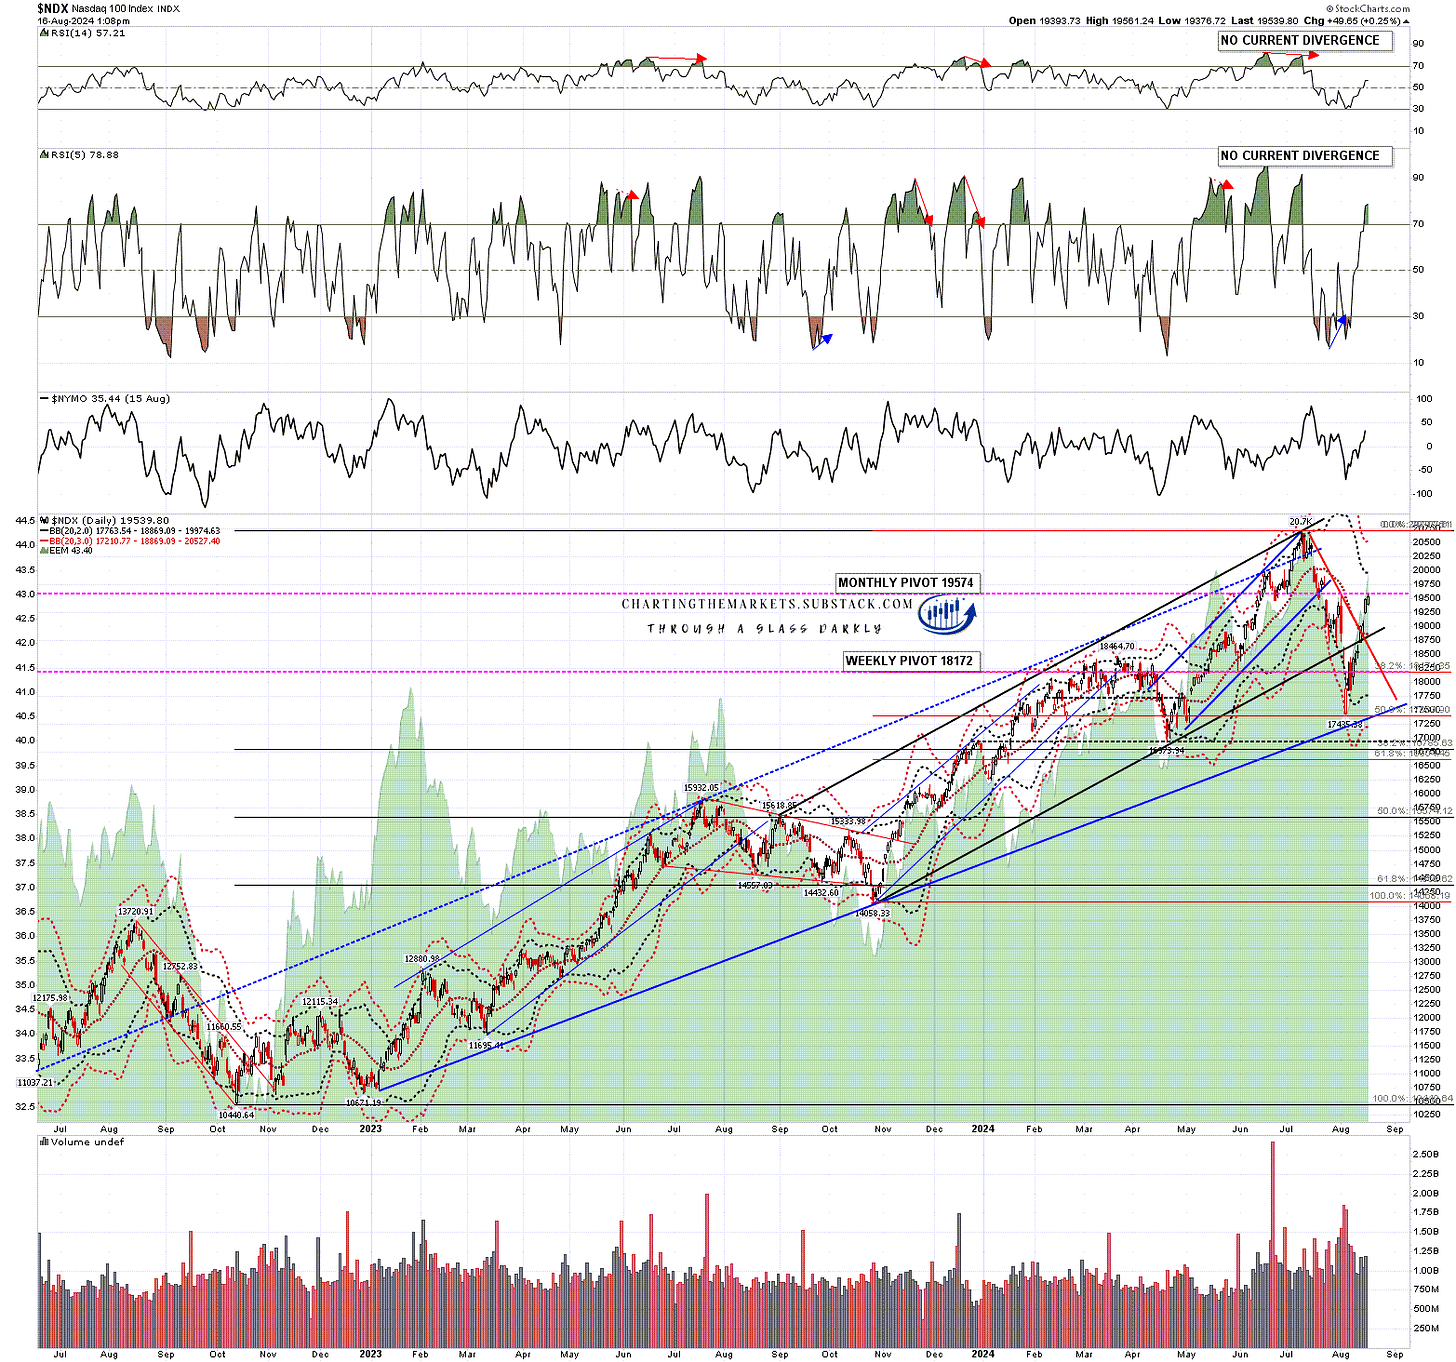
NDX also broke back over the daily middle band and is now testing the monthly pivot, already over 61.8% of the way back to a retest of the all time high.
NDX daily BBs chart:
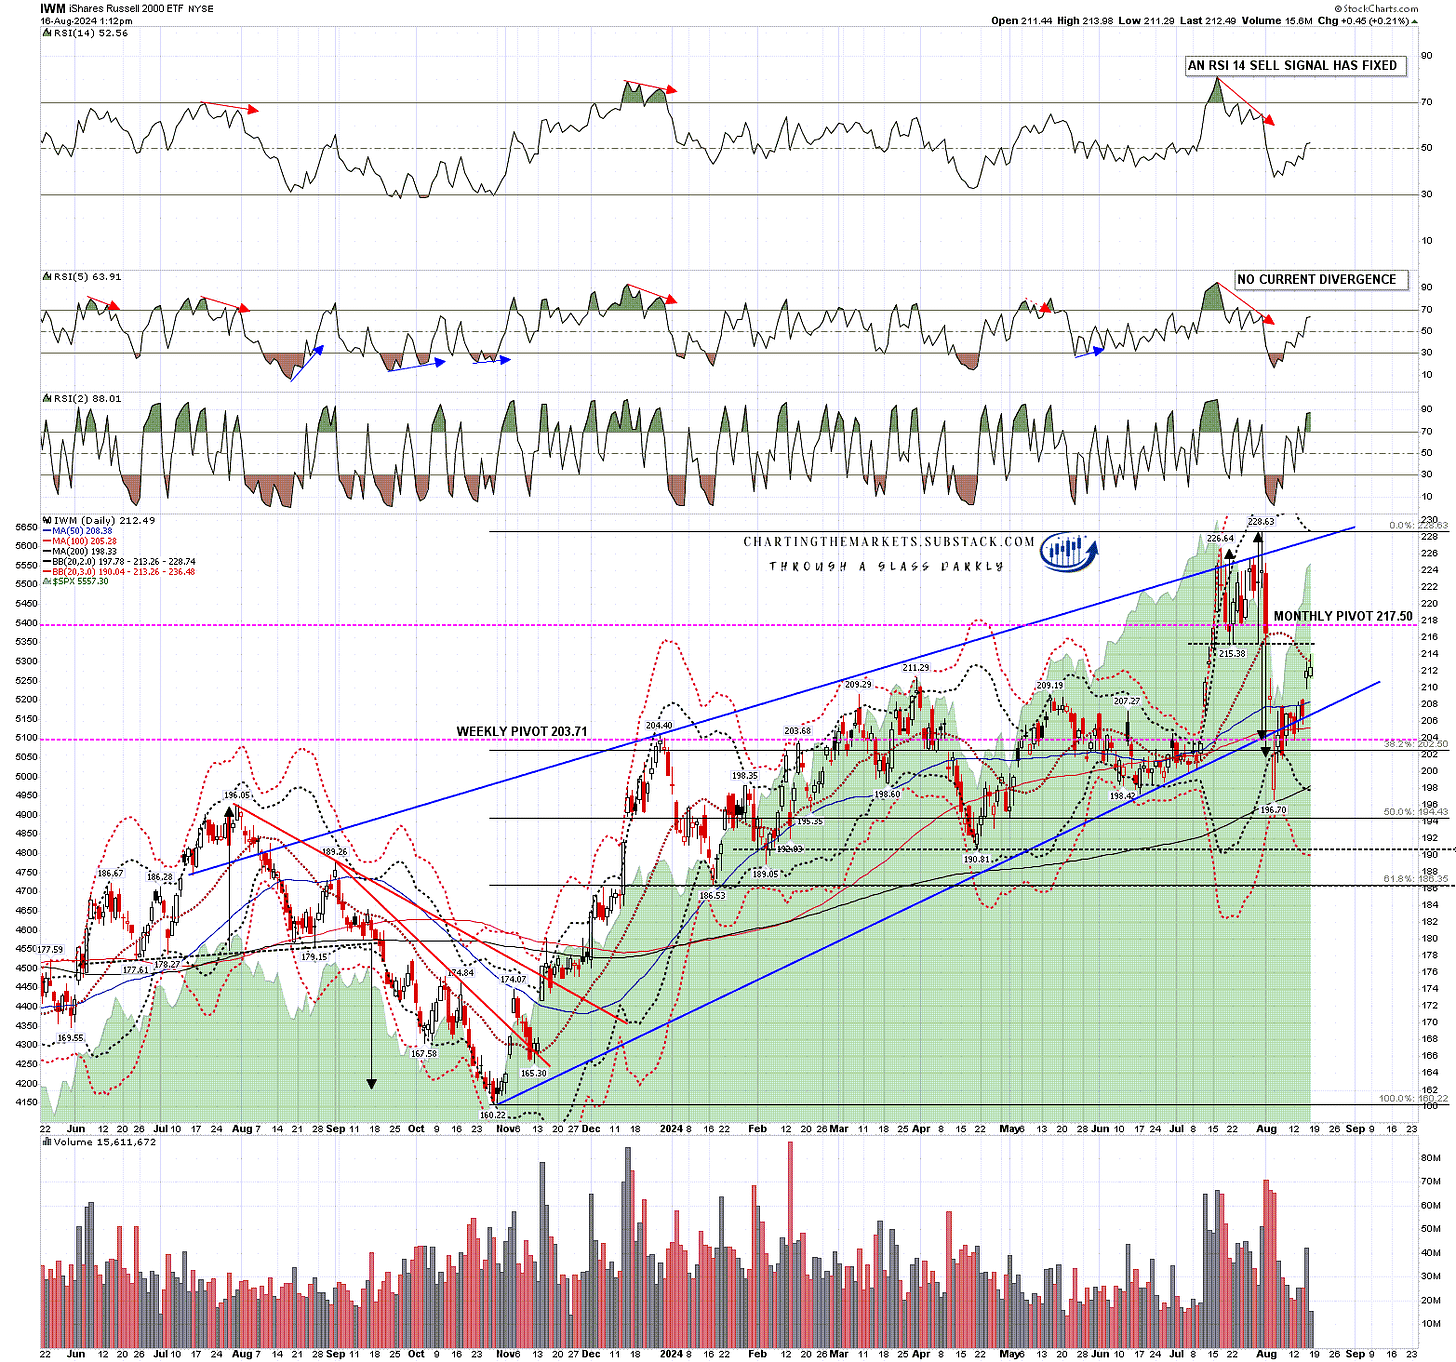
Russell 2000 / IWM has been the laggard this time, with a retracement slightly over 50% of the decline so far and currently testing resistance at the daily middle band for a second day.
IWM daily BBs chart:
SPX and Dow have been leading the way up from the low, with NDX somewhat behind and IWM lagging at the rear, so this very much isn’t a tech led move.
IWM still looks like a bear flag and is testing the first big resistance at the daily middle band. I’m not reading too much into that but it is one data point to support a possible hard fail here to form expanded bull flags but, if I owned it, I wouldn’t be betting the crime scene bear image above on that happening. Better odds that we see new all time highs directly from here and see whether resistance is found there.
In the short term I was looking at new hourly sell signals across the board this morning on ES, NQ, RTY, YM, Dax and ESTX50, and with SPX, NDX and Dow testing their monthly pivots, this would be a good place to see some retracement, or at least some consolidation, before that run at the all time time retests on those three indices. We’ll see how that goes.
Everyone have a great weekend :-)
I’ve been setting up my new base at Substack over the last few days and I have set up three substacks to cover different areas of my work. These are as follows:
Equity indices & futures with a premarket webinar every morning. Weekly & monthly pivots posted every weekend. My main base for writing posts: -
Charting The Markets Substack
Crypto posts, charts & a premarket webinar every day. Weekly & monthly pivots posted every Monday: -
CTM Crypto Substack
Chart The Markets Crypto Substack
Bigger picture on equity indices, bonds, currency pairs & commodities. Two webinars a week, all the supporting charts on Sundays, and regular posts:
CTM The Bigger Picture
These are all the three I will be setting up for now. There will be plenty of free content across them & all are welcome.


No comments:
Post a Comment