
Finally some signs of a genuine, can be seen with the naked eye, retracement on equity indices today. I was talking in this morning’s premarket video about the possibility of setting up some decent quality hourly RSI 14 sell signals on SPX and NDX for the first time since the all time highs were made and they set up and fixed this morning into the decline that we have been watching today.
I have been muttering that without retracements there are no chart patterns, and this delivers a shot at finally seeing some of those form, and also a shot at setting up decent possible negative divergences on the daily RSI 14 or RSI 5 charts, again for the first time since the all time highs were made.
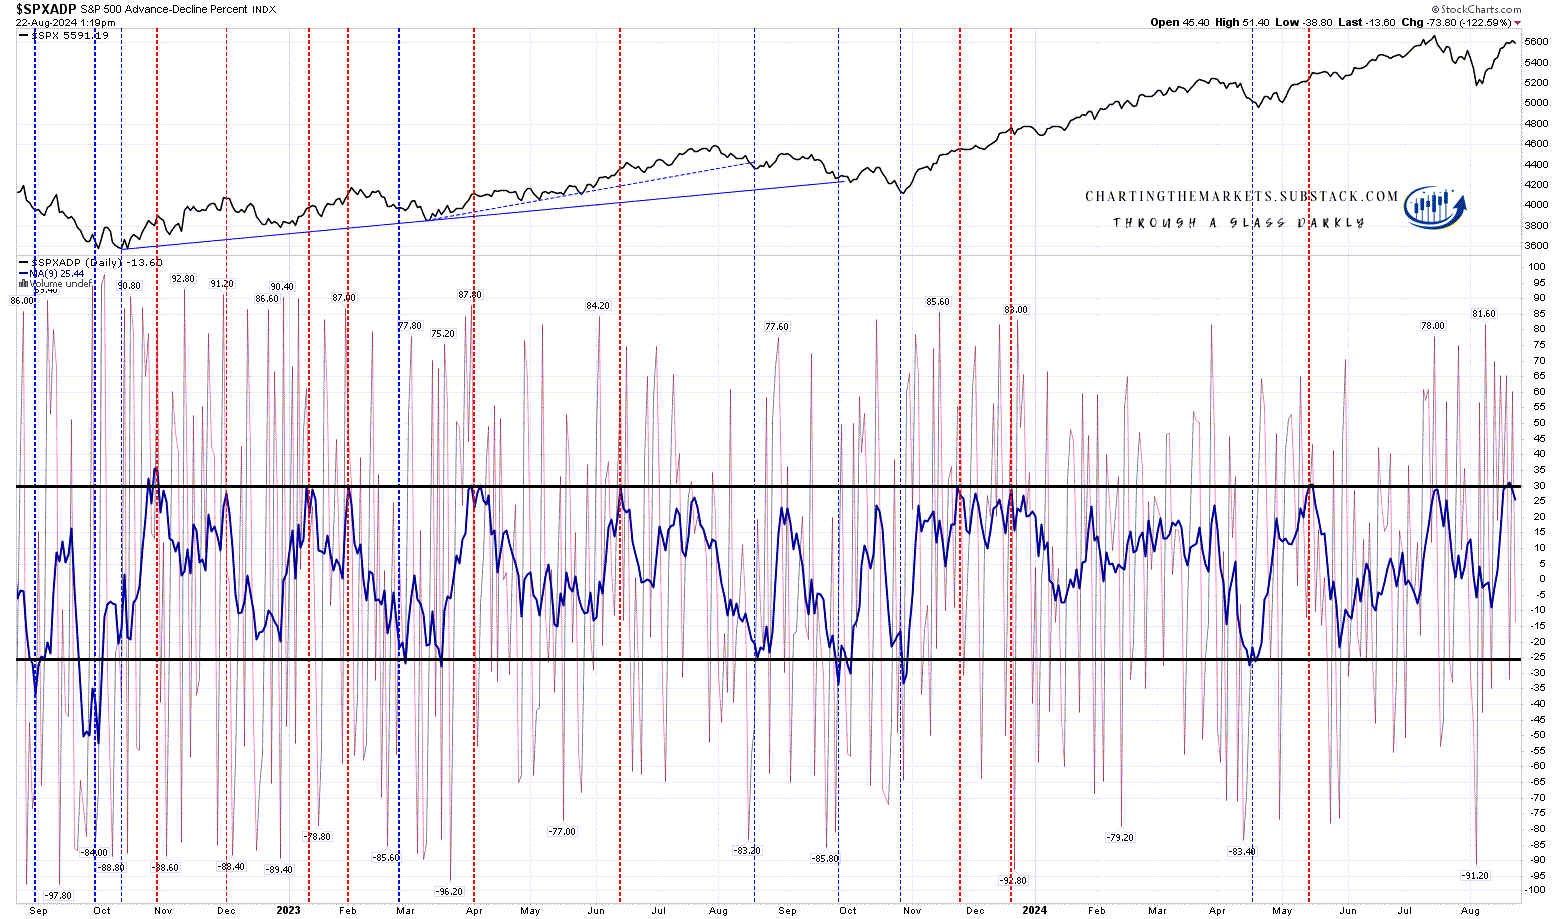
One interesting chart I look at most days and that is worth showing is the daily $SPXADP chart, where a hit of the 30 level marked with a line tends to be a decent indicator that at least a retracement is close, and that was signalling this one, though in fairness that has been the case since Monday.
SPXADP daily chart:
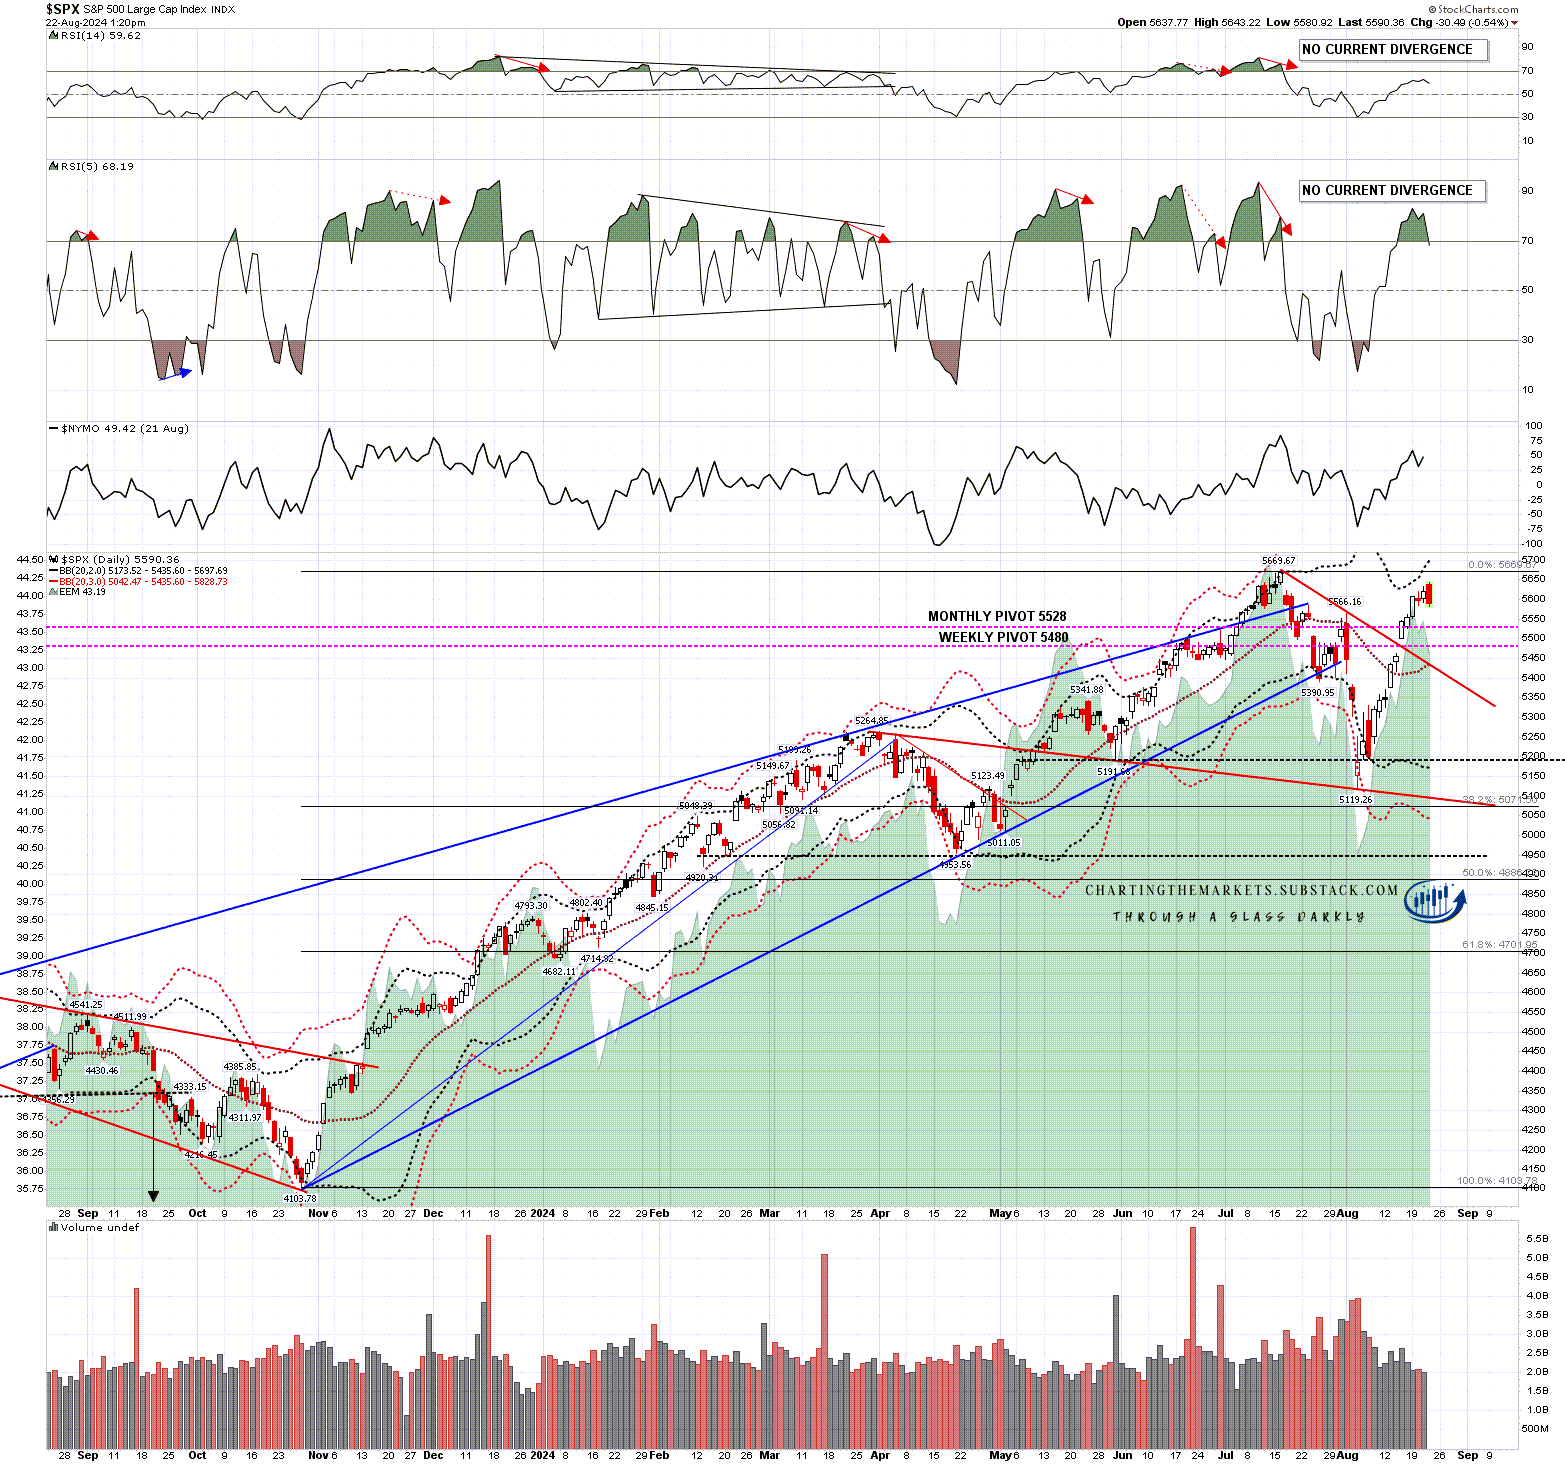
I was giving the obvious first target for any retracement at the monthly pivot level, at 5528 on SPX and 5570. At the time of writing the LOD is at 5563, and with plenty of room left in the hourly sell signals here, I think that has a decent chance of being hit:
SPX daily BBs chart:
In terms of those hourly sell signals I have a rare show of unanimity on the US index charts that I mainly watch, with full hourly RSI 14 sell signals fixed this morning on SPX, NDX, and IWM, and a weak one on Dow. These have been delivering nicely so far and none have yet made target.
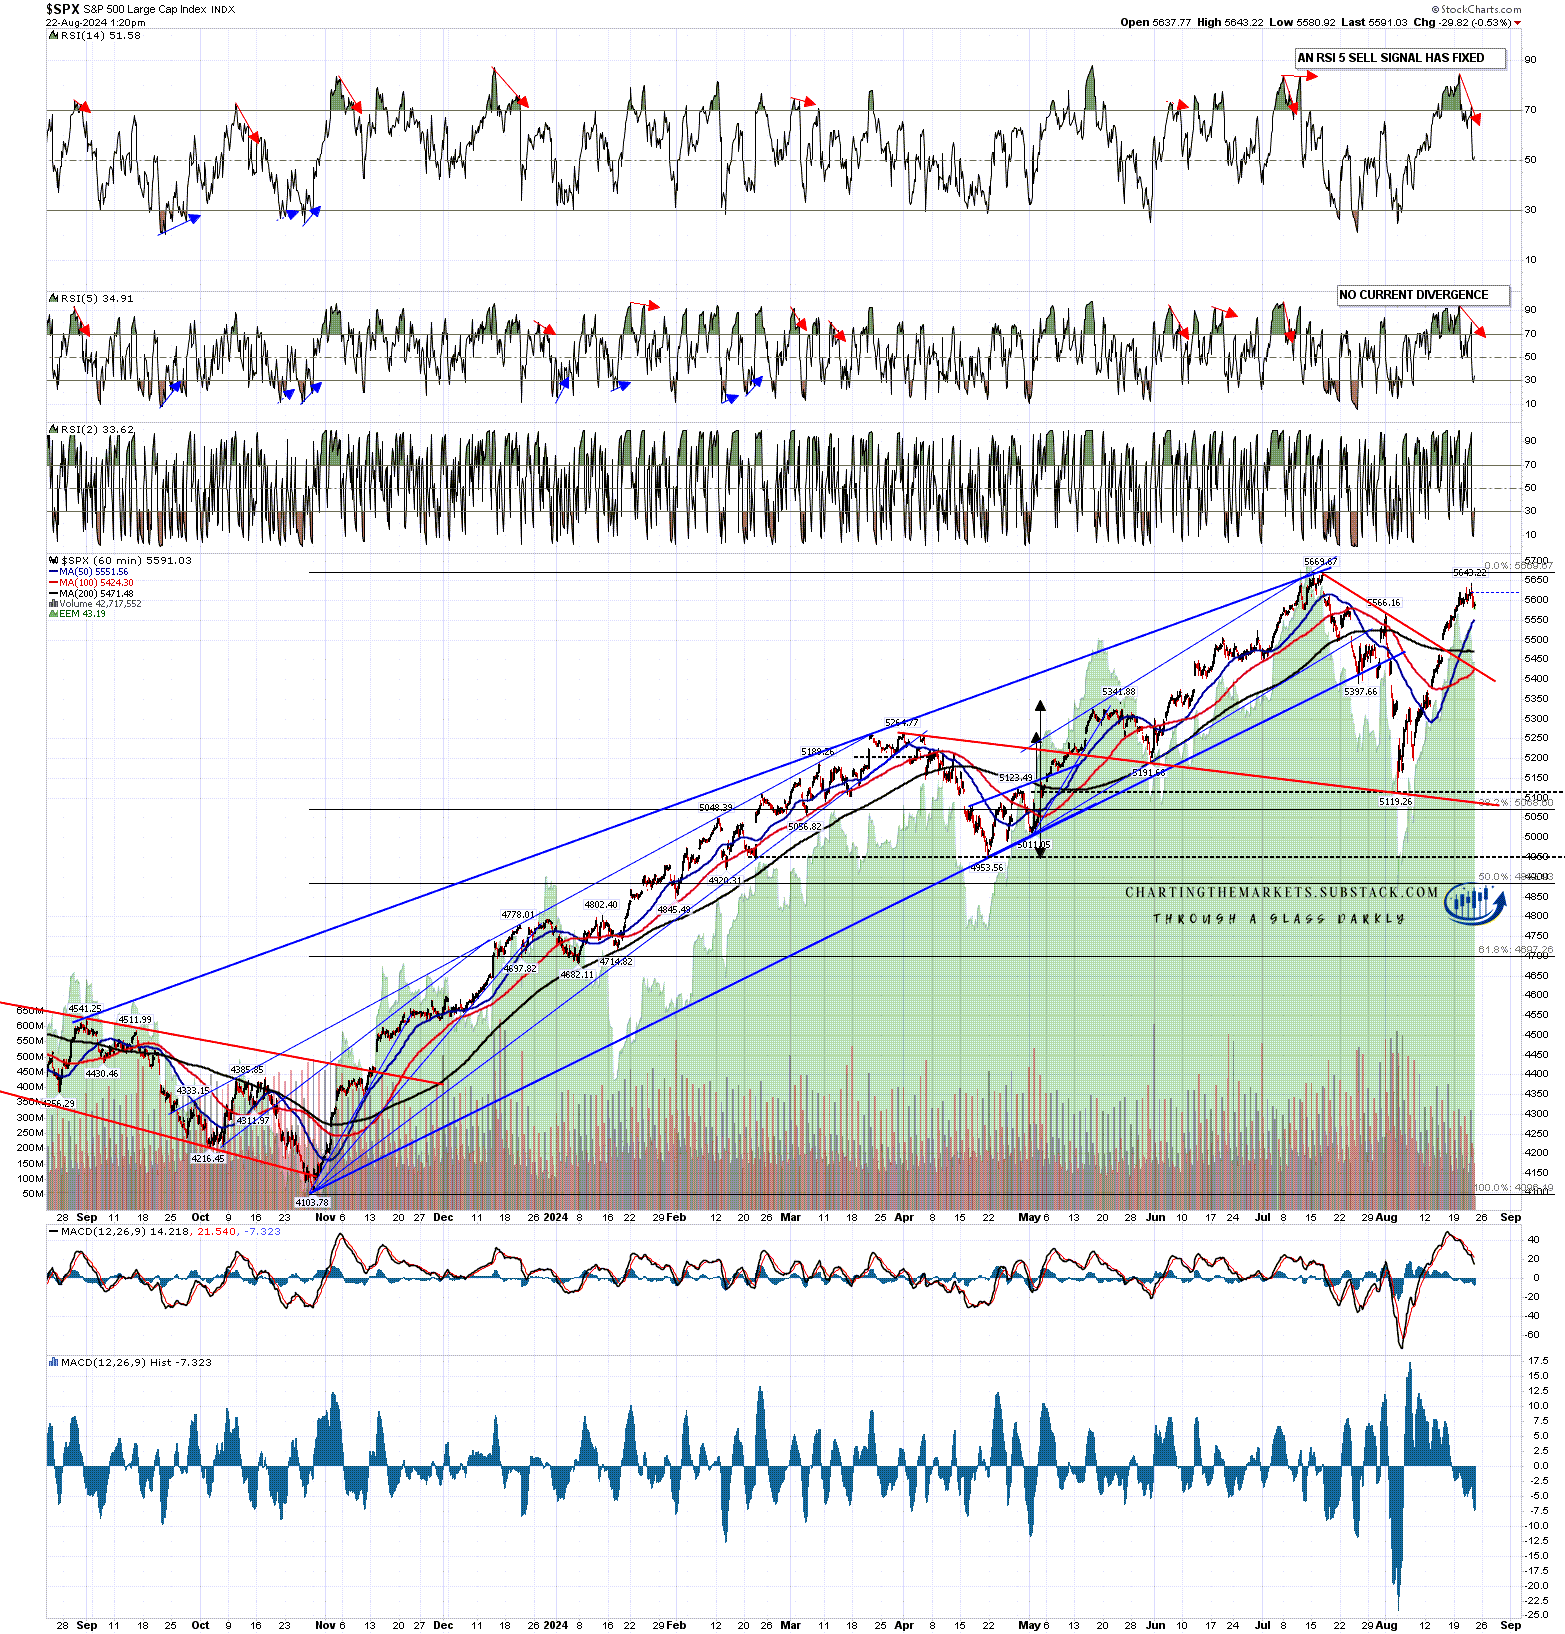
On SPX both RSI 14 and RSI 5 sell signals fixed on the hourly chart this morning, and the RSI 5 sell signal has reached target. SPX is close to a test of the first decent hourly support at the 50 hour MA, currently at 5554, and there is a strong support zone below that in the 5470-5500 area, supported by the 50dma currently at 5479.
SPX 60min chart:
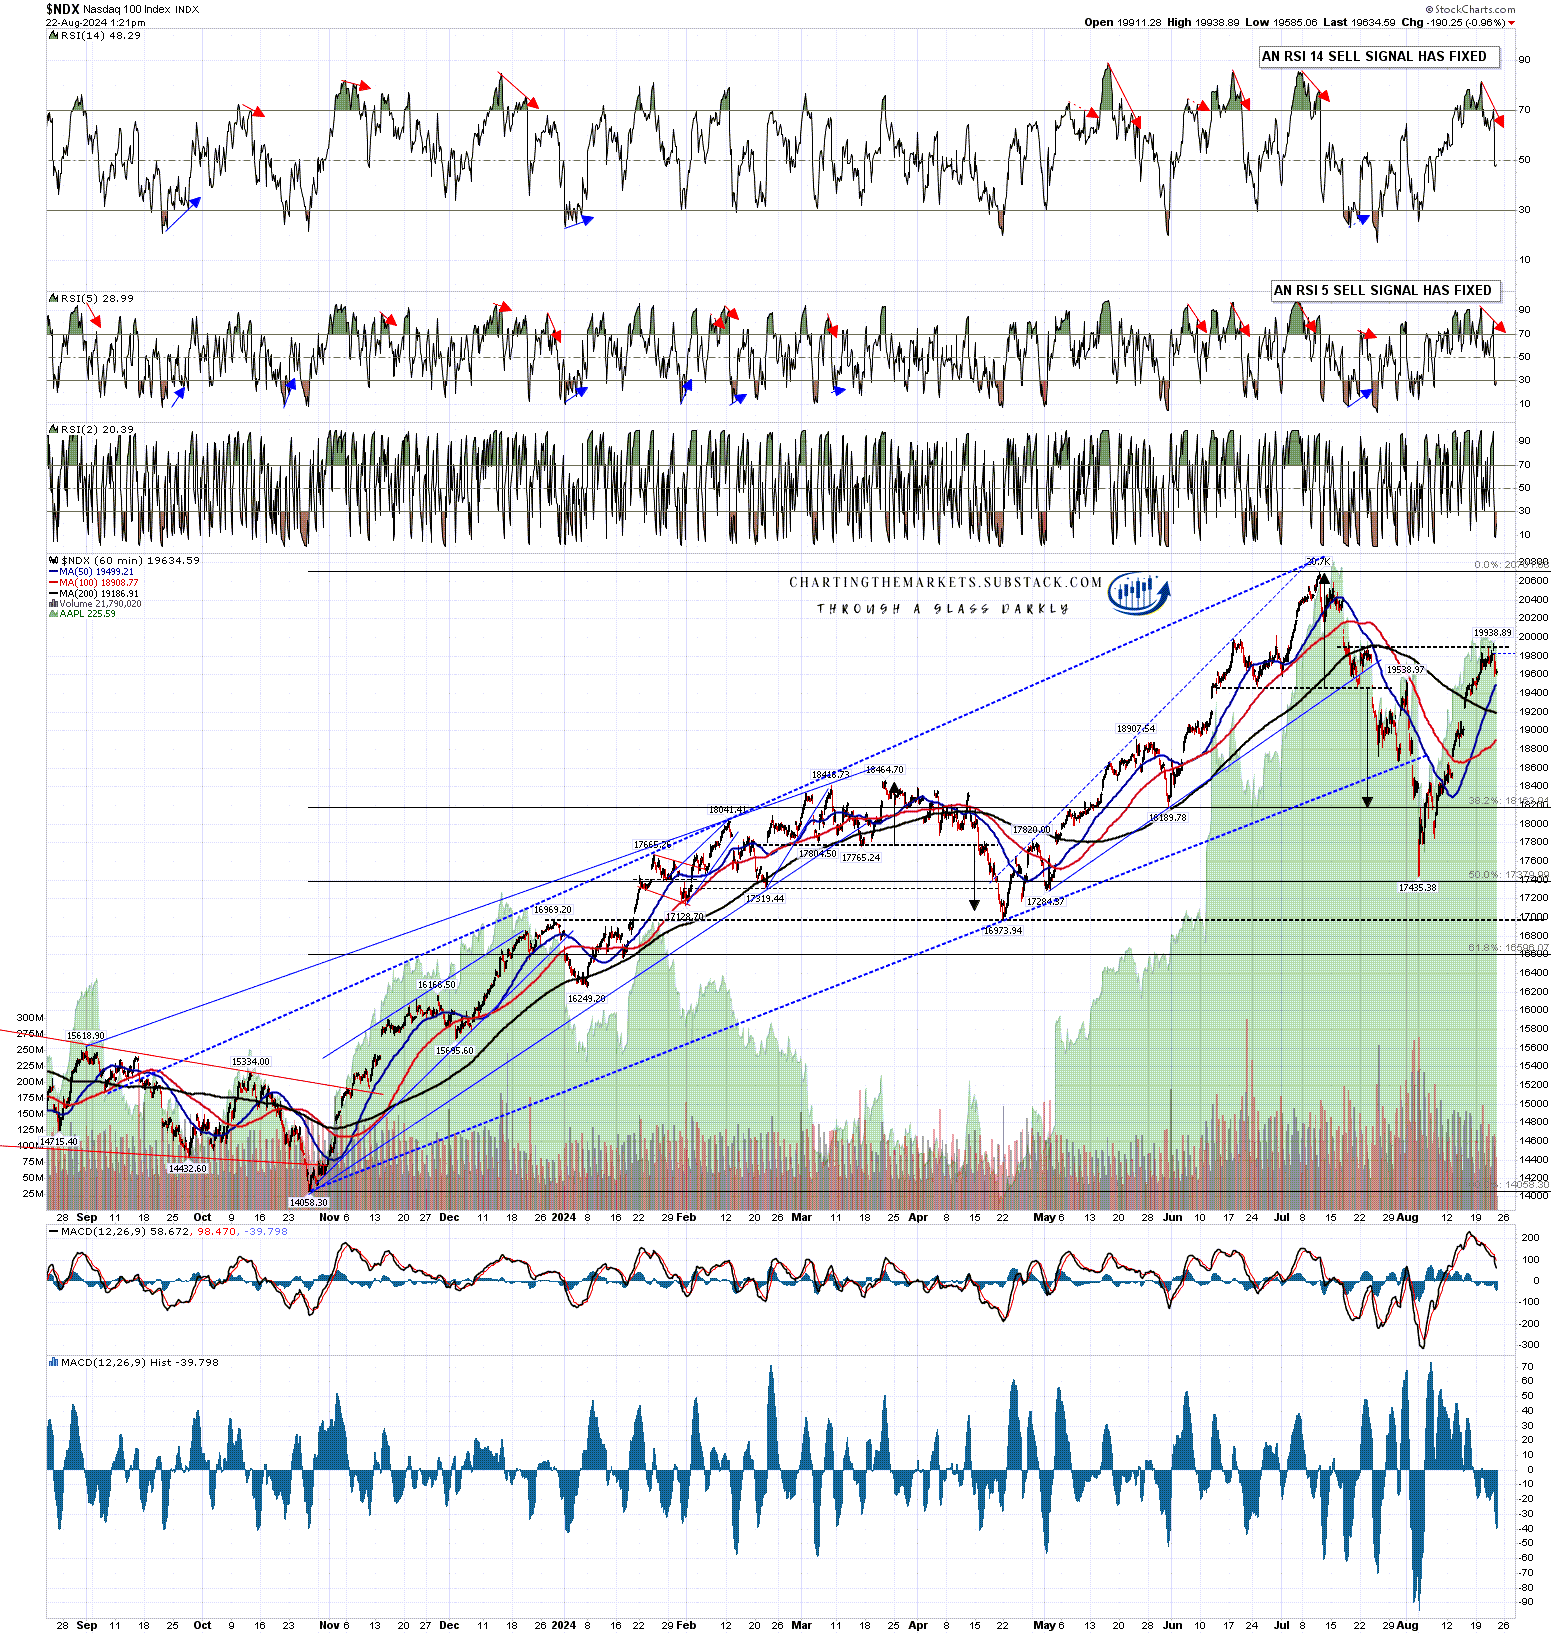
On NDX both RSI 14 and RSI 5 sell signals fixed on the hourly chart this morning, and the RSI 5 sell signal has reached target. NDX is pausing at a significant resistance zone just under 20,000, I’m watching the test of the 50dma, tested at the low today, and below that there is a possible breakaway gap in the 19,100-225 area that I’m watching, supported by the 200dma currently at 19,181.
NDX 60min chart:
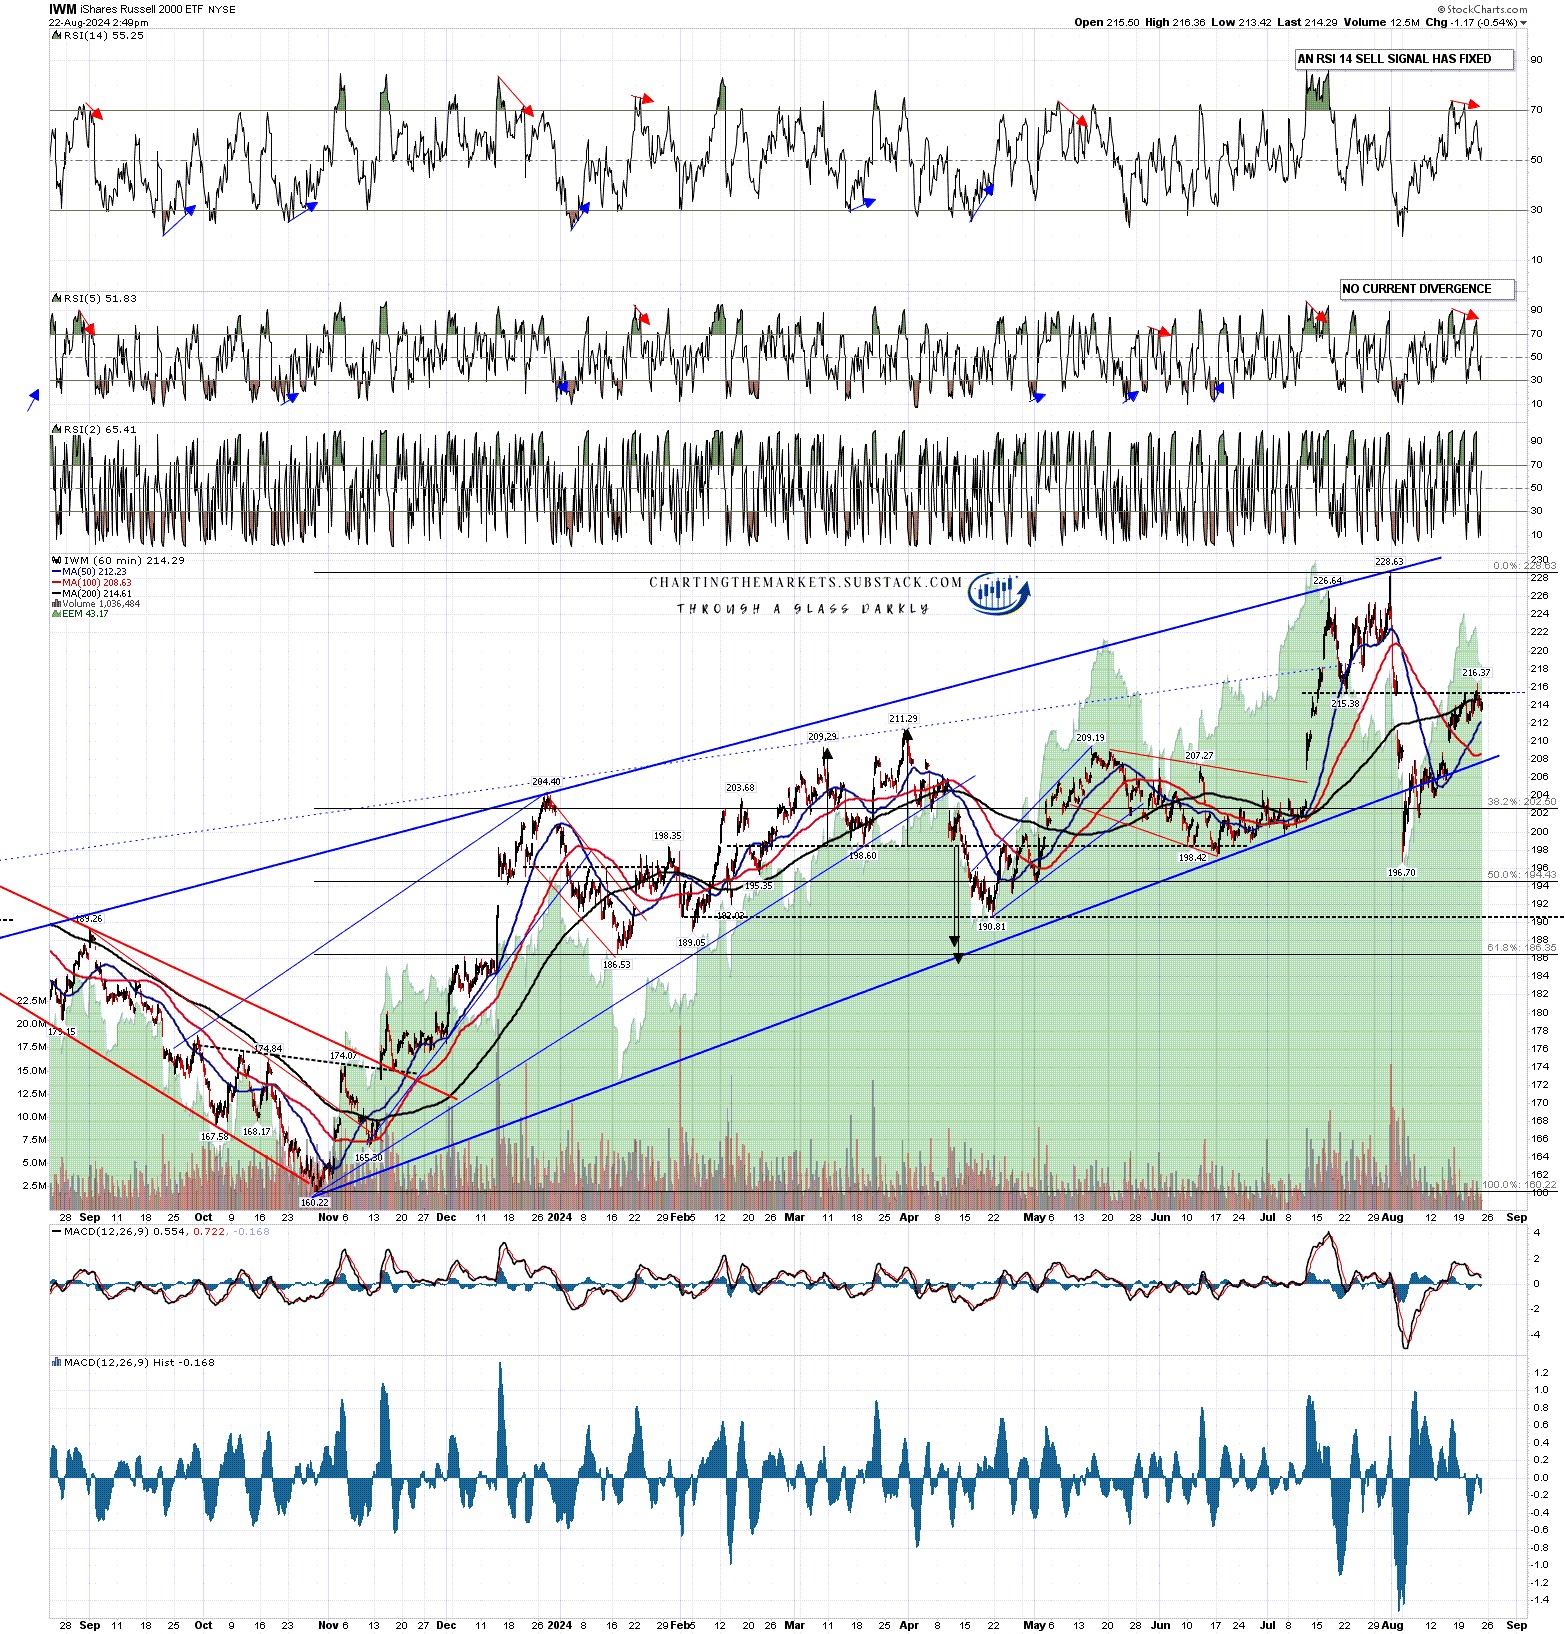
On IWM both RSI 14 and RSI 5 sell signals fixed on the hourly chart yesterday afternoon, and the RSI 5 sell signal has reached target. I am mainly watching support at the 50 hour MA, and the daily middle band, both currently in the 212 area.
IWM 60min chart:
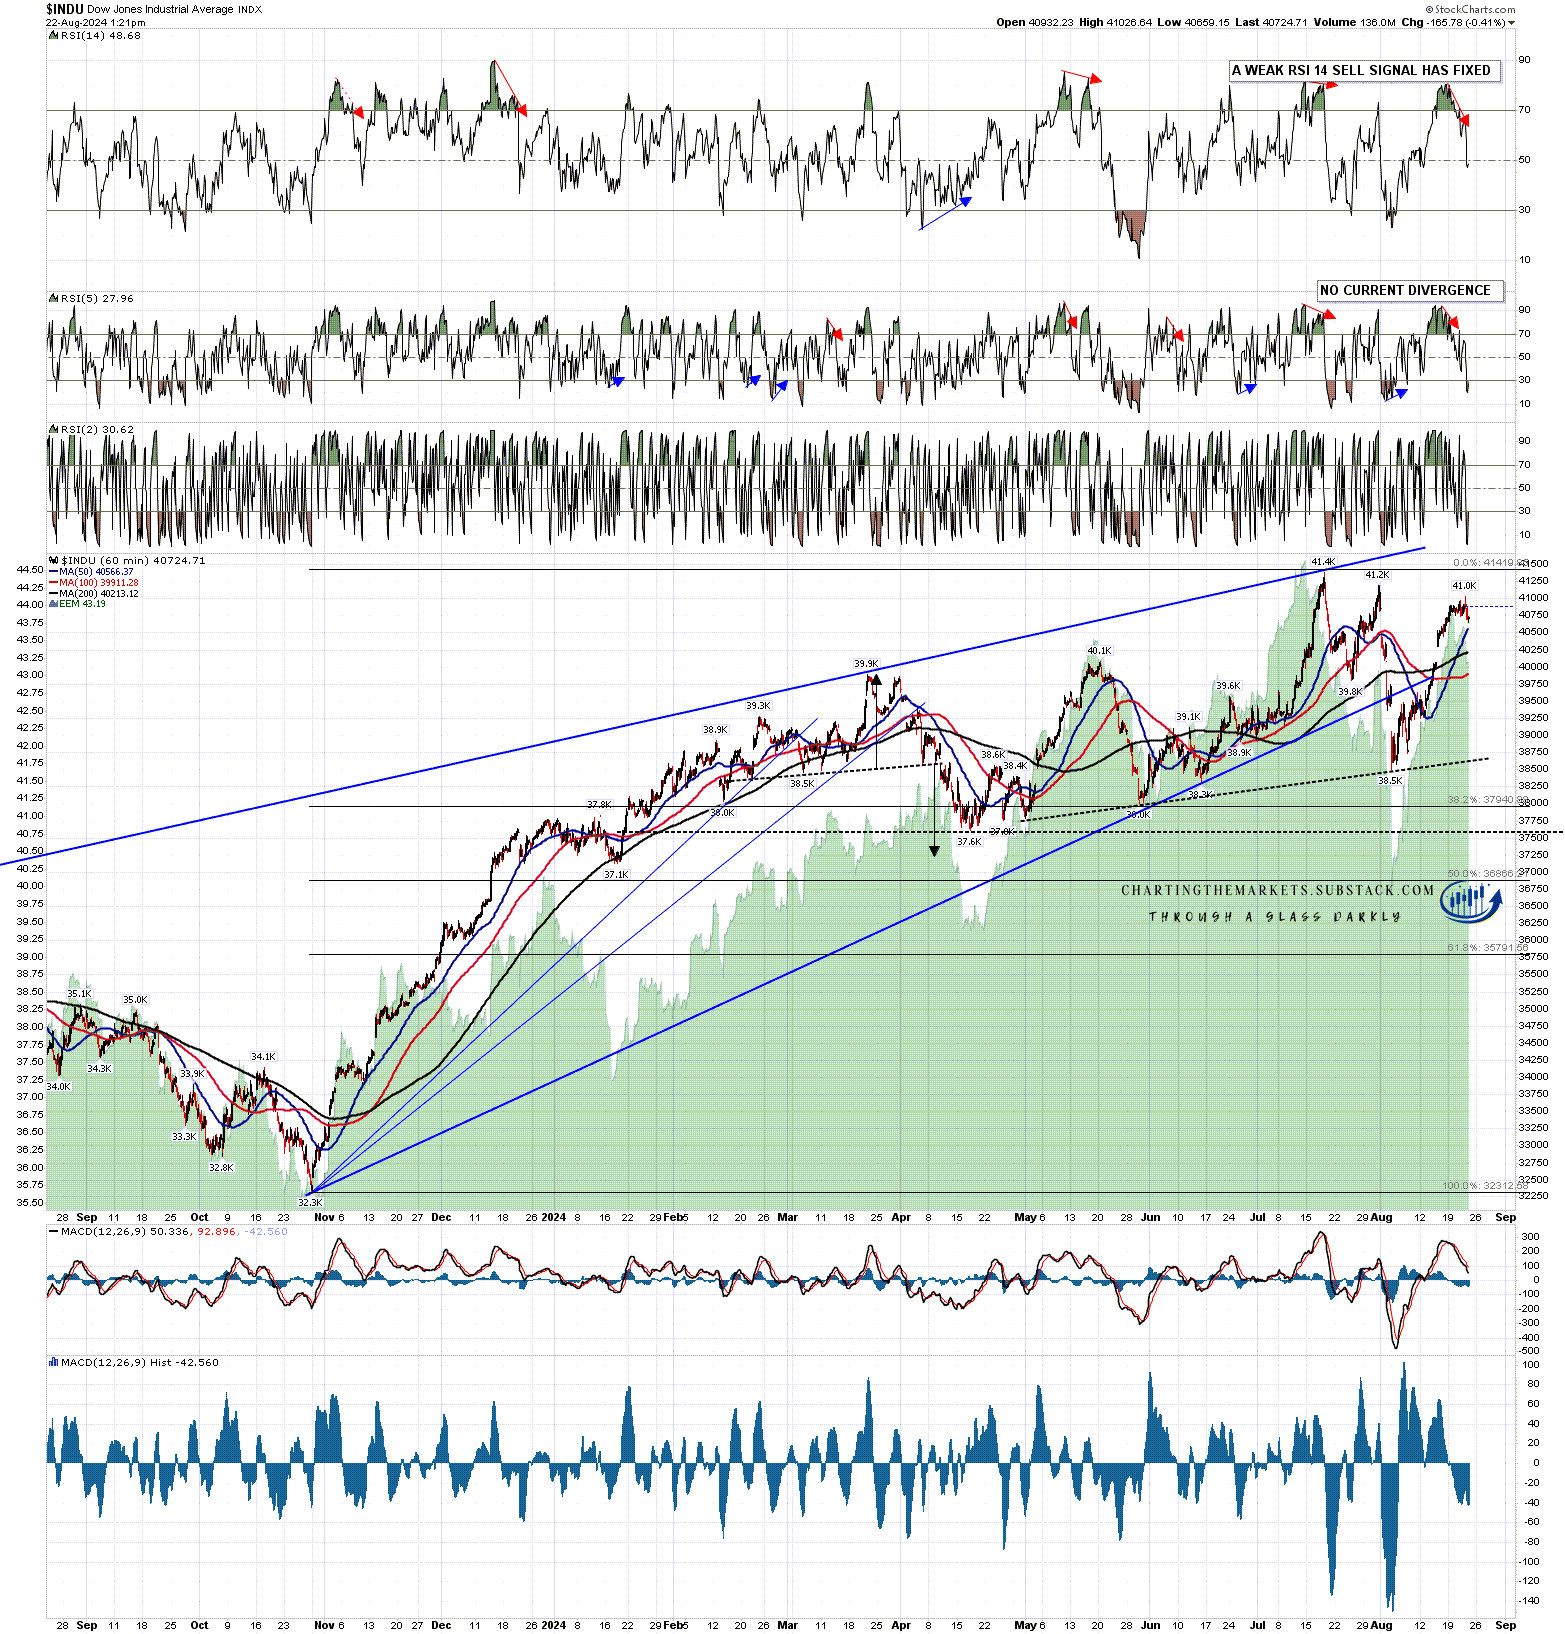
On IWM both a weak RSI 14 and a full RSI 5 sell signal fixed on the hourly chart yesterday afternoon, and the RSI 5 sell signal has reached target. I am watching the 50 hour MA now at 40,584, and the possible breakaway gap at 40,050 to 40,300, supported by the daily middle band now at 40,094.
We’ll see how far these retracements, but this is well overdue, and a decent retracement here will make it far easier to discern what may be coming next.
INDU 60min chart:
I’ve been saying all week in my premarket videos that if we see all time high retests without any meaningful retracement to form patterns, then these high retests would be unlikely to be the second highs of possible large double top patterns. I’m still doubtful about that, but today’s retracement improves the chances of getting a discernible pattern before we see those all time high retests which, on SPX and Dow particularly, will likely be seen in the next two or three weeks at most.
I’ve been setting up my new base at Substack over the last couple of weeks and I have set up three substacks to cover different areas of my work. These are as follows:
Equity indices & futures with a premarket webinar every morning. Weekly & monthly pivots posted every weekend. My main base for writing posts: -
Charting The Markets Substack
Crypto posts, charts & a premarket webinar every day. Weekly & monthly pivots posted every Monday: -
CTM Crypto Substack
Chart The Markets Crypto Substack
Bigger picture on equity indices, bonds, currency pairs & commodities. Two webinars a week, all the supporting charts on Sundays, and regular posts:
CTM The Bigger Picture
These are all the three I will be setting up for now. There will be plenty of free content across them & all are welcome.
No comments:
Post a Comment