
Last week I was writing about the inflection point that Crypto had reached short term, and they are still in that same inflection point, with a decision really needed in the next day or two if Crypto are going down any further, so a couple of days more uncertainty will considerably increase the odds of a break up.
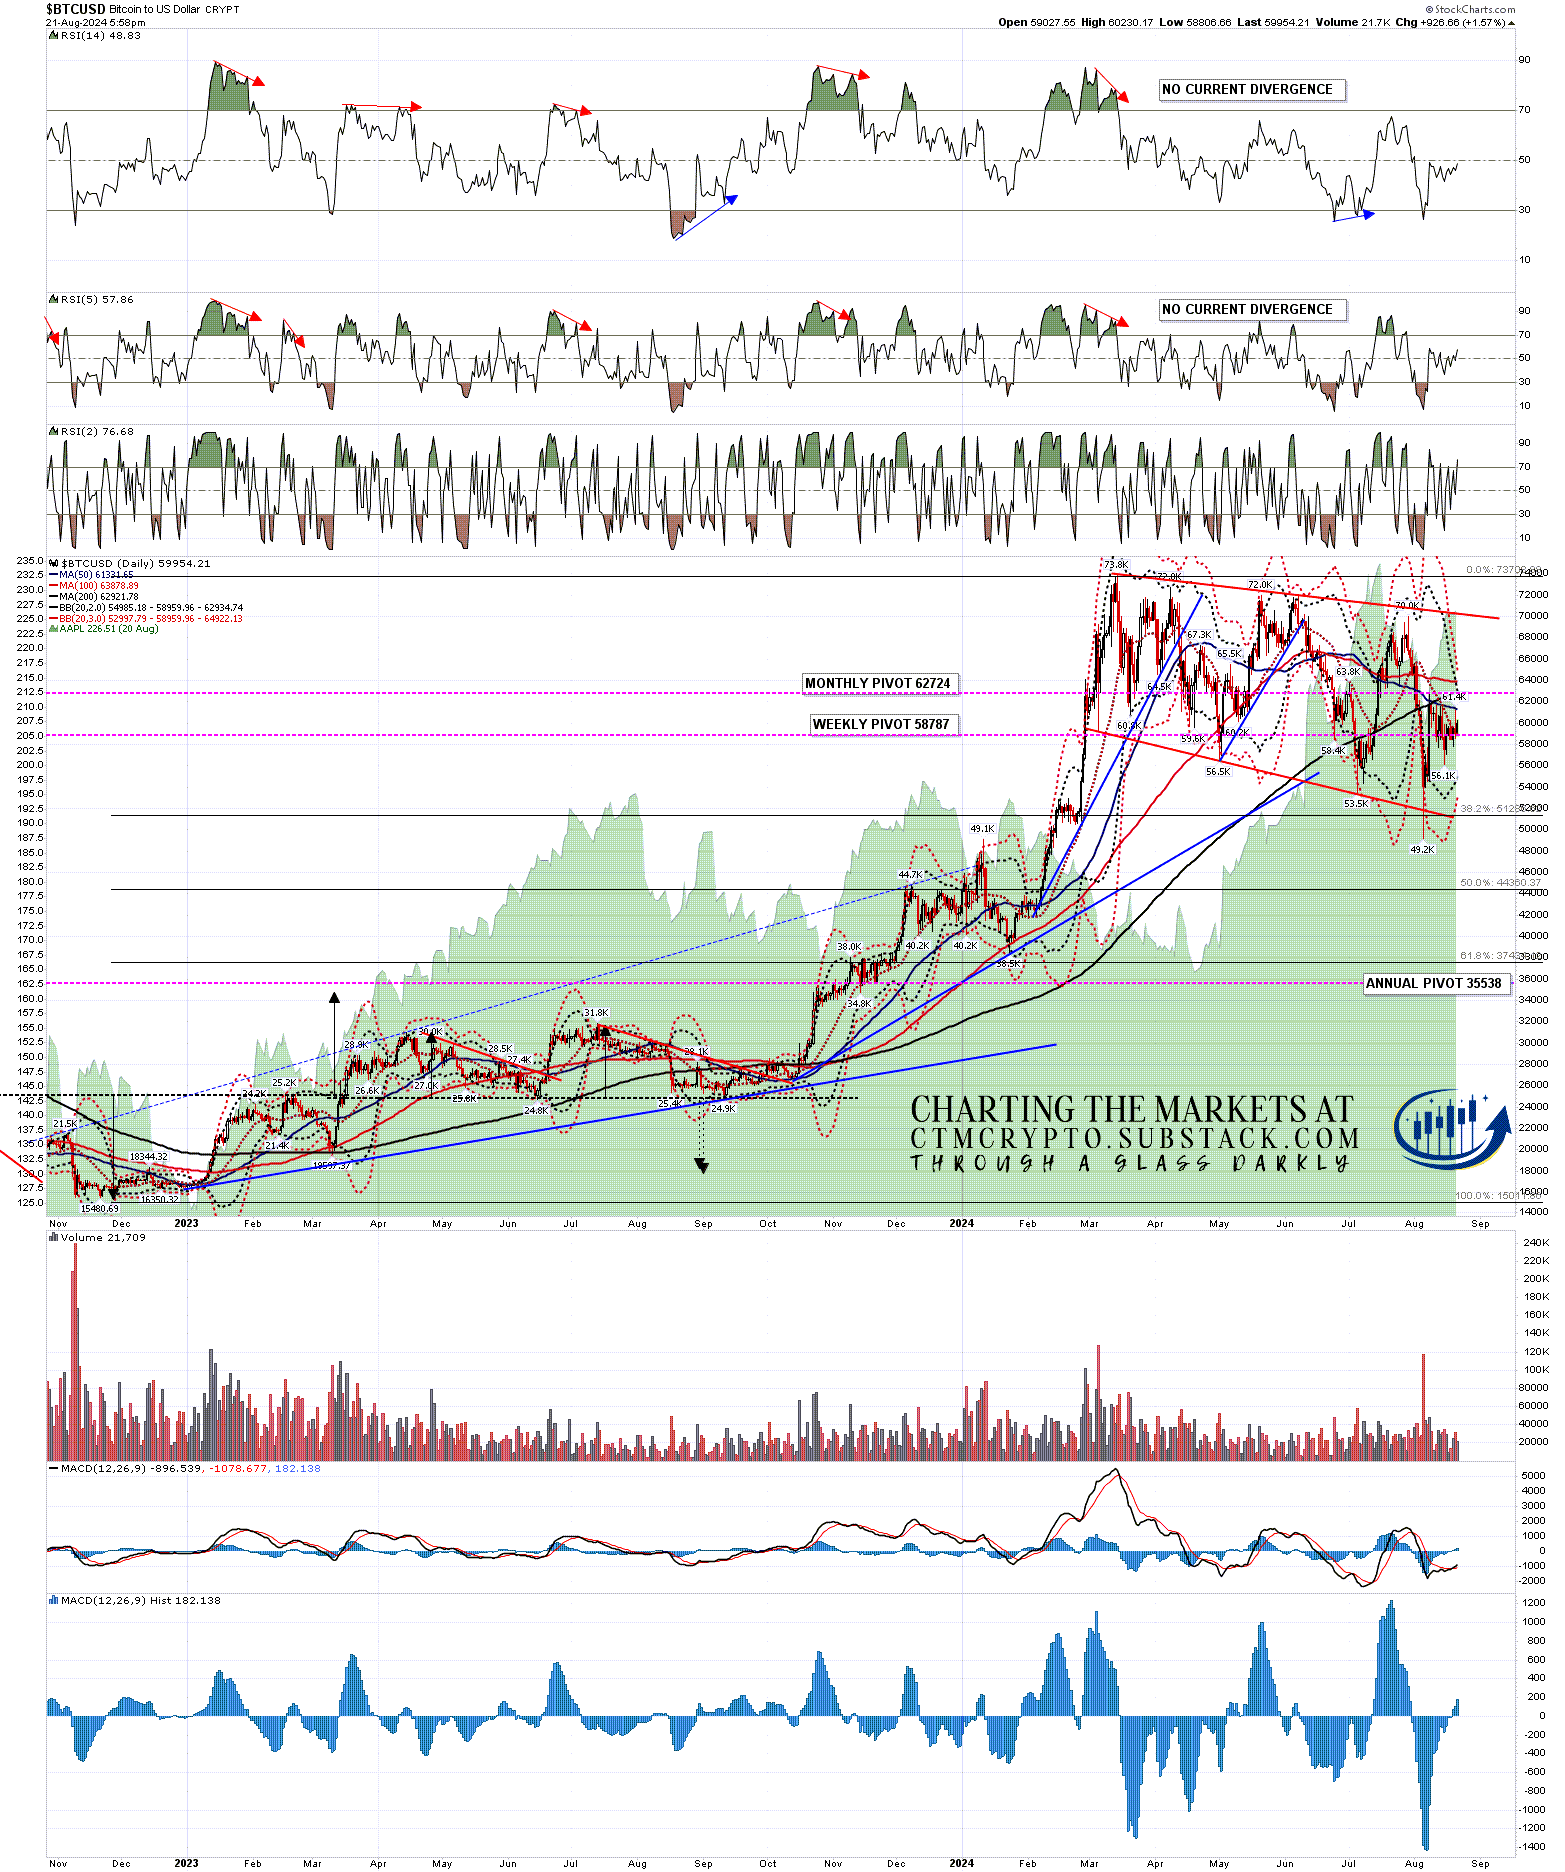
The overhead resistance is, mostly, at the daily middle bands. I say mostly because BTCUSD (Bitcoin) has already broken back above it on Monday and tested the 50dma, though it failed there and closed back below the daily middle band yesterday and so failed to confirm Monday’s break above.
BTCUSD daily chart:
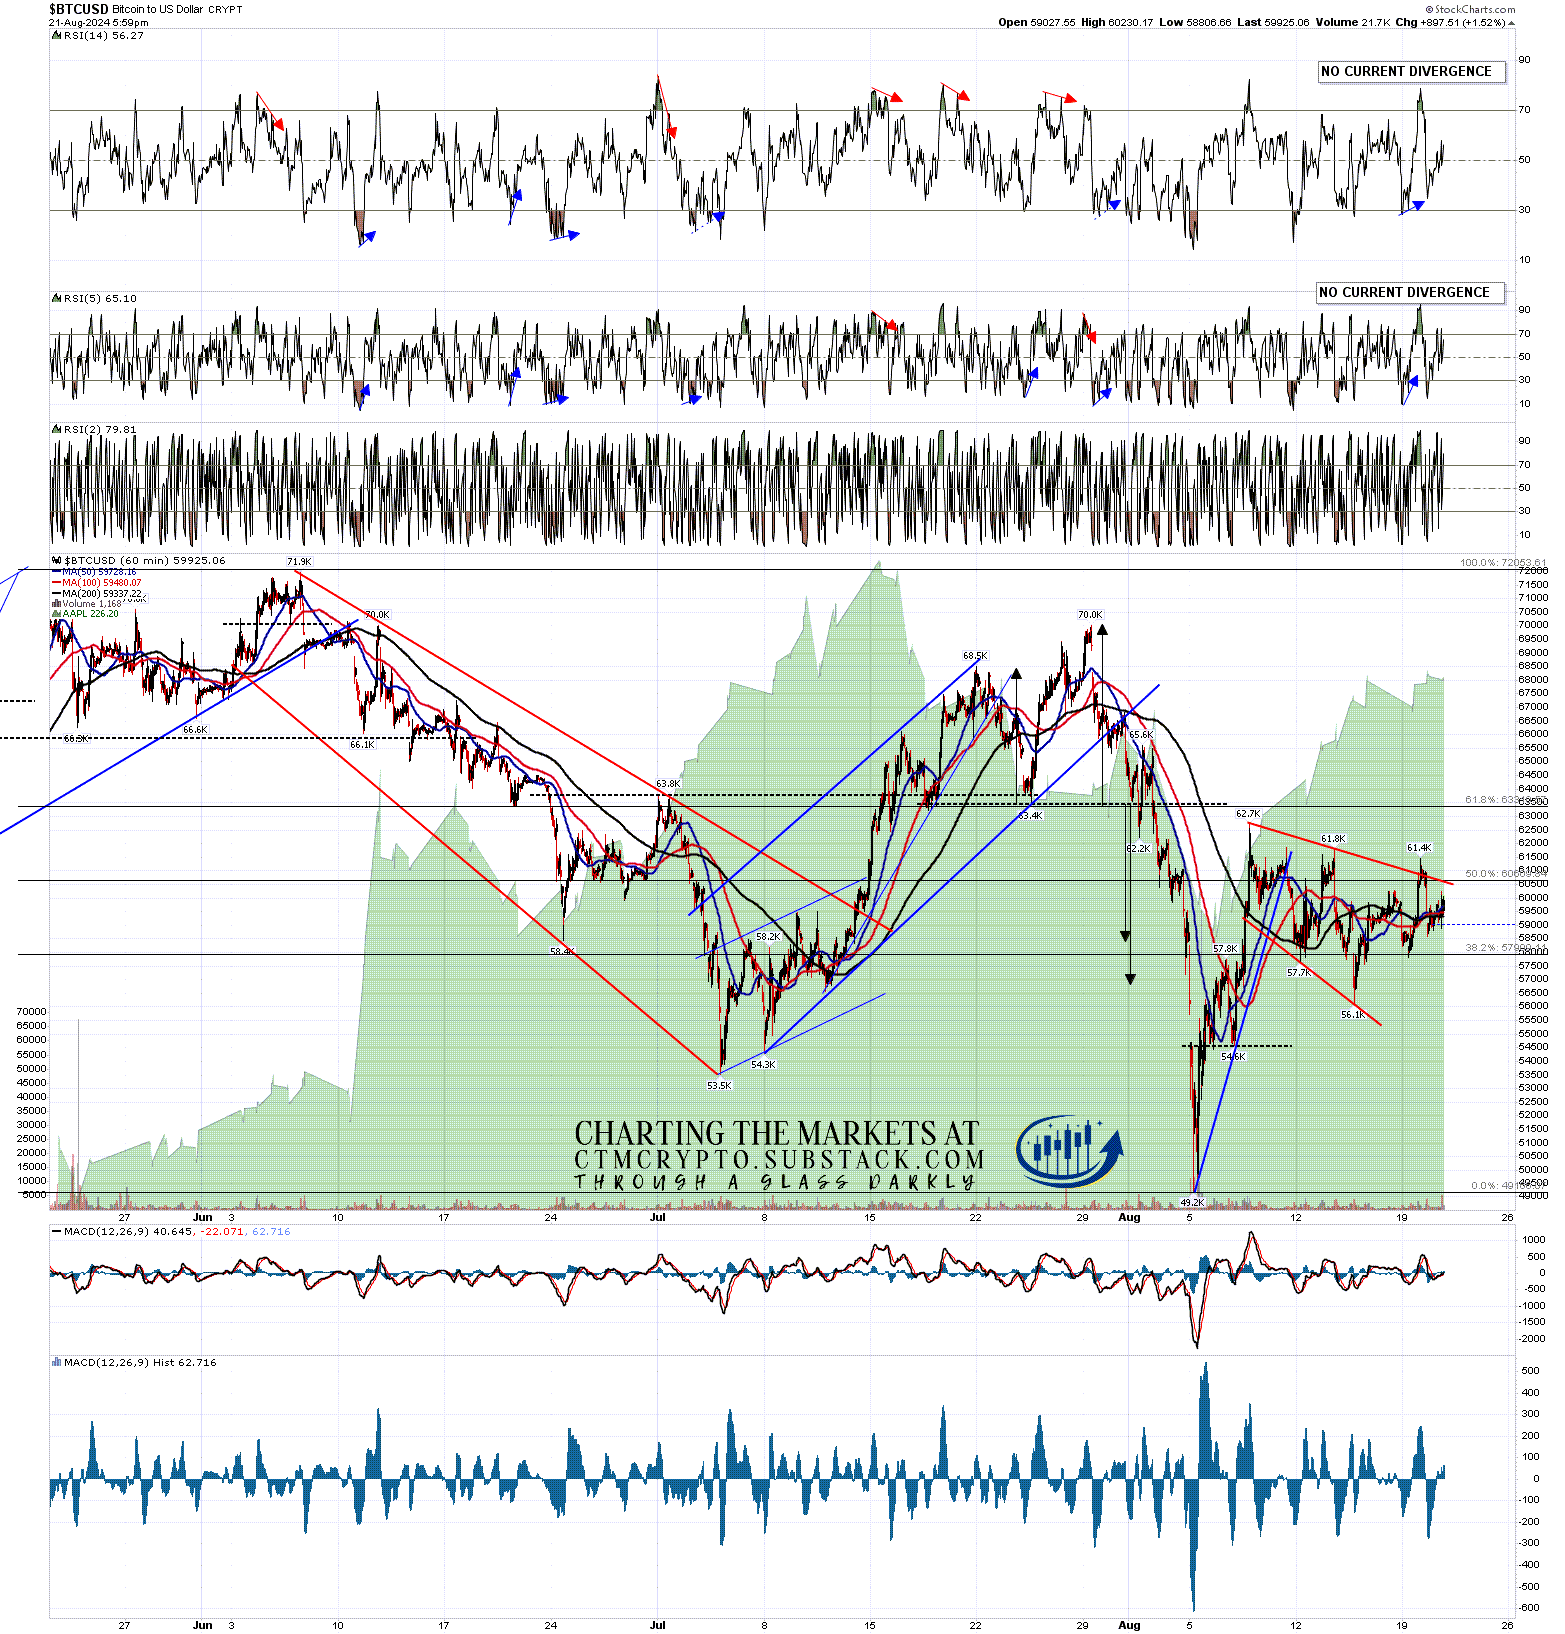
On the hourly chart the setup looks like a small bull flag that has broken up with a target in the 62.7k area, but in the absence of a sustained break over the daily middle band, Bitcoin may go a bit lower first.
BTUSD 60min chart:
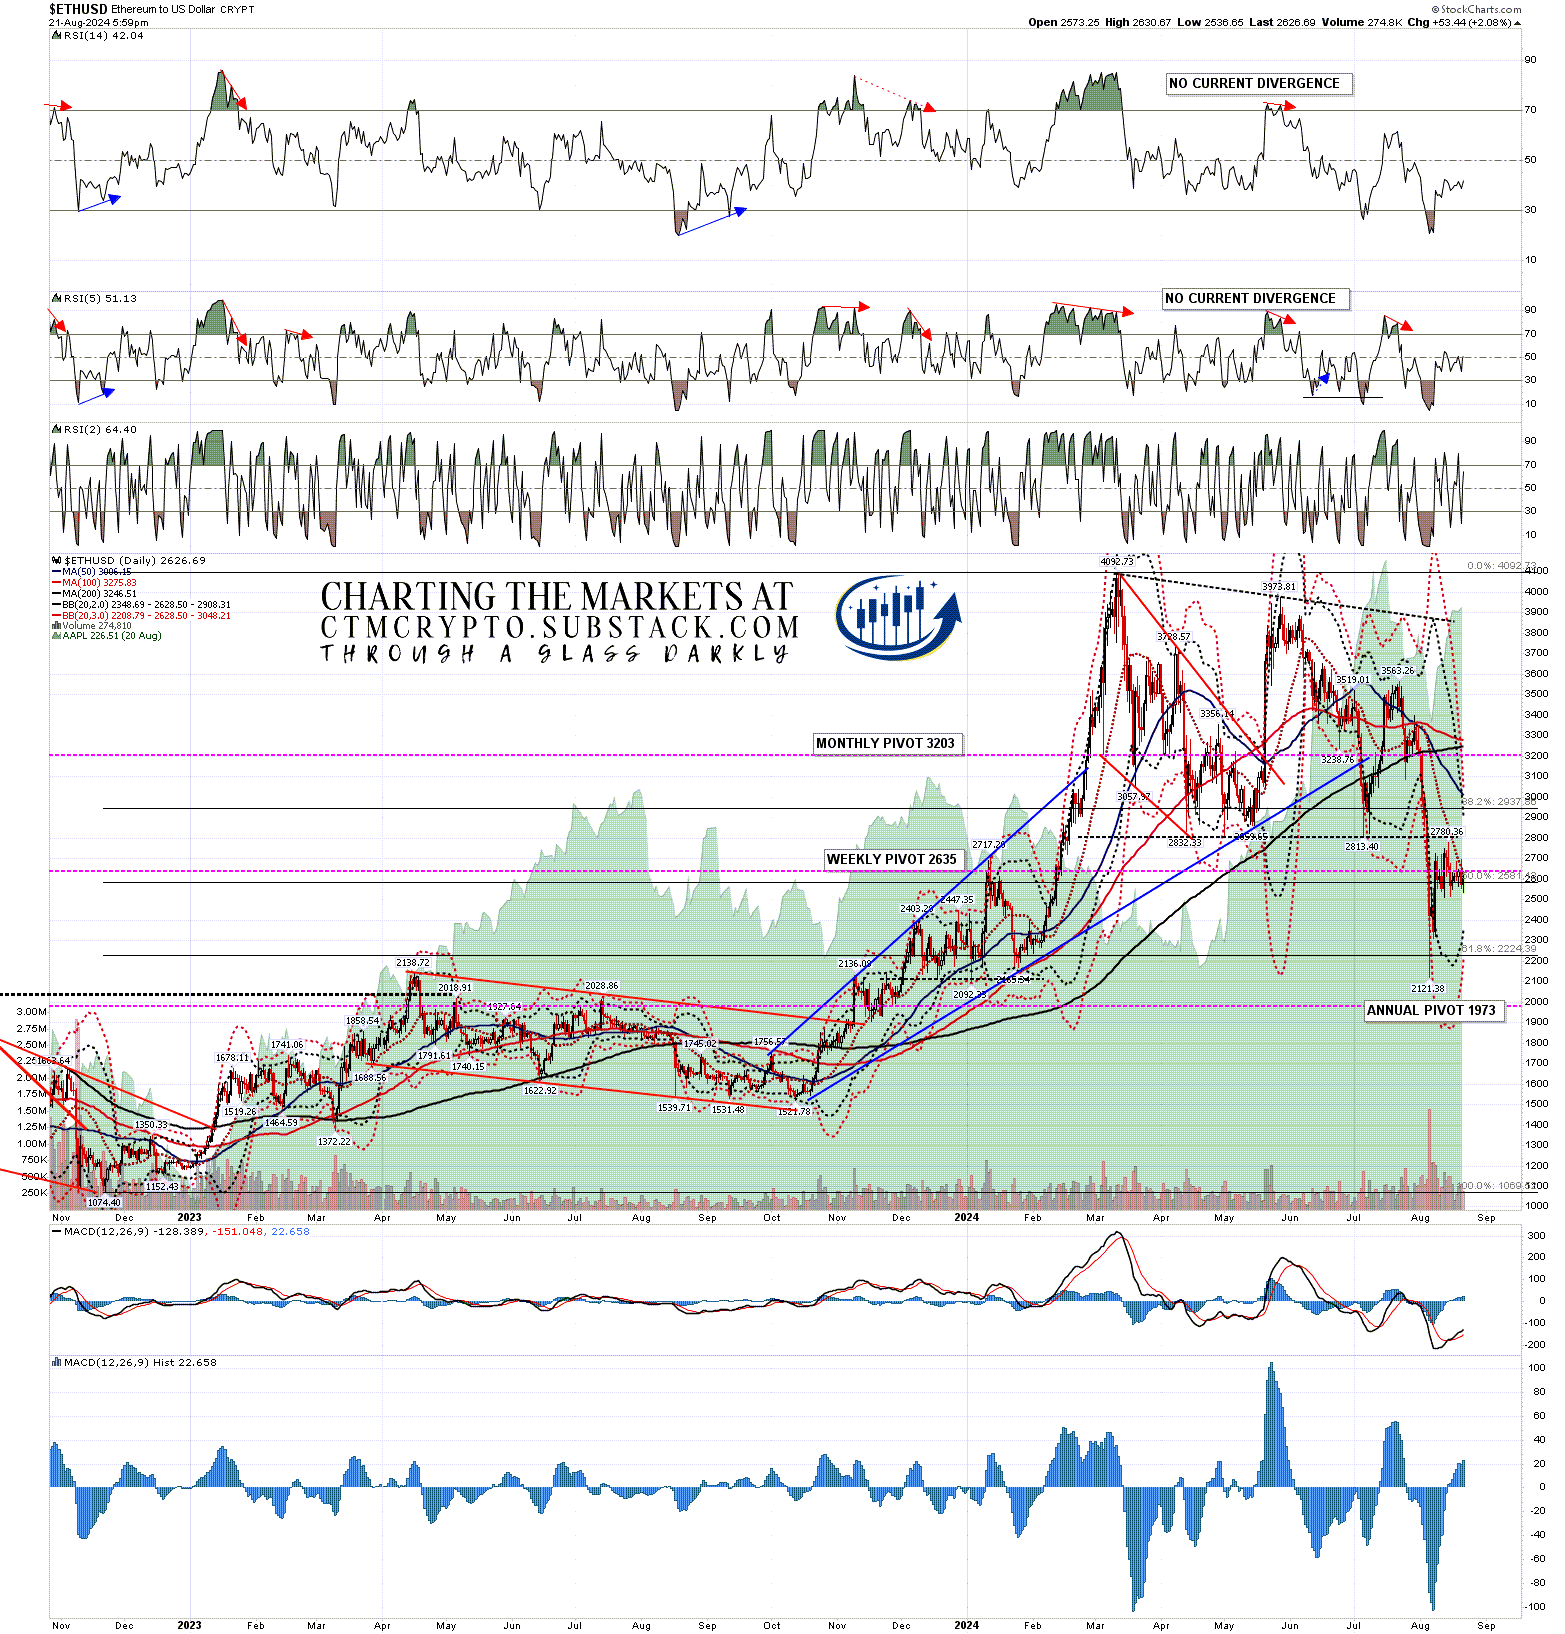
On the daily chart ETHUSD (Ethereum) is so far failing at the daily middle band and ….
ETHUSD daily chart:
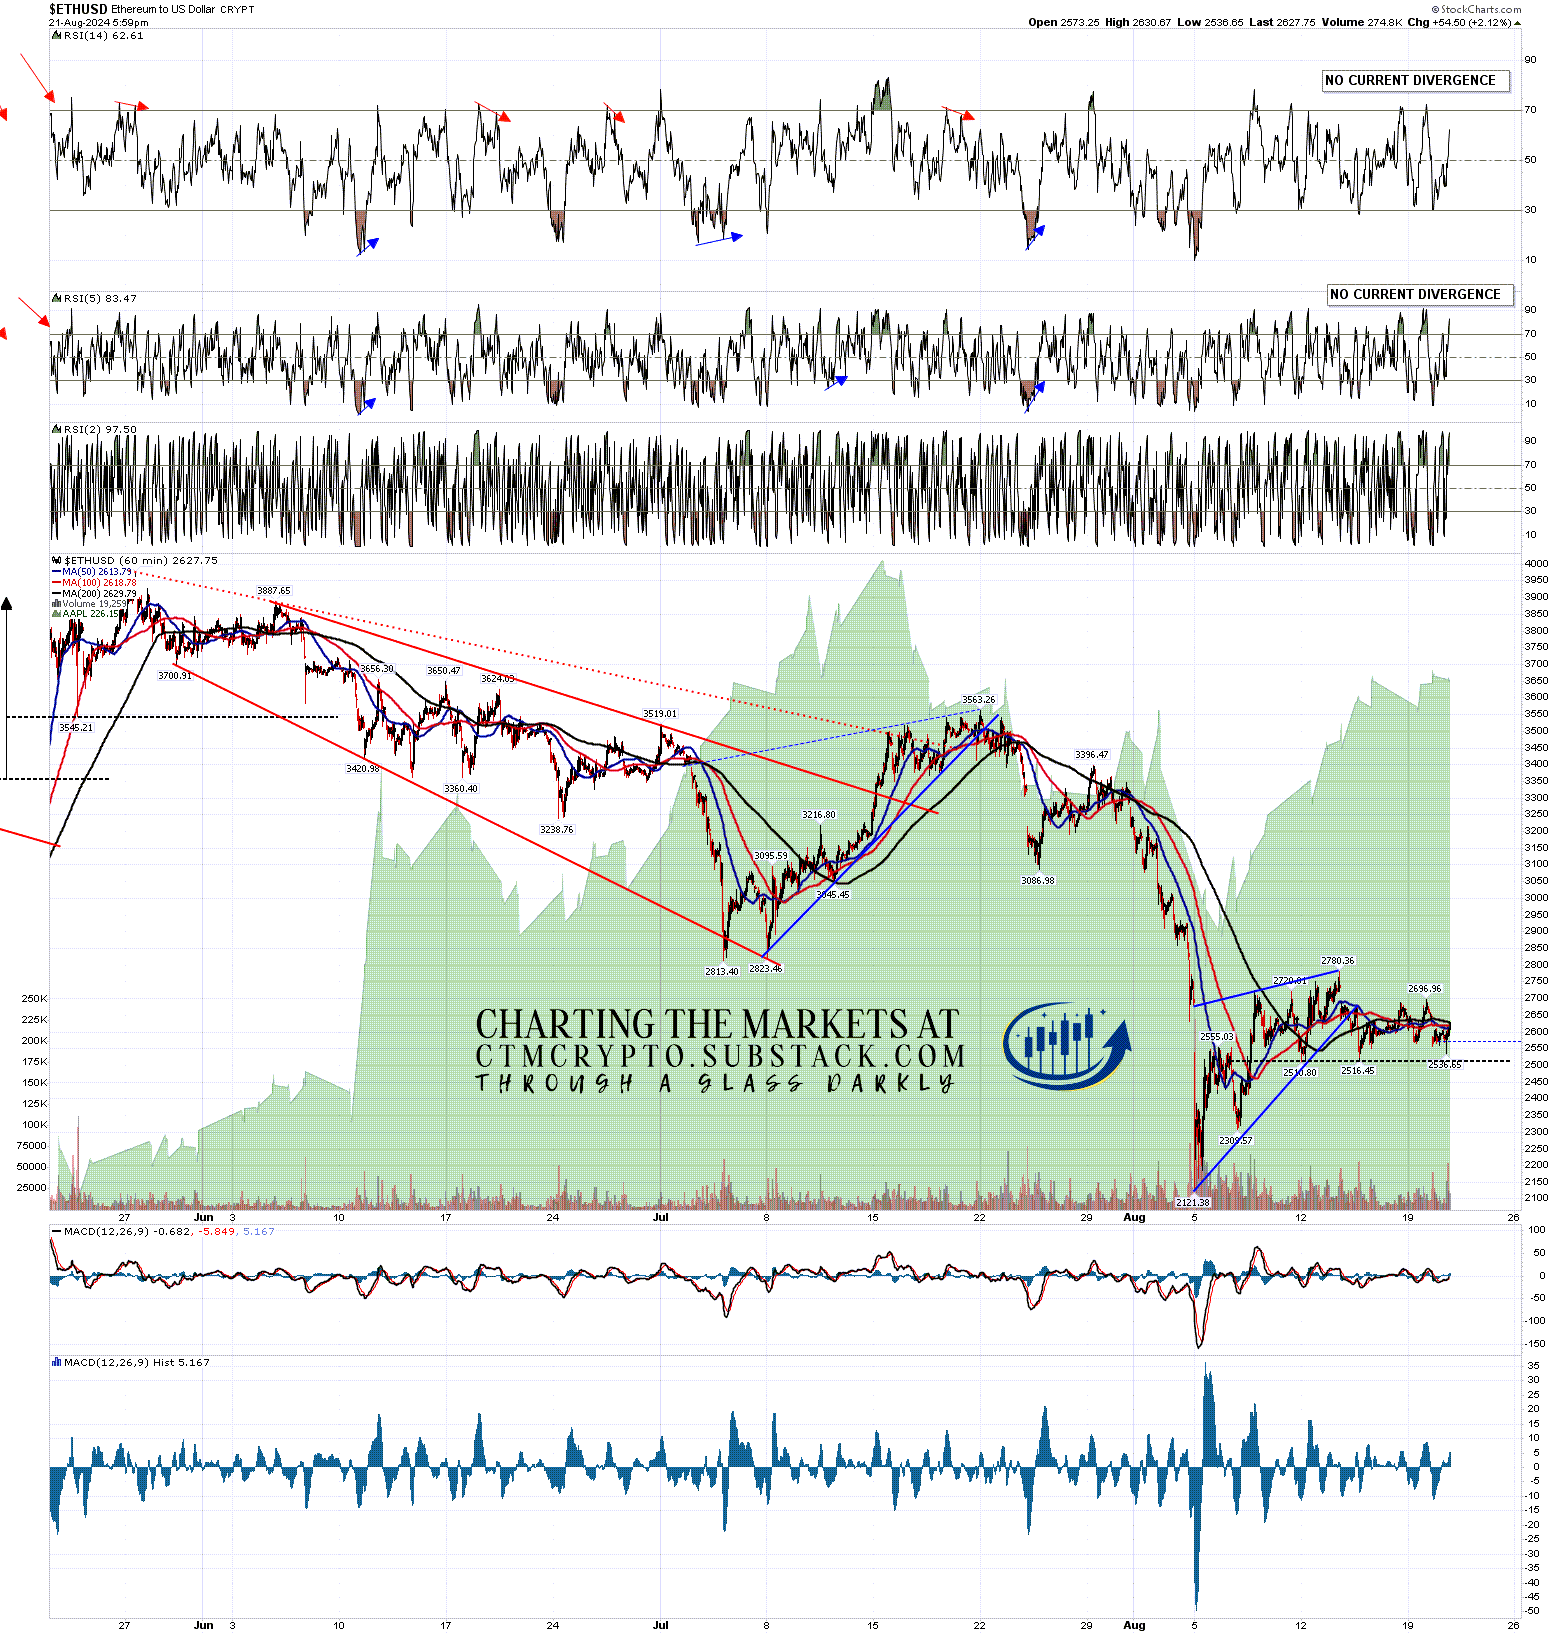
…. on the hourly chart a very attractive H&S setup has formed that on a sustained break below the 2520 area would look for the 2255 area. The right shoulder is now significantly longer than the left and if this is going to break down as an obvious H&S I’d be expecting that to happen today or tomorrow. After that the odds of at least a short term high retest on Ethereum are considerably higher.
ETHUSD 60min chart:
SOLUSD (Solana) has also clearly been failing at the daily middle band so far and on Solana there is also ….
SOLUSD daily chart:
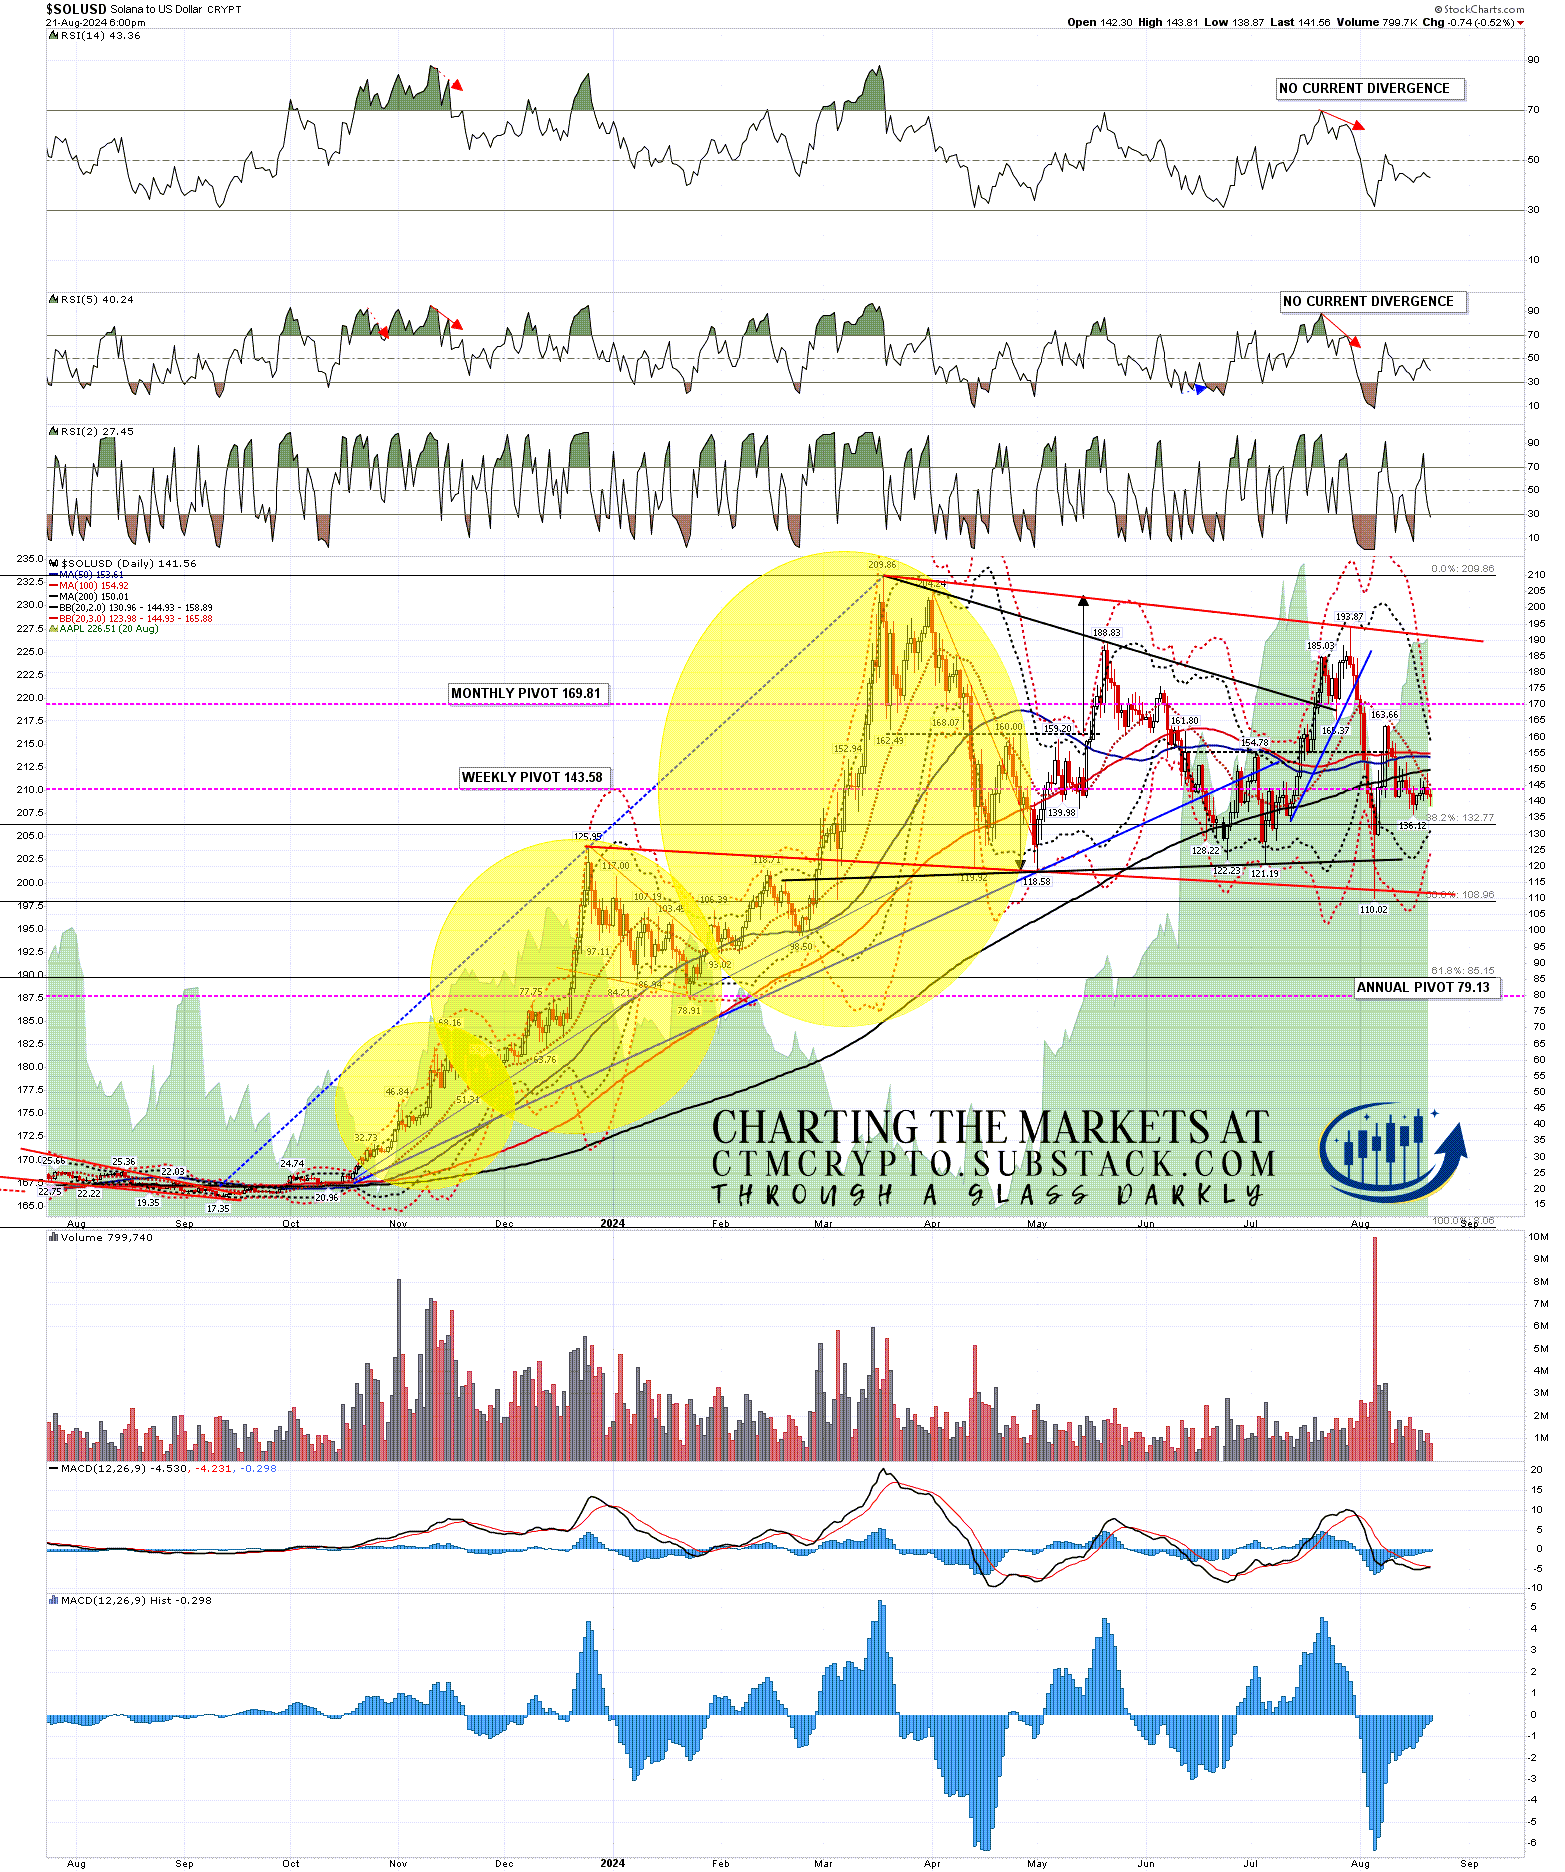
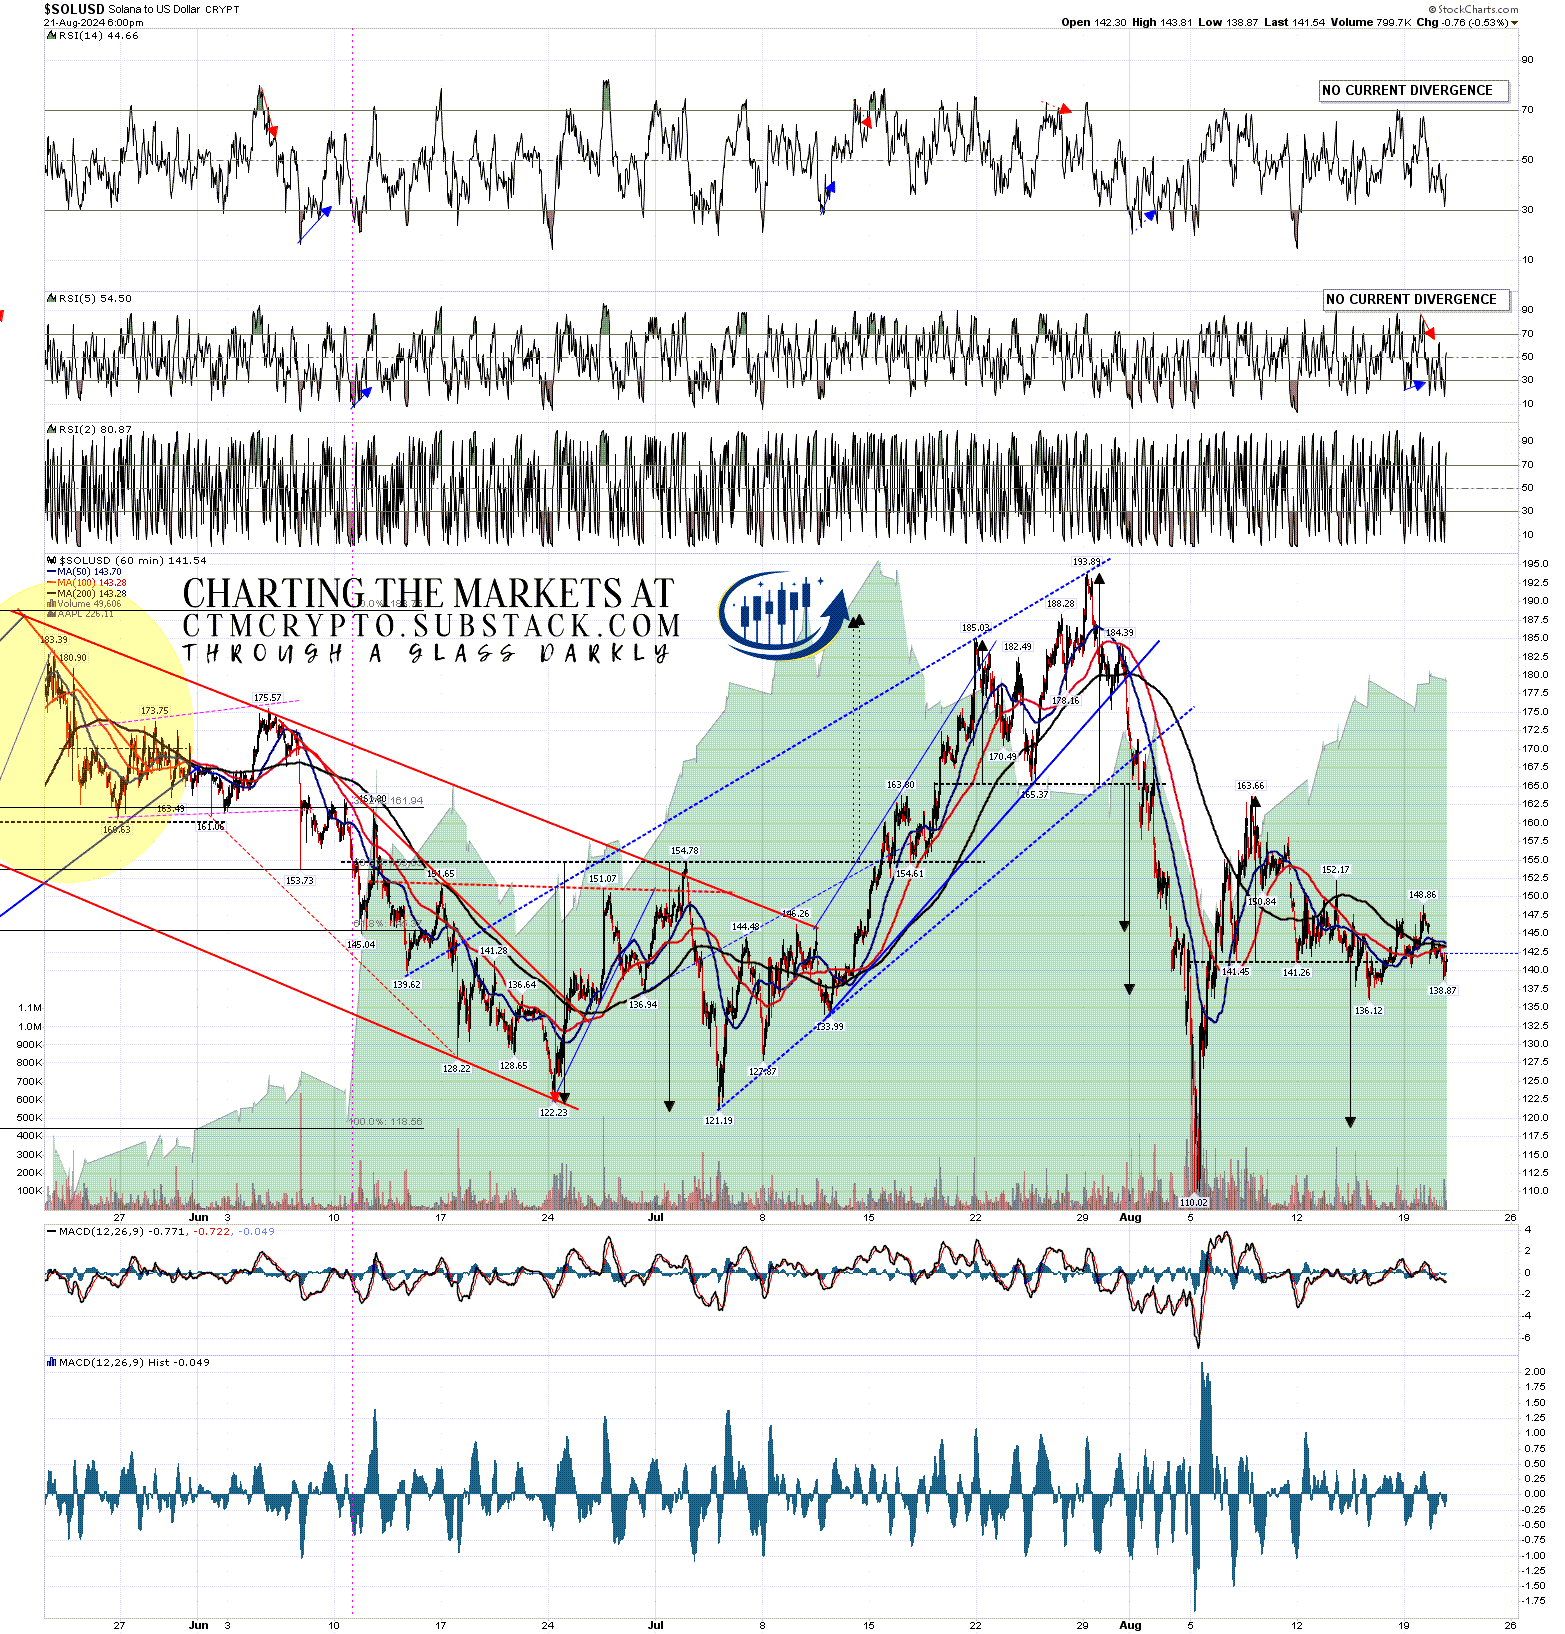
…. a clear H&S that has already broken down with a target in the 119 area. Solana has mostly been trading a 138 to 149 range since then, but until Solana can fail the H&S with a move that exceeds the right shoulder high at 152.17, the 119 target is very much still in play.
SOLUSD 60min chart:
If you are enjoying my crypto posts please make sure you subscribe (for free) at my Crypto SubStack below:
I'm also to be found at Arion Partners, though as a student rather than as a teacher. I've been charting Cryptos for some years now, but am learning to trade and invest in them directly, and Arion Partners are my guide around a space that might reasonably be compared to the Wild West in one of their rougher years.

No comments:
Post a Comment