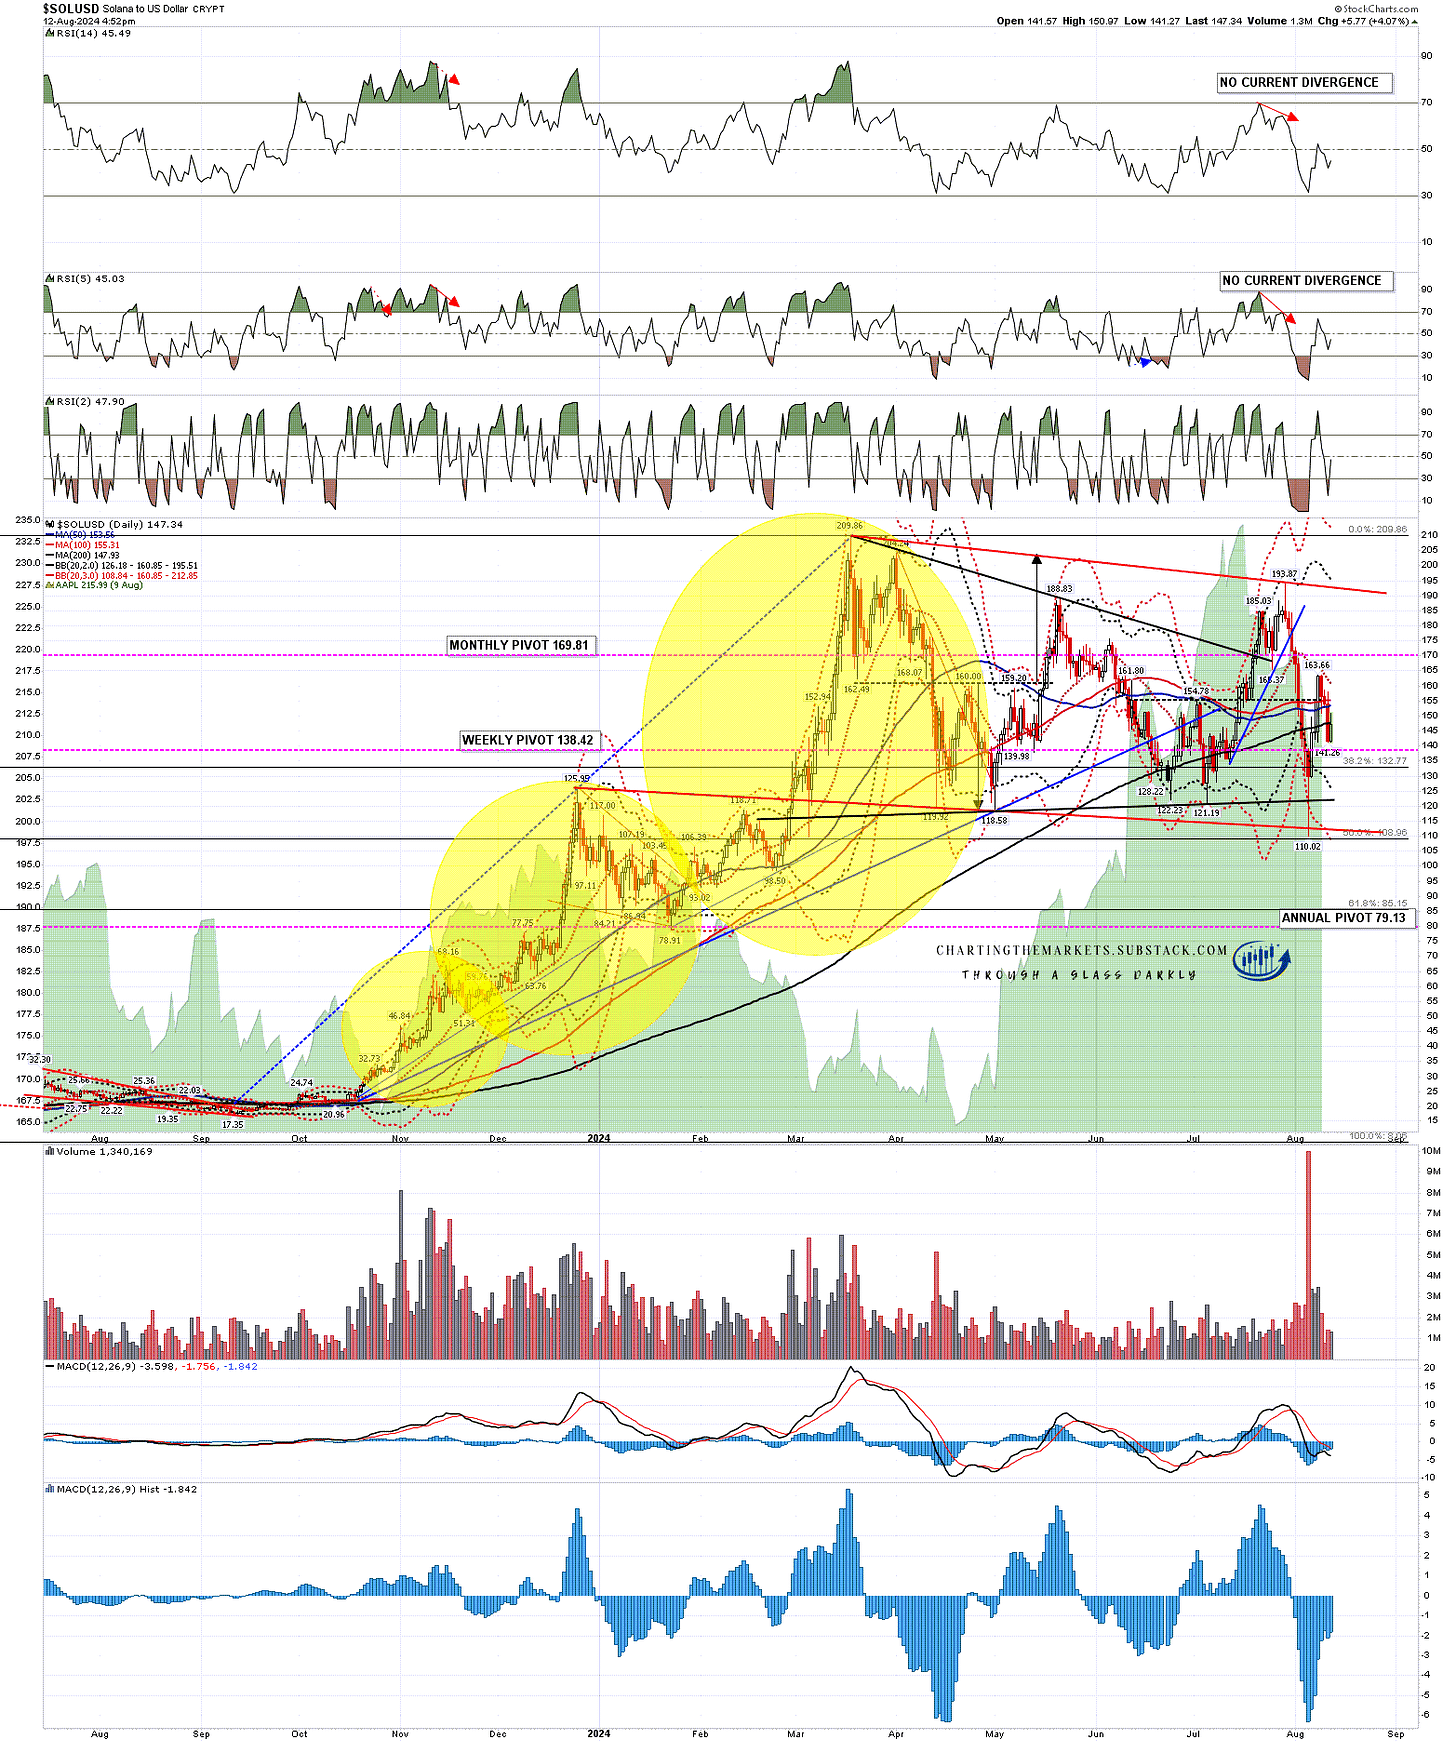
A decent looking low on crypto was made a few days ago. On the bigger picture these are likely bull flags forming on BTCUSD (Bitcoin), and SOLUSD (Solana), and probably on ETHUSD (Ethereum) as well, though the setup is muddier there. All three are still below their daily middle bands though and, while that remains the case, we could still see lower lows before they likely go higher.
SOLUSD daily chart:
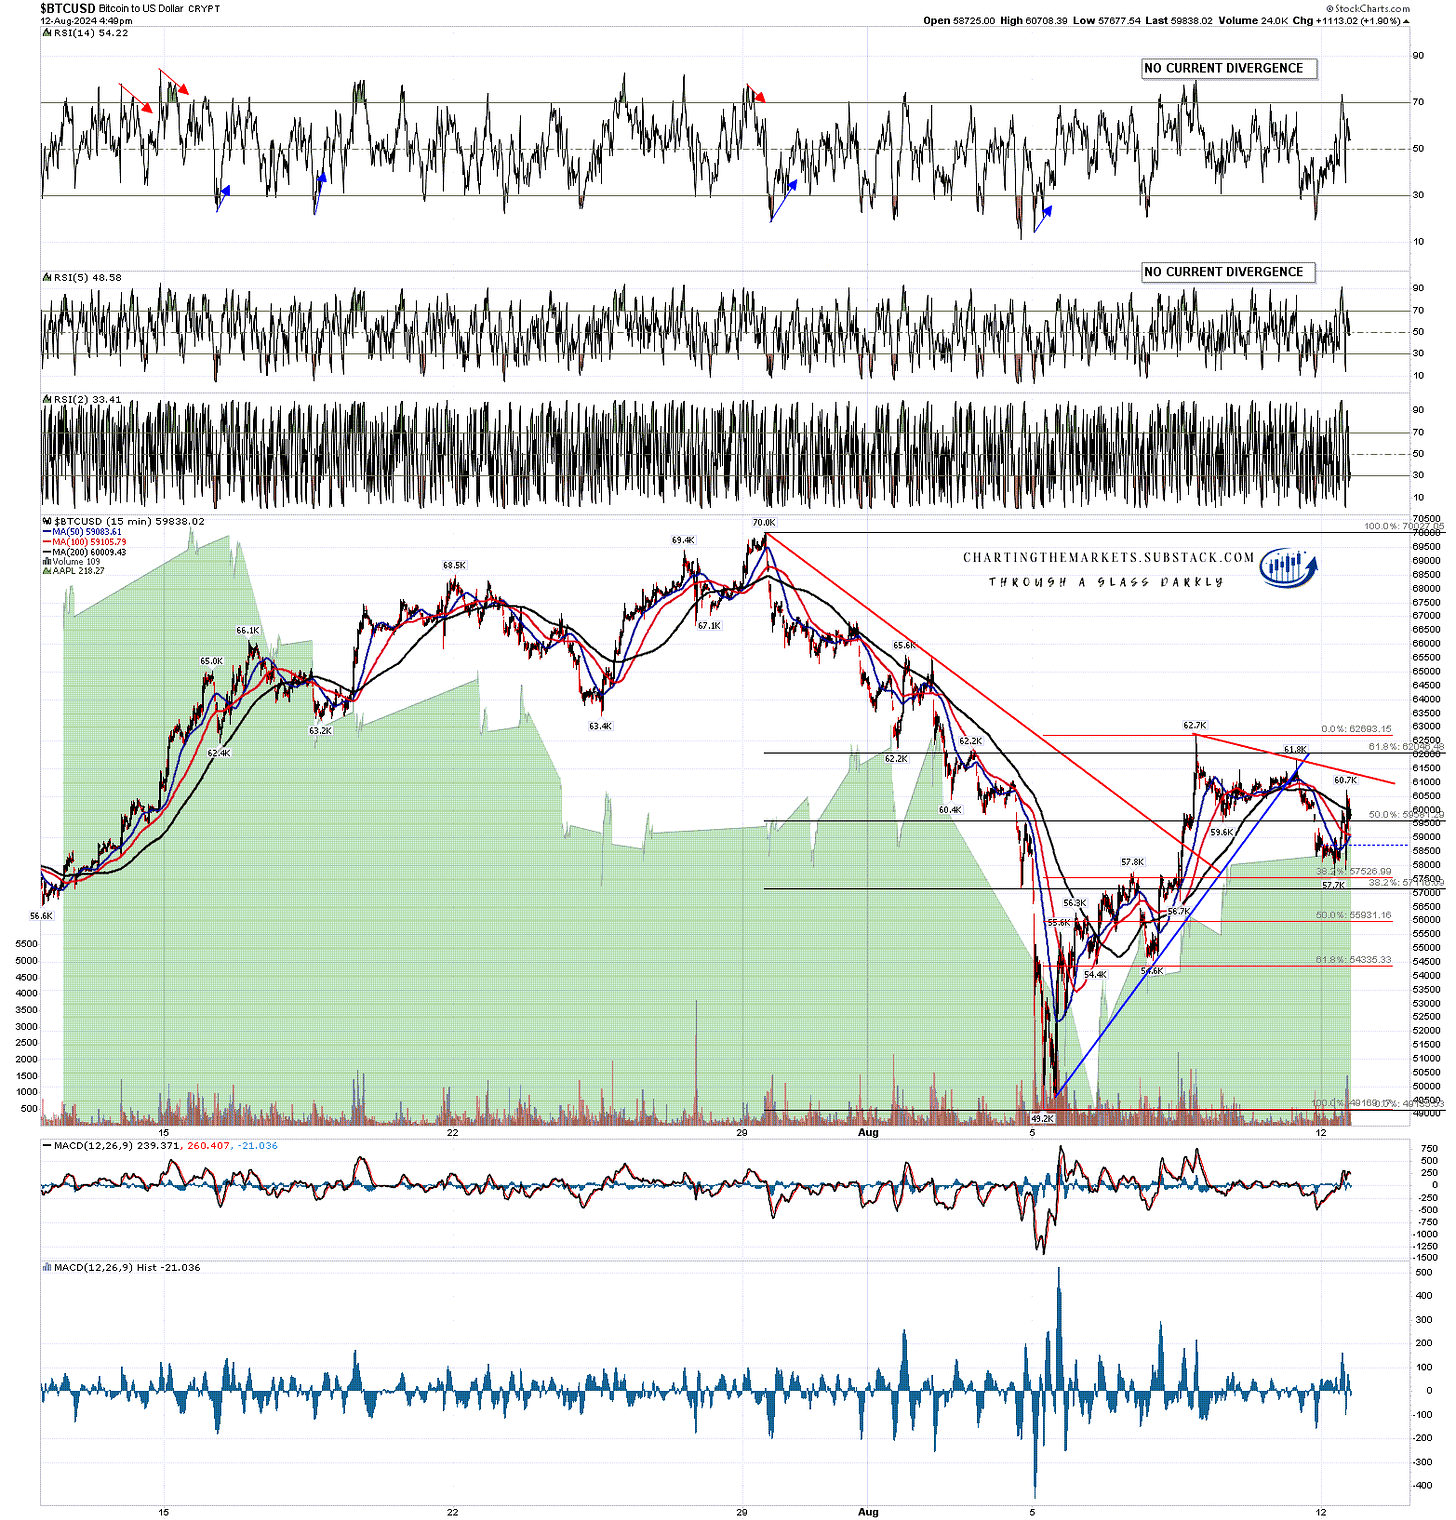
So how are they looking short term? Well Bitcoin had a decent looking retracement over the last couple of days that looks like a small bull flag forming.
BTCUSD 15min chart:
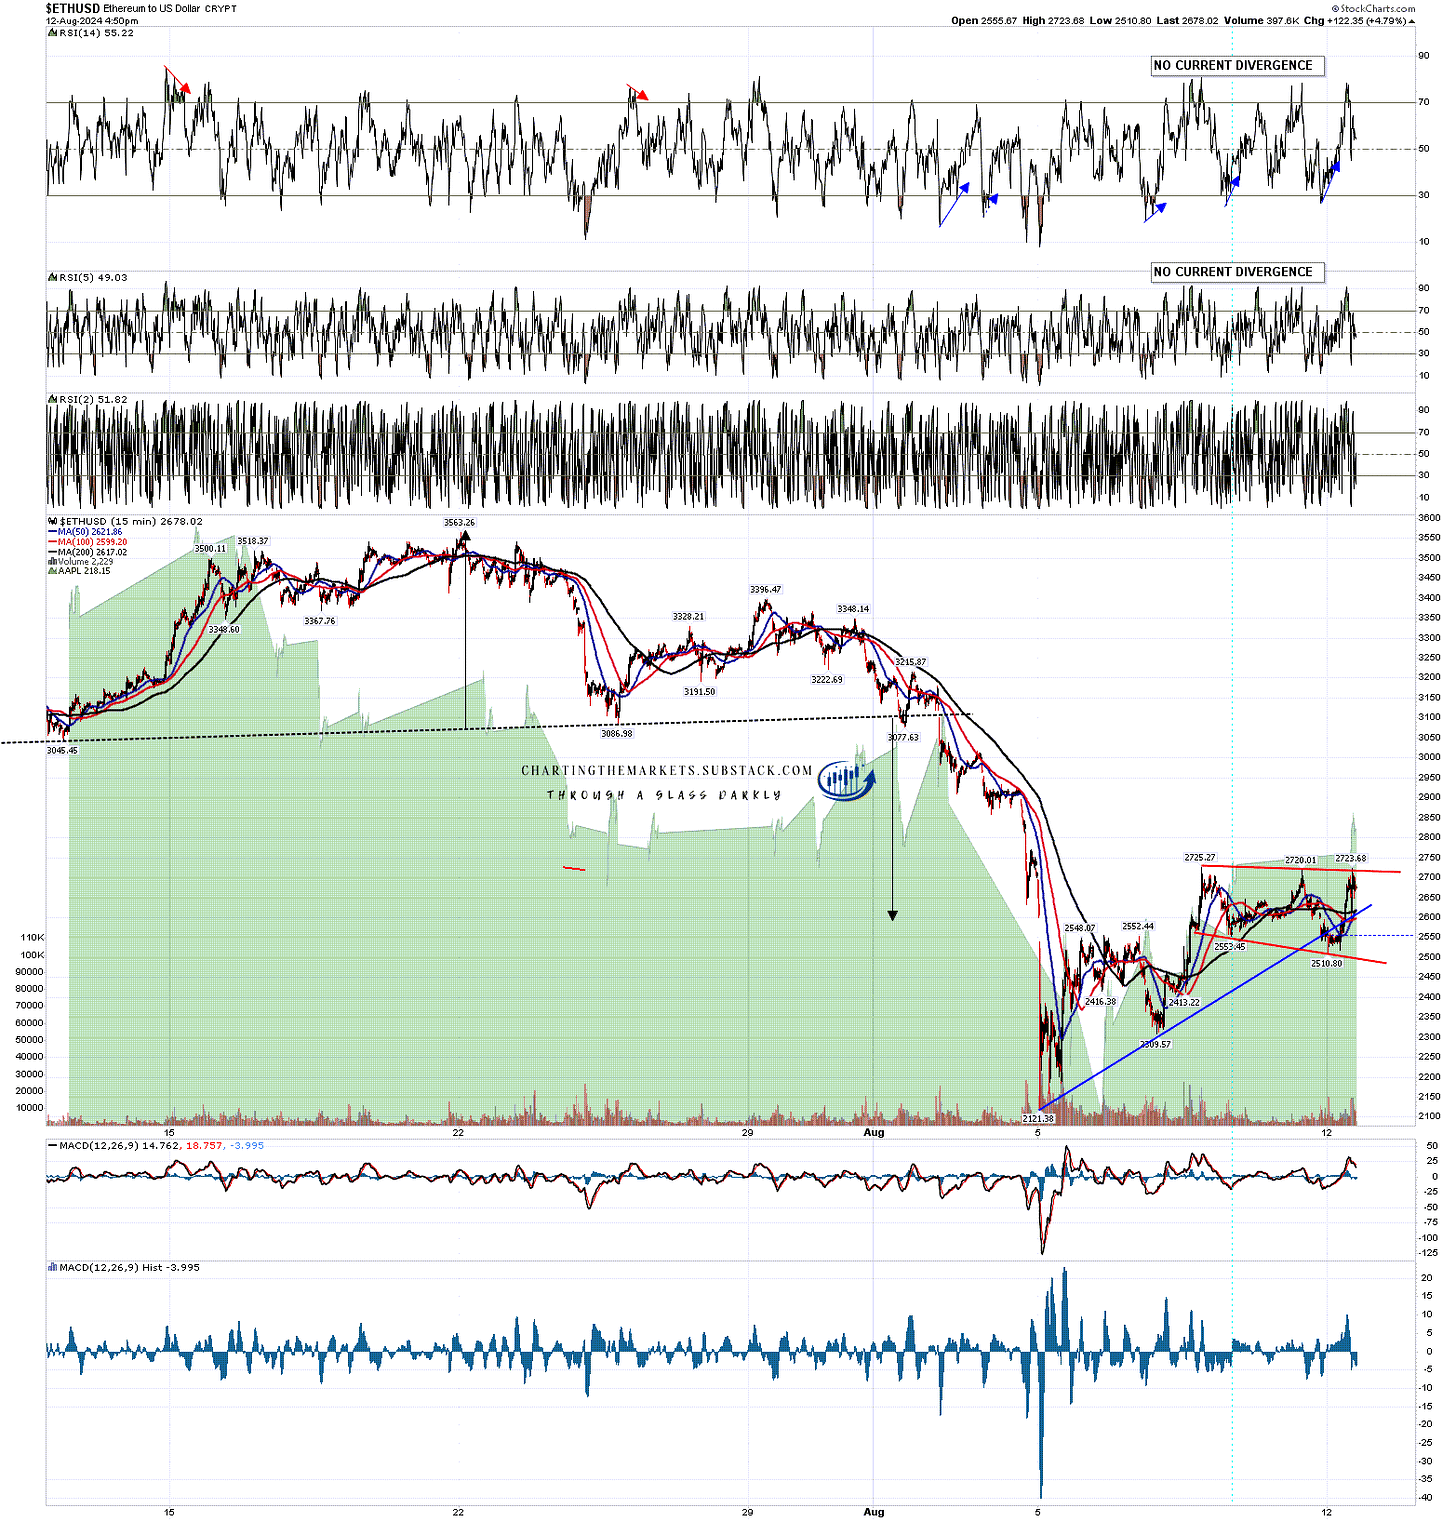
Ethereum has also retraced and also looks like a small bull flag, with the best looking bull flag setup of the three.
ETHUSD 15min chart:
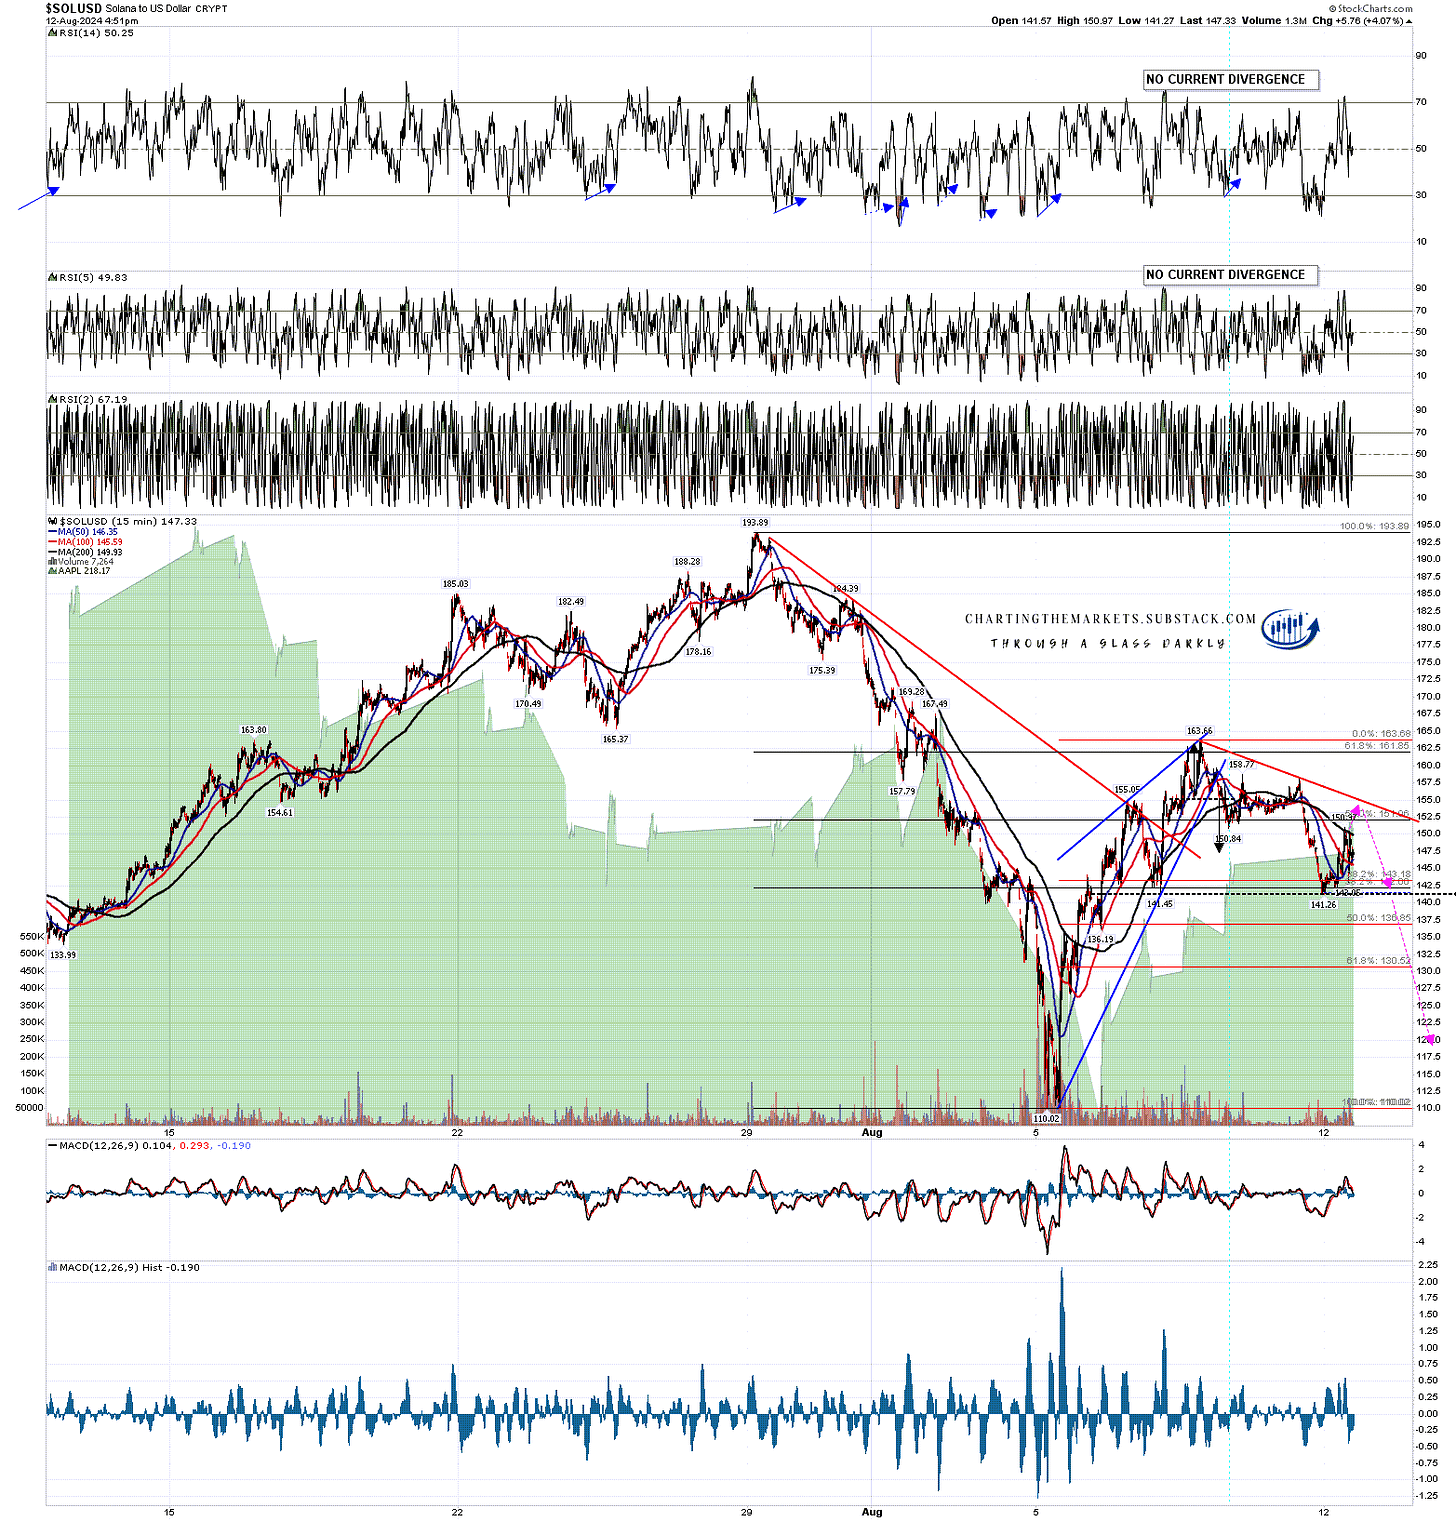
On Solana though, this looks more interesting. While this might also be a small bull flag forming, Solana came down and tested a possible H&S neckline, and may be forming the right shoulder on an H&S that would have an ideal right shoulder high in the 155 area.
If this H&S were to complete and break down then the H&S target would be in the 119 area, opening a possible retest of the low at 110. Could that be the second low of a double bottom? Just about, though it would be oversized.
SOLUSD 15min chart:
There’s no strong reason to look for a low retest on Solana here, with a better case to be made for low retests on both Bitcoin and Ethereum, but if we were to see that possible H&S on Solana deliver then we might well see those low retests on Bitcoin and Ethereum as well of course. The inflection point trading range is 142-156. A sustained break either way likely settles the direction of the next move.
My friend Matt has a company helping people navigate their way through the cryptosphere. His website is now up and running and worth checking out. I’m not a part of that operation but I am a member and it is an excellent service.


No comments:
Post a Comment