- WE'RE JUST RANDOM SPECKS OF DUST IN A TORNADO TO THE MARKETS .......
- CHARTISTS MUST PUT ALL BIAS ASIDE AND LET THE CHARTS DO THE TALKING OR WE'LL SEE ONLY WHAT WE WANT TO SEE
- This blog has a copy of all header posts that I publish anywhere, so that those interested in seeing what my thoughts are on the markets can find them easily.
- I will be answering questions and responding to comments, so feel free to respond to any posts and I will see your comment even if it is not on the most recent post.
- If you're interested in seeing any intraday charts I post, I do that on twitter, and my twitter handle is @shjackcharts.
- The charts in the posts are as large as I can practically make them. if you would like to look at one more closely, click on it, and the link will take you to a larger version at screencast. If you click on that again, you will get a full page version, and can use the resizing function on your browser to enlarge parts of interest further.

Monday 27 July 2020

Possible H&S Forming Here

SPX didn't quite reach the 3290 bull scenario target area that I was talking about last week but made a respectable 3280 or so before rejecting back into a retest of the established support and possible H&S neckline in the 3200 area. The SPX hourly RSI 14 sell signal reached the possible near miss target and an RSI 5 buy signal has now fixed. 

Interestingly the high last week established a possible new rising wedge resistance trendline from the March lows, which is a development that I'm watching with interest, as the retracement since has broken rising wedge support and has put SPX into a possible topping process. 

SPX 60min chart: 

In a topping process the first thing I look for is the formation of a reversal pattern, and there is a very nice H&S that may be forming at the moment. The ideal right shoulder would be in the 3240 which is pretty close to the 3237 area high today at the time of writing. A sustained break below 3200 would look for the 3120 area, but the break down might fail at the daily middle band, which held the last two retracements and is currently in the 3186 area. 

Against a reversal directly from here on SPX though I'd note that neither the hourly RSI 5 buy signal nor the 15min RSI 14 buy signal has made the possible near miss target area yet, and none of the open hourly buy signals on ES, YM, DAX or ESTX50 have reached those either, though the hourly buy signal on NQ has reached the possible near miss target.

SPX 15min chart: 

Further downside looks promising on the NDX daily chart, where the RSI 14 sell signal finally fixed last week. 

NDX daily chart: 

..... though I'd note the perfect bull flag channel on the NDX hourly chart that is suggesting a high retest. NDX needs to break that channel support to open the downside.

NDX 60min chart: 

The DOW chart also has me wondering about a high retest here, with a perfect test and hold of rising support from the late June low at Friday's low. That too needs to break to open the downside. 

INDU 15min chart: 

In summary there's a very nice scenario to retrace back into the 3100-20 area here on SPX and that may well be part of a larger topping process as evidence mounts that there will be no V shaped economic recovery from the COVID-19 pandemic. We'll see how that develops and if SPX breaks back over the 3260 area I'll be leaning towards a retest of last week's high on SPX, NDX and Dow. 

Monday 20 July 2020

Three Theoretical Bears

Just to start I want to state a clear health warning for the historical stats I'll be weighing at the start of this post. This stats can give a useful lean, but even an 80% bullish lean still assumes 20% odds that the market closes higher that day, and this lean in either direction does not carry with it any indication of how far up or down markets might close. That said, as a tool in the technical toolbox these are always worth looking at in my opinion, and often deliver decent results.

In my intraday video on Thursday and my premarket videos on Friday and this morning at theartofchart.net I was looking at the historical stats for those days and for this week and proposing a possible course that SPX might take into the end of this week.

The historical stats for Thursday and Friday leaned 57.1% green, with the stats for today at 66.7% green, and I proposed that I would be looking for a double top setup to continue to form, noting this morning that the high retest that wasn't quite reached on Friday should be made today, ideally after an AM low which we saw in the first hour of RTH (regular trading hours). Ideally that higher high would be marginal to leave an ideal nested double top setup.

At the end of today the historical lean would change and we might then see a significant reversal. The lean for Tuesday this week is only 19% green, making it one of the most bearish leaning of the year, and the historical stats for the rest of the week all lean bearish, albeit less strongly, at 38.1%, 42.9% and 47.6% green closes respectively. If the market follows the historical stats then there is a very nice looking topping setup at the moment, though that will be deteriorating a bit at SPX continues to go higher, so ideally SPX would stay under 3265 or so today.

So what are the three theoretical bears that i am referring to in the title today? Well at the moment this is a very nicely formed triple nested double top, with the smallest double top support at 3198 looking on a sustained break below for the 3155 area, then the medium double top support at 3127, with a target in the 3010-30 area.

SPX 15min chart:

The third and largest double top setup has support at 2965 with a target in the 2590 area. Signals are promising with both hourly RSI 14 and daily RSI 5 sell signals already fixed, though a strong close today could kill the daily sell signal.

SPX 60min chart:

The first big support level is the daily middle band that has held as support on the last two retracements, with that currently in the 3144 area. On a break below that would open possible tests of the 50dma, now in the 3075 area, and the 200dma, now in the 3035 area, and close to the targets for the medium double top setup.

SPX daily chart:

Is there an alternate bullish scenario? For sure. On a hard break higher from here the obvious wedge resistance trendline target, shown on the 15min chart, is currently in the 3290 area, and that's another reason that I'd be concerned if SPX continues to grind higher from here. We''ll see how that goes.

A couple of announcements today. Stan and I are doing our month free public webinar looking at FAANG stocks and sectors an hour after the close on Thursday. If you'd like to attend you can register for that on our July Free Webinars page.

Secondly we are running another Traders Boot Camp at theartofchart.net starting on 3rd August teaching technical analysis and trading skills. These are mainly aimed at existing subscribers but are open to all and are comprehensive, include a lot of useful trading tools, and very cheap relative to an equivalent courses that I have seen online. If you are interested you can read more about that here.

Monday 13 July 2020

Moving To The Next Screen

One thing I try to stress in these posts is that the movement of the market can, to a significant extent, be broken down into a series of inflection points and, depending on the outcomes at those inflection points, the market moves to the next inflection point or screen.

Last week there was a very nicely formed inflection point and the decision at that inflection point was made on Friday, with a smaller bull flag channel ultimately breaking up with a target at a retest of the short term high at 3184.15, and a larger bull flag channel also breaking up with a target at a retest of the June high at 3233.13. Both targets have now been reached, with the high today on SPX at a marginal higher high at 3235.32.

Was this good news for bulls? Well not necessarily no, as my bear scenario had a decline ideally into the 2880 area before a likely retest of the June high to set up a possible double top for this move up since the March low. As that retest has been done now instead, that possible double top has been set up earlier and SPX has arrived at this next inflection point.

How decent is the pattern setup here? Well pretty good actually, at least to set the ball rolling to the downside. There's a decent RSI 14 sell signal on the SPX 15min chart and a small H&S there that has broken down with a target in the 3165 area, close to current rising wedge support now in the 3157 area.

SPX 15min chart:

On the SPX hourly chart there is already a previously fixed RSI 14 sell signal that is still valid, and I have sketched on the possible double top setup that may now be in play. A sustained break below the 2965 low would look for the 2595 area.

SPX 60min chart:

On ES another hourly RSI 14 sell signal has also fixed after the high today with a small H&S that has broken down with a target in the 3154 area, close to the next decent support level and the weekly pivot at 3156. A break and conversion of 3156 would open another retest of main current support at the daily middle band.

ES Sep 60min chart:

If the daily middle band can be broken and converted to resistance then that would be a serious support break and the large double top setup here would be in play, subject to successful breaks and conversions of the 50dma (currently 3039) and the 200dma (currently 3028). I'd note that a possible daily RSI 5 sell signal is now also brewing. Let's see how this develops. :-)

SPX daily chart:

A couple of things to mention today. We are running another Traders Boot Camp at theartofchart.net starting on 3rd August teaching technical analysis and trading skills. These are mainly aimed at existing subscribers but are open to all and are comprehensive, include a lot of useful trading tools, and very cheap relative to an equivalent courses that I have seen online. If you are interested you can read more about that here.

The last thing to mention is that our Paragon Options Service trading options on futures and ETFs is up about 82% so far this year and has just closed a sixth green trade in a row. If you're interested we offer a 30 day free trial and you can read more about that here.

I'm planning two special posts over the next few days, one looking at the next year or two under the shadow of COVID-19 and the other looking at the progress of the tech bubble this year and the gap that has been increasing between tech stocks and other stocks in US markets.

Thursday 9 July 2020

Quick Update On COVID and SPX

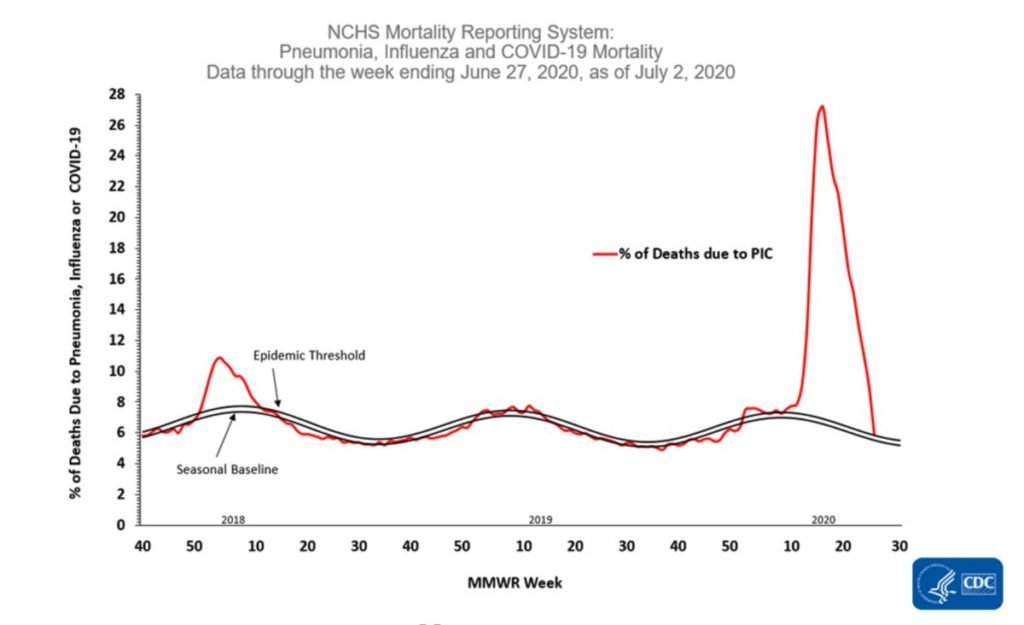
I was reading a very interesting article yesterday on the progress of COVID-19 and it was interesting not so much because of what was said, as for the decent quality numbers that it was quoting on COVID-19 exposures in the US population, and the fatality rate from the now decently sized statistical sample of exposed population and consequent deaths. In summary about 5% to 8% of the US population has now been exposed and are showing antibodies, and the death rate so far, subject to some likely attribution of deaths to other causes, is coming through at between 0.49% to 0.78% of those exposed. If you'd like to see the source article you can see that here.

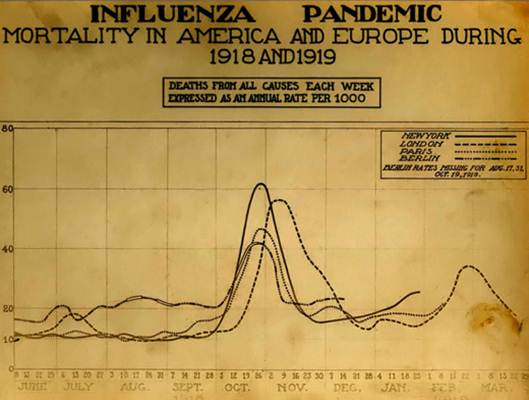
If you haven't seen it before I'll be referring back to my 20th March post 'A Short History Of Superflu Pandemics' and so I'm linking back to that for reference.

Now I've said before that I'm skeptical about an effective vaccine or cure being developed at all, and in the event that there is an effective one developed, whether it will be widely available before 2022, by which time it would likely not be a lot of use. I will be delighted to be pleasantly surprised about that, but my working assumption is that the coronavirus will just run through the population in the usual way for these pandemics and then fade away as an issue.

On that basis, though I'm seeing estimates that 70% of the population would need to be exposed to develop herd immunity, my working assumption would be that number might be as low as 33% to 40% infected in the 1889 and 1918 pandemics, ranging up to the 70% number because in the 1889 and 1918 pandemics those who were asymptomatic were likely not counted and that may, as now, have been a high proportion. On that basis 5% to 8% exposed is just a decent start, and will likely need to rise at least four or five times by the time herd immunity is established.

The death rate at 0.49% to 0.78% is much lower than appeared likely in my 20th March and so is actually good news, though if there is no vaccine or cure, and the number of exposures needs to be as high as 33% to 70% of the population, then as many as another one to two million people in the US may die of COVID-19. That would likely happen mainly over 2020 and 2021 and, given that many victims of COVID-19 are in sufficiently fragile health that they would have died in that timeframe in any case, then would likely increase the 6 million or so deaths in the US expected in any case over that period to 7 million to 7.5 million.

That's a lot of COVID-19 deaths, but by historical standards would be a decent enough result. By those historical standards this might also be enough of a reminder that some basic preparations might be made for the next pandemic, as these do occur regularly, albeit infrequently, and it was a dispiriting moment for the ongoing search for intelligent life on earth that this pandemic caught governments all over the world so completely unprepared, despite being perhaps the most predictable natural disaster in the history of the human species in every regard except timing.

If this pandemic plays out as I'm expecting then COVID-19 will be a major issue for a while yet and the management of COVID-19 over the next year or two, having already caused major economic disruption since March, may cause much more disruption over the rest of 2020 and possibly much of 2021. Stan and I are going to be running a webinar in early August at theartofchart.net looking at investing and trading in this environment and as soon as we set a date I'll be mentioning that on my twitter and in my posts of course.

On to the markets

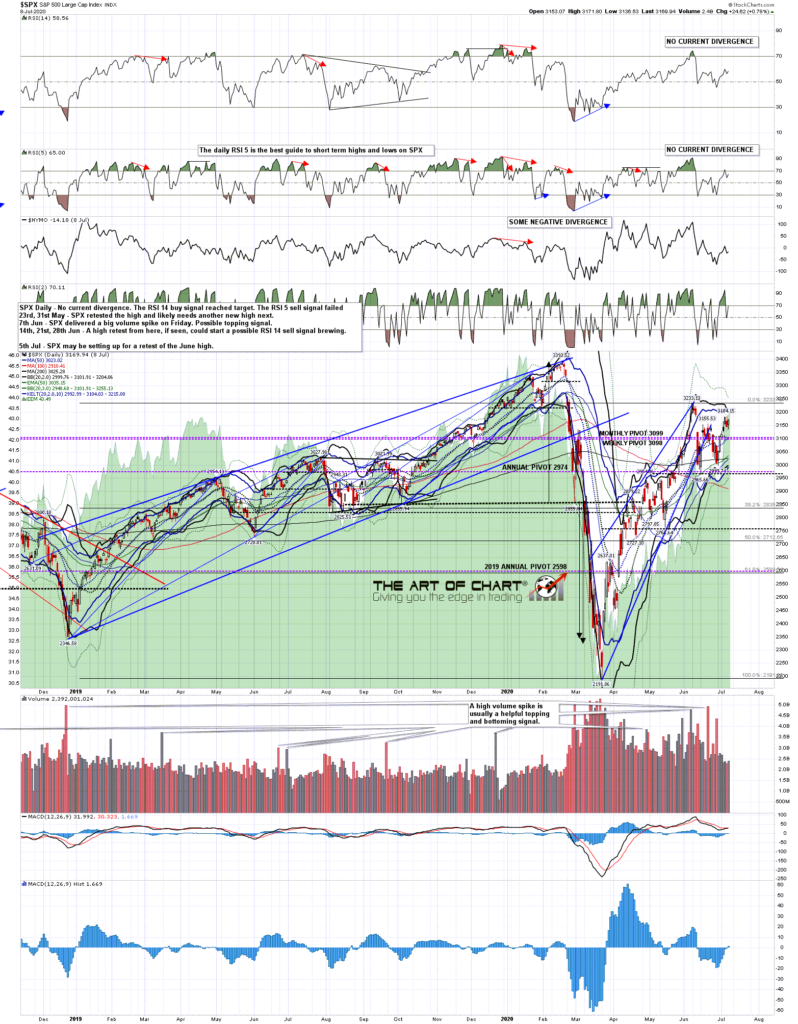
SPX has been consolidating choppily for the last couple of days and this morning has come close to delivering a backtest of the daily middle band. There are three important levels of support just under 3100 and they are the daily middle band, now in the 3099 area, and the monthly and weekly pivots, at the 3099 and 3098 levels respectively. That is a lot of big support in a small area and and any break below would be potentially significant. A conversion of 3100 to resistance would open up a lot of potential downside but I won't be getting that excited about that until we see it.

SPX daily chart:

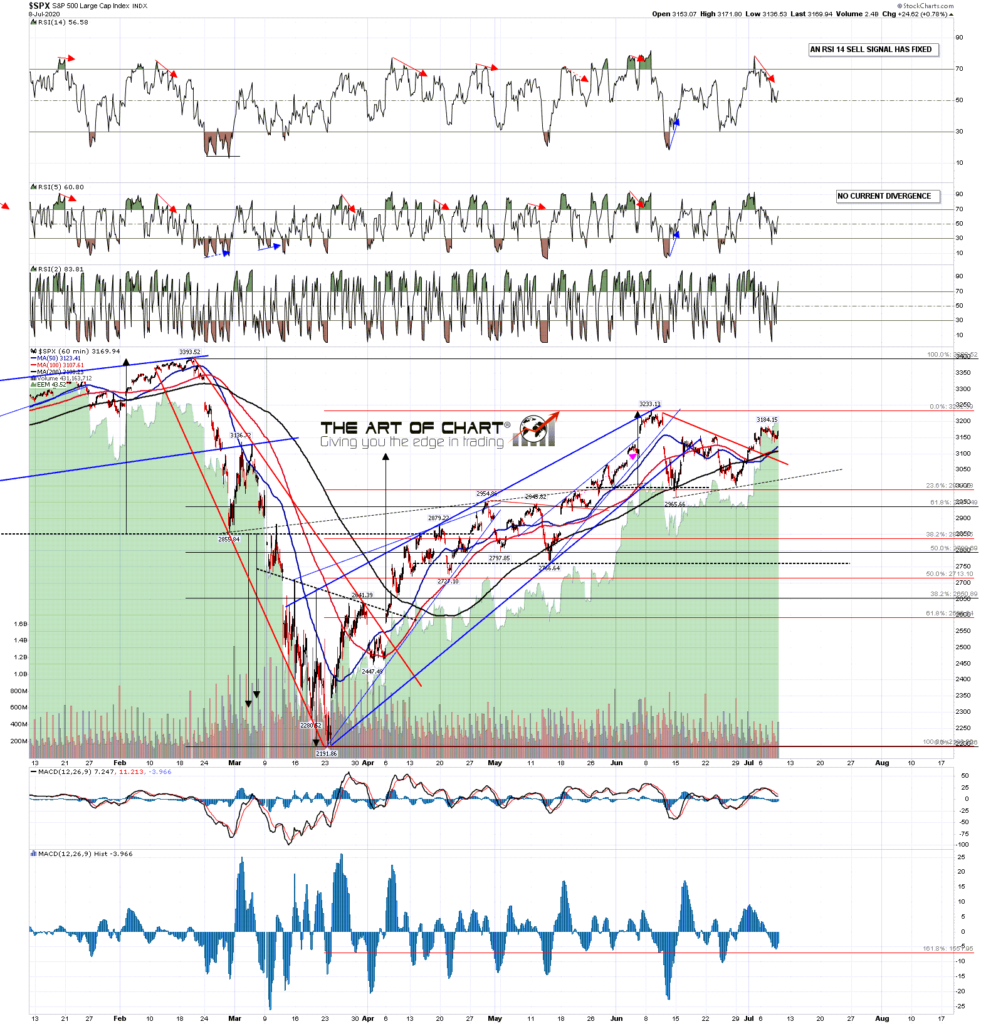
Hourly RSI 14 sell signals on both of SPX and NDX fixed earlier this week, and while the 3100 area has been backtested as expected, I'd note that neither of those signals has reached target yet, suggesting that there is likely to be at least another significant downside attempt in the near future. In the very short term there are clear bull and bear scenarios here.

SPX 60min chart:

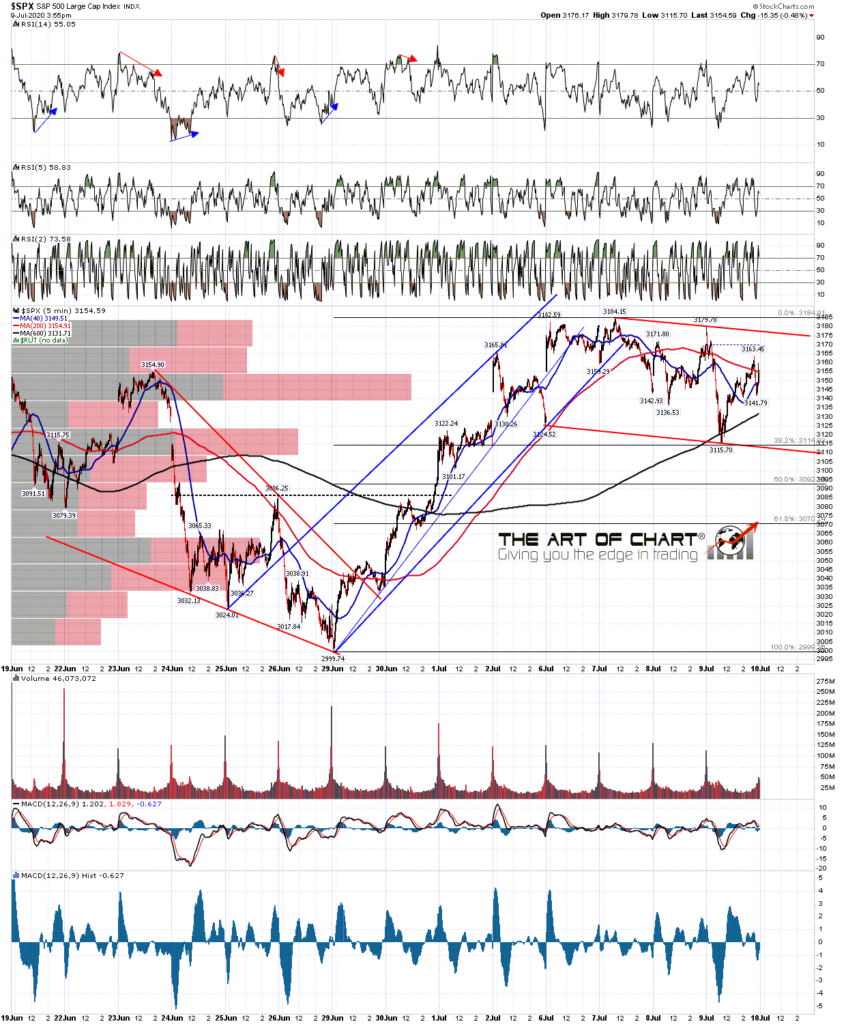
The bull scenario is shown on the SPX 5min chart below and that shows the rising wedge from the 3000 low that broke down earlier this week. The minimum 38.2% retracement target was hit almost exactly this morning and a high quality bull flag channel has formed that would look for a retest of the last high at 3184 on a break over flag resistance.

SPX 5min chart:

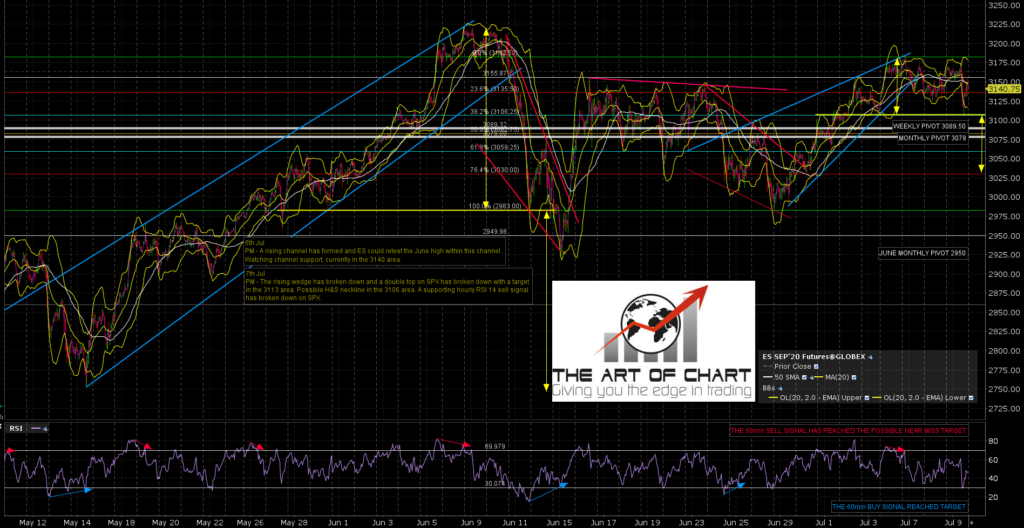
The bear scenario is shown on the ES hourly chart below, and I was outlining this possibility in my premarket video at theartofchart.net on Tuesday morning. I was talking about the possibility that ES would retrace back to the area of the possible H&S neckline at 3106, with the low this morning was at 3105, then form a right shoulder with an ideal high in the 3155 area, with the high this afternoon at 3154. This H&S is in play and on a sustained break back below 3105 overnight or tomorrow the H&S target would be in the 3026 area.

ES Sep 60min chart:

Which of these scenarios looks more likely? Well I think the bearish scenario is better one overall so all things being equal I'd give that 70% on the setup quality. All things haven't been looking that equal in recent months however, and the bulls have certainly earned the benefit of the doubt of late, so I'm giving both options equal weight for the moment and watching key levels. The key level on the upside is 3155 ES. A conversion of that to support tips this to the bulls with a likely retest of 3184 ES after that and a possible retest of the June highs. A break below 3100 SPX from here would likely tip this to the bears, subject to conversion of the 3100 SPX area to resistance, and would open a possible move down to a bigger picture target in the 2880 SPX area next month.

A couple of things to mention today. We are running another Traders Boot Camp at theartofchart.net starting on 3rd August teaching technical analysis and trading skills. These are mainly aimed at existing subscribers but are open to all and are comprehensive, include a lot of useful trading tools, and very cheap relative to an equivalent courses that I have seen online. If you are interested you can read more about that here.

The last thing to mention is that our Paragon Options Service trading options on futures and ETFs is up about 82% so far this year and has just closed a sixth green trade in a row. If you're interested we offer a 30 day free trial and you can read more about that here.

I'm planning a post tomorrow looking at the progress of the tech bubble this year and that gap that has been increasing between tech stocks and other stocks in US markets.

Monday 6 July 2020

A Killing Joke

I was asked an interesting question yesterday in our monthly free public Chart Chat at theartofchart.net, and I'd like to talk a bit about that before I start looking at markets today. The question was whether, given that market prices reflect everything that is currently known at the moment about that market, then how can that price be mistaken? My reply was that if that was truly the case then the price of tulips in January 1637 (just before that bubble burst) would have been equally justifiable and that, further, if that was really true there would be no speculative bubbles, which clearly there are on a regular basis. 

Something I didn't add, and should have, is that while statements like this are often thought of as economic rules or even laws, what they are in truth is just working assumptions that contain enough truth that economic models can be built using them that will have some relevance in modelling the behaviour of a market that is infinitely more complex than that model. 

There is a lot of faith in markets and this is something I've talked about before. I remember talking to someone years ago about gold, with my companion telling me that the problem with gold was that it was only worth what someone would pay you for it. I replied that he had just missed having an important insight, in that while what he said was true, he had missed that the same was true of anything that could be bought and sold, and also true of anything used to buy or sell it. There is no such thing as absolute value, all value is relative and based on confidence. 

It reminds me of a joke that I read in the 1980s in the cult classic graphic novel 'The Killing Joke'. The Joker tells the joke to Batman and it goes as follows:

I've always remembered this joke and felt that it had something interesting to say about human psychology and the impact that psychology has on our interactions with the world around us. The other thing I said in response to something else in Chart Chat yesterday was that while it was crazy in the current economic background that SPX had recovered as far as it has, it wouldn't be a lot crazier for markets to go even higher, and that we might see that happen. Best to keep an open mind rather than to stand in front of a train which might not stop in time. We have to suspend our disbelief watching the market, just as we would while watching a film or reading a novel. 

On to the markets, where I said two or three weeks ago that the main barrier to SPX retesting the early June high was the main rising megaphone resistance on NDX as if that held exactly than SPX would likely have to turn back down without that retest. NDX closed over that resistance trendline on Friday so the path has been cleared for that retest on SPX and while it may not happen, I'm thinking that the odds of seeing that are now at 50% or higher. We'll see. 

NDX weekly chart: 

Now there is some negative divergence here. On the hourly chart there is now a possible RSI 14 sell signal brewing on SPX and we could see a turn. The main support is now well below at the daily middle band, currently in the 3107 area. SPX 60min chart: 

There is some important support a bit higher than that though as decent quality rising channels have formed from the last low on both ES and NQ. ES rising channel support is now in the 3137 area and I'm watching that carefully. ES rising channel resistance is now in the 3200 area and the retest of the June high could be reached this week within that channel. ES Sep 60min chart: 

A couple of announcements today. Firstly I'd mention that today is the last day of our July 4th sale on annual memberships at theartofchart.net, and if you are interested and had not got around to pulling the trigger for that yet, you can do that here until midnight tonight I think. 

Secondly Stan and I have decided to do a special webinar on the markets in the ongoing COVID economic environment. This is likely to have a huge impact over the next year or three and we will be looking at the markets, sectors and instruments that should do better or worse in this environment. This will be like the webinars we do at the end of each year and we will likely set a date for this in early August. As we approach that I'll mention that in my posts and on my twitter

Lastly if you missed the free public Chart Chat at theartofchart.net yesterday you can find the recording posted on our July Free Webinars page.