- WE'RE JUST RANDOM SPECKS OF DUST IN A TORNADO TO THE MARKETS .......
- CHARTISTS MUST PUT ALL BIAS ASIDE AND LET THE CHARTS DO THE TALKING OR WE'LL SEE ONLY WHAT WE WANT TO SEE
- This blog has a copy of all header posts that I publish anywhere, so that those interested in seeing what my thoughts are on the markets can find them easily.
- I will be answering questions and responding to comments, so feel free to respond to any posts and I will see your comment even if it is not on the most recent post.
- If you're interested in seeing any intraday charts I post, I do that on twitter, and my twitter handle is @shjackcharts.
- The charts in the posts are as large as I can practically make them. if you would like to look at one more closely, click on it, and the link will take you to a larger version at screencast. If you click on that again, you will get a full page version, and can use the resizing function on your browser to enlarge parts of interest further.

Wednesday 31 August 2022

On The Road To 3910

In my post on Friday I was looking for a fail at the backtest of the 4200 SPX area, and a break down from the H&S patterns forming on the US equity indices and we saw that fail and all the H&S patterns broke down. None of those have yet made target.

SPX has broken back below the 45dma, now at 4030.05, so the reversion to the mean move has been completed and I won't be posting this chart again for a while.

SPX daily 45dma chart:

SPX has tested the daily lower band, now at 4000, on each of the last two days, so has started a possible daily lower band ride. If that is to continue then that will need a test again today. The 3sd lower band is at 3913 which now puts the H&S target in the 3910 area in range.

SPX daily BBs chart:

Possible RSI 14 and RSI 5 buy signals are brewing here on the hourly chart on SPX and most of the other US indices, and everything looks short term oversold, so we could see a rally attempt here. If so the first obvious resistance is at the 50 hour MA, currently at 4040.

SPX 60min chart:

The H&S on SPX broke down with a target in the 3910 area, and I'm not seeing anything to suggest that target won't be reached, but again there is positive divergence on the 15min chart with a fixed RSI 14 buy signal suggesting a rally attempt here.

SPX 15min chart:

On NDX, which has broken down with a target in the 11940 area, I was a bit concerned when I found a possible bull flag channel yesterday morning, but that broke down intraday yesterday so that potentially bullish setup is gone. NDX still looks like it may need a rally though. 

NDX 15min chart:

Normally at the end of the month the last day of the month leans bearish and the first day of the month leans bullish. That's not the case at the end of August though, with the last day of the month leaning 61.9% bullish and Thursday and Friday this week leaning mildly bearish. I am definitely wondering about a possible rally attempt today so we'll see how that goes.

My next post should be on Friday before the open.

Friday 26 August 2022

Backtesting 4200

I had my final divorce hearing this week and that is settled and done. It was a strange sight, lawyers really do strain at gnats and swallow camels. I do wonder how often anything resembling justice is seen in these places and whether, if seen, it happens by chance. I'm glad to be done with it and plan never to return.

In my last post I was laying out the obvious options for this week, and we saw the confirming close below the daily middle band, SPX did go down to the 4120 area as I suggested would be ideal if an H&S was to form and we saw the rally in the last two days that may have largely formed the right shoulder on that possible H&S.

On the 45dma chart I'm expecting to see at least a near miss of the 45dma on this retracement, so it is unlikely to complete here and wherever this current rally goes it is likely to be forming a topping pattern to go lower.

SPX daily 45dma chart:

SPX broke back above the daily middle band, currently at 4187 at the close yesterday. That is inviting a possible rejection back below today. If seen that would be bearish and favor the H&S scenario. If we see a close back above today that is modestly bullish, but mainly here I'm watching the 5dma.

SPX daily BBs chart:

On the SPX 5dma, currently at 4167, we also saw a closing break back above yesterday, and as the decline into 4119 was over 2% from the rally high, that puts SPX back on the Three Day Rule. That rule states that if SPX delivers a clear break back below the 5dma on the second or third day, so today or Monday, then the prior low at 4119 will be retested. This rule has fixed and delivered eight times so far in 2022 and is VERY reliable. If the low at 4119 is retested then the H&S will have completed and started to break down.

SPX 5dma chart:

Possible H&S patterns are forming on all of SPX, NDX, IWM and Dow, though the Dow version is lower quality. A sustained break below 4119 on SPX would look for an H&S target in the 3920 area.

SPX 15min chart:

There are two possible H&S necklines on NDX, and I will be choosing which to use depending on the height of the right shoulder, but it will be a decent quality pattern either way.

NDX 15min chart:

I'm leaning towards the H&S scenario here, but it wouldn't take a lot to change that. A fill of the breakaway gap on SPX from 4228.48 would be bullish. A conversion of the daily band back to support and two daily closes above it would also be bullish. If SPX can do that the odds of a retest of the rally high at 4325.28 will increase considerably though, if seen, I'd expect that to be the second high of a double top.

I have a question for you guys this morning. Not enough people read these posts and I think they deserve a wider audience. Do you have any suggestions as to other places I could publish these? Seeking Alpha is out because they don't do pure TA there, but I'm sure there are a lot of other places I could look at. Suggestions invited and very welcome. :-)

My next post will be on Monday or Tuesday before the open. Everyone have a great weekend.

Tuesday 23 August 2022

Broken Flags

I was looking at the equity indices on Sunday, and there were decent looking short term bull flags across the equity indices. These were a good indicator for a rally high retest next but they only break up about 70% of the time. The rest of the time they break down or evolve into larger flags and these broke down.

I'm showing the SPX 15min chart below and I have marked the flag target in at about 4100. That wasn't quite reached yesterday but there is a lot of positive divergence established here and there are fixed 15min RSI 14 and RSI 5 buy signals on all of SPX, NDX, IWM and Dow. There are also hourly buy signals fixed on ES, NQ, RTY, YM, DAX and ESTX50. The odds of seeing a decent rally attempt starting in this area are high. We might see a test of the 4100-20 area on SPX first.

The rally target should either be the ideal H&S right shoulder area around 4186 SPX or, if we see a really strong rally, a possible retest of the rally high. A fill of yesterday morning's opening gap at 4218.70 would make a rally high retest at 4325.28 considerably more likely.

SPX 15min chart:

Dow almost made the flag target in the 32.9k area yesterday. No obvious H&S option here unless Dow can get closer first to either of the possible H&S necklines in the 32.7k or 32.4k areas.

INDU 15min chart:

Two daily RSI 5 sell signals fixed last week on NDX and IWM, and both made target yesterday. There is a decent possible H&S option if we see NDX rally here.

NDX 15min chart:

Looking at the SPX 45dma, this retracement is very unlikely to be finished, so if we do see rally high retests then I'd be expecting those to be the second highs of small double tops. The 45dma is now at 3991 and I'm expecting it to be in the 4025-50 area by the end of this week. This move should deliver at least a near miss backtest of the 45dma and usually a full test or break below.

SPX daily 45dma chart:

Looking at the SPX daily bands, the middle band, currently at 4164, was broken with some conviction yesterday. Obviously there is a decent chance of seeing a rally today. If we were to see a reversal candle today, ideally closing in the 4200 area or higher, that would be a rejection candle, and would greatly increase the chances of a rally high retest. If we see a confirming close below the middle band today, that would favor continuation directly downwards. 

SPX daily BBs chart:

The retracement I was looking for has started and is unlikely to have finished. If we see a break and conversion of the 45dma on SPX, then it may just be getting started.

I am looking for at least a decent attempt at a rally today, and will be watching the close today with great interest as it may tell us a lot about what we should expect to see next.

We are doing our monthly free public Big Five & Key Sectors webinar at theartofchart.net at 5pm EDT on Thursday 25th August. I will be looking at the bull flag setups on most of these as well so that should be interesting. If you'd like to attend you can register for that here or on our August Free Webinars page.

My final divorce hearing is on Wednesday and Thursday this week, so I will try to do a post on Friday morning before the open if I can. If not my next post will likely be on Monday before the open.

Friday 19 August 2022

Rolling Over

SPX has reached a peak of 9.57% over the 45dma on this run. That's likely to be the highest reading as the 45dma is now rising significantly every day, and has risen 40 handles this week. We should now see a retracement that reaches at least close to the 45dma, now at 3971, and may go below it. Depending on the time taken to deliver that retracement I'd be leaning towards a target area 4000-50 as a very rough guide.

SPX daily 45dma chart:

I was talking about the possibility that we would see a small retracement first, then a rally high retest to re-set up the daily negative divergence on SPX and that's looking promising, with decent looking bull flags now formed on the equity indices. As these have made lower lows overnight, I'm showing you this on ES.

ES Sep 60min:

Not all the daily negative divergence was lost on the last move up last week. A possible RSI 5 sell signal is still brewing on NDX and one has fixed on IWM.

IWM daily chart:

There is a possibility that we don't see a high retest, and that H&S patterns have been forming here instead. That's best shown on the IWM 15min chart. I'm leaning towards the high retest about 70/30, but there is a possible setup to head down directly.

IWM 15min chart:

The RSI setup is also mixed on the FAANG stocks & sector ETFs. The chart below is AMZN where both RSI 14 and RSI 5 daily sell signals have already fixed. Others like AAPL could still use a high retest to re-set up daily negative divergence, but some look ready to go now. 

AMZN daily chart:

Equity indices are likely making at least a short term high here, so the question is how far that will go. If we are in fact setting up for a high retest playing out the bull flags all across the indices then we would likely see a fairly modest retracement into the 3900 - 4100 area before continuing higher.

Purely on the pattern setup here I am leaning towards at least an attempt to retest the all time highs, but the economic backdrop isn't promising and that may fail. If we do see that high retest I would be leaning towards that being the second high of a large double top before a likely move lower than the low made so far in 2022.

Is it possible that SPX is starting a big new bull move here? I'm doubtful but anything is possible in the markets. I would note that the big bull run in 1970-3 took place in a stagflationary economic setting. Overall in the 1970s though the market was heading sideways, and dropping significantly in real terms, so any big bull move would likely be short-lived.

We are doing our monthly free public Big Five & Key Sectors webinar at theartofchart.net at 5pm EDT next Thursday 25th August. I will be looking at the bull flag setups on most of these as well so that should be interesting. If you'd like to attend you can register for that here or on our August Free Webinars page.

My next post will likely be on Monday or Tuesday before the open.

Monday 15 August 2022

Air Getting Very Thin Here

I was talking on Friday about how every so often we see market moves that make no sense, but are technically sound, and go ahead and happen despite making no sense.  I was calling these grey swans and as it happens there was a very good example of this that day.

On my daily 45dma chart at the intraday high SPX reached a level 9.1% above the 45dma, higher than both of the highs made after the 2020 low at 8.7% and 8.4%. That was something I didn't expect to see, but here we are.

SPX daily 45dma chart:

So how unlikely was this reading of 9.1% above the 45dma on Friday? I had a look through my SPX charts back to 2000, and the reading on Friday was the highest so far this millennium, but when I looked back a little further I did find two higher examples in the late stages of the tech bubble 1998-2000.

The first example was where I expected to perhaps find it, and that was in the sharp move up from the low in 1998, that reached a high at 10.1%, as did the final spike at the bubble high in 2000. Those two are the only readings I found above 9.1% in the last twenty five years.

If we were to see that level matched here, then SPX might just be able to reach the 4325 area on this push, and that might then deliver a test of declining and possible bull flag resistance in that area.

SPX daily 45dma 1998-2000 chart:

On the SPX daily chart there was a fixed RSI 5 sell signal on Friday morning, as well as similar signals brewing on NDX, IWM and Dow, but the SPX signal failed on the latest push up, and divergence was lost on Dow. That still leaves possible daily RSI 5 sell signals brewing on NDX and IWM, but there is now a lot less bearish divergence than there was on Friday morning.

SPX daily chart:

In terms of the SPX daily BBs the upper band is now in the 4300 area and a move to the 4320-30 area is potentially in range.

SPX daily BBs chart:

On the 15min chart the bear flag setup is now looking somewhat ragged, and I'm increasingly doubtful about it being a bear flag, but there is still a very decent looking rising wedge from the first higher low at 3721.56, and if that is to continue to form then the next obvious target within the wedge would be wedge support, currently in the 4180 area. If we see that retracement and wedge support holds, wedge resistance would then likely be in the right area for a possible test of the 4320-30 area. 

SPX 15min chart:

We could just see a retracement start here of course, but if so, the the setup would still be improved by a retracement lasting a day or two and then a retest to set up the daily RSI 5 negative divergence again on SPX and Dow. We'll see.

In terms of the historical stats I'd note that the first three days of this week all lean significantly bullish, at 61.9% bullish today and Tuesday and 71.4% bullish on Wednesday.

If you're wondering where I get these daily historical stats from, I get those from the Stock Trader's Almanac 2022 by Jeffrey A Hirsch. I've been getting one at the start of every year for many years now and they are available from Amazon in the US and elsewhere.

We are doing our monthly free public 'Trading Commodities - Setups And Approaches' webinar at theartofchart.net at 5pm EDT next Thursday 18th August. As usual we will be looking at three actionable trades using options. If you'd like to attend you can register for that here or on our August Free Webinars page.

My next post will likely be on Thursday or Friday before the open.

Friday 12 August 2022

Grey Swans

I wanted to take an opportunity to take stock of where this rally is in relation to the possible all time high retests that I was talking about in my post on 14th June just before the 2022 low was made. I have done three main posts looking at this and a possible news background that might help deliver those high retests from the decent looking bull flags that have formed in 2022 on all four of the main US indices that I watch from those all time highs

These are those three posts which are worth another look as there is more in them than I will be reviewing in this post.

Through A Glass Darkly - 14th Jun

Blood In The Streets - 17th Jun

The Evolving Markets - 8th Jul

On the SPX daily chart I started looking for a possible move to test bull flag resistance on 28th May, three weeks or so before the low. SPX then delivered a bullish underthrow to make the 2022 low and reversed back up towards flag resistance, now in the 4340 area, just above the 200dma, now at 4330. A break and conversion of that resistance would fix a clear target back at a retest of the all time high.

Since then SPX has broken and converted the daily and weekly middle bands and yesterday at the high delivered an almost tick perfect test of the monthly middle band and 4257, just above the 50% retracement of the move down from the all time high. This is the last big resistance level before the test of SPX flag resistance and the 200dma.

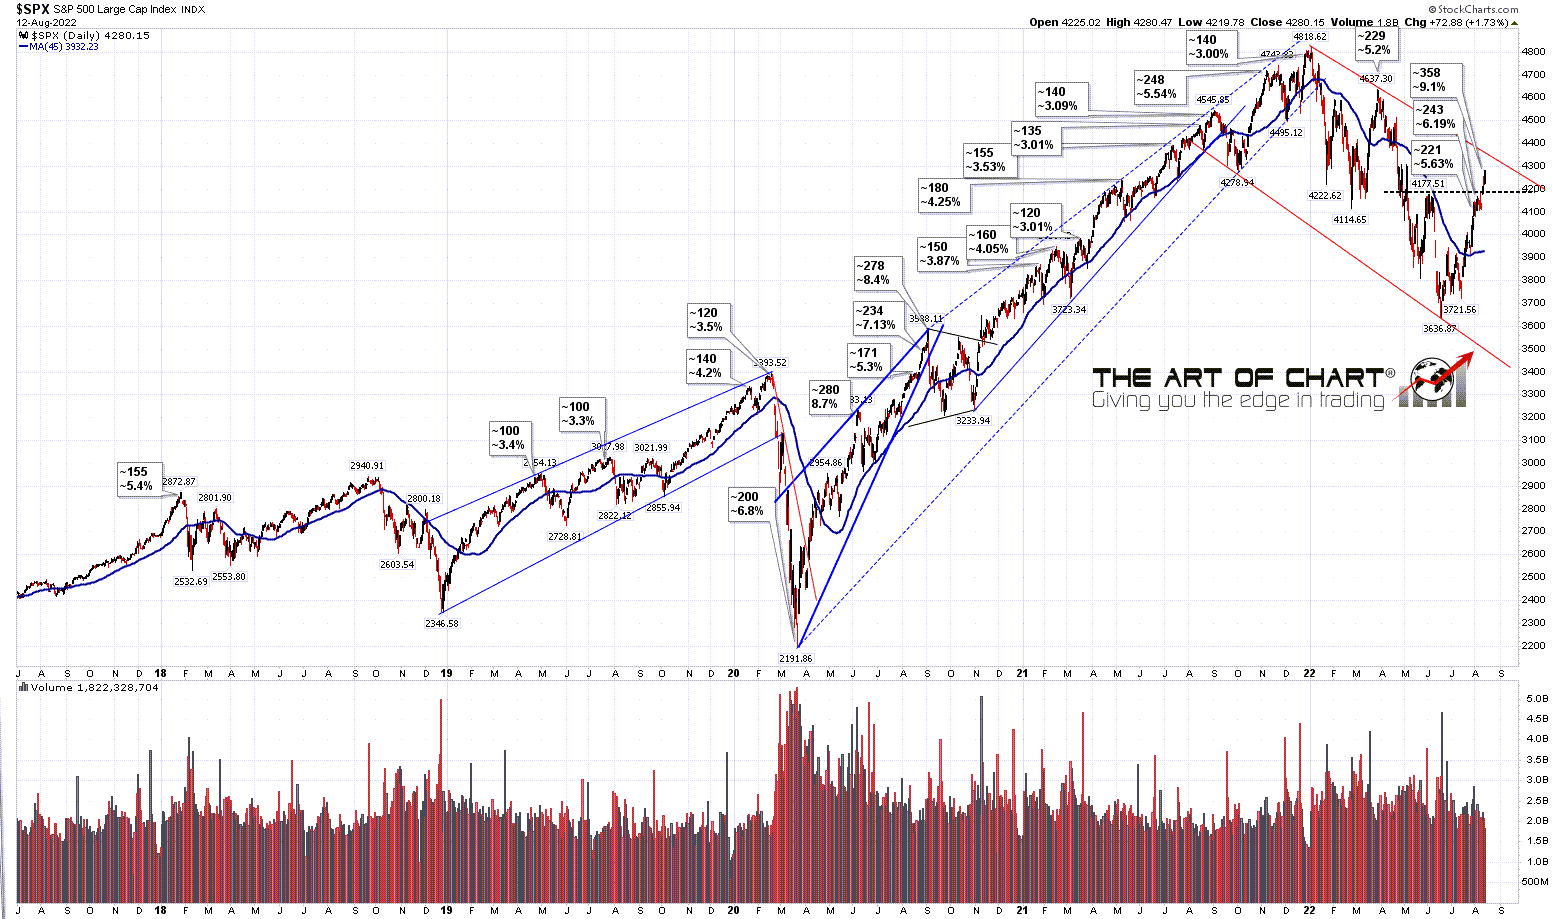
In the meantime though, SPX is now really stretched against the 45dma (last chart on this post) and there is now clear daily negative divergence on SPX, NDX, IWM and Dow. History suggests that we are very close to a short term high and a minimum retracement back down to the 45dma, now at 3928.

SPX daily chart:

NDX has already broken up from the overall bull flag and has reached the higher possible IHS neckline that I was looking at. If we see a right shoulder retracement here then the ideal right shoulder low would be in the 12750 area. A possible daily RSI 5 sell signal is brewing.

NDX daily chart:

IWM has already broken up from the overall bull flag and has at least some IHS potential here, though nothing that leaps off the chart. A possible daily RSI 5 sell signal is brewing.

IWM daily chart:

Flag resistance on Dow is now in the 34000 area and is getting close. Dow is still only slightly above the original possible IHS neckline that I was looking at there but there is another also in the 34000 area. A possible daily RSI 5 sell signal is brewing.

INDU daily chart:

The SPX intraday high yesterday was an eye-watering 8.3% above the 45dma. The only other readings as high as this were the two big highs after the 2020 low at 8.7% then 8.4%. Both of those then delivered at least a retracement back to the 45dma, now at 3928. 

SPX daily 45dma chart:

I haven't talked about bonds today, and a big rally there was the other linked move I was talking about at the lows and in early July. What we have seen though is some optimism on inflation from the recent numbers, which is what I was thinking might deliver a potential window for both all time high retests on equities and the rest of the rally on bonds that I was looking for in those earlier posts, and have only seen about half of so far.

Do the equity indices have to turn down here? No, but there is a lot of negative divergence here, 50% of the move down has now been retraced on SPX, and SPX is looking really stretched now against the 45dma. If SPX continues up regardless then the next big inflection point is in the 4340 area.

In terms of the historical stats I'd note that the first three days of next week all lean significantly bullish, at 61.9% bullish on Monday and Tuesday and 71.4% bullish on Wednesday.

If you're wondering where I get these daily historical stats from, I get those from the Stock Trader's Almanac 2022 by Jeffrey A Hirsch. I've been getting one at the start of every year for many years now and they are available from Amazon in the US and elsewhere.

If you're wondering about the title today a black swan is a market event that knocks almost everything out of every trajectory. These are rare but what are more common are market moves that make no sense, but are technically sound, and go ahead and happen despite making no sense. These don't happen a lot either but there have nonetheless been quite a number of them over the last twenty years. If we do see these all time high retests on equities against this economic backdrop this would be one of those moves and I was thinking I might start calling them grey swans.

My next post will likely be on Monday or Tuesday before the open. Everyone have a great weekend :-)

Tuesday 9 August 2022

Still In The Inflection Point

If you missed our free public Chart Chat at theartofchart.net on Sunday then you can see the recording here or on our monthly free webinars page here.

In that Chart Chat we were saying that a retest of the rally high was likely early this week, and we saw that yesterday. SPX has a daily RSI 5 sell signal brewing, a fixed hourly RSI 14 sell signal, and the trendline setup for a reversal here looks very nice indeed. The next step if we are going to see a reversal here would be a break of the short term rising support trendline now in the 4105 area, and ideally the formation of an H&S at the possible neckline in the 4080 area.

SPX 15min chart:

On NDX the overall bear flag setup from the low is less compelling, but the short term rising wedge has broken down and a small double top has formed. On a further break down I would be watching for a possible H&S to form at the potential H&S neckline in the 12815 area.

NDX 15min chart:

I did mention last week that I was watching the declining resistance trendline on NDX and that has been tested and is holding so far. If that continues to hold and a retracement starts here that does raise the possibility that if the 2022 low is retested, then NDX might continue down to falling megaphone support, currently in the 10,200 area. If seen that would significantly weaken the overall bull flag setup as the retracement would then be below the 61.8% fib.

NDX 60min chart:

I was saying last week that I'd like to see Dow retest the 33.0k area and we saw that yesterday. As with SPX Dow is now in the ideal resistance area, a possible daily RSI 5 sell signal is now brewing, and the bear flag pattern setup from the 2022 low looks very nice indeed.

INDU 15min chart:

IWM is a jarring note here, with a break over the ideal resistance area and the short term rising wedge resistance trendline. This might be just a bearish overthrow but I'd like to see that turn down directly from here really. 

IWM 15min chart:

The obvious inflection point has set up here at the obvious resistance area. Do the equity indices have to turn down here? No, as that isn't the way things work in this universe, but the prospects for at least a significant retracement from this area look good. We'll see how that goes.

In terms of the historical stats they lean neutral to bearish for the rest of this week apart from tomorrow, which leans 61.9% bearish on SPX. If we are going to see a reversal here then that would ideally happen this week, and deliver a weekly close back below the SPX weekly middle band, now in the 4080 area. That would deliver a weekly rejection candle to reverse last week's closing break over the weekly middle band.

If we don't see a reversal start this week then I'd note that the first three days of next week all lean significantly bullish, at 61.9% bullish on Monday and Tuesday and 71.4% bullish on Wednesday.

If you're wondering where I get these daily historical stats from, I get those from the Stock Trader's Almanac 2022 by Jeffrey A Hirsch. I've been getting one at the start of every year for many years now and they are available from Amazon in the US and elsewhere.

My next post will likely be on Friday before the open.

Thursday 4 August 2022

In The Inflection Point

In my last post on Tuesday I was talking about ideally seeing a higher high on this rally to set up divergence and we have since seen that on SPX, NDX and IWM. That has set possible daily RSI 5 and hourly RSI 14 sell signals brewing on SPX and brought SPX closer to the ideal IHS area at the June high at 4177.

The distance from the SPX 45dma reached a nosebleed level at 6.19% though that doesn't mean as much after a strong bear move. Still a very good place to be looking for a retracement though.

SPX daily 45dma chart:

On the SPX 15min chart the trendline setup for a reversal here is just lovely, which strengthens the pattern setup.

SPX 15min chart:

On IWM the rising wedge from the July low is again a thing of beauty, with a perfect touch of the wedge resistance trendline yesterday.

IWM 15min chart:

Dow hasn't quite reached the obvious retest target at 33.0k and may need to.

INDU 15min chart:

NDX has gone over the short term trendline resistance and may be reaching for the main bull flag megaphone resistance trendline now in the 13400 area. I would prefer not to see a perfect touch of the trendline here, as that would suggest that there might be a move coming next to take NDX down to that megaphone support currently in the 10250 area. 

NDX 60min chart:

The obvious inflection point has set up here at the obvious resistance area. Do the equity indices have to turn down here? No, as that isn't the way things work in this universe, but the prospects for at least a significant retracement from this area look good. We'll see how that goes.

The historical stats are neutral leaning slightly bullish until mid August, but I'm actively looking for at least short term highs here or slightly higher. Those highs could deliver retests of the 2022 lows. I'm wondering about just a little higher on Dow particularly before a turn just to complete that rally high retest and set up negative divergence there.

I was saying back in June that a difficulty for bulls here was the grim economic backdrop and that remains the case. I have doubts as to whether the bull flag setups that have formed on the US indices so far in 2022 can make target in this environment but I've seen a lot of crazy things happen on the markets over the last twenty years, and predicted at least some of those. Retests of the all time highs remain on the table as a possibility here, and the prospects for seeing those from a TA perspective have only improved over the last few weeks.

We are doing our monthly free public Chart Chat at theartofchart.net at 4pm EDT next Sunday 7th August. If you'd like to attend you can register for that here or on our August Free Webinars page. It should be interesting. Be there or be unaware! :-)

Everyone have a great weekend and my next post will likely be on Tuesday before the open.

Tuesday 2 August 2022

Testing Main Resistance

When I started to write about the prospects for a decent rally on the 17th and 22nd June I was somewhat apologetic about even suggesting that a rally might be possible, as the background looked so grim and people were so relentlessly bearish. I was looking for strong rallies on the US equity indices and on bonds and we have been seeing both since.

I think both may go a lot further, but SPX is now testing main downtrend resistance at the weekly middle band, with the other US indices close to important established resistance and possible IHS necklines, and there is a good chance that US equity indices may turn back down here either to form right shoulders on a series of large IHS patterns, or possibly to retest the 2022 lows, very possibly on SPX to make the second low of a double top setting up an attempt to retest the all time highs.

On the weekly chart, the close last week was slightly over the weekly middle band, now at 4098, but the close above wasn't clear, so I'm taking that as a close at resistance. A clear break above at the close this week, if seen, would look more significant.

SPX weekly chart:

It has been a while since I talked about the SPX 45dma, which I use for reversion to the mean calculations, as it is much less important in downtrends, but this move up from the low has been strong enough that SPX has broken back over the 45dma, now at 3924, converted it to support on retracement after the break, and was 5.63% above it at the high intraday yesterday.

In an extended uptrend that level would be eye-wateringly high, with the three highest levels apart from the move up from the 2020 low at 5.4% in 2018, 5.54% in 2021, and 5.2% in the last big rally in 2022. Could it go higher? Well I have two readings of over 8% in the months after the 2020 low, but this is very much an area to be looking for a possible strong reversal back down.

SPX daily 45dma chart:

In the short term all four of SPX, NDX, IWM and Dow are close to big established resistance levels that are also possible IHS necklines, and all of them have short term pattern setups that look promising for reversal here.

On NDX there is a very possible bear flag setup from the 2022 low, and NDX is testing double trendline resistance there, and that possible IHS neckline area. If we should see a right shoulder retracement here then ideally that would head back into the 11492 area.

NDX 15min chart:

There's no obvious overall bear flag setup on IWM as there also isn't an obvious overall bear flag setup on SPX either, but there is a decent shorter term rising wedge, IWM is at the possible IHS neckline and if we see a right shoulder retracement the ideal target would be in the 168.46 area.

IWM 15min chart:

There is a decent quality overall bear flag setup on Dow, which is close to a possible IHS neckline and is testing possible double resistance trendlines. If a right shoulder forms there the ideal right shoulder low would be in the 30.6k area. 

INDU 15min chart:

The historical stats are neutral leaning slightly bullish until mid August, but I'm actively looking for at least short term highs here or slightly higher. Those highs could deliver retests of the 2022 lows. Ideally we would see at least retests of the current rally highs today or tomorrow to set up divergence on the hourly RSIs.

I was saying back in June that a difficulty for bulls here was the grim economic backdrop and that remains the case. I have doubts as to whether the bull flag setups that have formed on the US indices so far in 2022 can make target in this environment but I've seen a lot of crazy things happen on the markets over the last twenty years, and predicted at least some of those. Retests of the all time highs remain on the table as a possibility here, and the prospects for seeing those from a TA perspective have only improved over the last few weeks.

We are doing our monthly free public Chart Chat at theartofchart.net at 4pm EDT next Sunday 7th August. If you'd like to attend you can register for that here or on our August Free Webinars page. It should be interesting. Be there or be unaware! :-)

I'll try to get another post out on Thursday or Friday but I'm waist deep in divorce paperwork and that may not be possible.