- WE'RE JUST RANDOM SPECKS OF DUST IN A TORNADO TO THE MARKETS .......
- CHARTISTS MUST PUT ALL BIAS ASIDE AND LET THE CHARTS DO THE TALKING OR WE'LL SEE ONLY WHAT WE WANT TO SEE
- This blog has a copy of all header posts that I publish anywhere, so that those interested in seeing what my thoughts are on the markets can find them easily.
- I will be answering questions and responding to comments, so feel free to respond to any posts and I will see your comment even if it is not on the most recent post.
- If you're interested in seeing any intraday charts I post, I do that on twitter, and my twitter handle is @shjackcharts.
- The charts in the posts are as large as I can practically make them. if you would like to look at one more closely, click on it, and the link will take you to a larger version at screencast. If you click on that again, you will get a full page version, and can use the resizing function on your browser to enlarge parts of interest further.

Thursday 30 June 2022

Possible Break Back Down

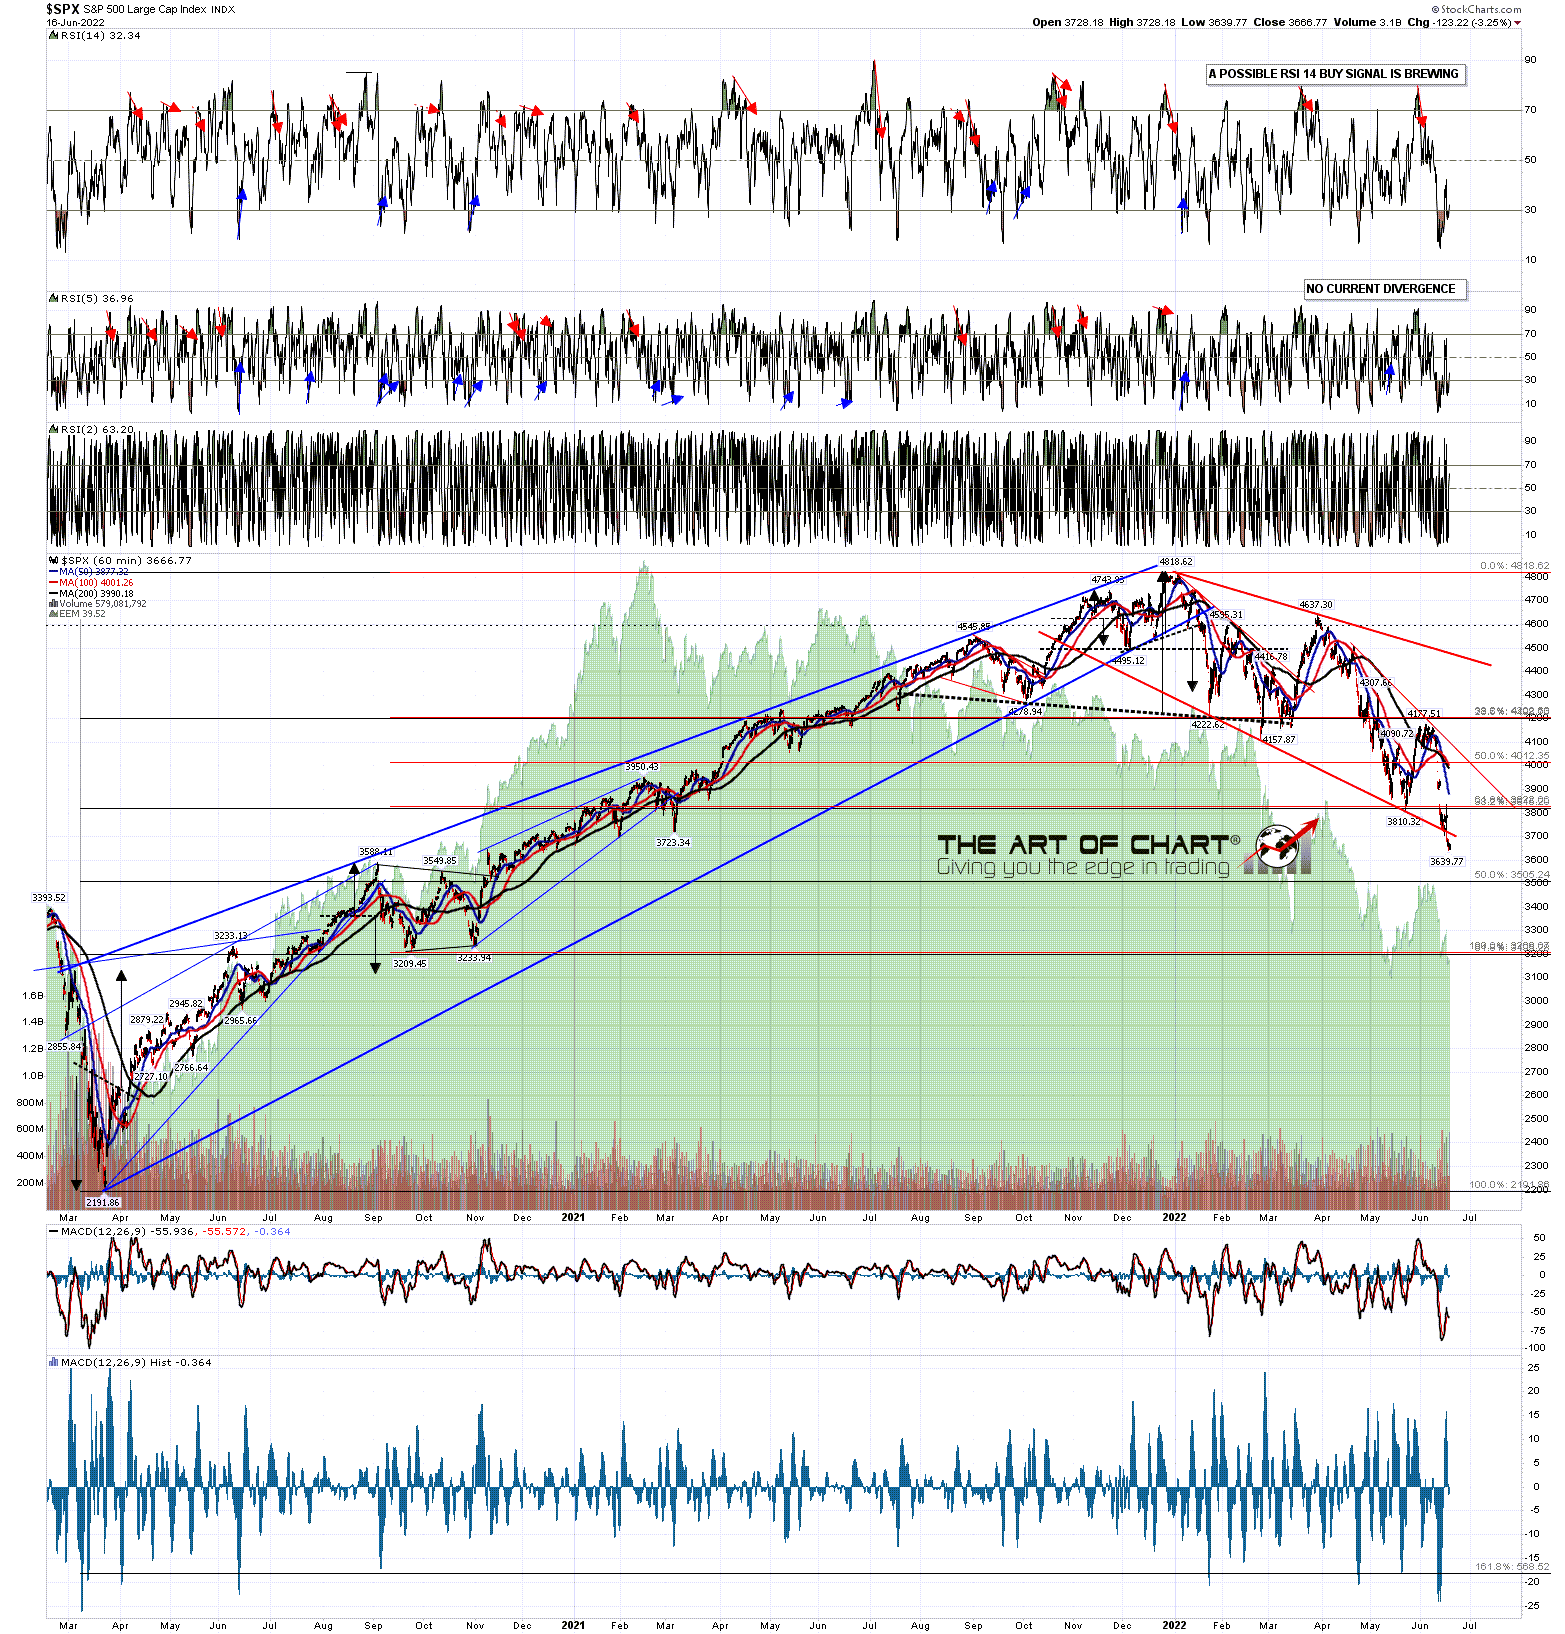
I posted this chart on my twitter on Wednesday night with the comment that SPX was reaching an important short term inflection point where it might go directly into a retest of the current 2022 low. I said that the strongest kind of break would be a gap through the gap support highlighted in yellow that then converted that to resistance. We didn't see that yesterday, where the gap was tested but not filled, but at the time of writing a gap through that resistance looks likely and if the gap then converts to resistance then that would create a short term island top for the rally.

The timing isn't ideal and this attempt to break down would have been better yesterday because today is the last trading day of June, and the 4th July holiday is on Monday. That's not an issue today, with neutral historical stats, but the historical stats for tomorrow on SPX are 85% bullish and that is also both a Friday and the trading day before a holiday, so I'm skeptical about seeing any meaningful downside tomorrow.  If we are going to see a retracement low retest therefore, it might need to be concluded today.

SPX 60min chart:

The first serious resistance on a rally like this is at the daily middle band, and that was tested at the rally high, so that is a very obvious level from which to see a low retest.

SPX daily BBs chart:

If we do see that low retest then that may well be the second low of a double bottom setting up a backtest of main resistance at the weekly middle band, now in the 4186 area. That would be a much larger inflection point as if SPX is going to deliver on the bull flag and retest the all time high, we would likely see a break and conversion of that to support to open the path to bull flag resistance, currently in the 4480 area.

SPX weekly chart:

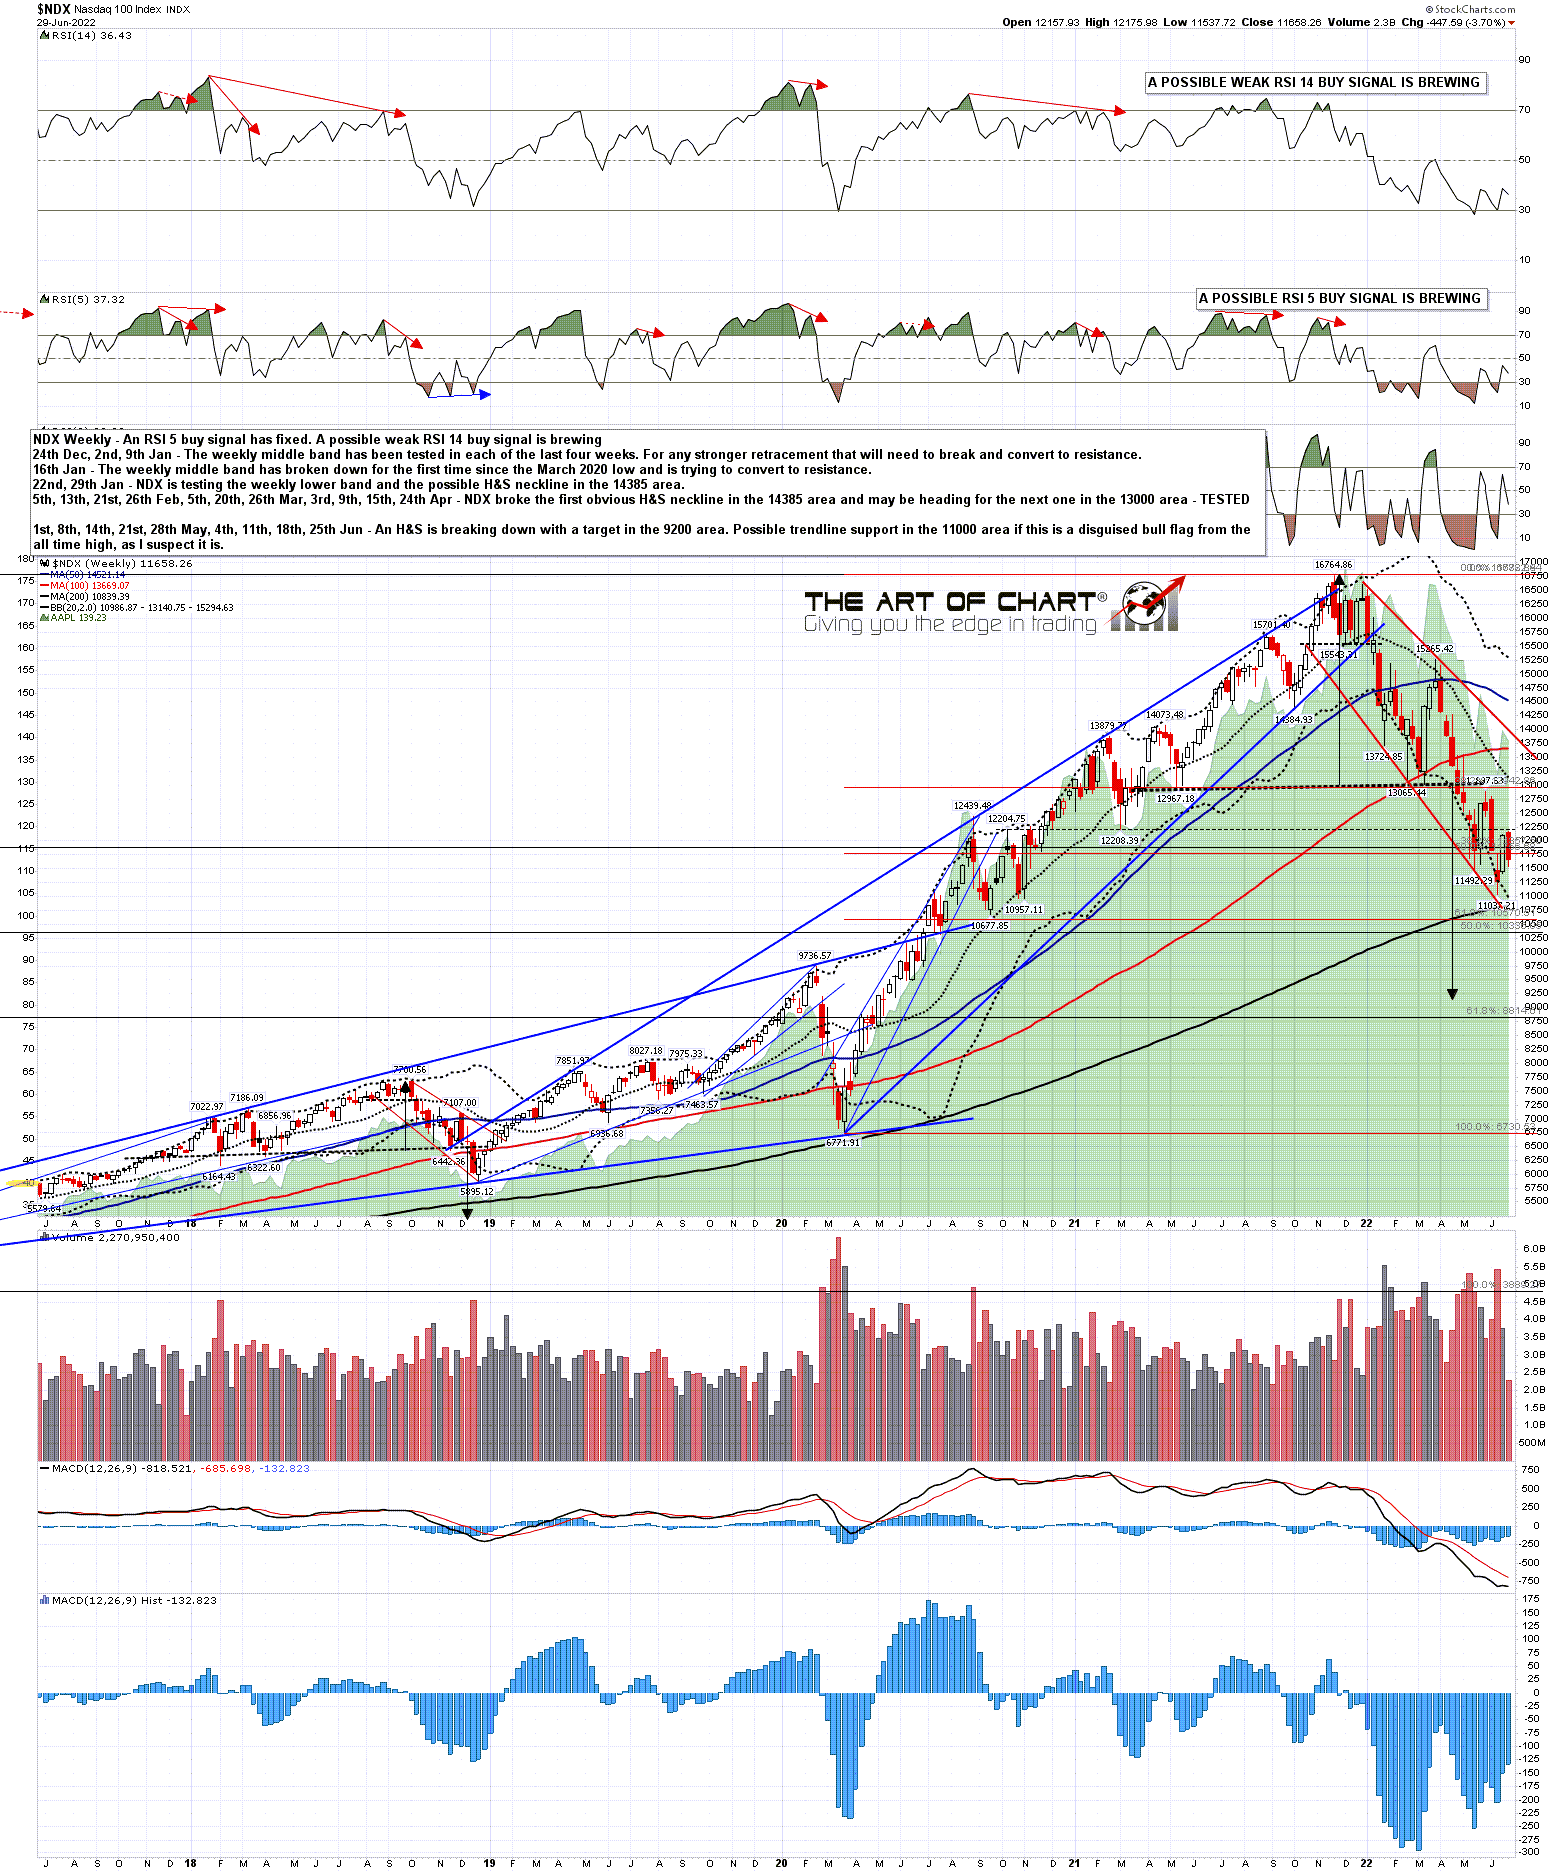
On NDX the bull setup is looking very nice here, with a perfect bull flag setup and weekly positive divergence on both RSI 14 and RSI 5.

NDX weekly chart:

On the rally over the last few days there were also some very encouraging breaks up. Here is the very encouraging bull flag setup on XLP that has already broken up.

XLP daily chart:

There is an opportunity to retest the 2022 low today and I'd love to see that if it can be managed. If so I'd be looking for a very possible second low of a double bottom and that would then be backed up by the very bullish historical stats tomorrow and the modestly bullish stats Wednesday through Friday next week.

If we are going to see that then on any intraday rally I would like to see yesterday's SPX low at 3799.02 respected to leave a high quality island top in place into that retest. If SPX can break back over 3800 and convert that to support then that low retest in the next few days would be  much less likely in my view.

We hold a couple of sales on annual memberships every year at theartofchart.net, and the summer sale is now on, with an extra 20% off annual memberships, so eight months for the price of twelve. If you're interested the sale page is here, the sale code is july4sale, and the sale is probably ending on Monday 4th July unless it is extended by a further day or two into latest Wednesday 6th July.

I should mention again that our Follow The Leader service at theartofchart.net is up 100% so far this year. The technology to support this service is provided by our partner, GFF Brokers. GFF Brokers is an authorized broker for the World Cup Trading Championships Advisor programs. The profits on that so far this year on the nominal  account of size at $25k would be enough to pay the Triple Play subscription at the standard monthly price for ten years. Follow The Leader is included in the Daily Video Service and the Triple Play Service, which includes the Daily Video Service. If you'd like to try a free trial of the Triple Play service you can find that here.

Friday 24 June 2022

Rally Testing Second Resistance

Daily RSI 5 buy signals have fixed across the board on SPX (weak), NDX (full), IWM (full) and Dow (weak), so it is possible that the rally may extend significantly further without a low retest. There are also fixed hourly RSI 14 buy signals fixed on all four and none of those have yet made target, though a couple of those may make the possible near miss target on the gap up this morning.

SPX daily chart:

The first resistance for this rally was in the 3785-3800 area, with the SPX double bottom target at 3785 and a really nice topping setup that formed there which is worth a look as it is a very nice example of a strong topping setup that I was following on SPX until it failed yesterday afternoon.

Obviously yesterday was the third day on the Three Day Rule, so bears needed to deliver a daily close below the 5dma in the 3725 area to trigger the Three Day Rule setting up the retracement low retest. A very nice looking topping setup formed on Wednesday afternoon and much of Thursday with an initial H&S marked in red that broke down on Wednesday afternoon to complete the head on the second pattern, in purple.

On Thursday morning there was a gap up into a near perfect H&S right shoulder and that broke down yesterday with a target in the 3710 area, and had that delivered into the close then SPX might have triggered the Three Day Rule retest into the today's bearish historical stats of 71.4% red closes. That would also have set up the third possible asymmetric double top or H&S, marked in black, to deliver the move back to the retracement low.

However SPX instead delivered a classic rejection back into a retest of the rally high. So where does that leave us this morning?

SPX 1min chart:

Well obviously the retest of the rally high yesterday afternoon set up a possible double top setup, but that has been considerably weakened by the overnight gap up that looks likely to fix at the open.

The other main option is that the initial rising wedge from the retracement low is expanding, with a new rising support trendline established at yesterday's intraday low. If so the obvious next target within the wedge would be wedge resistance, which closed yesterday in the 3827 area, and isn't far below the 15th June high at 3837.56, which is of course a possible IHS neckline. That test looks likely today and we'll see how that goes.

SPX 5min chart:

The resistance trendline on the SPX wedge isn't great quality though, and there is a better example on Dow which looks similar, but has a very nice three touch resistance trendline. That trendline is now in the 30,970 area, just below the 15th June high and possible IHS neckline in the 31,000 area.

INDU 5min chart:

The historical stats for today lean 71.4% bearish, and would have been ideal for a retest of the retracement low, but the setup to get there fell apart from yesterday afternoon and I'm very doubtful about seeing that today. I like resistance in the 3840 SPX area today and I like the chances of that holding. If so we could see an IHS right shoulder form that would have an ideal right shoulder low in the 3705 area. If that IHS forms and breaks up that would have a target in the 4037 area, well above the next big resistance area which is the daily middle band now in the 3948 area.

We hold a couple of sales on annual memberships every year at theartofchart.net, and the summer sale is now on, with an extra 20% off annual memberships, so eight months for the price of twelve. If you're interested the subscriptions page is here, and the sale code is july4sale.

I should mention again that our Follow The Leader service at theartofchart.net is up 100% so far this year. The technology to support this service is provided by our partner, GFF Brokers. GFF Brokers is an authorized broker for the World Cup Trading Championships Advisor programs. The profits on that so far this year on the nominal  account of size at $25k would be enough to pay the Triple Play subscription at the standard monthly price for ten years. Follow The Leader is included in the Daily Video Service and the Triple Play Service, which includes the Daily Video Service. If you'd like to try a free trial of the Triple Play service you can find that here.

Wednesday 22 June 2022

Back On The Three Day Rule Again

Last week I was talking about a likely modest rally coming, which we have seen, and then a low retest, which we have not yet seen but I'm expecting to see this week.

After that I'm thinking we may well see a much larger rally on SPX, and one thing I was waiting to see before that rally was decent positive divergence on the weekly RSI 5, which we now have.

If we do see that larger rally, then I'd be looking for a test, and perhaps a break, of main downtrend resistance, which is at the weekly middle band, now at 4209.

SPX weekly chart:

I was looking for two things before that larger rally on the daily chart and both are now in place. The first was positive divergence, and a weak RSI 5 buy signal fixed yesterday. If we see another low retest then a full size daily buy signal should start brewing.

The second thing was a daily high volume spike, often seen near significant highs and lows, and we saw that on Friday.  Does it matter that this spike was likely more about opex than exhaustion? Historically not particularly, though a high volume spike on a really strong down day would have been better.

SPX daily chart:

Yesterday SPX closed back over the SPX 5dma, now at 3726, and that puts SPX back on the Three Day Rule. If there is a clear close (3-5 handles minimum) below the 5dma in the next two days, then there should be a retest of the retracement low before a retest of the all time high, though that is of course a long way above right now. This rule has fixed eight times so far in 2022 and has delivered eight times so far. On this basis of calculation (after a rule tweak in 2019) this hasn't failed to deliver as far back as I have looked, to the start of 2007.

SPX daily 5dma chart:

Now I know the all time highs are a long long way above at the moment, but I work hard to draw my charts with an objective eye, and what I'm seeing on the US index charts, as well as many stocks and ETFs, from the all time highs are bull flags, which have generally been improving in quality as the markets have gone lower.

SPX historically has a very strong track record of retesting highs and lows while making significant tops and bottoms. A few years ago I went back through the full history of the SPX back into the 1920s and found that this happened about 70% of the time, forming double tops or bottoms at those retests. Now that is a significant distance from 100%, and bull and bear flags do break against expectation 20% to 30% of the time, but as long as those bull flag setups are there, then there is some chart support for a possible retest of the all time highs.

On the NDX chart a daily RSI 5 buy signal fixed yesterday and the bull flag setup is pretty decent.

NDX daily chart:

On INDU another weak RSI 5 buy signal fixed yesterday, but I'm showing the hourly chart below to demonstrate how some of the bull flag setups have been improving as markets have dropped lower. On the Dow hourly chart below you can see how the first bull flag trendline broke slightly to establish a better trendline.

INDU 60min chart:

The historical stats for the rest of this week are neutral to slightly bearish except for Friday which leans 71.4% bearish. If we are to see that low retest then the odds of seeing it happen this week are decent.

I find myself having to defend even suggesting that an all time high retest here might be possible, and obviously the economic backdrop isn't promising, but the charts say it is possible and I prefer to take my lead from those. There is also the reality that the news background tends to look bleakest at lows, and best at highs. When I wrote a post on August 6th last year talking about a possible backtest of 3800 SPX coming, the response was mainly polite incredulity, yet here we are. We'll see.

We hold a couple of sales on annual memberships every year at theartofchart.net, and the summer sale is now on, with an extra 20% off annual memberships, so eight months for the price of twelve. If you're interested the subscriptions page is here, and the sale code is july4sale.

I should mention again that our Follow The Leader service at theartofchart.net is up 100% so far this year. The technology to support this service is provided by our partner, GFF Brokers. GFF Brokers is an authorized broker for the World Cup Trading Championships Advisor programs. The profits on that so far this year on the nominal  account of size at $25k would be enough to pay the Triple Play subscription at the standard monthly price for ten years. Follow The Leader is included in the Daily Video Service and the Triple Play Service, which includes the Daily Video Service. If you'd like to try a free trial of the Triple Play service you can find that here.

Friday 17 June 2022

Blood In The Streets

I wanted to talk a bit this morning about big highs and lows on SPX. Obviously the economy may well be going into recession, interest rates will likely rise a lot further over coming years, and that has to happen really because examples in history where inflation has been brought under control without interest rates higher than that inflation are rare. The world is also particularly vulnerable to high interest rates because after so many years of very low interest rates, levels of both public and private debt are extremely high, and rising interest rates over time will likely force many people, companies and governments into defaulting on their debt. It is going to be rough.

The Fed has underpinned both the economy and asset markets for many years with low interest rates and easy money, but it's hard to see how that can be of much use here. I've heard it said that chocolate is the cure for all the ills of the world except stomach ache, and the Fed's usual responses here would seem likely to turn a crisis into a disaster. The Fed's options here in terms of the economy therefore look minimal and any market relief they can provide is likely to be transitory.

All that said we have good quality bull flags formed here from the highs on many indices, ETFs and stocks, and SPX has a VERY strong history of retesting highs and lows at important tops and bottoms. Even if SPX is going lower afterwards, the all time high may get a retest first and, if seen, that would of course set up a possible double top to take SPX lower. The outlook looks grim, but the old Buffett maxim is to buy when there is blood in the streets, and there is certainly a lot of that here. We are likely to see a very decent rally soon, and if SPX can break back over the weekly middle band, currently at 4245, and convert that back to support, then a retest of the all time highs is still possible.

On the weekly chart there is now a possible RSI 5 buy signal brewing, and SPX has punched well below the lower band, so there is a decent setup for a rally here.

SPX weekly chart:

On the SPX daily chart there is now some positive divergence on the RSI 5 though it isn't strong and we still haven't seen a high volume day to the downside. The bottoming setup here would still be improved by a rally and a low retest.

SPX daily chart:

If we are to see a decent rally here then I would be carefully watching the 5dma, currently at 3768. A daily closing break about would put SPX back on the Three Day Rule, so a fail after that may set up that low retest.

SPX daily 5dma chart:

On the SPX hourly chart a high quality RSI 14 buy signal is brewing, and if the bull flag on SPX is going to deliver, then the move over the last couple of days would be a bullish underthrow, suggesting that the retracement low is forming.

SPX 60min chart:

On the Dow hourly chart there is also a high quality RSI 14 buy signal brewing, and another possible bullish underthrow of the high quality bull flag setup there.

INDU 60min chart:

The historical stats for the rest of June are neutral, except for Friday 24th, which leans 71.4% bearish.

In the short term there is a lot of positive divergence here and I'm leaning towards at least a modest rally today and Monday. After that there is likely at least one more low retest coming, ideally on high volume to give a decent low signal. On the historical stats the back end of next week would be a good time to see that.

We hold a couple of sales on annual memberships every year at theartofchart.net, and the summer sale starts today, with an extra 20% off annual memberships, so eight months for the price of twelve. If you're interested the subscriptions page is here, and the sale code is july4sale.

I should mention again that our Follow The Leader service at theartofchart.net is up 100% so far this year. The technology to support this service is provided by our partner, GFF Brokers. GFF Brokers is an authorized broker for the World Cup Trading Championships Advisor programs. The profits on that so far this year on the nominal  account of size at $25k would be enough to pay the Triple Play subscription at the standard monthly price for ten years. Follow The Leader is included in the Daily Video Service and the Triple Play Service, which includes the Daily Video Service. If you'd like to try a free trial of the Triple Play service you can find that here.

Tuesday 14 June 2022

Through A Glass Darkly

SPX broke down and has retested the retracement low, as have NDX and Dow as well, but not yet IWM. This brings SPX and the other US indices to the key inflection point this year, where we see whether the move so far this year has been the formation of large bull flags setting up retests of the all time highs, or whether US indices are going to break down further directly.

What we have on the bull side here are possible buy signals now brewing on the weekly chart and clear high quality bull flags formed on SPX and Dow particularly, as well as on many other individual stocks and ETFs of course. On the bear side we have the worsening economy, rising interest rates and embedded inflation that the Fed are now admitting is not transitory. I would point out though that a retest of the all time highs might well not be a bullish development, as that might make the second highs on double tops large enough to then potentially retrace most or even all of the gains made since the 2020 low.

I've been looking for a high volume exhaustion day to the downside, and I was thinking that yesterday might be that day. There was significantly higher volume yesterday, but the SPX volume didn't reach the 3.5bn line that I generally look for as a clear signal that a strong reversal may be brewing.

SPX daily chart:

The daily bollinger bands on SPX are turning down again and expanding. SPX broke well below the daily lower band yesterday and is potentially in range of the 3sd lower band, which closed yesterday at 3690. If we were to see that hit in the next day or two that would be an excellent area to see a strong bounce.

SPX daily BBs chart:

I show the bull flag on SPX on the hourly chart below. The support trendline is very nice and the low yesterday was close to it so that may well hold as support short term. On either scenario it seems likely that we will see a rally start today or tomorrow and then see another retest of the low before a decent rally, probable on the bear scenario, or a reversal back up to retest the all time high on the bull scenario.

SPX 60min chart:

I'm showing the Dow Industrials daily chart below to show the very nice looking bear flag that has formed there.

I sometimes get the question as to whether bull flags ever break down and the answer is obviously yes. In fact on small timeframes and other instruments I have seen clear examples break down at least twice in the last month. Any pattern can always break in an unexpected direction or just evolve into something else. Technical Analysis can give you a high quality educated guess as to what comes next, but nothing is ever certain in the markets.

INDU daily chart:

That brings me to my last chart, which is the TNX (10 year treasury yield) chart. This has been an important chart to watch this year and, back in early February, on a break up from an IHS that had formed over the previous two years, I called a target at 32, at almost double the level at the time.

We could also see a strong reversal back down on TNX here, as I mentioned back in February that there is a possible IHS neckline in the 32.5 area, broken slightly yesterday, with a decent alternative in the 40 area if it goes higher. If we were to see the higher alternate then an IHS might form that could take TNX to 75 in a year or two. I think seeing interest rates back at that level is likely just a matter of time, so I'm watching this with great interest.

TNX monthly chart:

The historical stats for this week lean modestly bullish, and I'm looking for a short term low on SPX in the next day or two.

Stan and I have always been bad at boasting about past calls, or marketing as that is often called nowadays, but I'm going to be hooking out three really nice calls that I have made in the last year or two. The one I like best was on Natural Gas in early 2020, when NG was in the 2.0 area, and I called for a retest of the low at 1.61 to finish a bullish setup to take NG up to the 8.1 level that was reached a few weeks ago. In Technical Analysis we can only ever see through a glass darkly into the future, but we do sometimes nonetheless see some amazing things. I'll be digging out the video from the time to post that.

I'm planning another morning post on Thursday or Friday, subject to what happens in the meantime. Everyone trade safe. :-)

Friday 10 June 2022

Testing The Middle Band

Yesterday's bearish historical stats delivered hard and broke the bull flag setups that I posted in the morning. SPX is now testing the 4000 area and, if that breaks, the next target will likely be a retest of the retracement low at 3810.32.

I still like all the bull flags from the high here, but if SPX reaches the retracement low and continues down hard, there is an obvious target for that move. The H&S I have drawn on SPX from the high isn't high quality, but it isn't bad, and has a very obvious target in the 3400 area, which is a significant area because that would be a backtest of the pre-2000 crash all time high. In my view that would be the obvious target on a  break below 3600.

SPX weekly chart:

On the SPX daily chart, the close yesterday was below main rally support at the daily middle band, now at 4041, and if we see a confirming close below again today, then that will be a significant signal that SPX may continue directly down towards the retracement low, and after yesterday's breakdown, I do have a couple of high quality targets on the way there.

SPX daily chart:

Now one of the three flags I showed yesterday was just a flag triangle, and triangle targets aren't clear, but the other two had an alternate read as high quality H&S patterns, and those do have clear targets.

On the SPX H&S that broke down the target is in the 3980 area, and that's not far below. That would also be the about the 50% retracement of the rally so far. If we were to see that tested today then a rejection to close back over the daily middle band, then that would be a cautiously bullish setup suggesting that we might then have finished an A and B wave for the rally, and be starting a C wave that might reach the weekly middle band in the 4300 area.

SPX 5min chart:

NDX has a more ambitious target for the H&S there, as that pattern has only just broken down, and the target is well below the 61.8% retracement level for the rally. That target is in the 11910 area and, if reached, NDX would likely follow through into a retest of the retracement low.

NDX 5min chart:

The historical stats for today lean bearish,  and then lean bullish all of next week. If SPX is going to test the weekly middle band, that would be a good time to do that, and then most likely fail into a retest of the retracement low.

SPX may well fail directly from here though. Another close below the daily middle band would be bearish, and any significant move below the 61.8% level at 3950 would likely deliver a direct move back to the retracement low at 3810.32, where on the bullish scenario we might see the second low of a double bottom, and on the bearish scenarios we might fall through to one or both of the next decent support areas in the 3600 and 3400 area.

Everyone have a great weekend. :-)

Thursday 9 June 2022

Consolidation

SPX has been consolidating for a few days now, and generally speaking a consolidation like this leans bullish. I gave the ideal target for this rally at the weekly middle band and that remains the case in my view. That is now in the 4294 area.

SPX weekly chart:

In the short term  SPX has been consolidating mainly above the current weekly pivot at 4120 and has tested the monthly pivot at 4083. No test of the daily middle band at 4036 yet, and we could see that, but the short term charts are favoring at least a retest of the current rally high first.

SPX daily chart:

Looking at the short term charts a possible triangle is forming on SPX from  the rally high. The next obvious target would be triangle support, currently in the 4082 area.

SPX 5min chart:

On NDX this looks like a bull flag falling wedge forming from the high. The next obvious target within the flag would be wedge support, currently in the 12390 area.

NDX 5min chart:

Dow is the most bullish looking in the short term though. This looks like a bullish triangle forming from the rally high and, if so, the low yesterday was a possible wave E low that would be seen directly before a break up. This may evolve into another kind of bull flag with a low below 32.5k, but it may just do the obvious thing and break up directly from here.

INDU 5min chart:

The historical stats for today and tomorrow lean bearish,  and then lean bullish all of next week. If SPX is going to test the weekly middle band, that would be a good time to do that, and then most likely fail into a retest of the retracement low.

We did our monthly free Chart Chat webinar at theartofchart.net on Sunday, and if you'd like to see that the recording is posted here.

Stan has had COVID the last week but has been keeping up with our webinars so I believe that we are doing our monthly free Trading Commodities webinar at 5pm Eastern Time today, looking at trading opportunities and setups on commodities and designing three potential option trades from those , and if you'd like to attend you can register for that here, or on our June Free Webinars page. If that isn't going ahead I'll mention that on my twitter later today.

Friday 3 June 2022

Marking Time

In my last post a week ago I was talking about the prospects on SPX for testing the weekly middle band, currently at 4312, on this rally, with particular reference to the very historically bullish two first days of June, which were the last two days this week. Unfortunately for the bulls, these were both wasted in a sideways consolidation, so reaching that target now looks more doubtful, and the odds of a break down before that target is reached have increased.

On the daily chart the middle band, currently at 4024, is now key short term support, and above that is the new monthly pivot at 4083, tested and confirmed as support in the last two days. If SPX breaks and converts those to resistance, then this rally would likely be over and I'd expect a retest of the retracement low at 3810.32 not long afterwards. A possible daily RSI 5 sell signal is brewing and I wouldn't be surprised to see SPX fail directly from here.

SPX daily chart:

In the short term SPX retested the rally high in the last hour yesterday, and that has set up a possible double top setup that could play out next. Short term trendline support is now in the 4110 area, and there is still a decent looking double bottom that has broken up with a minimum target in the 4325 area, slightly over the larger possible IHS neckline in the 4307/8 area.

SPX 15min chart:

On NDX there is still a decent looking double bottom target in the 13500 area, slightly under the possible IHS neckline in the 13550 area. As with the SPX double bottom target that can still be reached, but the best time to have done that would have been in the last two days, so that is less likely now.

As with SPX, in the event that NDX breaks the support established this week, then there is a decent looking double top setup that could take SPX much of the way back to the lows.

NDX 15min chart:

On Dow there is still a decent looking double bottom target in the 34,200 area, slightly under the possible IHS neckline and very well established resistance in the 34,100 area. As with the SPX and NDX double bottom targets, that can still be reached, but the best time to have done that would have been in the last two days, so that is less likely now.

As with SPX and NDX, in the event that INDU breaks the support established this week, then there is a decent looking double top setup that could take INDU much of the way back to the lows.

INDU 15min chart:

On IWM there is no current bottoming pattern target, but the possible IHS neckline is in the 194 area. As with SPX,  NDX and Dow, there is now a possible double top setup that could take IWM down again, and unlike any of the others, the obvious read on IWM since the low on 11th May is that a large bear flag has been forming.

IWM 15min chart:

There is still a choice to make here, and the odds of making the ideal double bottom targets and resistance levels have reduced because the ideal time to do that was in the last two days. There are decent short term topping patterns and in the event that SPX trades sideways again today the odds of a hard fail near the start of next week would be high.

One way or another SPX is likely to retest the current retracement low, because a move like the one we have seen so far this year will generally finish with a strong move down on high volume, and we haven't seen that yet. The odds are decent that the move down to test the low will start over the next few days, and a potential setup is already in place for that to start today.

The historical stats over the next week are neutral today and Monday, lean bullish on Wednesday, and bearish on Tuesday, Thursday and Friday. If we don't see SPX test the 4300 target area by Wednesday at the latest, then the odds will be good that this rally will fail without reaching it. If so there should by then be stronger rally pattern setups from the lows on the US indices and I'll be posting those.

We did our monthly free webinar at theartofchart.net on Big Five stocks and (eleven) Key Sectors yesterday, and if you'd like to see that the recording is posted here.

We are doing our monthly free Chart Chat at 4pm Eastern Time on Sunday, covering equity indices, bonds, commodities and so on, and if you'd like to attend you can register for that here, or on our June Free Webinars page.

Everyone have a great weekend :-)