- WE'RE JUST RANDOM SPECKS OF DUST IN A TORNADO TO THE MARKETS .......
- CHARTISTS MUST PUT ALL BIAS ASIDE AND LET THE CHARTS DO THE TALKING OR WE'LL SEE ONLY WHAT WE WANT TO SEE
- This blog has a copy of all header posts that I publish anywhere, so that those interested in seeing what my thoughts are on the markets can find them easily.
- I will be answering questions and responding to comments, so feel free to respond to any posts and I will see your comment even if it is not on the most recent post.
- If you're interested in seeing any intraday charts I post, I do that on twitter, and my twitter handle is @shjackcharts.
- The charts in the posts are as large as I can practically make them. if you would like to look at one more closely, click on it, and the link will take you to a larger version at screencast. If you click on that again, you will get a full page version, and can use the resizing function on your browser to enlarge parts of interest further.

Thursday 29 June 2023

Binary Decision Point

I was looking earlier this week on the very high quality falling wedge that had formed on SPX from the last high and considering the odds that it was a bull flag setting up a retest of the high.

Since then the wedge has broken up, retraced about 50% of the decline, and an IHS has formed with a target back at a retest of the last high.

At this stage there are only two main options. Firstly that the IHS breaks up, converts the neckline to support, and goes on to retest the last high, and secondly that SPX drops back through 4360, and likely then retests the last low at 4328.09, and then very possibly down further. It is very likely that we will see one of those two options happen next.

SPX 5min chart:

On the ES chart the setup is even cleaner. There is a near perfect quality IHS that has formed and broken up with a target at the retest of the last high. That has broken up slightly overnight and completed a close to exact 50% retracement of the move down from the last high. This is a near perfect setup to either retest the high or fail back into the lows.

A break below 4400 at this point fails the IHS and look for a retest of the current 3969 low. A conversion of 4430 sets up the high retest.

On the bear side I would note that a 60min sell signal fixed on ES yesterday.

ES Sep 5min chart:

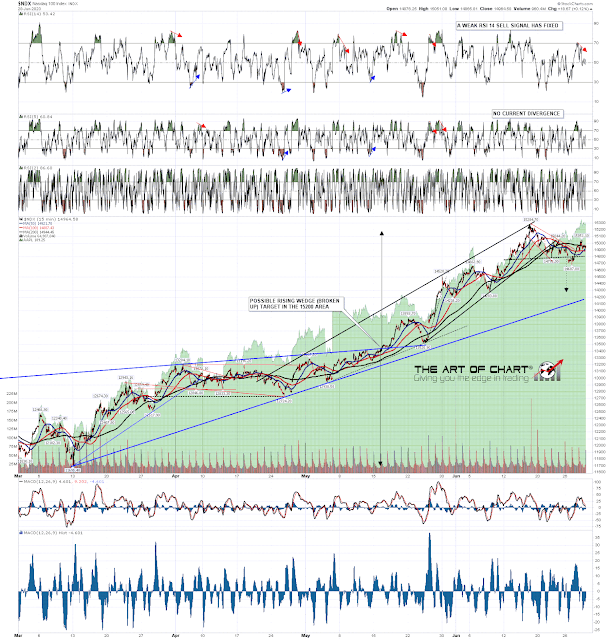
On the bull side the H&S on NDX that had broken down and I was looking at in my last post failed at the high yesterday. That failure has a target at a retest of the last high so that was a significant strike in favor of the bulls here.

NDX 15min chart:

So what are the odds here? Well the setup is ambiguous, but there is still a decent argument for a high retest, and today leans 61.9% bullish. Tomorrow leans neutral to mildly bullish and Monday leans 85.7% bullish on SPX. With Independence Day coming up this is a holiday period, which generally favors the bulls.

I'd give the odds here at 65% in favor of this resolving bullishly but beyond that this is all about the breaks today. If support at 3960 SPX and 4400 ES is broken then it is very likely this resolves down. If 4390 SPX and 4430 ES can be converted to support then it is very likely this resolves up. We will see.

We are running our July 4th sale with deep discounts on annual memberships at theartofchart.com. If you're interested you can see the page and offer here.

If you are enjoying my analysis and would like to see it every day at theartofchart.net, which I co-founded in 2015, you can register for a 30 day free trial here. It is included in the Daily Video Service, which in turn is included in the Triple Play Service.

Tuesday 27 June 2023

Hard Knocks

Over the last few days SPX has been retracing and is approaching the first big support level. That is the daily middle band, which closed yesterday at 4312, with the low yesterday at 4328. That is a target that may be reached today.

SPX daily BBs chart:

On the bigger picture, a reversion to the mean retracement may well be in progress here. If so, the obvious target for that retracement would be a hit and possible break below the 45dma, currently at 4212 and a decent match with the 38.2% retracement of the move up from the October low at 4205. If we were to see a move of that magnitude we might well first see a topping pattern form.

SPX daily 45dma chart:

The usual reversal pattern that forms on SPX/ES is some kind of a double top or bottom. Historically that happens about 70% of the time, with the next most likely option being an H&S. Is there a case for either here?

Well there is a well formed falling wedge from the last high on SPX. That may well be a bull flag, and on a break up over wedge resistance in the 4350 area could set up that high retest. There is also a decent looking H&S neckline in the 4338 area that was holding well for a day or two, but the move below it yesterday is weakening the H&S option. A test of the SPX daily middle band from here would weaken that significantly further.

There is a third option here. The falling wedge itself could break down, as they do 30% of the time, in effect becoming that topping pattern. I've included a close up view of the falling wedge on the 5min chart shortly after the open this morning. It is a very nicely formed example of a bull flag wedge.

All three of these options could yield targets in the 4200 area, satisfying the reversion to the mean target.

SPX 15min & 5min charts:

Are there any other decent looking bull flag setups here? Well there is a high quality falling channel from the high on IWM that may also be a bull flag. A small H&S formed at the high and has now made target, so this would be a natural area to reverse back up.

IWM 15min chart:

Is there anything supporting a move directly down from here? Yes, a decent quality H&S has formed on NDX and has broken down with a target in the 14290 area. That cuts both ways of course, a rejection back up over the right shoulder high at 15044 would make this, in effect, another bull flag setup with a target back at a retest of the last high, but a continuation down would support a further break down on SPX.

NDX 15min chart:

So what are we likely to see happen next on equity indices? Well the bull flag wedge on SPX is a very good example, and topping patterns on SPX lean about 70% towards double tops and bottoms. The second most popular type of reversal pattern is an H&S and wedges breaking against expectation are possibly a distant third.  There is a second decent looking flag on IWM and, in the event that the H&S on NDX fails, in effect a third. The odds favor a break up next here on SPX, we'll see whether we get that. In the event that we see a break down directly towards the 4200 area instead, the first clear signal will be a break and conversion of the daily middle band.

The historical stats for yesterday were very bearish and delivered, but the stats for the next couple of weeks are a different story, mostly neutral other than bullish leans on Thursday and a very bullish lean on Monday 1st July. The next strongly leaning bearish day is at opex on Friday 21st July. This would be a decent opportunity to see a high retest.

We are running our July 4th sale with deep discounts on annual memberships at theartofchart.com. If you're interested you can see the page and offer here.

If you are enjoying my analysis and would like to see it every day at theartofchart.net, which I co-founded in 2015, you can register for a 30 day free trial here. It is included in the Daily Video Service, which in turn is included in the Triple Play Service.

Tuesday 20 June 2023

The Road Less Travelled

Two weeks ago I was looking at the stats for near misses of the 3sd daily upper band on SPX and looked at the twelve comparable instances going back to 2007. Eleven of those delivered some kind of short term high afterwards, so the odds leaned strongly towards that, but the other delivered a four day consolidation and then continuation higher, and that is what we saw here. There was a four day consolidation and then the daily upper band ride resumed, with the daily upper band tested again last Friday 9th June and then every day last week.

The daily upper band closed at 4436 on Friday and (finger in the air) I'd be expecting that to be in the 4450 area today.

As and when this upper band ride ends, and looking at the action over the weekend it may already have ended, then a backtest of the daily middle band will be on the table as a possible retracement target. That's a moving target of course, and closed Friday in the 4261 area.

SPX daily BBs chart:

On SPX there has been a strong follow through from May's closing break over the monthly middle band, now in the 4159 area. That is a possible backtest target.

SPX monthly chart:

NDX has also risen strongly towards the obvious next target at a retest of the all time high. No obvious reason at the moment to think that the target won't be reached in coming months.

NDX monthly chart:

Two week ago I was asked about reversion to the mean on SPX, and I replied that I wouldn't be thinking that looked urgent unless rose another couple of hundred handles. As SPX then rose slightly over 220 handles in the next two trading weeks that is now very much on the table. Friday's high on SPX was 6.2% over the 45dma, so that is now reaching the levels at which reversion to the mean (45dma, now at 4188) started in Q4 2022 and Q1 2023.

SPX daily 45dma chart:

One chart I don't post often but look at every day is the daily SPXADP (advance/decline) chart. When the 9dma on that chart reaches 30 it is time to be looking for a high to form for a retracement or consolidation and that level was hit last week.

SPXADP daily chart:

The historical stats this week are neutral but some serious overbought warnings are now flashing on SPX, and the volume spike on Friday is suggesting that the high may have been made then, or will be made in the very near future. A retracement looks likely, and if that is just a retracement, then the way that ends and turns back up should tell us a lot about whether we are likely to see all time high retests on NDX and SPX this year.

In the short term there is a decent amount of negative divergence across the indices, but there would be a lot more if last week's high was retested. We might see that retested this week.

We are running our July 4th sale soon on annual memberships at theartofchart.com. I'll post the link on a post and on my twitter when the page is up.

If you are enjoying my analysis and would like to see it every day at theartofchart.net, which I co-founded in 2015, you can register for a 30 day free trial here. It is included in the Daily Video Service, which in turn is included in the Triple Play Service.
Friday 9 June 2023

Looking For A Short Term High

The high last Friday was only three handles below the close on the daily 3sd upper band, which is a rare event, so I did what I like to do with rare events, I looked back and crunched some numbers looking at previous examples. These are the stats I posted on Monday morning. 

There are eighteen previous instances since the start of 2007 where a move has either punched through the 3sd upper band or delivered a near miss within 0.0025% of it (10 points at nominal SPX level 4000). Excluding the punches, none of which were preceded by near misses, there are twelve instances. Of those twelve instances five of them delivered a second near miss within three trading days, usually on the next trading day. Of those two delivered a third near miss within four trading days.

In terms of what happened after that the twelve divide into:

  • 1x - 4 day consolidation then continuation of the uptrend
  • 6x - Forming short term high into a 2% + decline then continuation of the uptrend
  • 3x - Made immediate significant high into 5% + decline
  • 2x - Forming significant high into 10% + decline

The odds here are therefore 5/12 that we see a continued run that makes at least one more near miss of the 3sd daily upper band this week.

The odds here are therefore 11/12 that some kind of high is forming here that will deliver at least a bull flag retracement.

The odds here are therefore 5/12 that some kind of significant high is forming here and of that 3/12 or about 25% that high was made on Friday.

If we were going to see another near miss of the daily 3sd upper band, currently at 4370, that would generally have already been seen, but there is a small chance that we may see that today. So far all the other options listed are still on the table as SPX has not yet made a higher high, though the odds favor seeing that today. After that, at minimum the odds are 11/12 that some kind of high is forming here, and 9/12 that a high is forming here that should deliver a minimum 2% retracement. So how's that setting up?

SPX daily BBs chart:

On the SPX hourly chart the action since the high on Friday looks like a bull flag forming, and the odds are that we will see a retest of that soon. Looking at the overnight action I think that would likely be this morning. As soon as that higher high is made a possible hourly RSI 14 sell signal will start brewing. A possible short term double top is forming.

SPX hourly chart:

I was saying last Friday that NDX had been doing most of the bullish running, and that has changed this week, with IWM and Dow leading, then SPX and NDX at the back. The An hourly RSI 14 sell signal fixed on Monday and has already reached the possible near miss target.

A possible short term H&S is forming that may be setting up a modest further decline.

NDX hourly chart:

On the IWM chart a possible hourly RSI 14 sell signal is brewing. No obvious reversal pattern yet.

IWM hourly chart:

On the Dow chart a possible hourly RSI 14 sell signal is also brewing. Possible short term double top forming too.

INDU hourly chart:

The historical stats for today lean two thirds bearish, though I'm not sure how much that really means on a Friday, which tends to be the least likely day to see a meaningful decline. We'll see how it goes today, but there are high odds that at least a short term high is forming here.

One additional thing to bear in mind is that we have FOMC next week and I think the roll into the new ES contract is next week too. Those two factors may make making a short term high here a slower and more complex process. We'll see.

I wrote most of this post before the open. Since then SPX has now retested Friday's high as expected, so that is the pop. Next up should be a drop, so I'm watching to see whether SPX delivers that, and whether the possible hourly RSI 14 sell signals on SPX, IWM and Dow can fix today. The SPX daily upper band is now in the 4327 area and I'd be looking for resistance there. Everyone have a great weekend. :-)

We are doing our free monthly public Chart Chart at theartofchart.com at 4pm EDT on Sunday 11th June looking at the usual very wide range of markets. It should be interesting. If you'd like to attend you can register for that here, or on our June Free Webinars page.

If you are enjoying my analysis and would like to see it every day at theartofchart.net, which I co-founded in 2015, you can register for a 30 day free trial here. It is included in the Daily Video Service, which in turn is included in the Triple Play Service.

Monday 5 June 2023

Veni Vidi Vici

In my premarket video on Tuesday I was looking at the setup and the historical stats and, was saying that a consolidation was likely to start the week and, then we would see what the bulls could do with the very bullish historical stats on Thursday and Friday. Well, they came, they saw, and they have conquered so far, so as it stands we now have the start of what could be a serious bullish break up on SPX.

Short term though, SPX is so stretched that the high on Friday was only three handles below the close on the daily 3sd upper band, which is a rare event, so I did what I like to do with rare events, I looked back and crunched some numbers looking at previous examples.

There are eighteen previous instances since the start of 2007 where a move has either punched through the 3sd upper band or delivered a near miss within 0.0025% of it (10 points at nominal SPX level 4000). Excluding the punches, none of which were preceded by near misses, there are twelve instances. Of those twelve instances five of them delivered a second near miss within three trading days, usually on the next trading day. Of those two delivered a third near miss within four trading days.

In terms of what happened after that the twelve divide into:

  • 1x - 4 day consolidation then continuation of the uptrend
  • 6x - Forming short term high into a 2% + decline then continuation of the uptrend
  • 3x - Made immediate significant high into 5% + decline
  • 2x - Forming significant high into 10% + decline

The odds here are therefore 5/12 that we see a continued run that makes at least one more near miss of the 3sd daily upper band this week.

The odds here are therefore 11/12 that some kind of high is forming here that will deliver at least a bull flag retracement.

The odds here are therefore 5/12 that some kind of significant high is forming here and of that 3/12 or about 25% that high was made on Friday.

SPX daily BBs chart:

On the monthly chart SPX has now traded the month so far entirely over the monthly middle band, currently at 4153, and is also punching over the main support/resistance trendline from the 2009 low, currently in the 4250 area. If that converts to support, then the path is open for a possible retest of the all time high.

SPX monthly chart:

On the daily 45dma chart the high on Friday was at 3.7% over the 45dma. That is stretched by normal standards but with the last two highs over 6% above the 45dma there is no immediate reason to look for reversion to the mean.

SPX daily 45dma chart:

On the SPX chart The move on Friday and, to an extent, any short term follow-through to the upside may still be a bearish overthrow on the rising wedge from the 2022 lows. We will see.

SPX 60min chart:

On the NDX chart there are three pattern setups looking for a minimum move to 16400, in effect a retest of the all time highs, and if bulls can hold the next move down to a retracement, then NDX may well be heading for towards that in the next move up.

NDX 60min chart:

The stats for the rest of June lean neutral to slightly bearish overall. Thursday this week leans significantly bullish, and Wednesday and Friday both lean significantly bearish. The odds of making at least a short term high this week are at least 70% overall and the best days to make that high would obviously be today, tomorrow, or Thursday.

We are doing our free monthly public Chart Chart at theartofchart.com at 4pm EDT on Sunday 11th June looking at the usual very wide range of markets. It should be interesting. If you'd like to attend you can register for that here, or on our June Free Webinars page.

If you are enjoying my analysis and would like to see it every day at theartofchart.net, which I co-founded in 2015, you can register for a 30 day free trial here. It is included in the Daily Video Service, which in turn is included in the Triple Play Service.

Saturday 3 June 2023

Knock On Wood

I was talking to a trader friend about resistance levels a few years ago and I remember him saying to me that the more often you knock on a door, the more likely it is to open. In effect what that means that however strong a resistance level is, and however often an index may fail there, if it keeps returning after each failure, then sooner or later it is likely to break up, and that may well be what we have been watching here on SPX.

We don't have a confirmed break yet, but SPX closed May significantly over the monthly middle band, and so far today has been pushing through the main support/resistance trendline from the 2009 low. If that breaks and converts to support, then the path would be open for a possible retest of the all time high.

SPX monthly chart:

Tech has been dominating this move up almost to the exclusion of everything else, so NDX has broken up hard over the monthly middle band and there is a decent case that it already has a target back at a retest of the all time high.

One of the NDX all time high retest targets comes from the large H&S that broke down last year and failed on the break back over the right shoulder high  at 13720.91. There are two more pattern targets there open now and shown below on the hourly chart.

NDX monthly chart:

On the NDX chart a large double bottom has now broken up and backtested that is looking in effect for a retest of the all time high. The even better pattern though is the rising wedge that formed from the lows last year that has broken up with a slightly lower target.

Altogether that is a solid pattern setup to reach the retest of the all time high on NDX and I'm taking that very seriously, though these patterns can fail of course. In that event we would likely see retests of last year's lows.

NDX 60min chart:

On SPX there is an even nicer overall rising wedge formed from the lows last year, and the move up today is now slightly overthrowing wedge resistance. This is a key inflection point. A hard fail here could take SPX back to last year's lows. A hard break up could open a retest of the all time high on SPX too, though if we were to see that, we would probably need to see this move up broaden beyond tech stocks into the wider market.

SPX 60min chart:

What is the SPX daily chart telling us here? There are two important things to note.

The first is that at the time of writing the 3sd daily upper band is at 4291, and the high so far today is at 4286. SPX is very stretched and at least a significant retracement is likely close. That could deliver a backtest of the daily middle band, currently at 4164, supported by the June monthly pivot, currently at 4153.

The second is that there was a strong volume spike on Wednesday, and that is something often seen at a significant high or low. There was no obvious significant low to be made here, but a significant high is very possible. We'll see.

SPX daily chart:

I was noting earlier this week that the historical stats for yesterday and today leaned very bullish. Those have delivered in spades. From here the rest of the month leans neutral to bearish, so we'll see how that goes.

In the short term there is significant negative divergence building on the ES/SPX and NQ/NDX charts here and a short term high is likely either close, or already made.

If you are enjoying my analysis and would like to see it every day at theartofchart.net, which I co-founded in 2015, you can register for a 30 day free trial here. It is included in the Daily Video Service, which in turn is included in the Triple Play Service.