My apologies for this being the first post in a couple of weeks. Hoping to get this back to a couple of posts a week now.
I've been avoiding discussing COVID-19 much in recent months as it is very much an election issue in the US and that's not a conversation I really want to be involved in. The progress of COVID-19 is very much a market issue as well though, so I'm going to drop in some hopefully not too controversial statistics on COVID-19 mortality rates as these are now becoming a lot clearer as time has passed.
In terms of deaths per confirmed case there have now been just over 33 million cases and about 1 million deaths worldwide at the time of writing. That puts the death rate per confirmed case at just over 3%, which will be low as there is a lag of about 16 days between a case being confirmed and the likely date of a consequent fatality. However in practical terms the actual mortality rate is likely much lower, as a lot of people get COVID-19 without having been tested, particularly those who show slight or no symptoms at all when infected, which may be as high. The CDC is estimating that the true mortality rate is in the 0.6% area in the USA, which is likely about right. What is very interesting though is the variation in the mortality rate between different groups within that overall average.
My numbers here are based mainly on an excellent study in Indiana, though these are comparable with a number of studies worldwide in richer countries. The death rate in poorer countries will obviously tend to be higher due to poorer access to healthcare.
Over half the deaths in Indiana were among nursing home residents, as the risk of death rises very sharply with age or co-morbidities from other health problems such as hypertension and diabetes. Excluding those in institutions the average age at death was still 76.9 years. Breaking that down further, if one were to take the numbers as per every thousand deaths of people of 60 or over, there would be 70 deaths from people aged 40 to 59 years, and just 6 deaths of those 12 to 40 years old. Men are 33% more at risk than women, and whites are slightly more than three times less likely to die than non-whites, with the average age among whites at death at 78.9, and non-whites at 73.3.
What does all this mean? Well it means that this pandemic is very unlike the 1918-20 pandemic, which preferentially attacked the young, and killed, at best estimate, about 2.5% of the population of the world at the time. This death rate is far lower, and the majority of deaths in the US are among those who would likely have died from another cause within five years without the pandemic.
In terms of the economic cost of the pandemic, it is already high and may get a lot higher before the pandemic declines enough for economies to strongly recover. Infection numbers are rising again in many countries, including both US and UK, and here in the UK there is serious talk that the country may be back in full lockdown within days, albeit mainly it seems because so many people aren't bothering to observe social distancing rules or to wear masks. Personally I'm thinking that there is a growing case for our species name Homo Sapiens Sapiens to be shortened by at least one Sapiens (meaning wise in latin), and taking the year as a whole, possibly two.
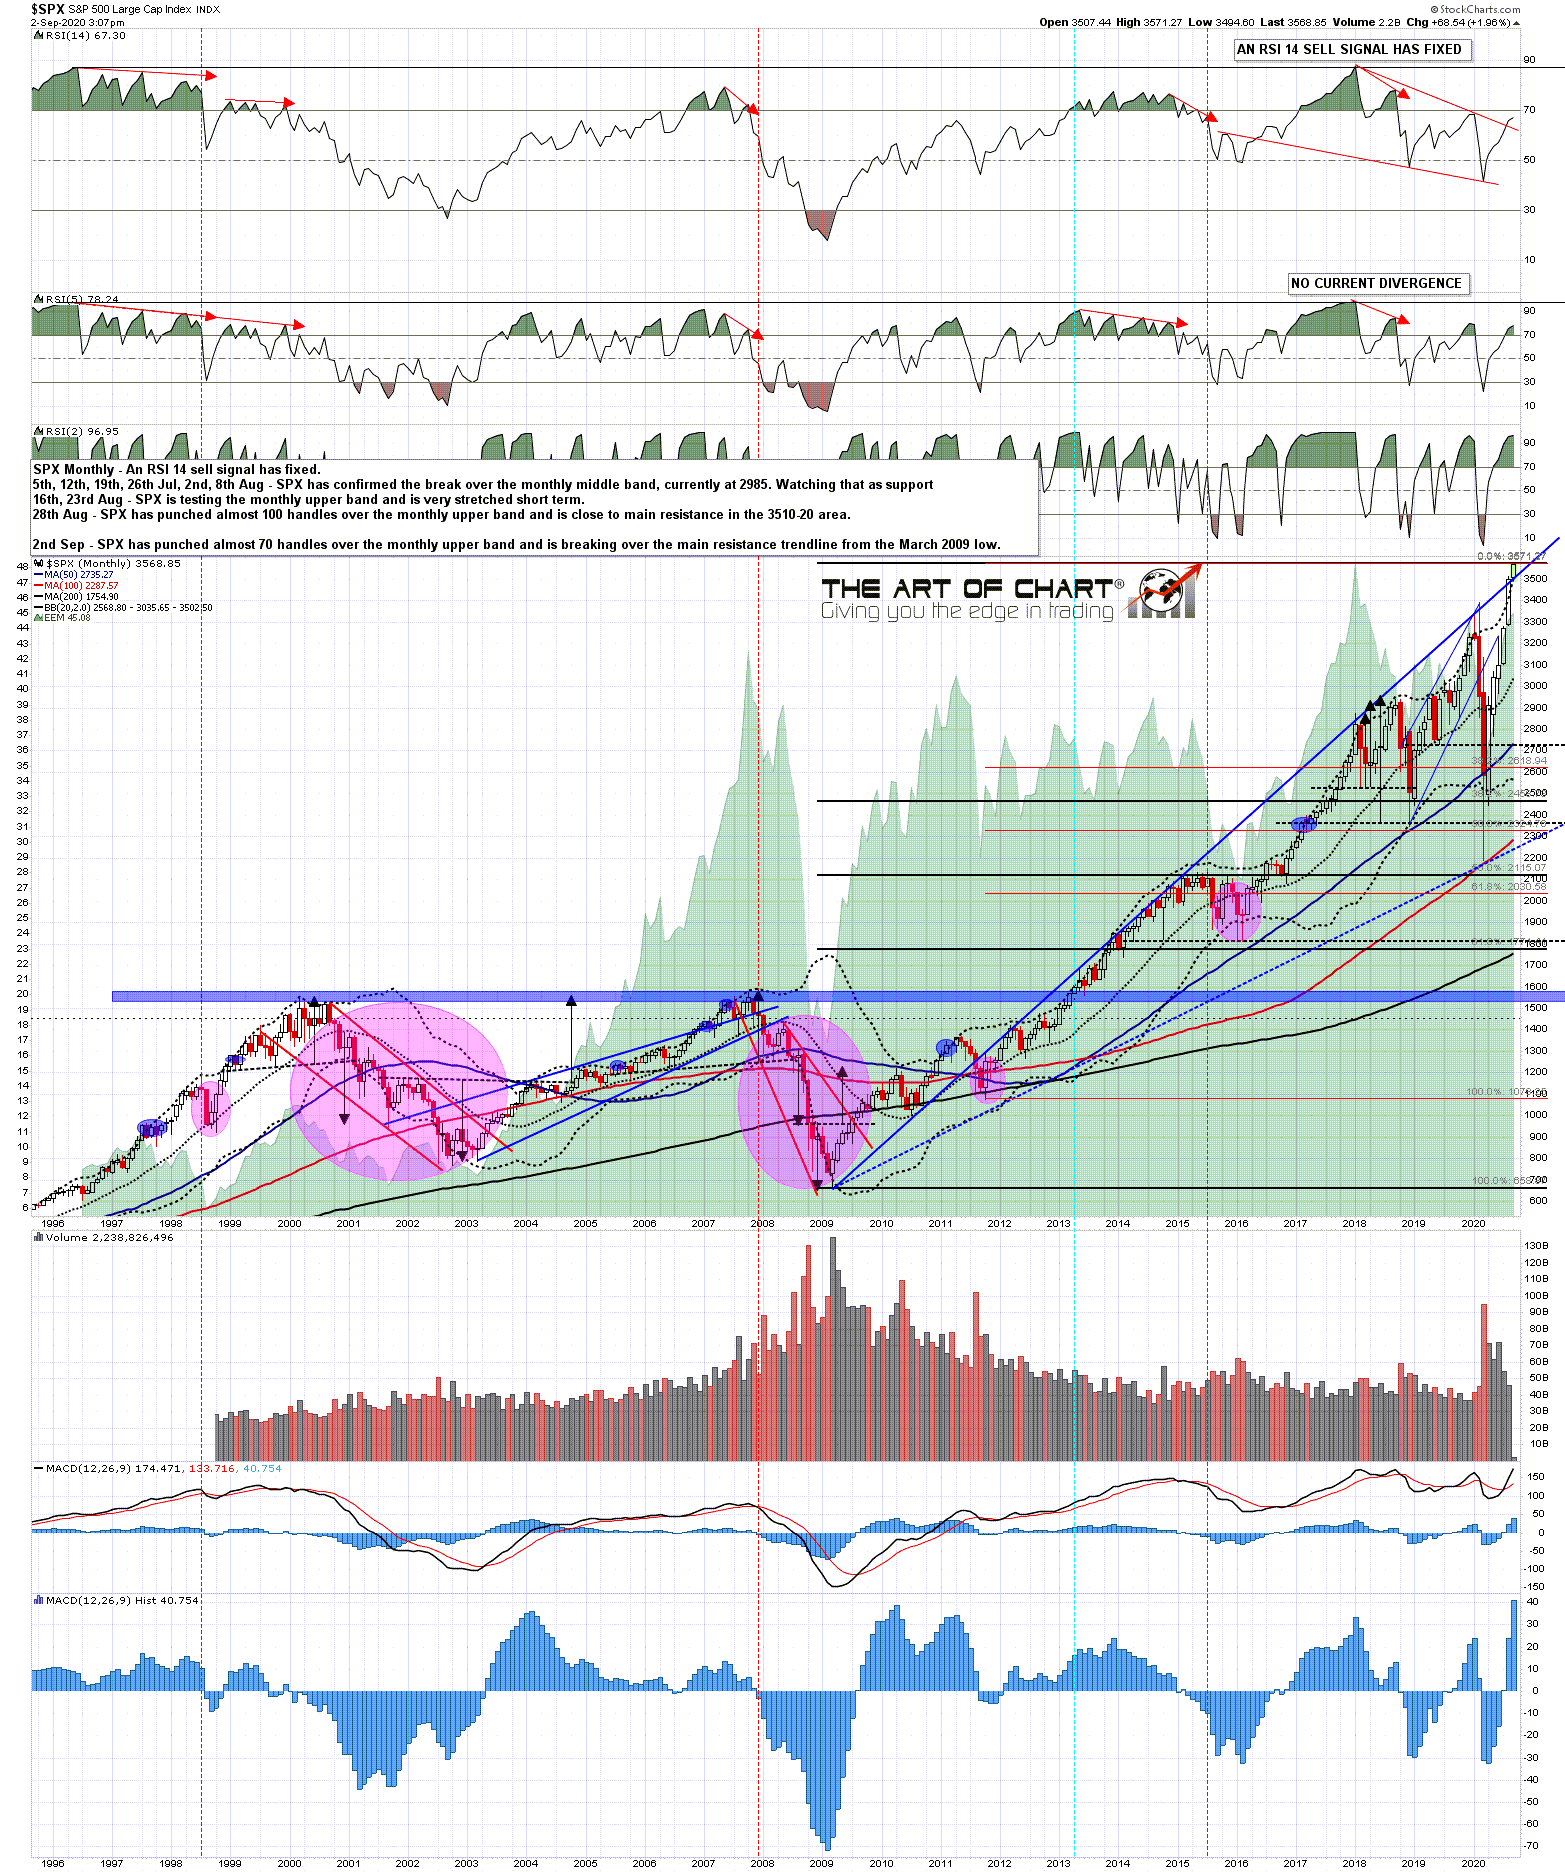
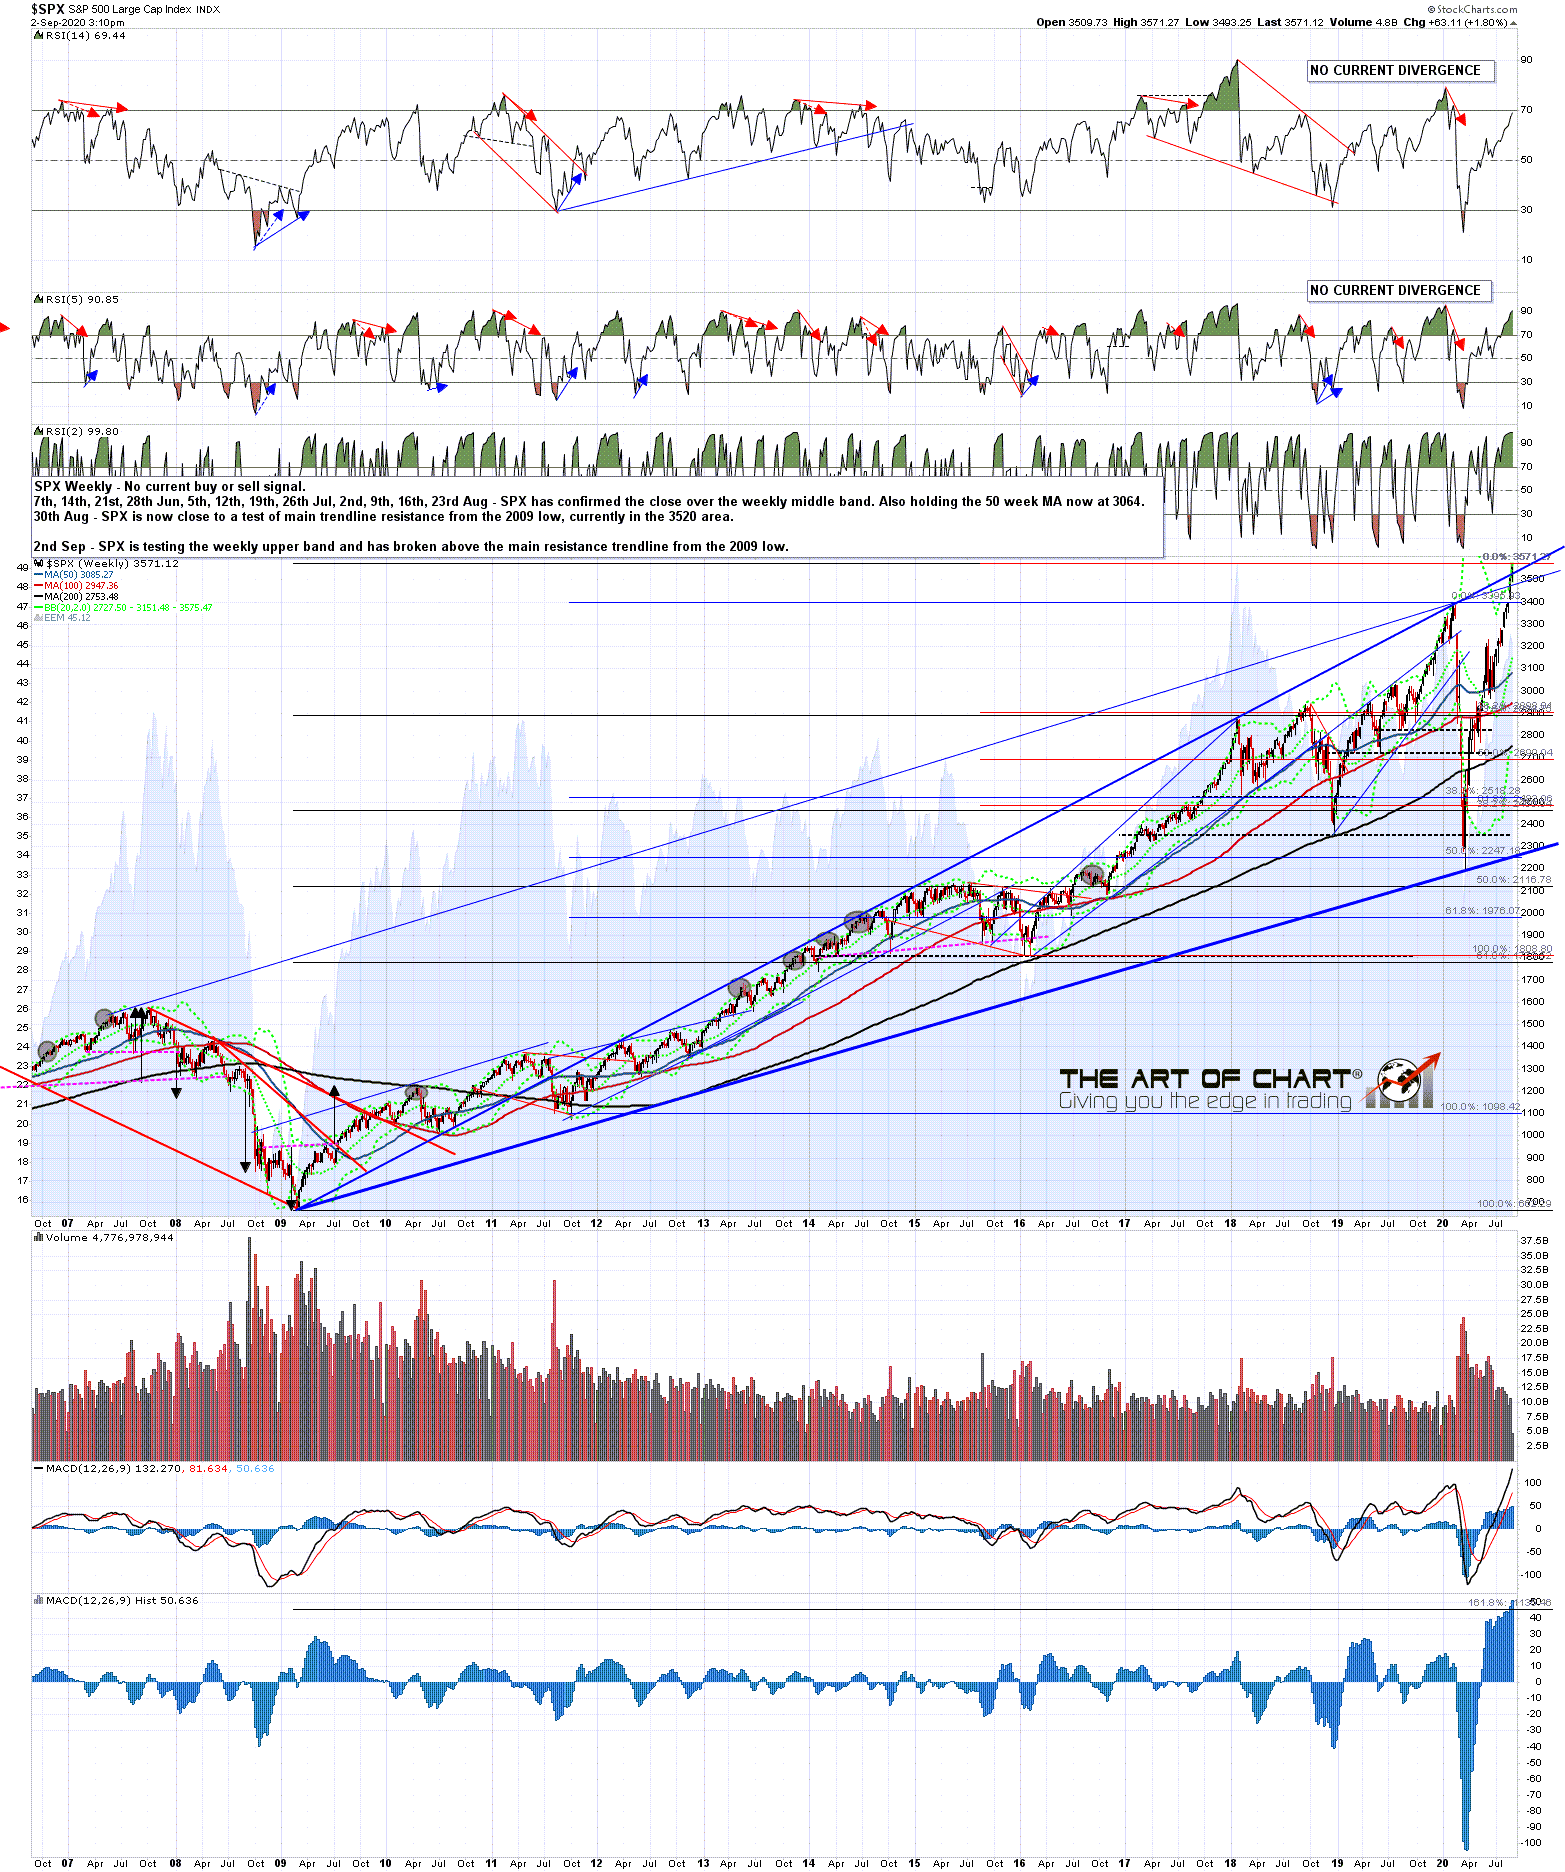
On to the markets where markets have been retracing from the new all time highs made on SPX in August, well after the new all time highs made on Nasdaq in June, and I have read then and now a lot of people talking about a big new bull market starting in March this year. Frankly I was sceptical about that then and remain so, but since March at least the Fed has certainly done a great job of reassuring markets, though without managing the more difficult job of putting economies back on track. There has been a lot of economic pain from COVID-19 so far, and there will likely be a lot more, with government debts also ballooning across much of the first world over 200% of GDP, well over the level (at about 180% as I recall) where the risk of eventual default on their government bonds becomes a major risk. Is this a good environment over the next few years for stock markets? We'll see, but for now the Fed still seems to be fully committed to supporting asset prices and as long as that remains the case prices may remain inflated over where they would otherwise likely be.

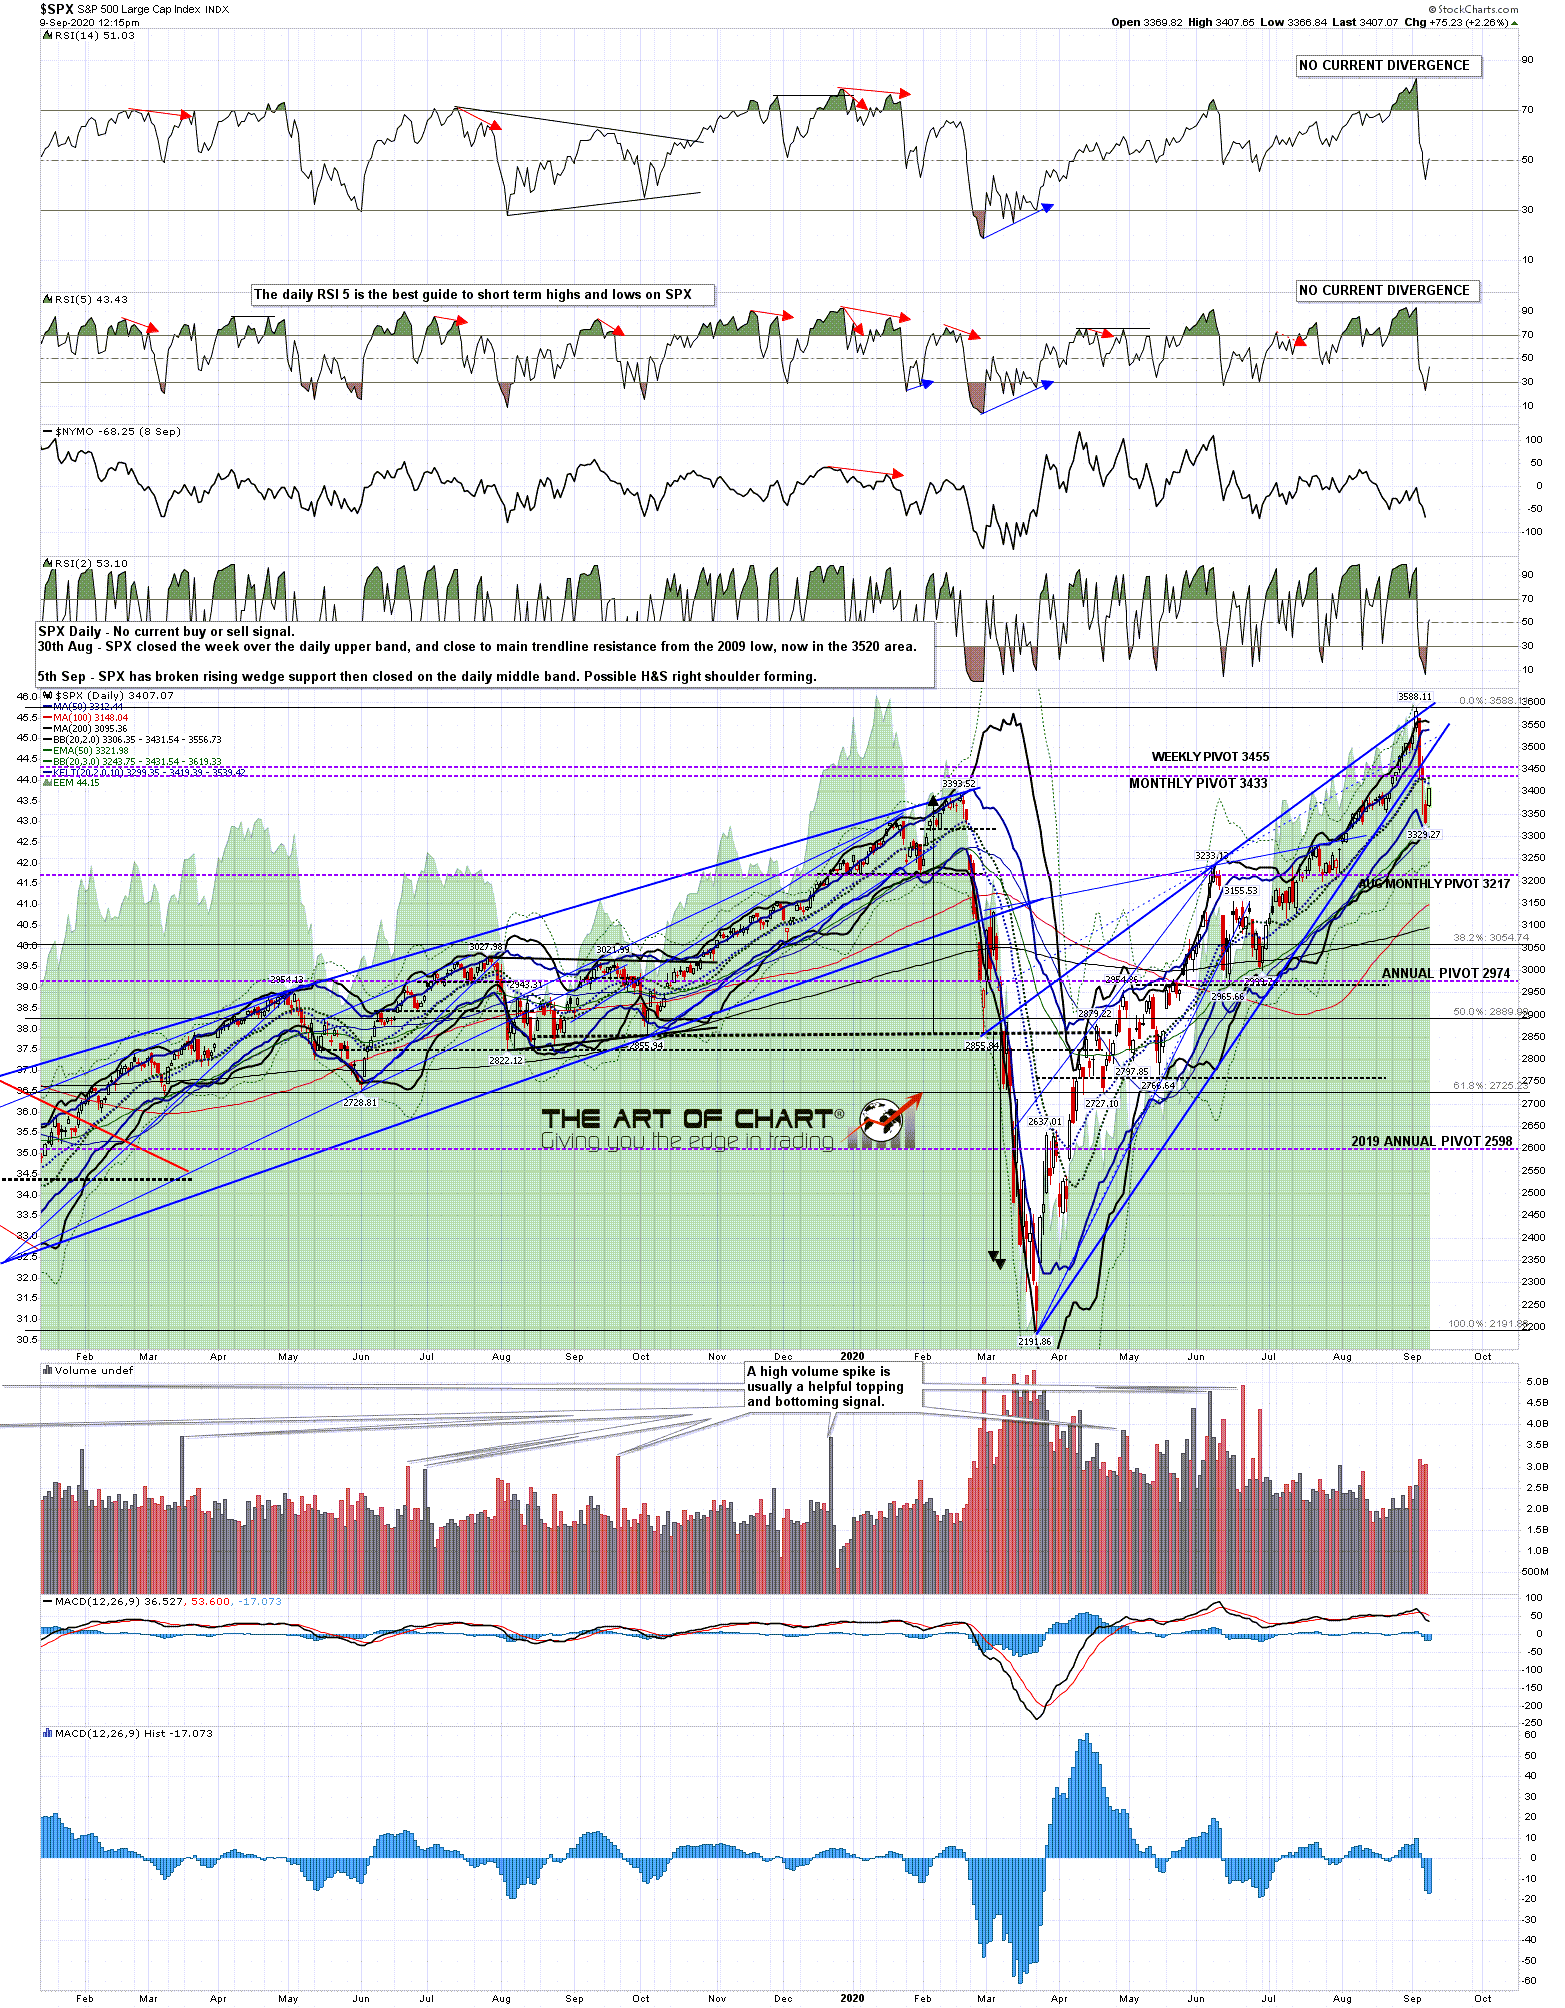
In terms of the retracement on SPX here, a significant support level has been reached at the low last week when the weekly middle band was tested. That has delivered a strong bounce and there is a possible setup here to go considerably higher. Key resistance is now not far above at the daily middle band, which is at 3373 at the time of writing. The daily middle band held on the last two rallies and may hold again here. If it does, then expect lower prices not long afterwards. I'd note that the last daily RSI 5 buy signal failed on the last leg down and another one fixed on Friday. This has been a strong trending move down.
SPX daily chart:
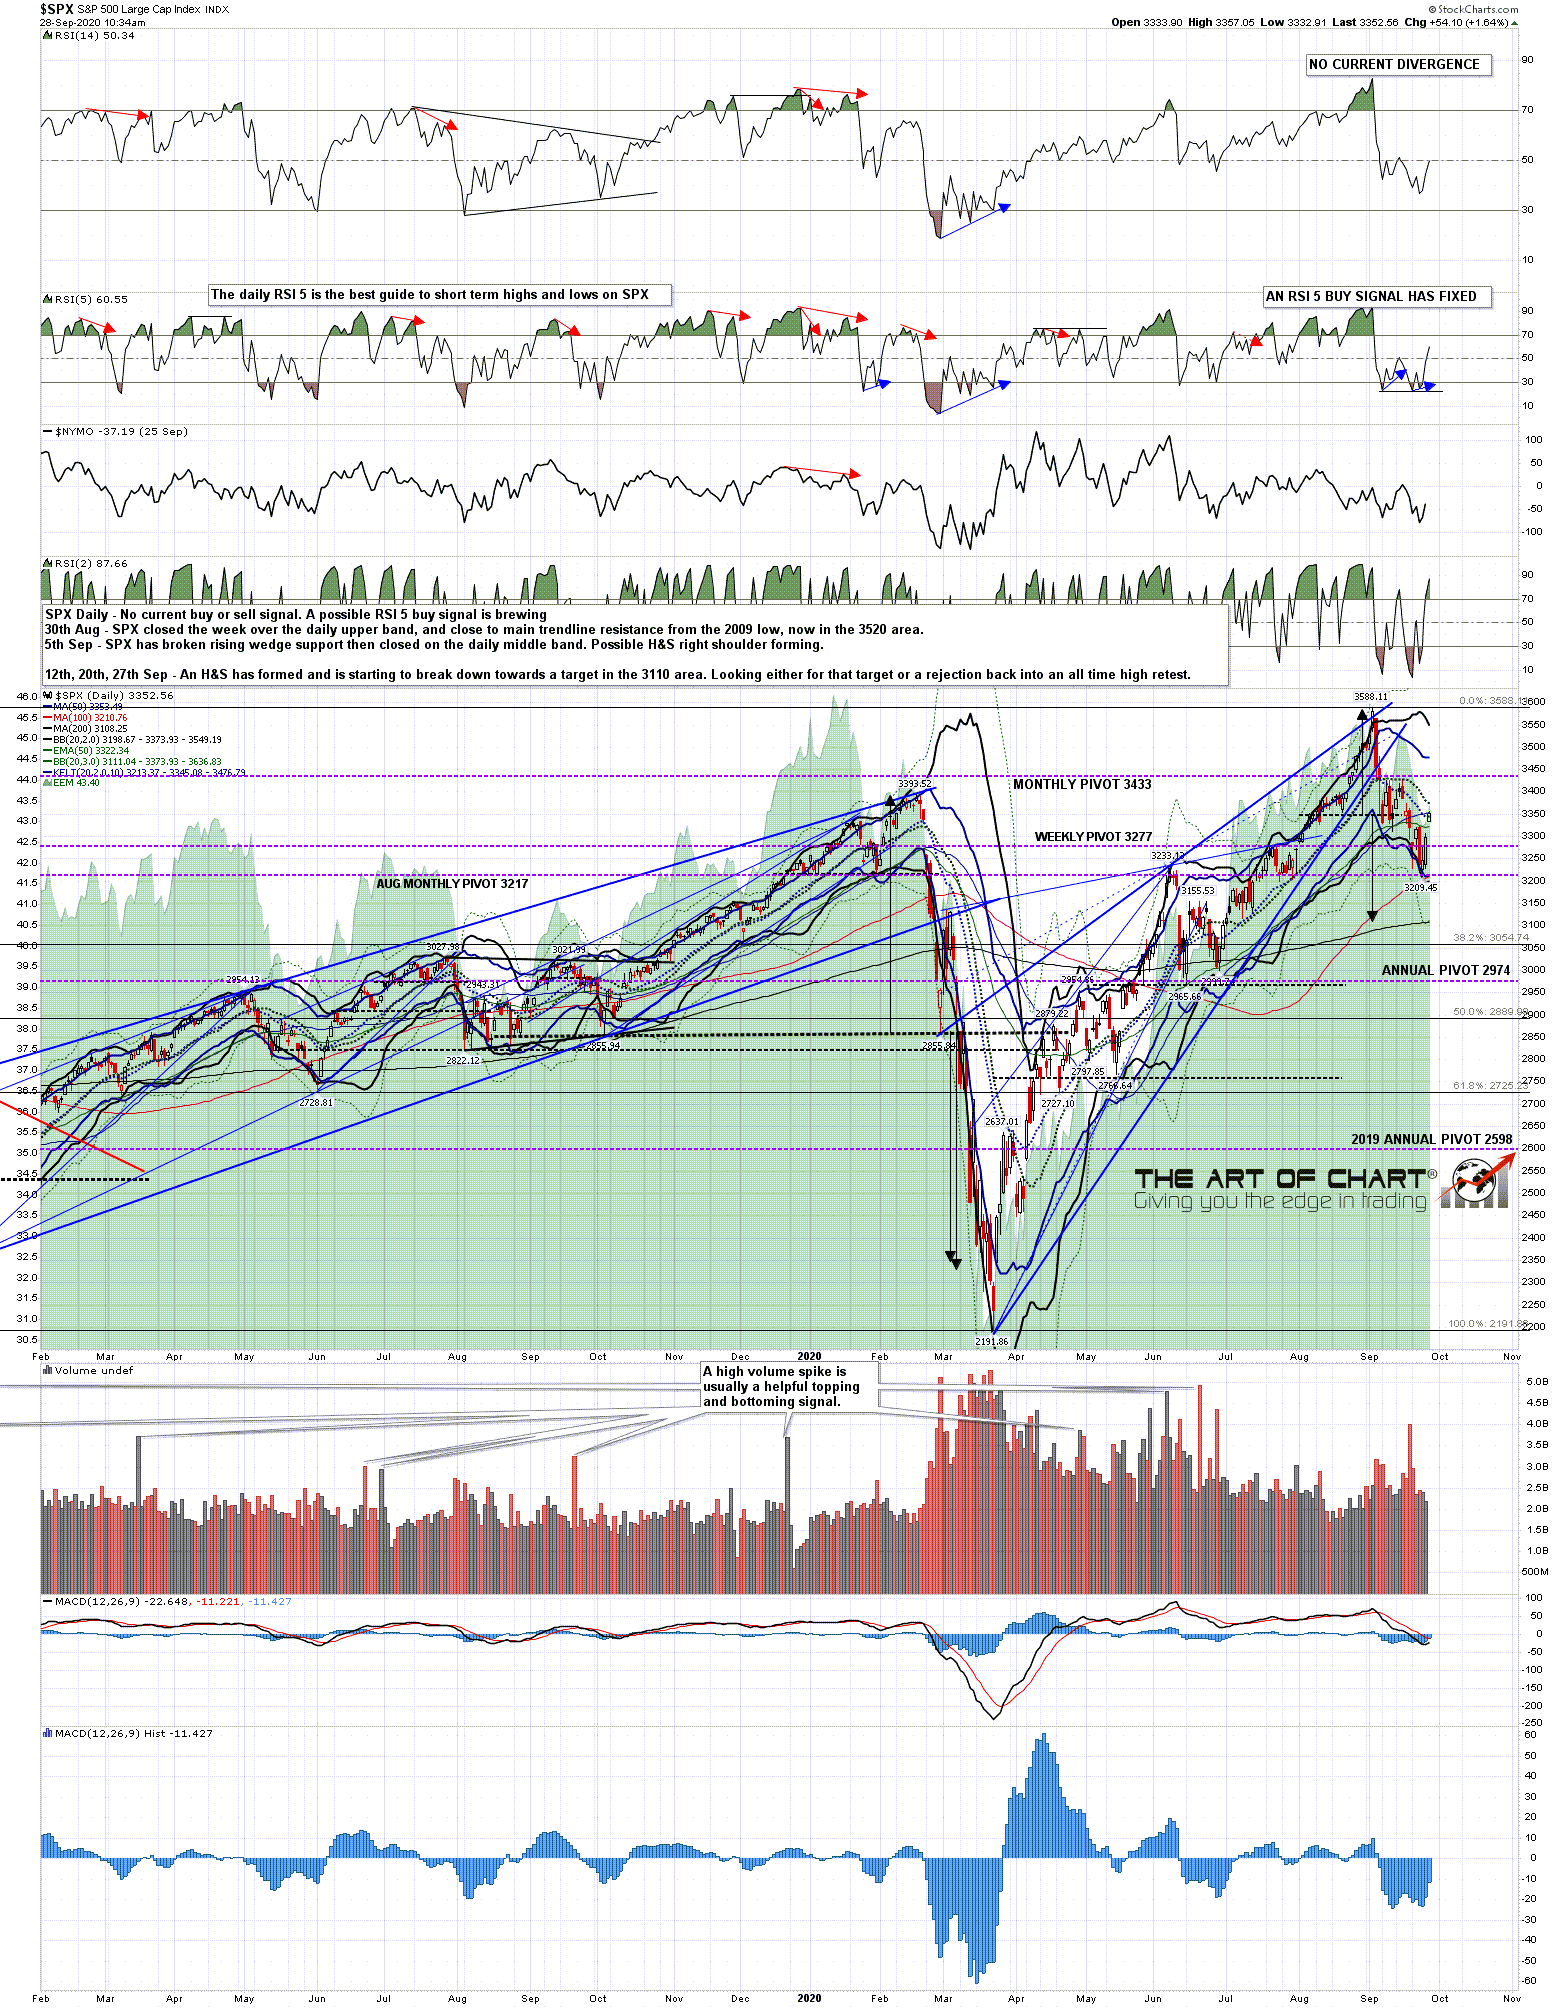
In the event that SPX can break back over the daily middle band then I have a fixed alternate double bottom targets in the 3420 and 3440 areas, bracketing a possible larger IHS neckline in the 3430 area. In the event that this move extends into a possible retest of the all time high, we might well see an IHS right shoulder for, which would have an ideal low in the 3310 area.
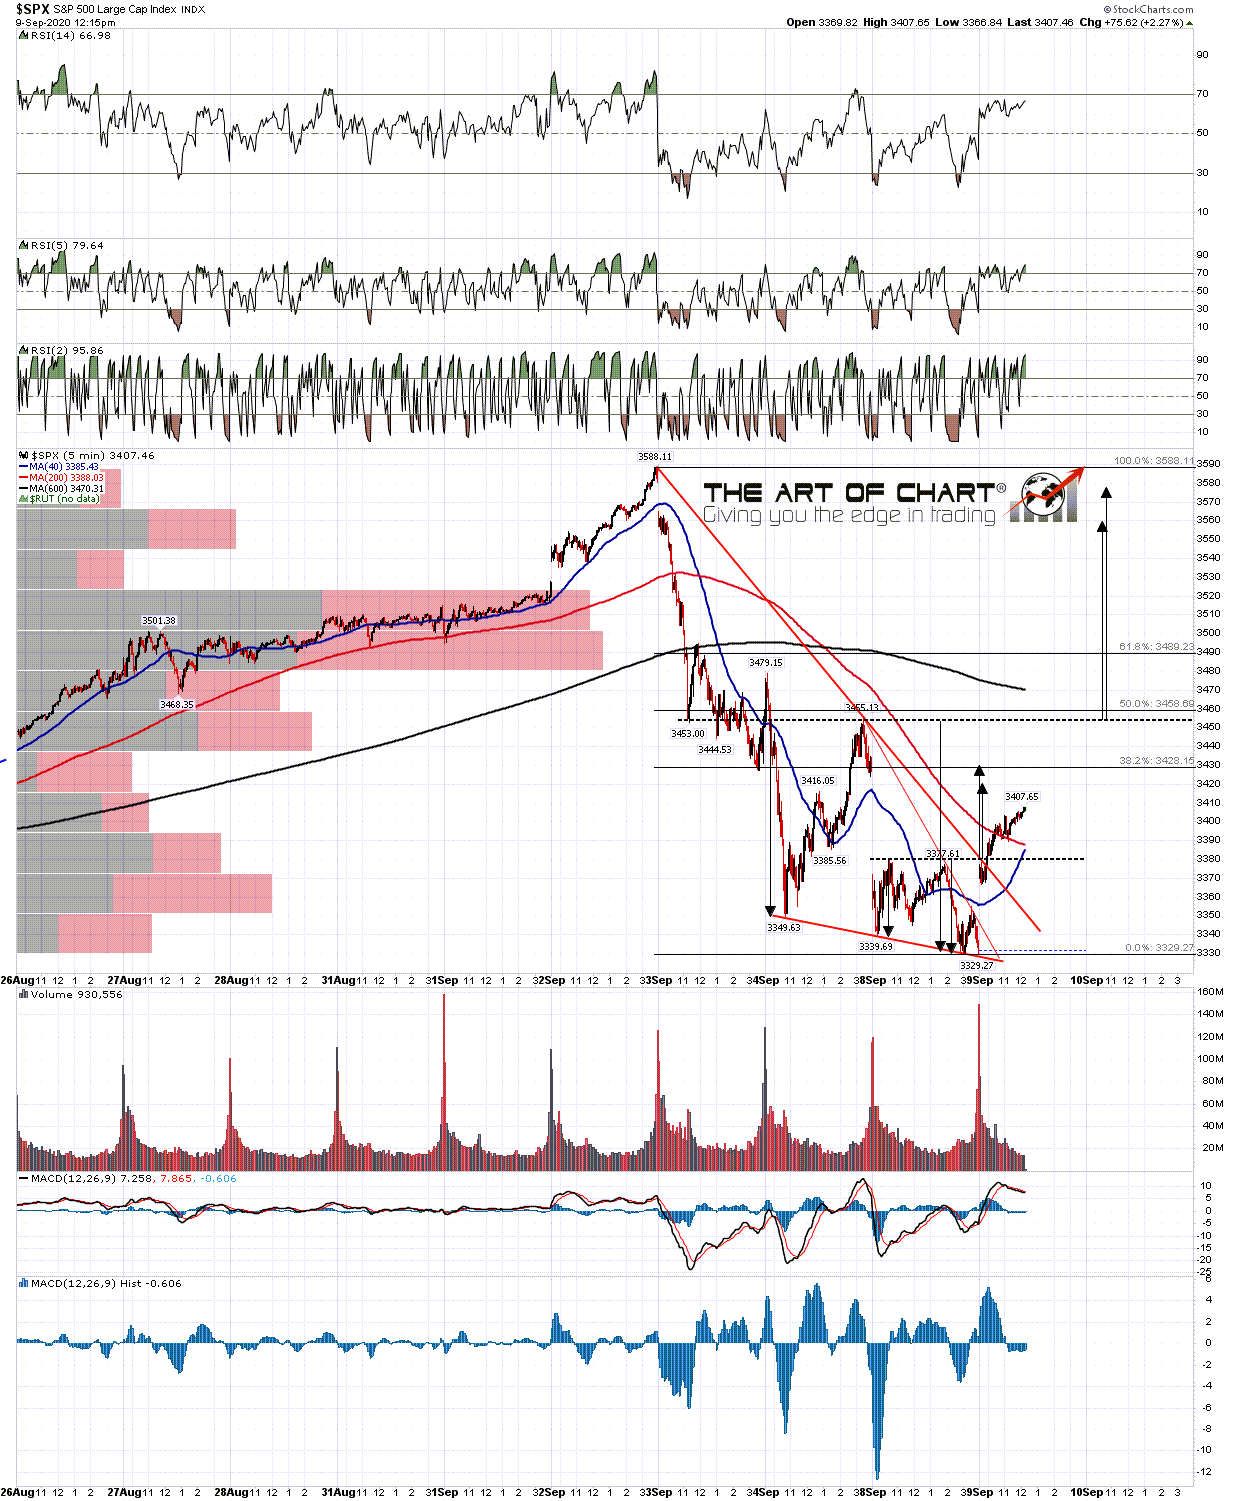
SPX 15min chart:
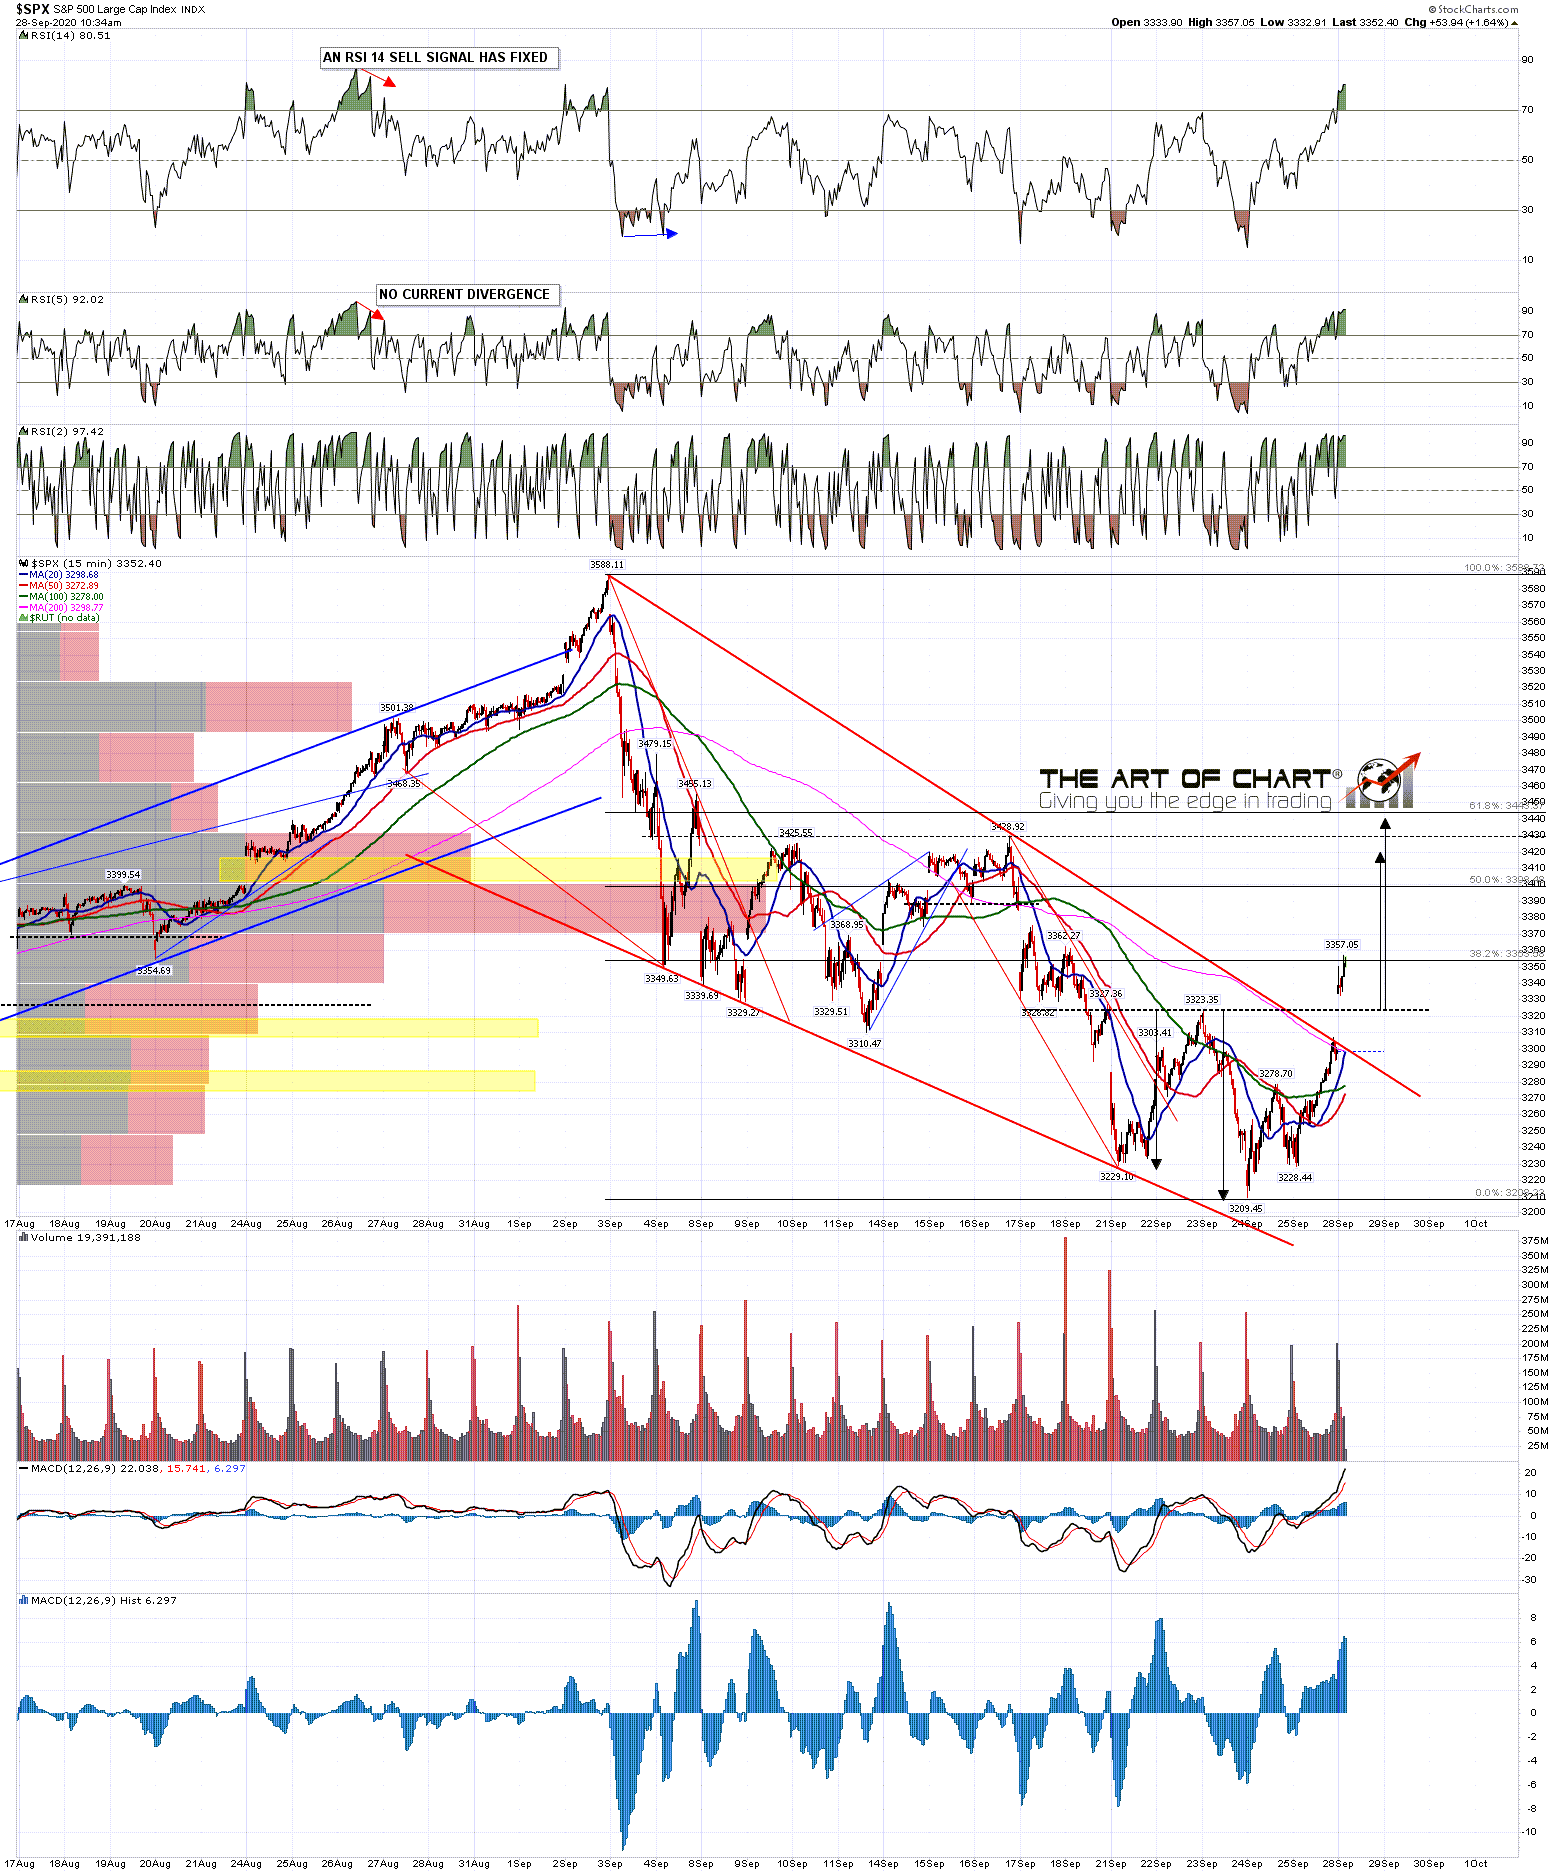
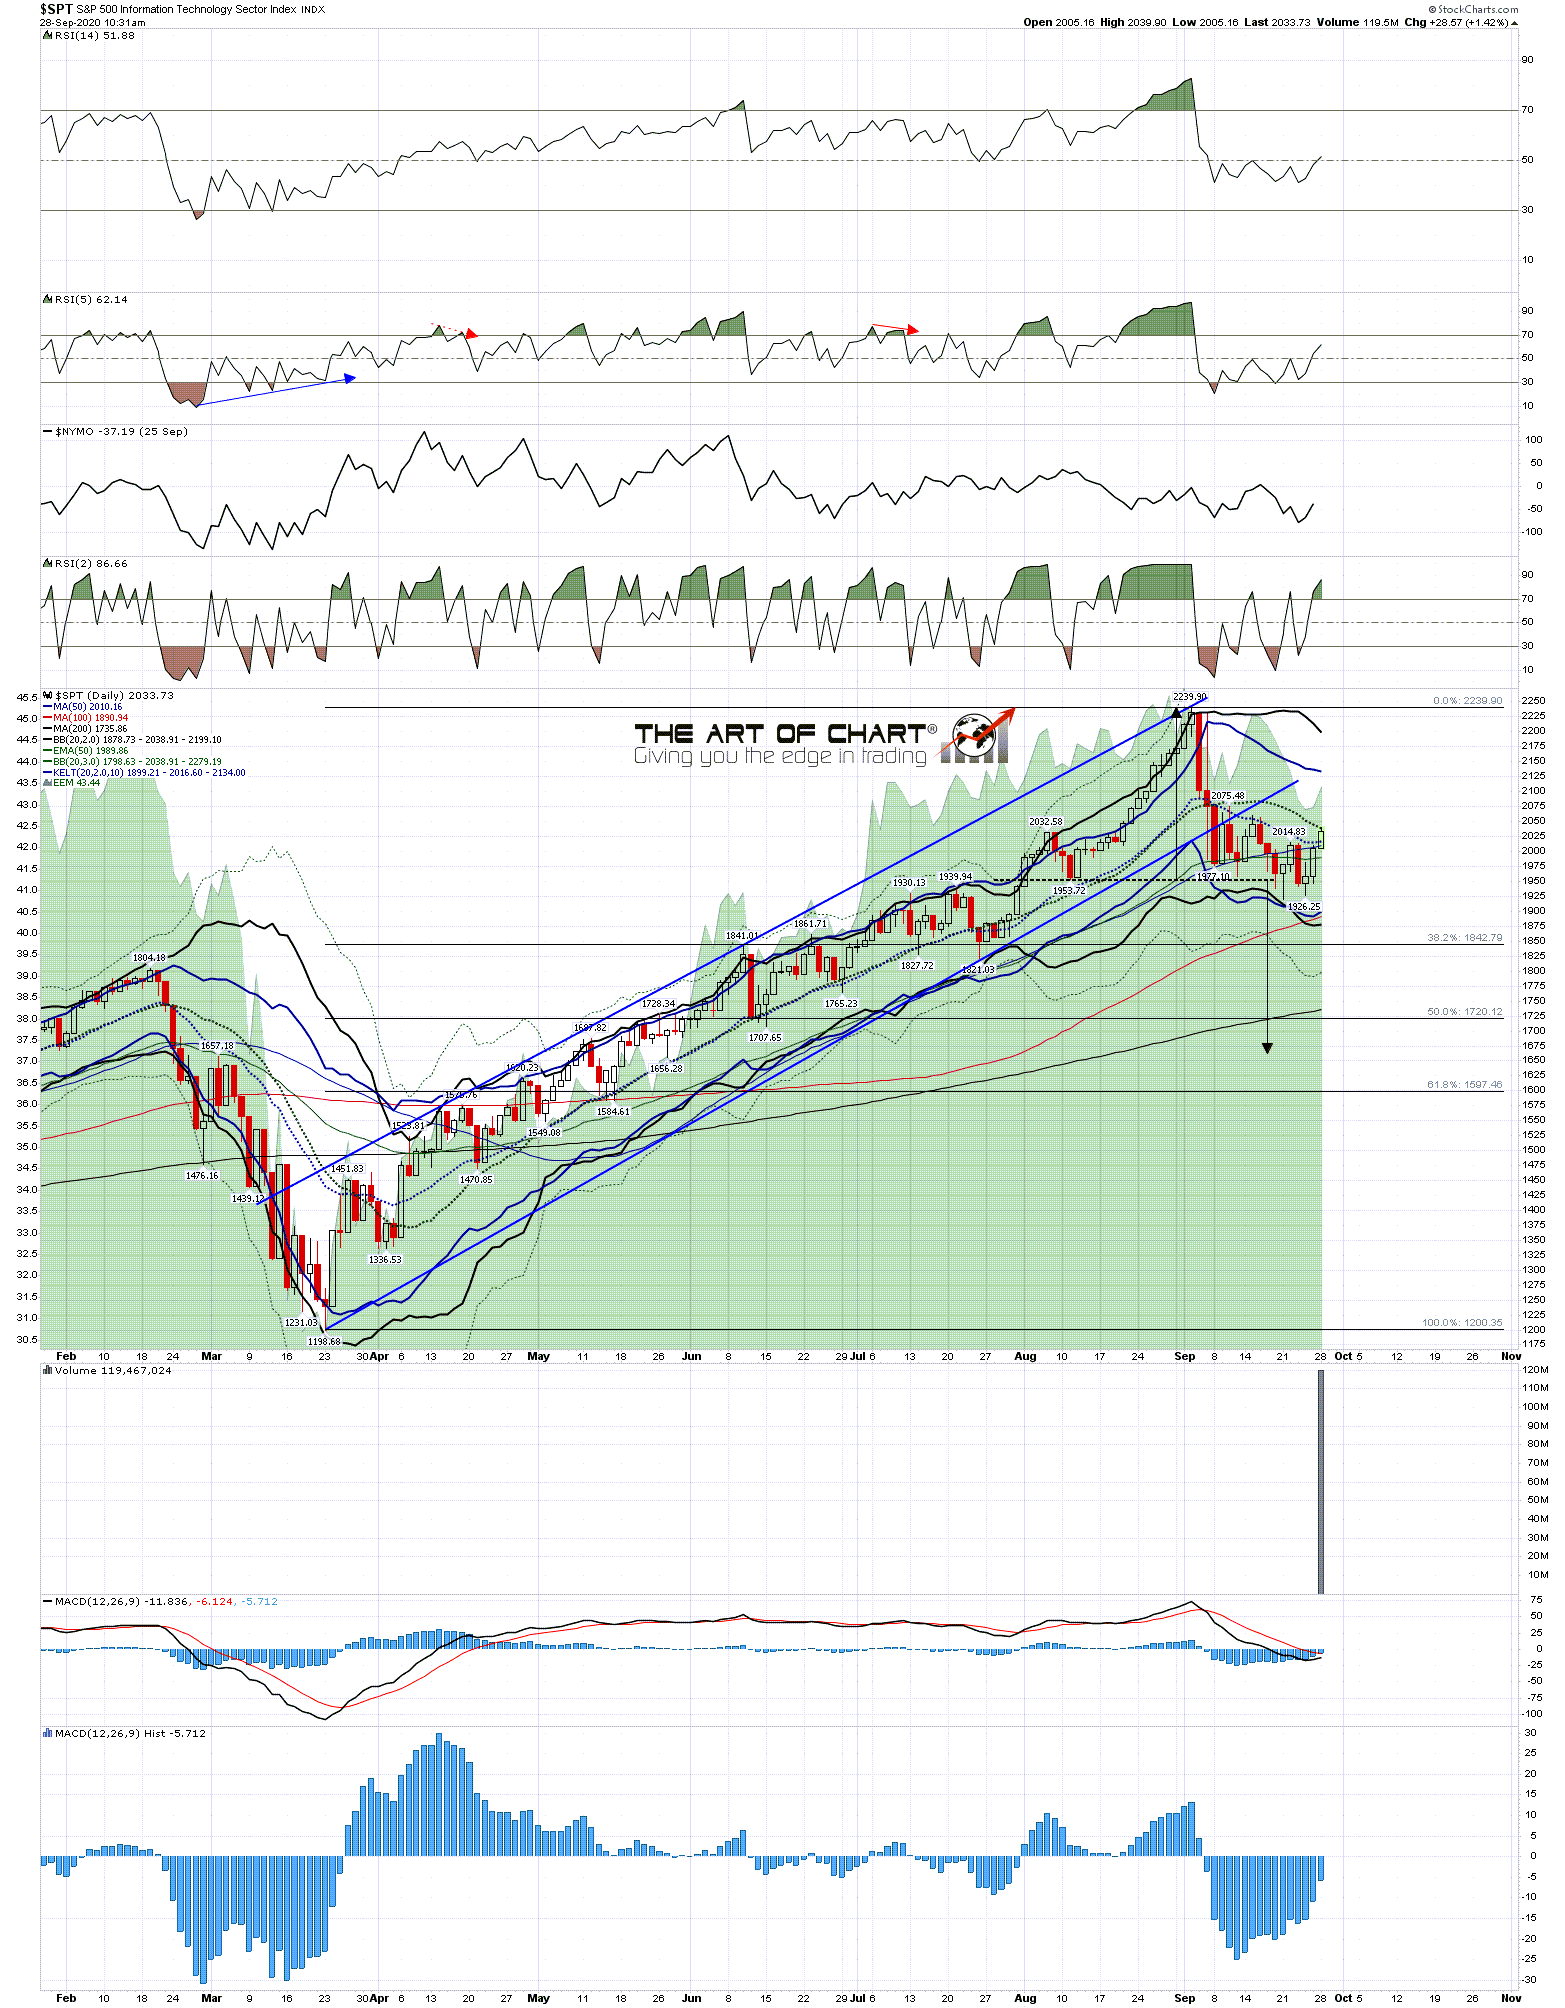
What are the chances of an all time high retest? Well Tech stocks were firmly in the driving seat on the way up from June, and led the way down on this retracement. The H&S I show below is the SPT (S&P 500 Tech) and there are similar setups on both QQQ and XLK. That H&S has broken down with a target a lot lower, probably equivalent to the 3000 area or under on SPX and at the break of a high quality pattern like this there is an inflection point where there will either be a breakdown into that target area, or a strong rejection back into a retest of the prior high. If SPX gets back over 3400 then I'll be leaning towards the second option, albeit very possibly just to make the second high of a large double top.
SPT daily chart:
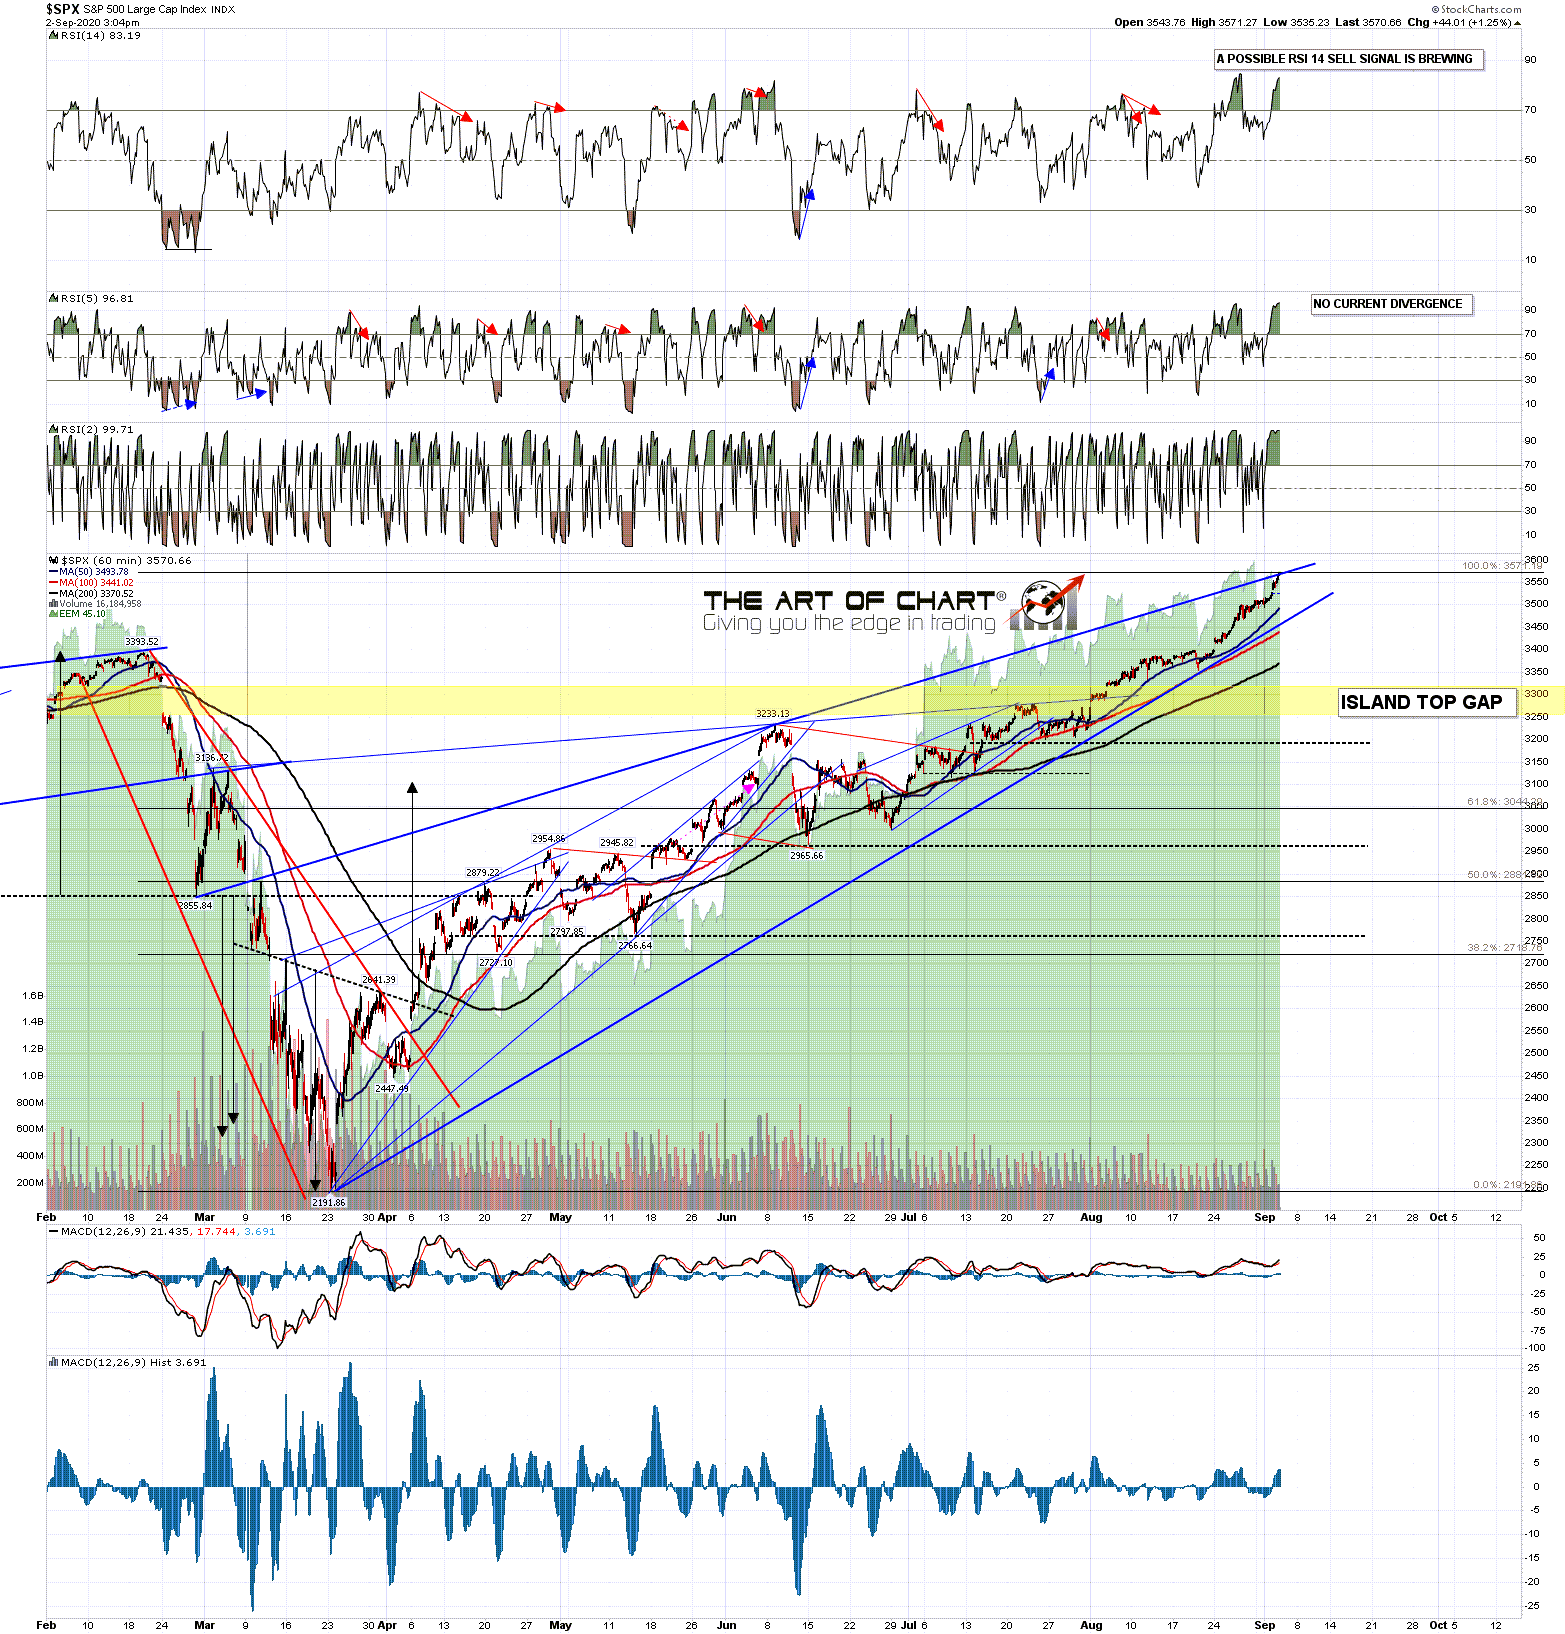
In terms of resistance in the SPX 3430 area I'd note that the monthly pivot on ES at 3416 is a close match with that, so if we see that level tested and a failure there, then that larger IHS right shoulder may be forming.
ES Dec 60min chart:

What are the odds of a high retest on SPX soon? Well in the event that this is just a technical retracement in a huge new bull market then pretty high. If however this is a top forming from the new all time highs last month then I'd note that from my own research significant highs and lows on SPX involve some kind of high retest after a strong retracement over 65% of the time. In that case therefore, there would also be a high retest considerably more often than not, and that is something that I am watching out for.