- WE'RE JUST RANDOM SPECKS OF DUST IN A TORNADO TO THE MARKETS .......
- CHARTISTS MUST PUT ALL BIAS ASIDE AND LET THE CHARTS DO THE TALKING OR WE'LL SEE ONLY WHAT WE WANT TO SEE
- This blog has a copy of all header posts that I publish anywhere, so that those interested in seeing what my thoughts are on the markets can find them easily.
- I will be answering questions and responding to comments, so feel free to respond to any posts and I will see your comment even if it is not on the most recent post.
- If you're interested in seeing any intraday charts I post, I do that on twitter, and my twitter handle is @shjackcharts.
- The charts in the posts are as large as I can practically make them. if you would like to look at one more closely, click on it, and the link will take you to a larger version at screencast. If you click on that again, you will get a full page version, and can use the resizing function on your browser to enlarge parts of interest further.

Tuesday 30 May 2023

A Tale Of Two Indices

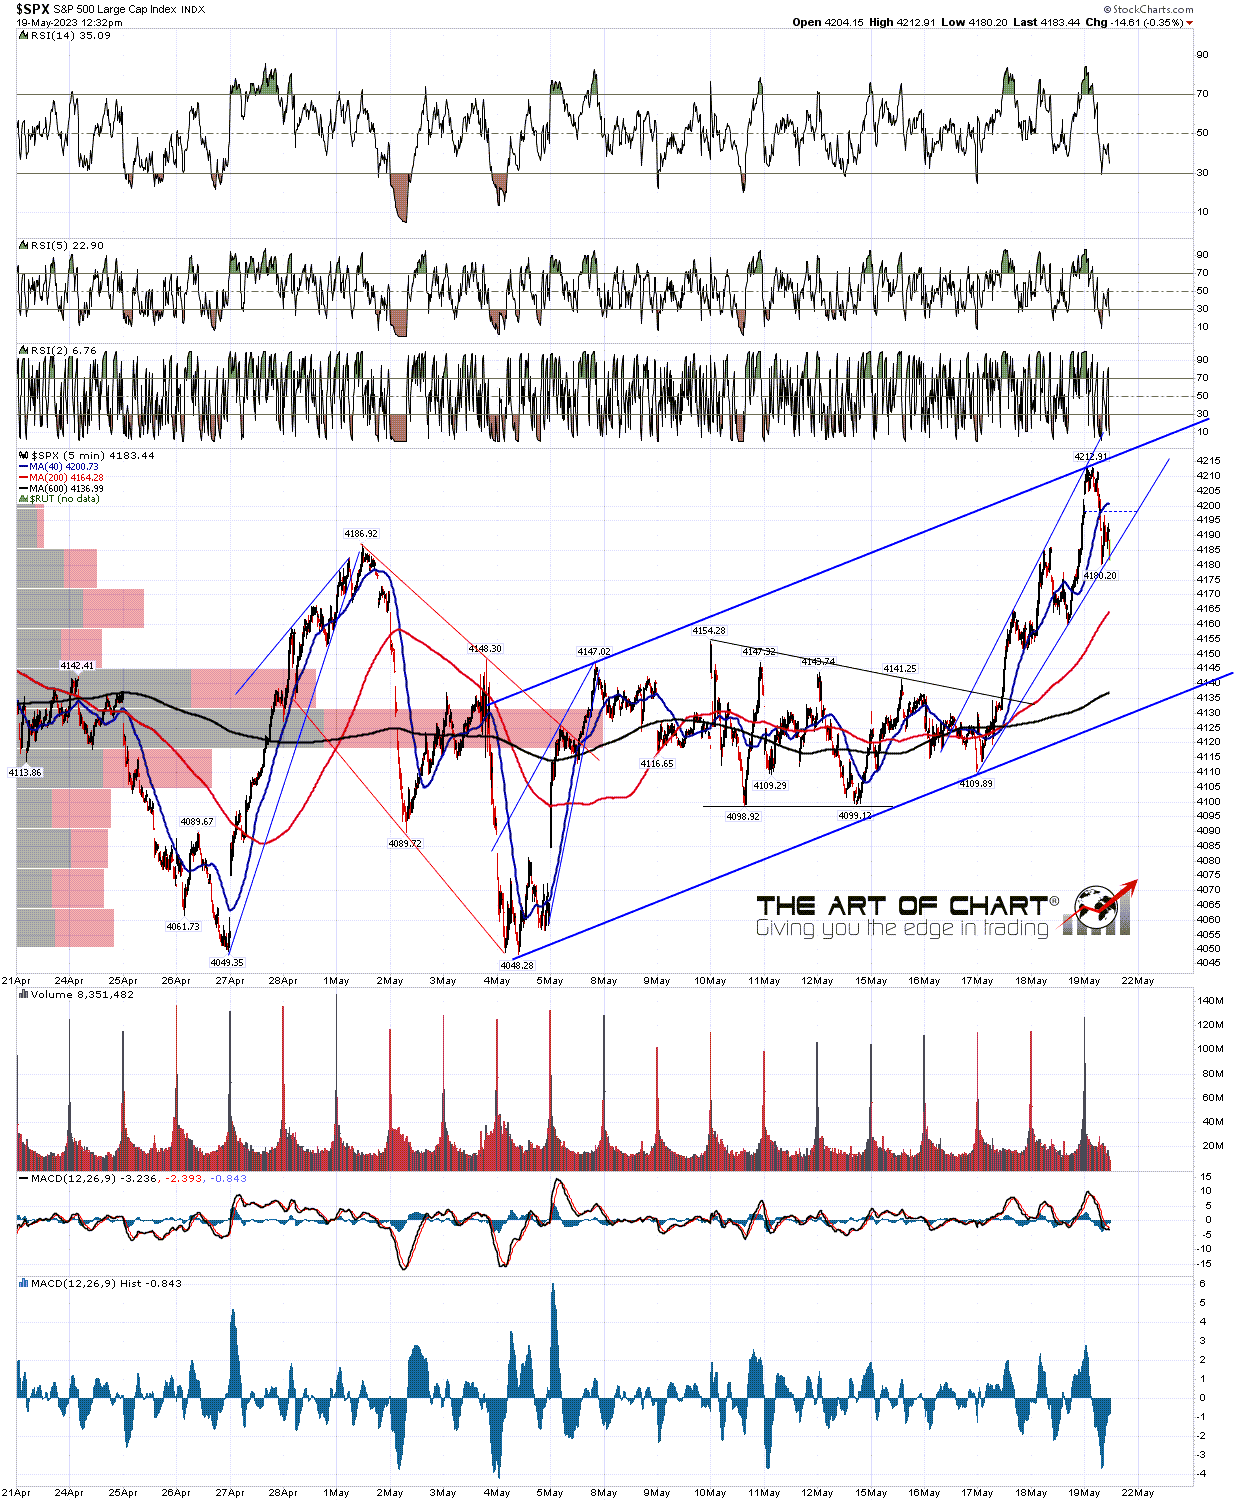
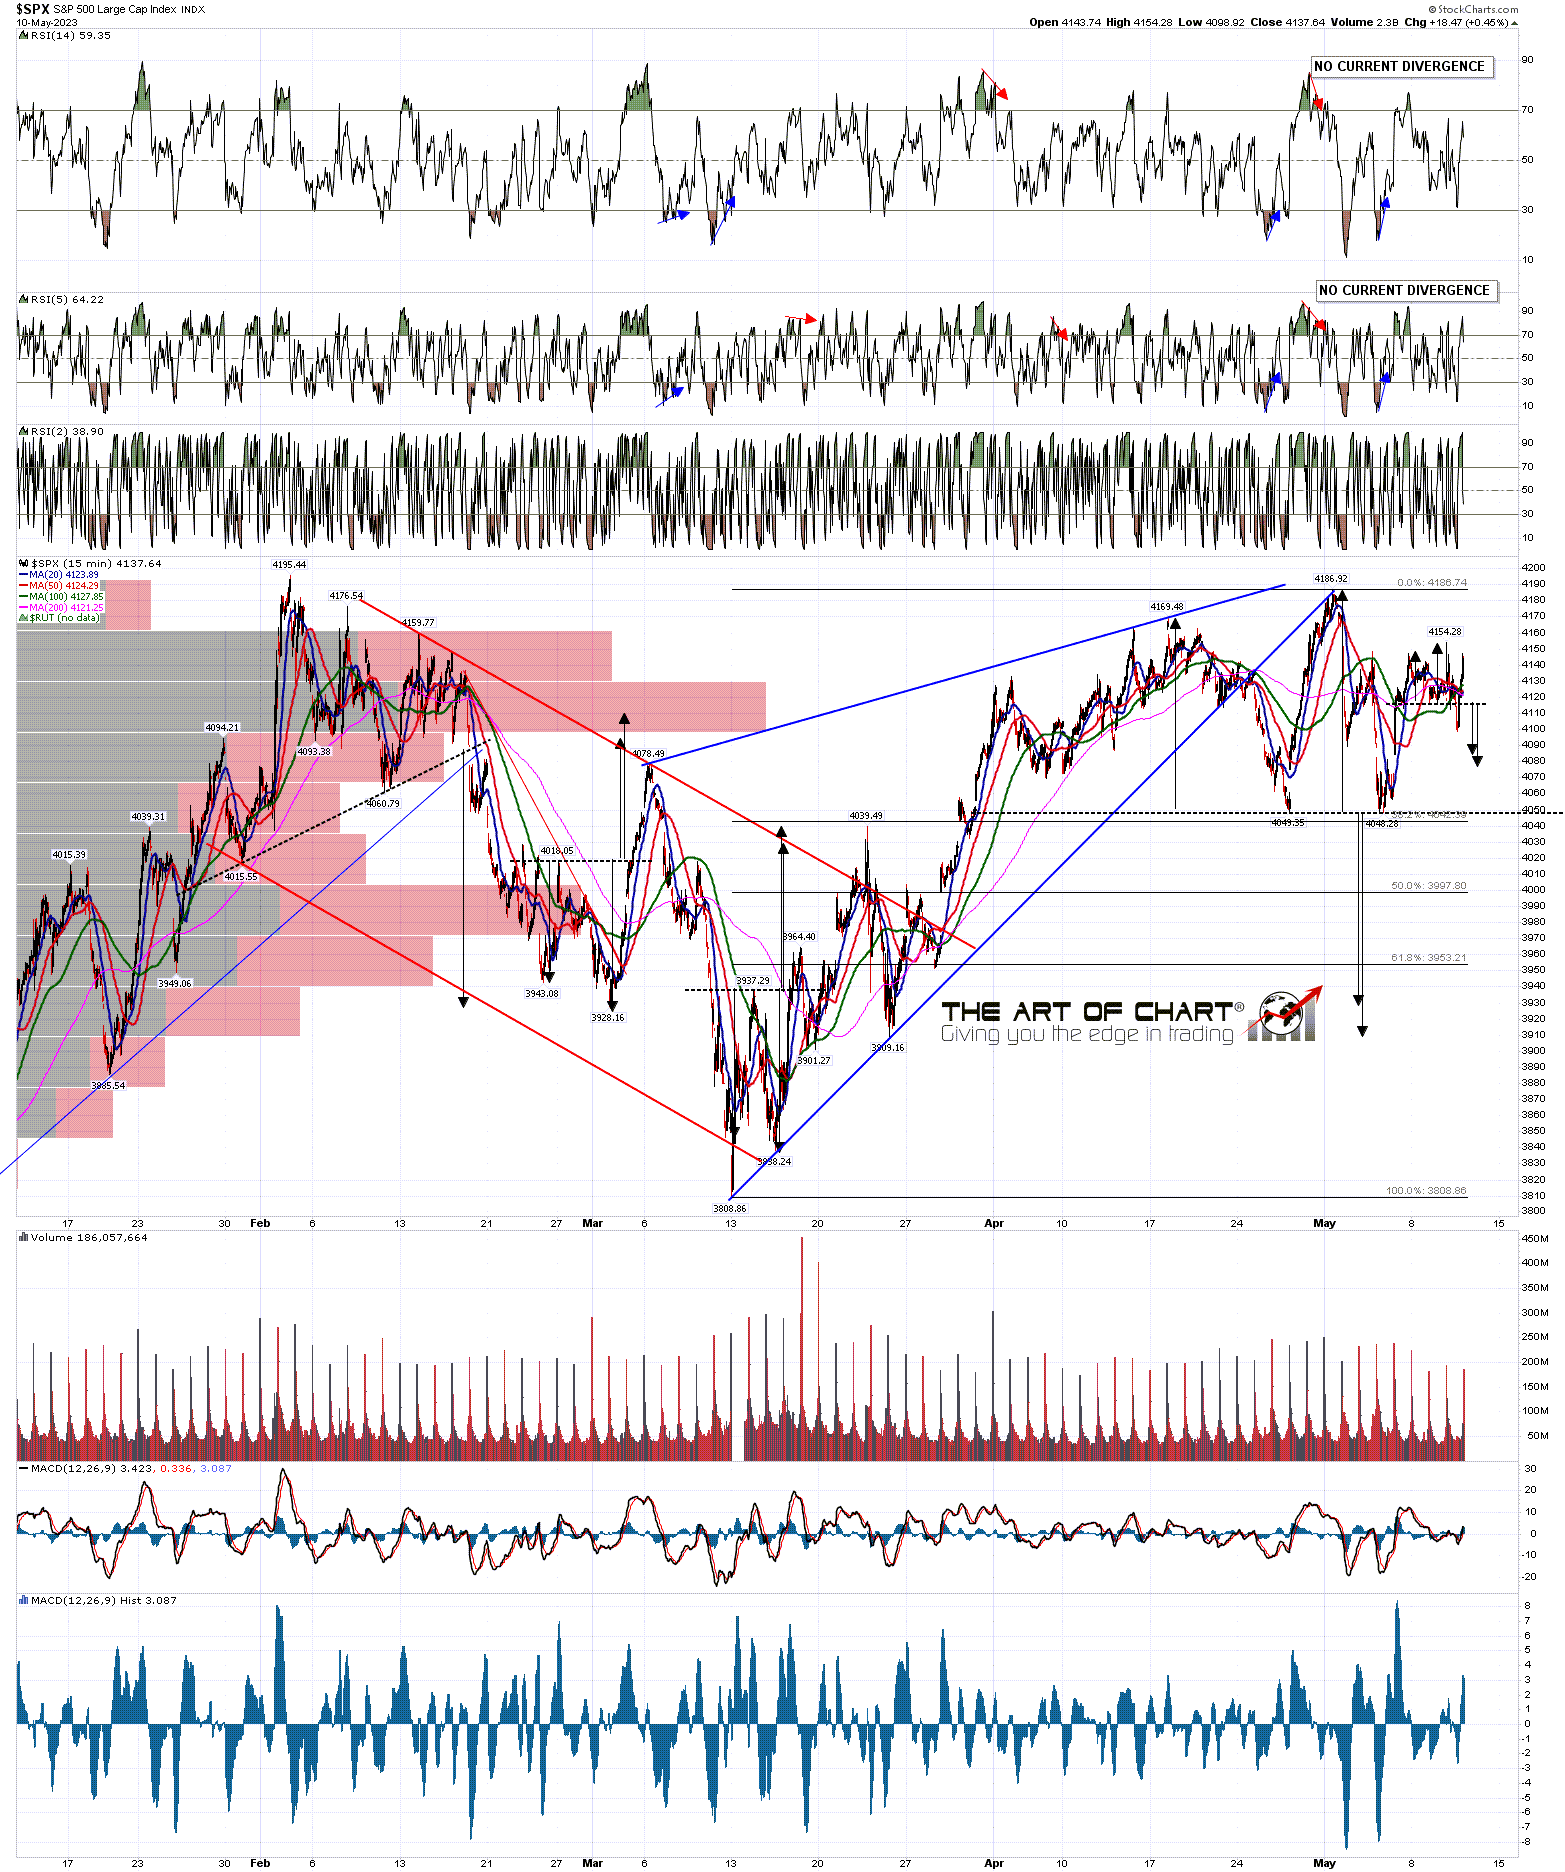
A decent quality rising wedge has formed from the early March low, and that broke down last week. That could be a bullish underthrow of course or the wedge could be expanding. If wedge resistance is hit again today then at minimum I will assume the wedge has expanded, and redraw the wedge support trendline accordingly.

SPX 15min chart:

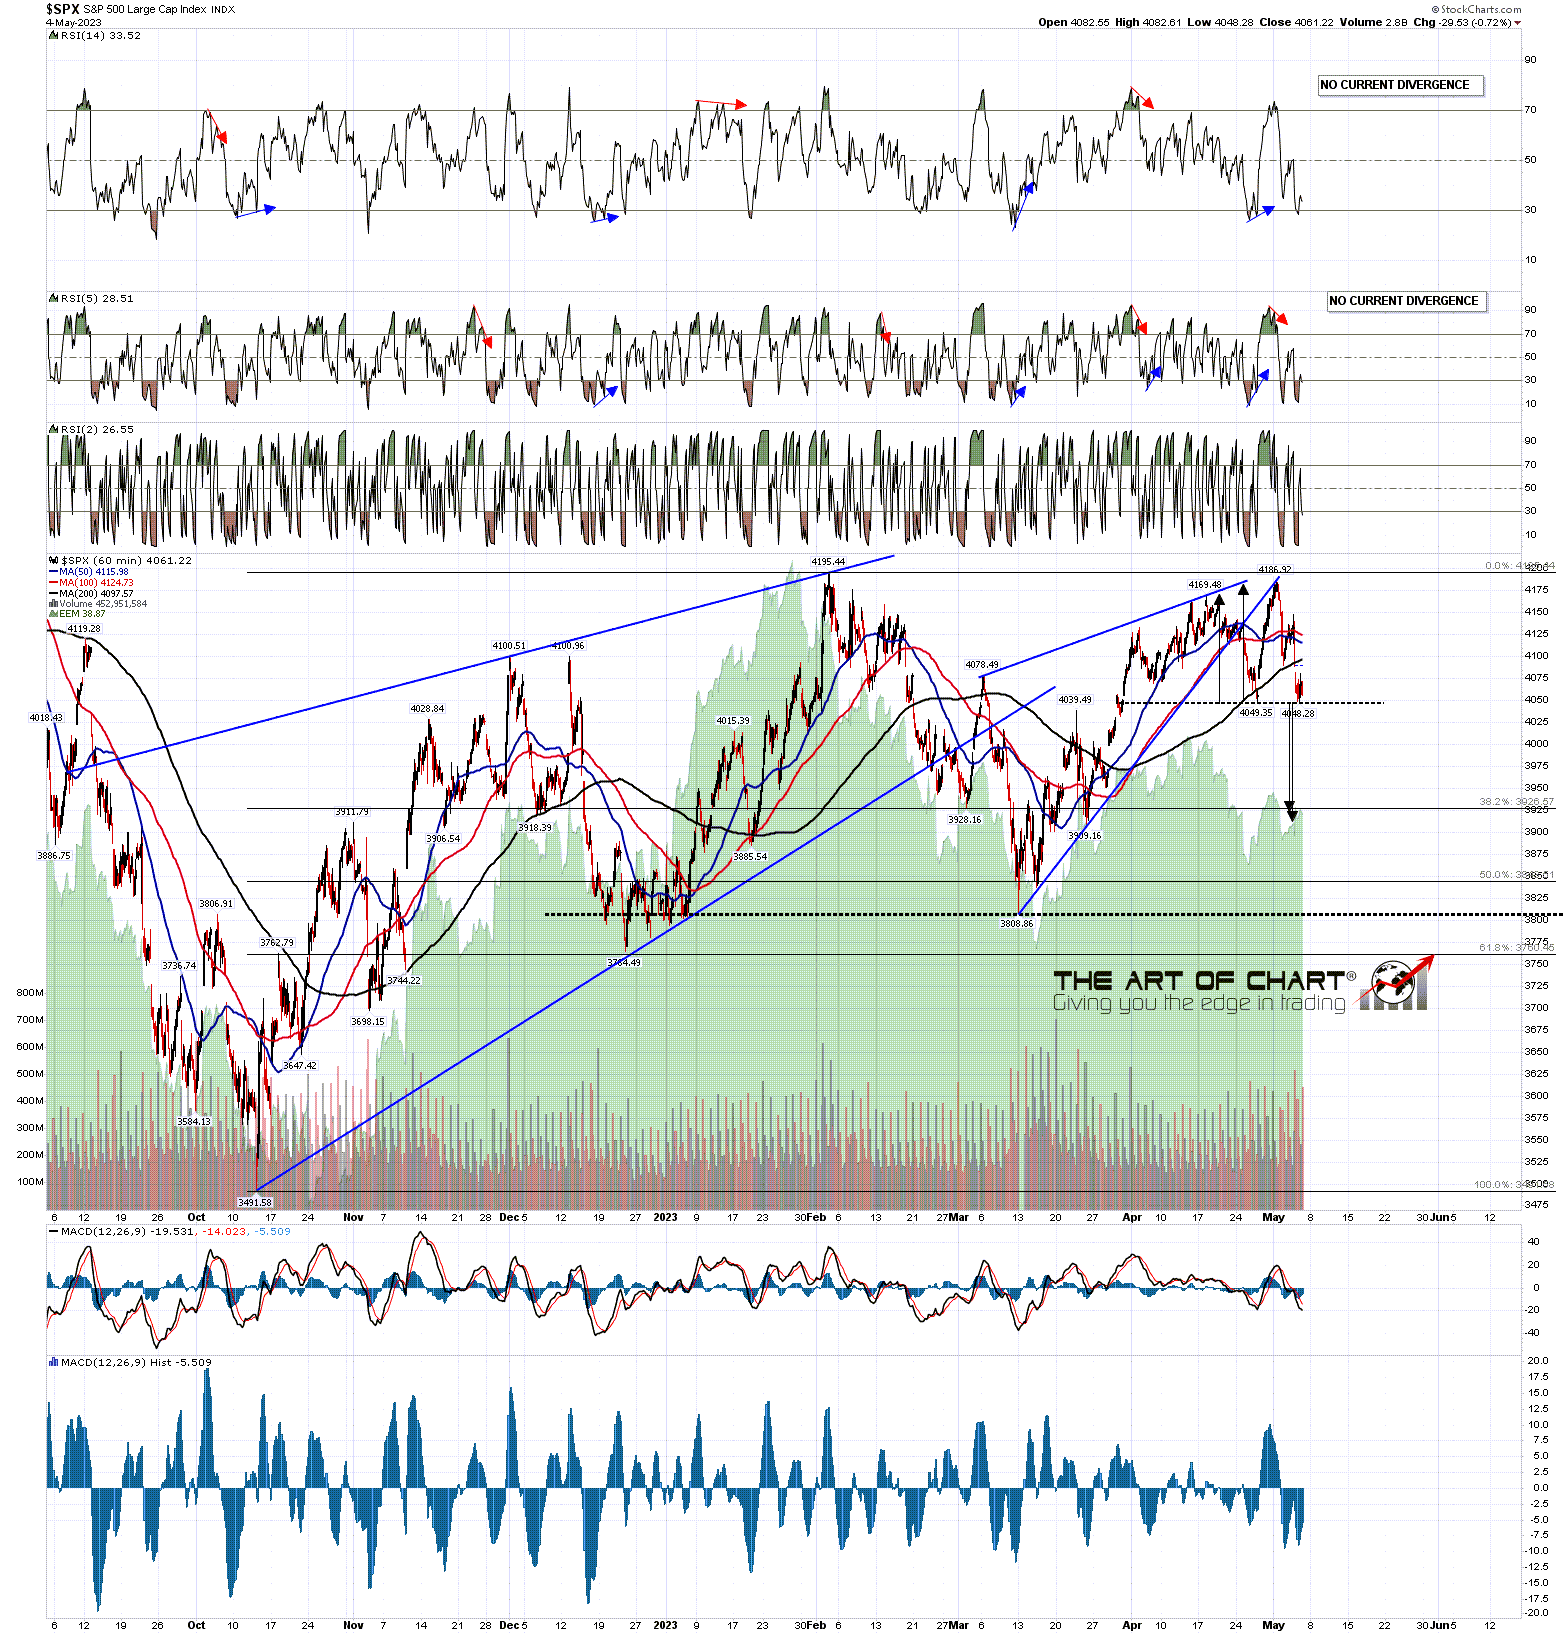
SPX broke back below the daily middle band at the low last week, and then rejected the next day, retesting the upper band on Friday. The 3sd upper band closed Friday in the 4250 area, and I'd be seeing the 4250-60 area as a likely upper limit for any upside today.

SPX daily BBs chart:

NDX has been leading strongly to the upside and I mentioned a couple of weeks ago that the very nice rising wedge from the March low there might break up. In that event what I watch for is a backtest that doesn't break back below the rising wedge resistance trendline, and as long as that holds, as it did on the backtest last week, the rising wedge target here would be in the 17000 area. That may be what we are looking at here and we should have a better idea about that by the end of the week.

NDX 15min chart:

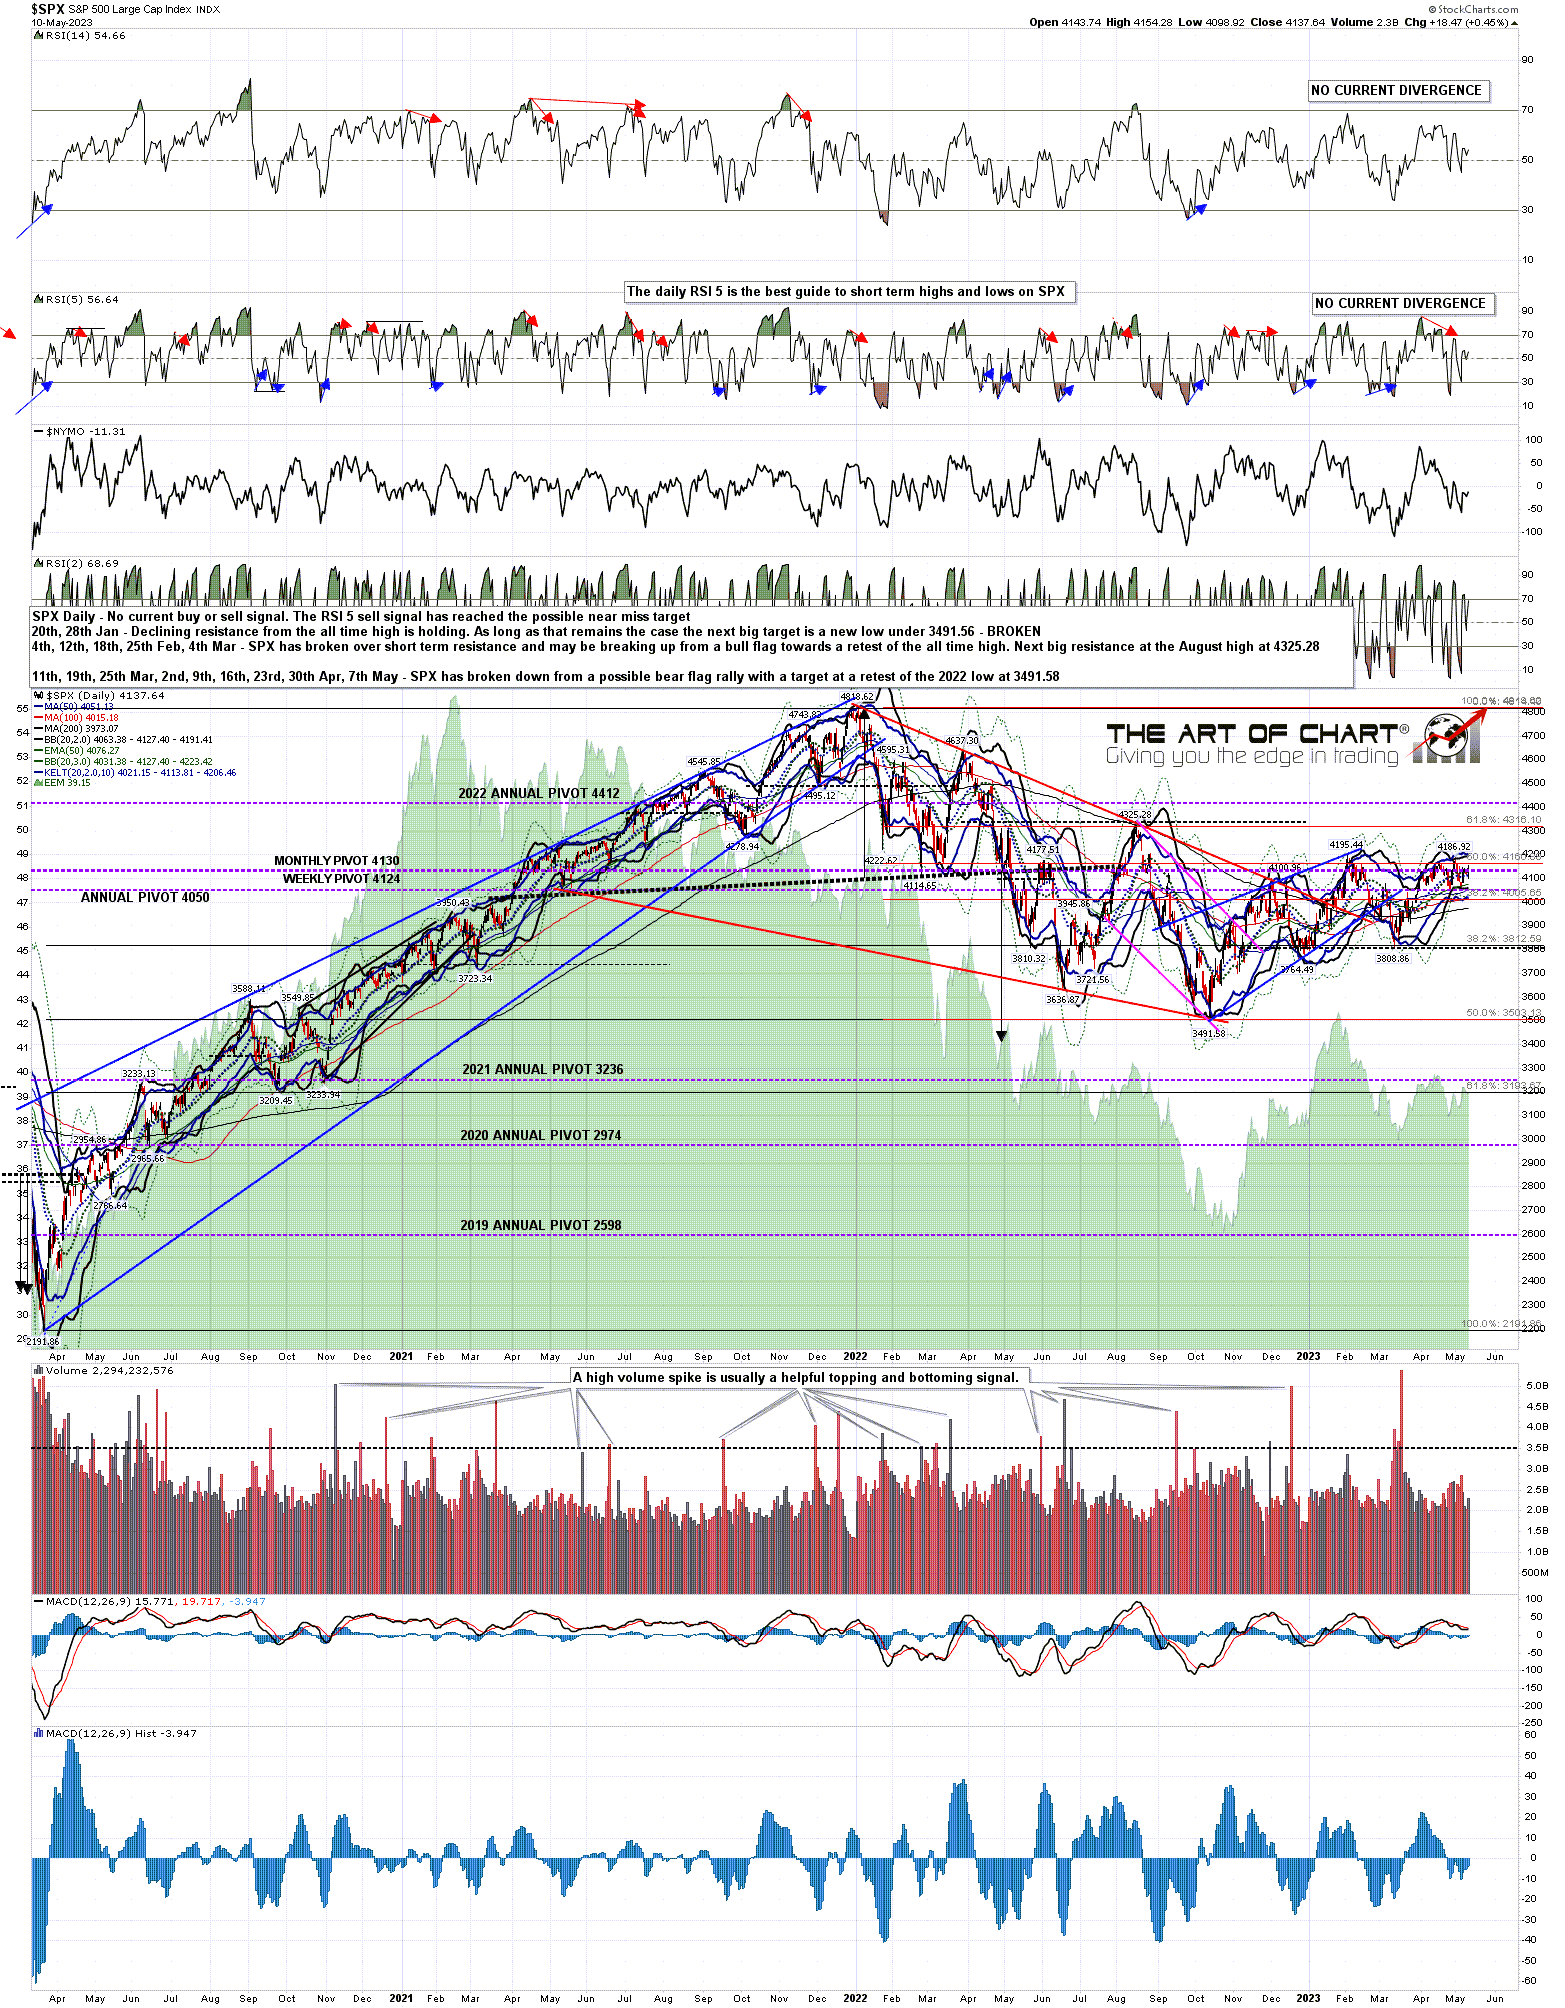
At the start of May there were two big indices testing strong resistance at the monthly middle band. That is at 4170 on SPX at the moment and we may see a modest break over that resistance at the monthly close tomorrow. That would be a significant technical break, though it would need a confirming close above next month.

SPX monthly chart:

NDX is a very different story. Tech has been leading to the upside and has really been the only strongly bullish segment of the market, albeit one that is strong enough to be dragging SPX up with it. On NDX there has been a very strong break up over the monthly middle band this month, opening a possible retest of the all time high. The large H&S that has broken down also failed on this move, and that failure has a target at a retest of the all time high, as with the wedge target on the NDX 15min chart. I am taking the possibility of an all time high retest on NDX very seriously.

NDX monthly chart:

Three weeks ago I was saying that the historical stats favored the bears into late May. That period has ended. The stats for this week are strongly bullish today, neutral tomorrow, and strongly bullish on Thursday and Friday. This is one of the most bullish leaning weeks of the year so we'll see what the bulls can deliver. After this week the stats lean generally neutral to bearish for June.

In the very short term there is significant negative divergence on the EQ & NQ hourly charts, and it may be that the overnight highs are close to the highs we will see today. We'll see.

If you are enjoying my analysis and would like to see it every day at theartofchart.net, which I co-founded in 2015, you can register for a 30 day free trial here. It is included in the Daily Video Service, which in turn is included in the Triple Play Service.

Friday 19 May 2023

Back At Major Resistance

Well the bearish stats for Wednesday and Thursday this week did not deliver, which was remarkable yesterday as at the start of the day there were hourly sell signals fixed on all of ES, NQ, RTY & YM. That equities went up hard instead was an impressive show of strength, bringing SPX back up into a full test of key resistance at the monthly middle band, now at 4169.46, but not broken until there is a monthly close above it, and the main support/resistance trendline from the 2009 low.

That is still very strong resistance, but after the rejection back up here, and the very strong action over the last two days, I'm increasing the odds of a break above from 25% from 35%.

SPX monthly chart:

I posted my premarket video at theartofchart.net this morning on my twitter and I was talking again about something I was also talking about at the early May low. Then I was talking and writing about downside being limited by the proximity to the daily 3sd lower band, and this morning I was talking about the proximity to the 3sd upper band, estimating that ES was unlikely to get over 4240 today. The high today was at 4227, with a backtest of 4190-4200 from there. I'm expecting this to follow through on Monday to clear the rest of the negative divergence on the hourly and 15min charts.

SPX daily BBs chart:

On NDX, with both RSI 14 and RSI 5 sell signals currently fixed, this could still be an overthrow from the wedge I posted on Wednesday, but I would note that the break over the August 2022 high at 13720.90 is also potentially a break over double bottom resistance with a target back at the all time highs. From here I would expect to see either that move, or a rejection back into the October 2022 low at 10440.60.

NDX 60min chart:

In the short term on SPX a perfect rising channel has formed from the early May low, and the next obvious target within that rising channel is rising channel support, currently in the 4130 area. I think we may well see that tested on Monday or Tuesday next week.

SPX 15min chart:

Looking closer at the setup from the early May low, there is also a shorter term rising megaphone into that channel resistance which started breaking down at the lows today. I'm expecting that break to follow through to the downside early next week, then we'll see what happens there.

SPX 5min chart:

On the bigger picture I still think that the odds are 65%+ that SPX has topped out or is topping out short term for at least a decent retracement. Is there a chance that SPX will break up over resistance here instead of failing? Always, every good setup can always fail and go the other way, and I have currently assigned a probability of 35% to that.

I entered a model trade with 9x MES (micro-ES) just before the close on Friday 28th April short at 4190. That was stopped out even yesterday and I may re-enter, but am planning to watch what happens next week to see how this develops.

If you are enjoying my analysis and would like to see it every day at theartofchart.net, which I co-founded in 2015, you can register for a 30 day free trial here. It is included in the Daily Video Service, which in turn is included in the Triple Play Service.

Wednesday 17 May 2023

Compression and NDX Patterns

SPX has been trading in a range and moving back and forth through the daily middle band, with strong established support in the 4100 area, but unable to convert it to convincing support or resistance.

SPX daily BBs chart:

NDX has led this rally, and already surpassed the previous highs. SPX has been trading a range around the daily middle band, IWM has been weaker, and Dow is close to breaching the May lows.

INDU 15min chart:

So with NDX leading to the upside here, how is that looking?

On the hourly chart the high yesterday has established a three touch trendline on a high quality rising wedge. That might still overthrow into a full retest of the August high at 13720.90 of course, but the setup looks promising for a reversal either here, or soon.

I would note though that a sustained break up from here, as these break up about 30% of the time, this might turn out to be a bottoming pattern setting up a  retest of the all time high.

NDX 60min chart:

In the shorter term there is also a decent looking rising wedge from the March low that has now overthrown slightly.

NDX 15min chart:

If equities are going to break back down this week then the obvious day to do that would be today or tomorrow, which historically lean 62% bearish, and on SPX a sustained break back below established support at 4100 would look for a retest of the May lows at 4048/9. We've been having an assortment of Fed speakers this week and I think there are still more to come.

On the bigger picture I still think that the odds are 75%+ that SPX has topped out or is topping out short term for at least a decent retracement, and we still have topping patterns breaking down. Is there a chance that SPX will break up over resistance here instead of failing? Always, every good setup can always fail and go the other way, and I have assigned a probability of 25% to that, though in practical terms I think the odds of that would be more like 15% to 20%, rising back to 25% if we see a retest of the May high.

I set up a modestly sized model trade for the next few months and am following it here. I entered that with 9x MES (micro-ES) just before the close on Friday 28th April at 4190. 10x MES is equivalent to 1x ES, so this isn't a large trade, but I'm planning to trade around it on the way down.

The entry was at 4190, the target is at 3430, 760 handles below. The stop for the trade was 70 handles above at 4260 (at which point SPX would likely be breaking up), so the risk/reward ratio is slightly over 1:10, though if the trade needs to be rolled that will likely reduce a bit below that. As the initial double top has now broken down I have moved the stop to even at 4190. If that is stopped out I would likely re-enter at a retest of the May high. Max risk on the trade was $3,150, and if taken off at target without the need to roll the trade will yield $34,200. I will consider taking a third off near the 3940 and 3690 areas if seen, and perhaps adding them back on after any subsequent rallies. We'll see how that goes, but at the time of writing this trade is currently up about 60 handles.

If you are enjoying my analysis and would like to see it every day at theartofchart.net, which I co-founded in 2015, you can register for a 30 day free trial here. It is included in the Daily Video Service, which in turn is included in the Triple Play Service.

Thursday 11 May 2023

Indecision

A lot of indecision on the markets this week but on the bigger picture SPX remains under major resistance at the monthly middle band and the main support/resistance trendline. There is no obvious reason I can see to think that may break up now, but if bears fail to hold the short term resistance here we might well see a retest of the May high next.

SPX monthly chart:

So how is that short term resistance holding up? The main two levels I'm watching here are the monthly pivot at 4130, with yesterday's close at 4137. Not holding as resistance currently, but not converted to support yet either.

SPX daily chart:

The daily middle band, closing last night at 4127 is also in the balance here, with a break back above on Friday that was confirmed on Monday, with a modest break down again on Tuesday that failed yesterday. On balance the bulls are holding it as support so far, but still need to convert it convincingly to support.

SPX daily BBs chart:

On the SPX chart the double top is still intact, though the rally definitely went further than expected.

SPX 15min chart:

On the NDX chart the setup looks just as good, with a high quality nested double top setup formed if NDX should fail here.

NDX 15min chart:

If equities are going to break back down then the obvious day to do that would be today, which historically leans 67% bearish, and on SPX a sustained break back below yesterday's low at 4098.92 would look for a retest of last week's lows at 4048/9. I'm a bit doubtful about seeing that tomorrow if we don't see it today.

On the bigger picture I still think that the odds are 75%+ that SPX has topped out or is topping out short term for at least a decent retracement, and we still have topping patterns breaking down. Is there a chance that SPX will break up over resistance here instead of failing? Always, every good setup can always fail and go the other way, and I have assigned a probability of 25% to that, though in practical terms I think the odds of that would be more like 15% to 20%, rising back to 25% if we see a retest of the May high.

I set up a modestly sized model trade for the next few months and am following it here. I entered that with 9x MES (micro-ES) just before the close on Friday 28th April at 4190. 10x MES is equivalent to 1x ES, so this isn't a large trade, but I'm planning to trade around it on the way down.

The entry was at 4190, the target is at 3430, 760 handles below. The stop for the trade was 70 handles above at 4260 (at which point SPX would likely be breaking up), so the risk/reward ratio is slightly over 1:10, though if the trade needs to be rolled that will likely reduce a bit below that. As the initial double top has now broken down I have moved the stop to even at 4190. If that is stopped out I would likely re-enter at a retest of the May high. Max risk on the trade was $3,150, and if taken off at target without the need to roll the trade will yield $34,200. I will consider taking a third off near the 3940 and 3690 areas if seen, and perhaps adding them back on after any subsequent rallies. We'll see how that goes, but at the time of writing this trade is currently up about 60 handles.

At 5pm EST after the close today we are doing our monthly free public Big Five and Key Sectors webinar at theartofchart.net looking at big tech and the key sector ETFs. If you'd like to see that you can register for that here, or on our May Free Webinars page.

If you are enjoying my analysis and would like to see it every day at theartofchart.net, which I co-founded in 2015, you can register for a 30 day free trial here. It is included in the Daily Video Service, which in turn is included in the Triple Play Service.

Friday 5 May 2023

Rolling Over

So far, the reversal at strong resistance at the monthly middle band and the main support/resistance trendline from the 2009 low is proceeding as expected. The next three weeks lean bearish, with strongly bearish leaning days Thursday 11th May, Wednesday & Thursday 17th & 18th May before we see the next strongly bullish leaning day on Thursday 25th May. This is a good time for SPX to turn down and do some significant damage to the downside.

In the short term the downtrend has started well, the daily middle band, and weekly and monthly pivots at 4130 have been converted to resistance and SPX tested the daily lower band yesterday.

Generally speaking there is a bullish lean on Fridays and the low on SPX yesterday was only 25 handles above the 3sd lower band. The 3sd lower band is a big resistance level, and there hasn't been a break below it for over a year, so I'm not seeing any obvious reason to see that tested now. The daily middle band is still turning down and the bands are only starting to expand so short term downside looks limited and today looks like a good day for a modest rally.

The first obvious strong resistance is at the daily middle band, currently at 4121.

SPX daily BBs chart:

On the hourly chart the 50 hour MA tends to be good, albeit rough, support in an uptrend and resistance in a downtrend. That is now in the 4116 area and is reinforcing the daily middle band as resistance here so the obvious closing resistance today is in the 4120 SPX and 4140 ES areas.

If we should see a closing break over the daily middle band today that could be a break up, unless that is negated by a rejection candle back down on Monday.

SPX 60min chart:

The double top on SPX has broken down slightly with alternate targets in the 3930 and 3905 areas. Larger double top support is at 3808.86.

SPX 15min chart:

NDX has been making good progress towards the double top support in the 12724 area. NDX has been outperforming SPX and Dow over the last few weeks and, so far at least, that is still the case.

NDX 15min chart:

Dow has broken below double top support at 33.2k with alternate double top targets in the 32.4k or 32.2k areas. That would put INDU within striking distance of the larger double top support at 31.4k.

INDU 15min chart:

In the short term I think the odds are 75%+ that SPX has topped out short term for at least a decent retracement, and we now have topping patterns breaking down. Is there a chance that SPX will break up over resistance here instead of failing? Always, every good setup can always fail and go the other way, and I have assigned a probability of 25% to that, though in practical terms I think the odds of that would be more like 15% to 20%.

I set up a modestly sized model trade for the next few months and am following it here. I entered that with 9x MES (micro-ES) just before the close on Friday 28th April at 4190. 10x MES is equivalent to 1x ES, so this isn't a large trade, but I'm planning to trade around it on the way down.

The entry was at 4190, the target is at 3430, 760 handles below. The stop for the trade was 70 handles above at 4260 (at which point SPX would likely be breaking up), so the risk/reward ratio is slightly over 1:10, though if the trade needs to be rolled that will likely reduce a bit below that. As the initial double top has now broken down I have moved the stop to even at 4190. If that is stopped out I would likely re-enter at a retest of the May high. Max risk on the trade was $3,150, and if taken off at target without the need to roll the trade will yield $34,200. I will consider taking a third off near the 3940 and 3690 areas if seen, and perhaps adding them back on after any subsequent rallies. We'll see how that goes, but at the time of writing this trade is currently up about 80 handles.

At 4pm EST on Sunday 7th May we are doing our monthly free public Chart Chat at theartofchart.net looking at many aspects of the equity, bond, crypto and commodities markets. If you'd like to see that you can register for that here, or on our May Free Webinars page.

If you are enjoying my analysis and would like to see it every day at theartofchart.net, which I co-founded in 2015, you can register for a 30 day free trial here. It is included in the Daily Video Service, which in turn is included in the Triple Play Service.

Wednesday 3 May 2023

A Decent Start

So far, the reversal at strong resistance at the monthly middle band and the main support/resistance trendline from the 2009 low is proceeding as expected. Monday was bullish as expected, there are high quality double tops formed on SPX/ES, NDX/NQ and INDU/YM. Yesterday there was a decent rejection from Monday's highs and today, leaning 61.9% bearish, would be a good opportunity to confirm yesterday's slight closing break below the SPX daily middle band.

The next two weeks lean bearish, with strongly bearish leaning days today, Thursday 11th May, Wednesday & Thursday 17th & 18th May before we see the next strongly bullish leaning day on Thursday 25th May. This is a good time for SPX to turn down and do some significant damage to the downside. The key to the day in my view is whether the weekly and monthly pivots, both currently at 4130 can be converted to resistance today. If we see that and the daily middle band breaks with any confidence, then the path to the downside will be open.

SPX monthly chart:

SPX closed slightly below the daily middle band yesterday, though the 4 handle close under the middle band at 4123.54 was not a clear break. We'll see if that follows through to the downside today. .

SPX daily BBs chart:

If we see a sustained break below last week's low at 4049.35, then the alternate double top targets on SPX would be 3930 or 3910. That would put SPX within striking distance of the larger double top support at 3808.86.

SPX 15min chart:

If we see a sustained break below last week's low at 12724.20, then the alternate double top targets on NDX would be 12250 or 12150. That would put NDX within striking distance of the larger double top support at 11695.40.

NDX 15min chart:

If we see a sustained break below last week's low at 33.2k then the alternate double top targets on INDU would be 32.4k or 32.2k. That would put INDU within striking distance of the larger double top support at 31.4k.

INDU 15min chart:

In the short term I think the odds are 75%+ that SPX is topping out short term for at least a decent retracement, and we now have topping patterns and negative divergence. The stats for today are 61.9% bearish, which is the most bearish leaning day this week, subject of course to the wild card of the Fed meeting today. Is there a chance that SPX will break up over resistance here instead of failing? Always, every good setup can always fail and go the other way, and I have assigned a probability of 25% to that, though in practical terms I think the odds of that would be more like 15% to 20%.

I set up a modestly sized model trade for the next few months and am following it here. I entered that with 9x MES (micro-ES) just before the close on Friday at 4190. 10x MES is equivalent to 1x ES, so this isn't a large trade, but I'm planning to trade around it on the way down.

The entry was at 4190, the target is at 3430, 760 handles below. The stop for the trade is 70 handles above at 4260 (at which point SPX would likely be breaking up), so the risk/reward ratio is slightly over 1:10, though if the trade needs to be rolled that will likely reduce a bit below that. Max risk on the trade is $3,150, and if taken off at target without the need to roll the trade will yield $34,200. I will consider taking a third off near the 3940 and 3690 areas if seen, and perhaps adding them back on after any subsequent rallies. We'll see how that goes, but at the time of writing this trade is currently up about 45 handles.

At 4pm EST on Sunday 7th May we are doing our monthly free public Chart Chat at theartofchart.net looking at many aspects of the equity, bond, crypto and commodities markets. If you'd like to see that you can register for that here, or on our May Free Webinars page.

If you are enjoying my analysis and would like to see it every day at theartofchart.net, which I co-founded in 2015, you can register for a 30 day free trial here. It is included in the Daily Video Service, which in turn is included in the Triple Play Service.

Monday 1 May 2023

Mayday

SPX broke up through the possible H&S setup on Friday and delivered a full retest of the April high, closing the month six handles under key resistance at the monthly middle band and testing the main support/resistance trendline from the 2009 low. So what now?

Well, this is the main resistance that SPX has been failing at, and we now have the high quality topping pattern that I've been looking for, on decent quality hourly negative divergence, with matching topping patterns and divergence on other indices. This is the inflection point, right here, and the odds strongly favor SPX failing here into at least a strong retracement, and very possibly a leg down into a new bear market low.

SPX monthly chart:

On the bigger picture there are two patterns here. The first is a decent quality double top that on a sustained break below 3808.86 would look for a retest of the 2023 low at 3491.58, and beyond that there is still an open H&S target in the 3400 area, at the retest of the 2020 high before the COVID crash. That is a very attractive target and a possible level to see a bear market low.

SPX daily chart:

In the shorter term there is now a more modestly sized high quality double top on SPX that on a sustained break below 4049.35 would look for the 3925-30 area. There are possible RSI sell signals now brewing on the hourly charts on both SPX and ES.

SPX 15min chart:

There is a matching small high quality double top on NDX that on a sustained break below 12724.20 would look for a target in the 12250 area. There are possible RSI sell signals now brewing on the hourly charts on both NDX and NQ.

NDX 15min chart:

There is a further matching small high quality double top on Dow that on a sustained break below 33.2k would look for a target in the 31.3k area. There are possible RSI sell signals now brewing on the hourly charts on both INDU and YM.

INDU 15min chart:

In the short term I think the odds are 75%+ that SPX is topping out short term for at least a decent retracement, and we now have topping patterns and negative divergence. The stats for today are 67% bullish, which is the last strongly bullish leaning day until late May. That's just a guide of course, Friday leant strongly bearish which didn't deliver and this may not either. Is there a chance that SPX will break up over resistance here instead of failing? Always, every good setup can always fail and go the other way, and I have assigned a probability of 25% to that, though in practical terms I think the odds of that would be more like 15% to 20%.

As this is such a nice setup, and I haven't done one for a while, I am going to set up a modestly sized model trade for the next few months and follow it here. I entered that with 9x MES (micro-ES) just before the close on Friday at 4190. 10x MES is equivalent to 1x ES, so this isn't a large trade, but I'm planning to trade around it on the way down.

The entry is at 4190, the target is at 3430, 760 handles below. The stop for the trade is 70 handles above at 4260 (at which point SPX would likely be breaking up), so the risk/reward ratio is slightly over 1:10, though if the trade needs to be rolled that will likely reduce a bit below that. Max risk on the trade is $3,150, and if taken off at target without the need to roll the trade will yield $34,200. We'll see how that goes.

At 4pm EST on Sunday 7th May we are doing our monthly free public Chart Chat at theartofchart.net looking at many aspects of the equity, bond, crypto and commodities markets. If you'd like to see that you can register for that here, or on our May Free Webinars page.

If you are enjoying my analysis and would like to see it every day at theartofchart.net, which I co-founded in 2015, you can register for a 30 day free trial here. It is included in the Daily Video Service, which in turn is included in the Triple Play Service.