- WE'RE JUST RANDOM SPECKS OF DUST IN A TORNADO TO THE MARKETS .......
- CHARTISTS MUST PUT ALL BIAS ASIDE AND LET THE CHARTS DO THE TALKING OR WE'LL SEE ONLY WHAT WE WANT TO SEE
- This blog has a copy of all header posts that I publish anywhere, so that those interested in seeing what my thoughts are on the markets can find them easily.
- I will be answering questions and responding to comments, so feel free to respond to any posts and I will see your comment even if it is not on the most recent post.
- If you're interested in seeing any intraday charts I post, I do that on twitter, and my twitter handle is @shjackcharts.
- The charts in the posts are as large as I can practically make them. if you would like to look at one more closely, click on it, and the link will take you to a larger version at screencast. If you click on that again, you will get a full page version, and can use the resizing function on your browser to enlarge parts of interest further.

Friday 28 April 2023

Possible High Being Made

SPX went down a little further than was ideal, and then rallied very hard yesterday, so the topping pattern scenario is still on track.

The break below the daily middle band confirmed on Wednesday and SPX broke back hard over the middle band again yesterday. A close over 4115 again today will confirm the break back above. There is the option of a hard rejection back below that today, which would be unusual on a Friday, but definitely possible as today is the last day of April, and the stats for that lean 67% bearish.

SPX daily BBs chart:

An hourly RSI 14 buy signal fixed at the low and made the possible near miss target at the high yesterday. Ideally SPX would go a little higher today and that signal would make the full target while negative divergence forms on the 15min RSI 14.

SPX 60min chart:

Is the H&S option still on the table? Yes, though the neckline isn't ideal and SPX has gone a little high on the right shoulder, but the option of heading 30 handles higher into the retest of the April high at 4169.48 looks more likely than it would have done if SPX had turned directly up from Tuesday's low.

SPX 15min chart:

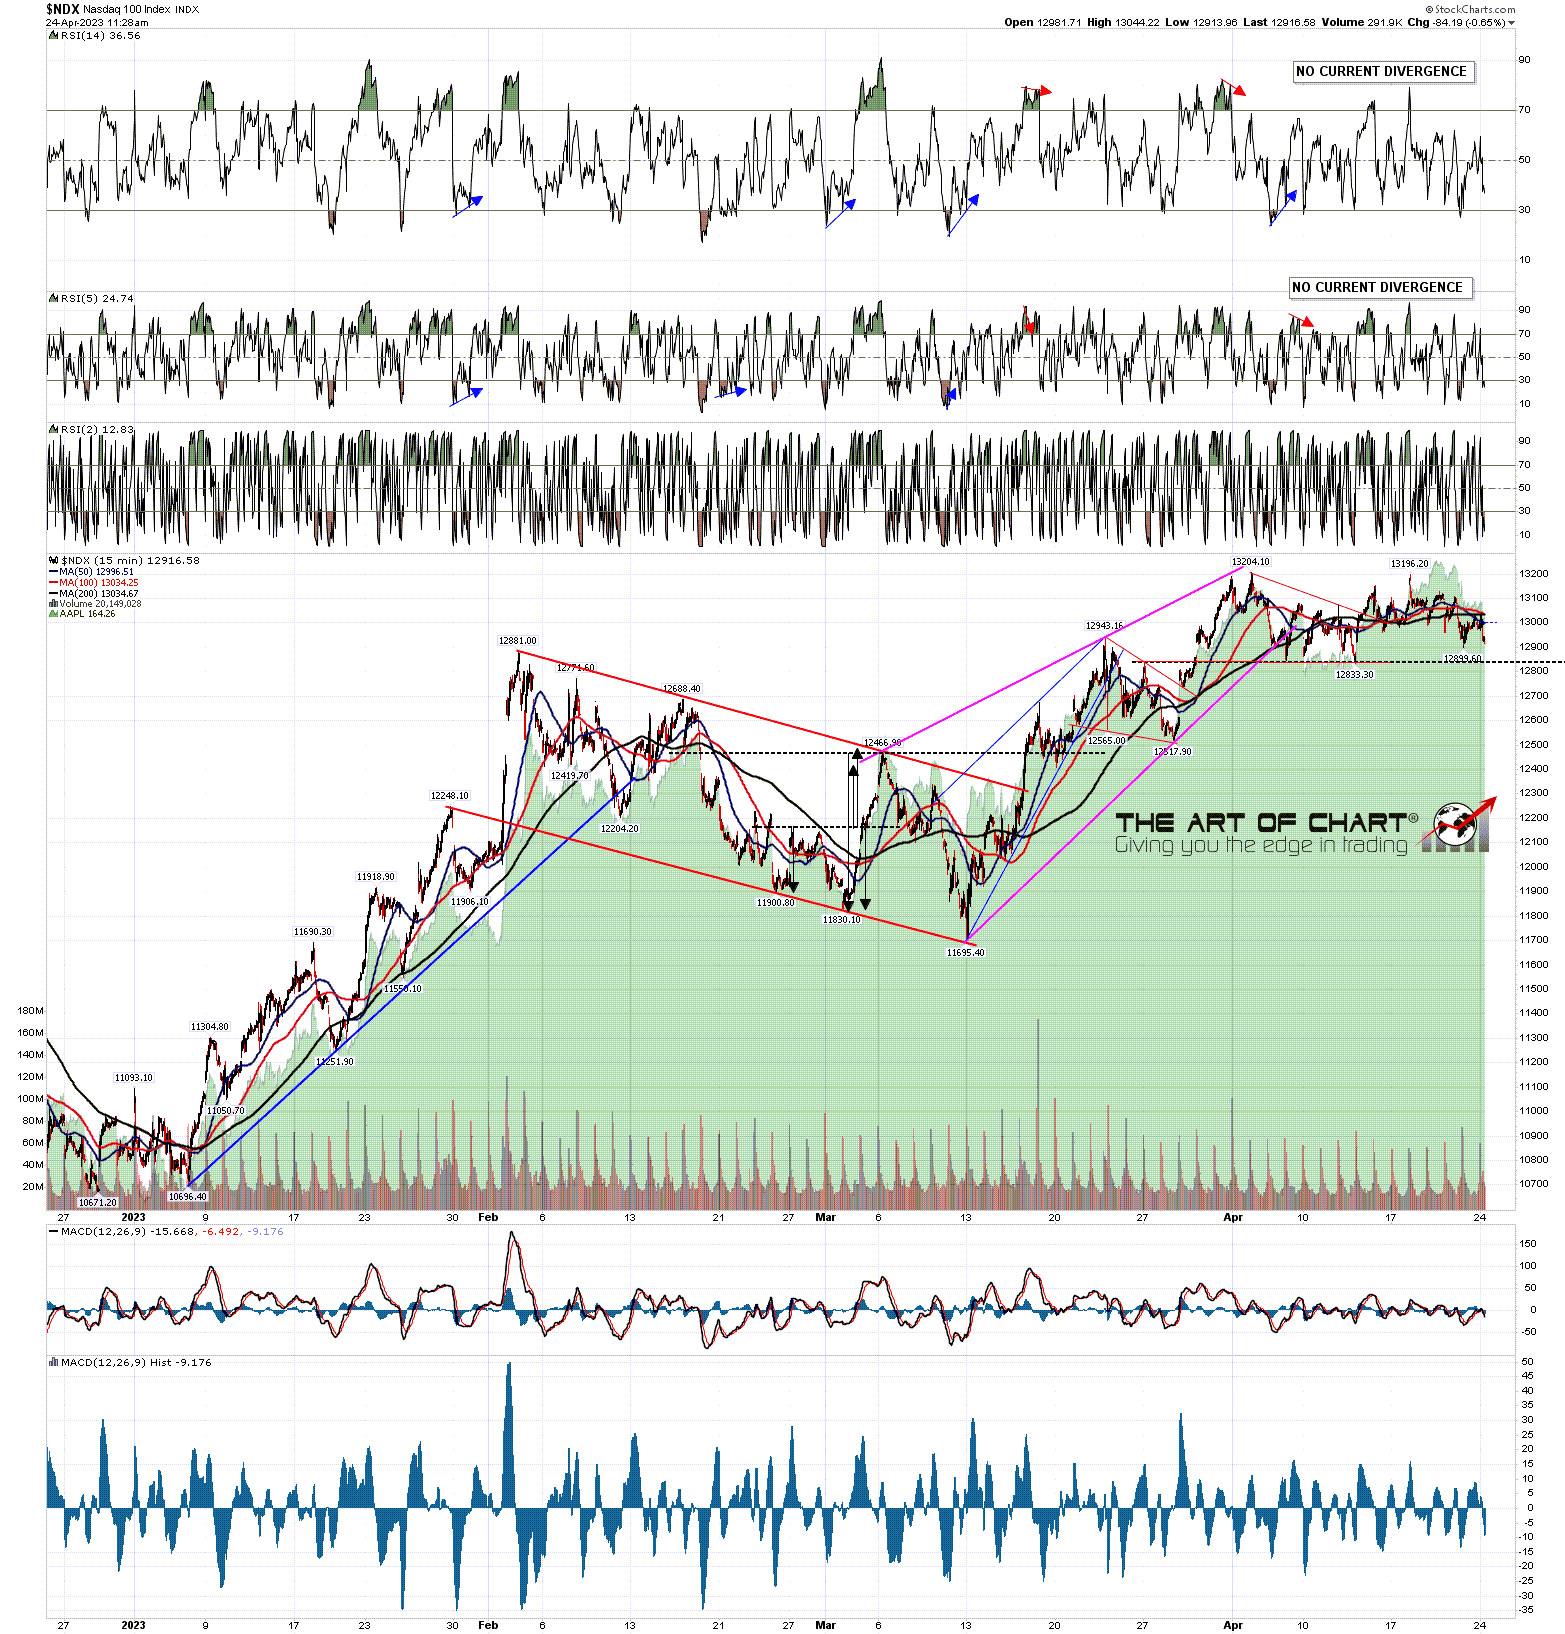
On Wednesday I was looking at the high quality bull flag megaphone forming on NDX and that is still looking good. We may well see NDX go on to retest the high at 13204.10.

NDX 15min chart:

On the NQ Jun chart that same bull flag has already broken up with a target at that high retest, and in the normal course of events I'd expect to see that retested today or Monday.

NQ Jun 60min chart:

In the short term I think the odds are 75%+ that SPX is topping out short term for at least a decent retracement, and I am looking for a topping pattern. That pattern may still be an H&S forming, and the next move would ideally be to rally a little higher, and then fail hard into the H&S target in the 3910 area. We'll see if this plays out that way. There is an increased chance that we see a full retest of the 4169.48 high and, if seen, that would be an easier short as SPX could set up better negative divergence on the way there. Everyone have a great weekend. :-)

If you are enjoying my analysis and would like to see it every day at theartofchart.net, which I co-founded in 2015, you can register for a 30 day free trial here. It is included in the Daily Video Service, which in turn is included in the Triple Play Service.

Wednesday 26 April 2023

Topping Step One Completed

I was talking on Friday and Monday about the likely topping process now in progress on SPX here, and the possibility that SPX would head down into the possible H&S neckline in the 4070 area, supported by the daily RSI 5 sell signal that had fixed. That target was reached yesterday, and the daily RSI 5 sell signal made and exceeded the target at the 30 level on the daily RSI 5.

SPX daily chart:

The daily middle band, now at 4105, was broken hard on that move and I'll be watching that carefully today, as a rejection back above it today might open a retest of the current high at 4169.48. Until that happens that is closing resistance at 4105, and that may well be backtested today.

SPX daily BBs chart:

On the hourly chart the RSI 14 sell signal also reached target, and there is no hourly positive divergence, though there is on ES where yesterday's low was retested overnight.

SPX 60min chart:

On the 15min chart you can see that the possible H&S neckline was retested perfectly at the low yesterday. If a right shoulder forms the ideal right shoulder high would be in the 4135 area.

SPX 15min chart:

I'm watching NDX with interest here. On Friday I mentioned that there was no clear bull flag setup on NDX, but that is no longer the case, as the low yesterday established a trendline on both NQ and NDX that may well be support on a bull flag megaphone. This may mean that the 13204.10 high still needs a retest.

Something I do also see happen regularly though is where a bull flag forms and breaks down rather than up, in which case that becomes in effect a topping pattern, and that might be the case here of course.

NDX 15min chart:

In the short term I think the odds are 75%+ that SPX is topping out short term for at least a decent retracement, and I am looking for a topping pattern. Ideally here that pattern would be an H&S forming, and the next move would ideally be to rally into the 4135 area, and then fail hard into the H&S target in the 3970 area. We'll see if this plays out that way. There are now three fixed and one brewing brewing buy signal on four of the six index futures I follow, so I'm leaning strongly towards a decent attempt at a rally today.

If you are enjoying my analysis and would like to see it every day at theartofchart.net, which I co-founded in 2015, you can register for a 30 day free trial here. It is included in the Daily Video Service, which in turn is included in the Triple Play Service.

Monday 24 April 2023

Broken Wedges

As I was writing on Friday, SPX is testing major double resistance at the month middle band and a key trendline from the 2009 low. With  a daily RSI 5 sell signal fixed on SPX, at least a decent retracement here looks likely, and that may develop into a decline into a new bear market low under 3491.58.

SPX monthly chart:

NDX is also now testing the monthly middle band as resistance. This hasn't been as good support and resistance in the past as it has been on SPX, but is nonetheless an important level.

NDX monthly chart:

On the SPX chart the rising wedge from the March low at 3808.86 is breaking down and SPX is likely topping out. That may require a retest of the April high at 4169.48 to set up a small double top that on a break below 4113 would look for the 4060 area, with a possible H&S neckline in the 4070 area.

SPX 15min chart:

NDX and NQ are looking interesting here. On NQ there is a perfect shallow falling channel which is a clear bull flag channel suggesting strongly that a retest of the April high should be seen before this high is made. That is less clear on NDX though, with that high almost retested already and a possible small double top already in place that on a sustained break below 12833.30 would look for a target in the 12480 area.

NDX 15min chart:

I'm going to start adding an interesting chart of the day as the last chart on these posts and today's is the AAPL daily chart.

This chart is interesting because a strong bull flag setup with a three touch support trendline was established at the start of 2023. I've been looking since then for a move from there into a test of the flag resistance trendline and that was tested perfectly at the high last week. This is now a very strong bull flag setup that on a break over flag resistance would look for a retest of the all time high at 181.38.

Now bull flags don't always break up, but I was talking on Friday about a possible scenario here where SPX might now head down to the H&S target and backtest of the early 2020 all time high in the 3400 area, to make the second low of a double bottom there, to set up a subsequent move to retest the all time high at 4818.62. This setup on AAPL is one of the charts supporting that longer term scenario.

Interesting Chart Of The Day - AAPL daily chart:

In the short term I think the odds are 75%+ that SPX is topping out short term for at least a decent retracement, and could be starting another leg down from here. The short term high may already be made and if SPX moves back below 4100 from here, most likely has already been made. The obvious next target in that case would be the possible H&S neckline in the 4070 area.

If you are enjoying my analysis and would like to see it every day at theartofchart.net, which I co-founded in 2015, you can register for a 30 day free trial here. It is included in the Daily Video Service, which in turn is included in the Triple Play Service.

Friday 21 April 2023

Failing At Strong Resistance

The main resistance for the downtrend on SPX since the all time high is twofold, and those two resistance levels are currently crossing.

The first level is the monthly middle band, which has a long track record of acting as main support in an uptrend, and main resistance in a downtrend. That is currently at 4173 and the high this week was at 4169, so that was an almost perfect test.

The second level is the trendline from the 2009 low that was resistance in 2010, then resistance for multiple tests in 2012-14, 2018 & 2020 until it was broken hard in the collapse upwards after the 2020 low. After that was broken as support last year it has held as resistance twice, and has seen a third test this week that has held perfectly so far.

Both of these resistance levels are very strong, and in combination even more so. A break and conversion of these levels would open a possible retest of the all time high, but there's no obvious reason to look for that here yet, so the obvious lean here is to expect a fail and the possible start of a new leg down into a new bear market low.

SPX monthly chart:

On the daily chart an RSI 5 sell signal has fixed, and these are good indicators that SPX is in a topping process. On the chart below there have been 13 of these, and nine of them made target. Since the all time high, three out of four have made target.

I would note that there is still an open H&S target on this chart in the 3400 area. As that would be a backtest of broken resistance at the early 2020 all time high, that is a very attractive target. This turn could be the start of a move to reach that target, potentially making the second low of a high quality double bottom there.

SPX daily chart:

On the ES and SPX charts high quality rising wedges have formed from the early March low. These are the kind of patterns seen before a significant retracement and often a significant high or low. Rising wedge support on ES held yesterday and then broke shortly after the open this morning, and that has since been confirmed with a break below the SPX rising wedge support trendline which also held at the low yesterday and broke this morning shortly after the support break on ES.

ES/SPX have likely either topped short term or are in a topping process. That may need a retest of the high this week to make the second high of a small double top, but if not, I'll be watching the possible H&S neckline in the 4095-4100 as the obvious next support.

ES Jun 60min chart:

The trendlines on SPX aren't quite the same, but the overall setup is essentially identical. The possible H&S necklines on SPX are in the 4088 or (better) 4070 areas.

SPX 15min chart:

The obvious first decent short term support is at the daily middle band, currently at 4083, that's a decent match with both possible H&S necklines of course.

SPX daily BBs chart:

Overall I am expecting to see at least a decent retracement here in the near future, and this may be the start of a move down into a new bear market low. If seen, that could set up a double bottom on SPX that could end this bear market and light the path to a retest of the all time high.

We did our monthly free public big five and key sectors webinar at theartofchart.net yesterday, and if you'd like to see that you can see it here, or on our April Free Webinars page. Everyone have a great weekend :-)

If you are enjoying my analysis and would like to see it every day at theartofchart.net, which I co-founded in 2015, you can register for a 30 day free trial here. It is included in the Daily Video Service, which in turn is included in the Triple Play Service.