- WE'RE JUST RANDOM SPECKS OF DUST IN A TORNADO TO THE MARKETS .......
- CHARTISTS MUST PUT ALL BIAS ASIDE AND LET THE CHARTS DO THE TALKING OR WE'LL SEE ONLY WHAT WE WANT TO SEE
- This blog has a copy of all header posts that I publish anywhere, so that those interested in seeing what my thoughts are on the markets can find them easily.
- I will be answering questions and responding to comments, so feel free to respond to any posts and I will see your comment even if it is not on the most recent post.
- If you're interested in seeing any intraday charts I post, I do that on twitter, and my twitter handle is @shjackcharts.
- The charts in the posts are as large as I can practically make them. if you would like to look at one more closely, click on it, and the link will take you to a larger version at screencast. If you click on that again, you will get a full page version, and can use the resizing function on your browser to enlarge parts of interest further.

Thursday 31 March 2022

Looking For A Backtest

I was looking at resistance at the weekly middle band in my post on Tuesday, and SPX has broken up through that convincingly, though SPX still needs to close the week significantly above the weekly middle band, currently at 4531 to fix that resistance break. If seen SPX will then need to close next week above the break to confirm it.

I was also saying that a break on SPX over the H&S right shoulder high at 4595.31 would fail the H&S and fix a target at a retest of the all time high at 4818.62, and that has now definitely broken, so that is a very significant bullish break.

SPX weekly chart:

On the daily chart SPX returned to just under the daily upper band on Tuesday, but is not obviously resuming the upper band ride, which is as it should be, as SPX is looking very overbought short term and likely needs a retracement here.

SPX daily BBs chart:

The negative divergence on the daily RSI 5 was lost on this latest move up, but what really draws my eye is the 5.2% above the 45dma that SPX reached at the high on Tuesday. Apart from the recovery from the 2020 crash low this is the third highest reading against the 45dma achieved since the start of 2018, with the two higher readings at 5.4% in January 2018 and 5.54% in November 2021. SPX is overdue for a backtest of the 45dma, currently at 4408. The other key target would be the SPX daily middle band, currently at 4388 and rising faster than the 45dma, so they are becoming in effect a single backtest target over the next three or four trading days.

I'm expecting to see this backtest next, and what happens at the backtest is likely very important for direction. On a break and conversion of those levels, in effect likely to be in the 4400-20 range, then SPX can still retest the lows before retesting the all time high. If that support holds and SPX returns to the current level and higher, then there are decent odds that the next target will be the retest of the all time high on SPX.

SPX daily vs 45dma chart:

On the SPX hourly chart the RSI 14 sell signal survived this latest move up, and I'm expecting that to deliver over the next few days.

I would note that the retracement this year formed a falling wedge that is an obvious bull flag pattern, and that has also broken up with a target at the retest of the all time high, so we now have two setups targeting that retest, though we still have the Three Day Rule looking for a low retest first. It is still possible that SPX could do both while forming a larger bull flag, though if that is the case then the trendlines for that larger flag are not yet obvious.

SPX 60min chart:

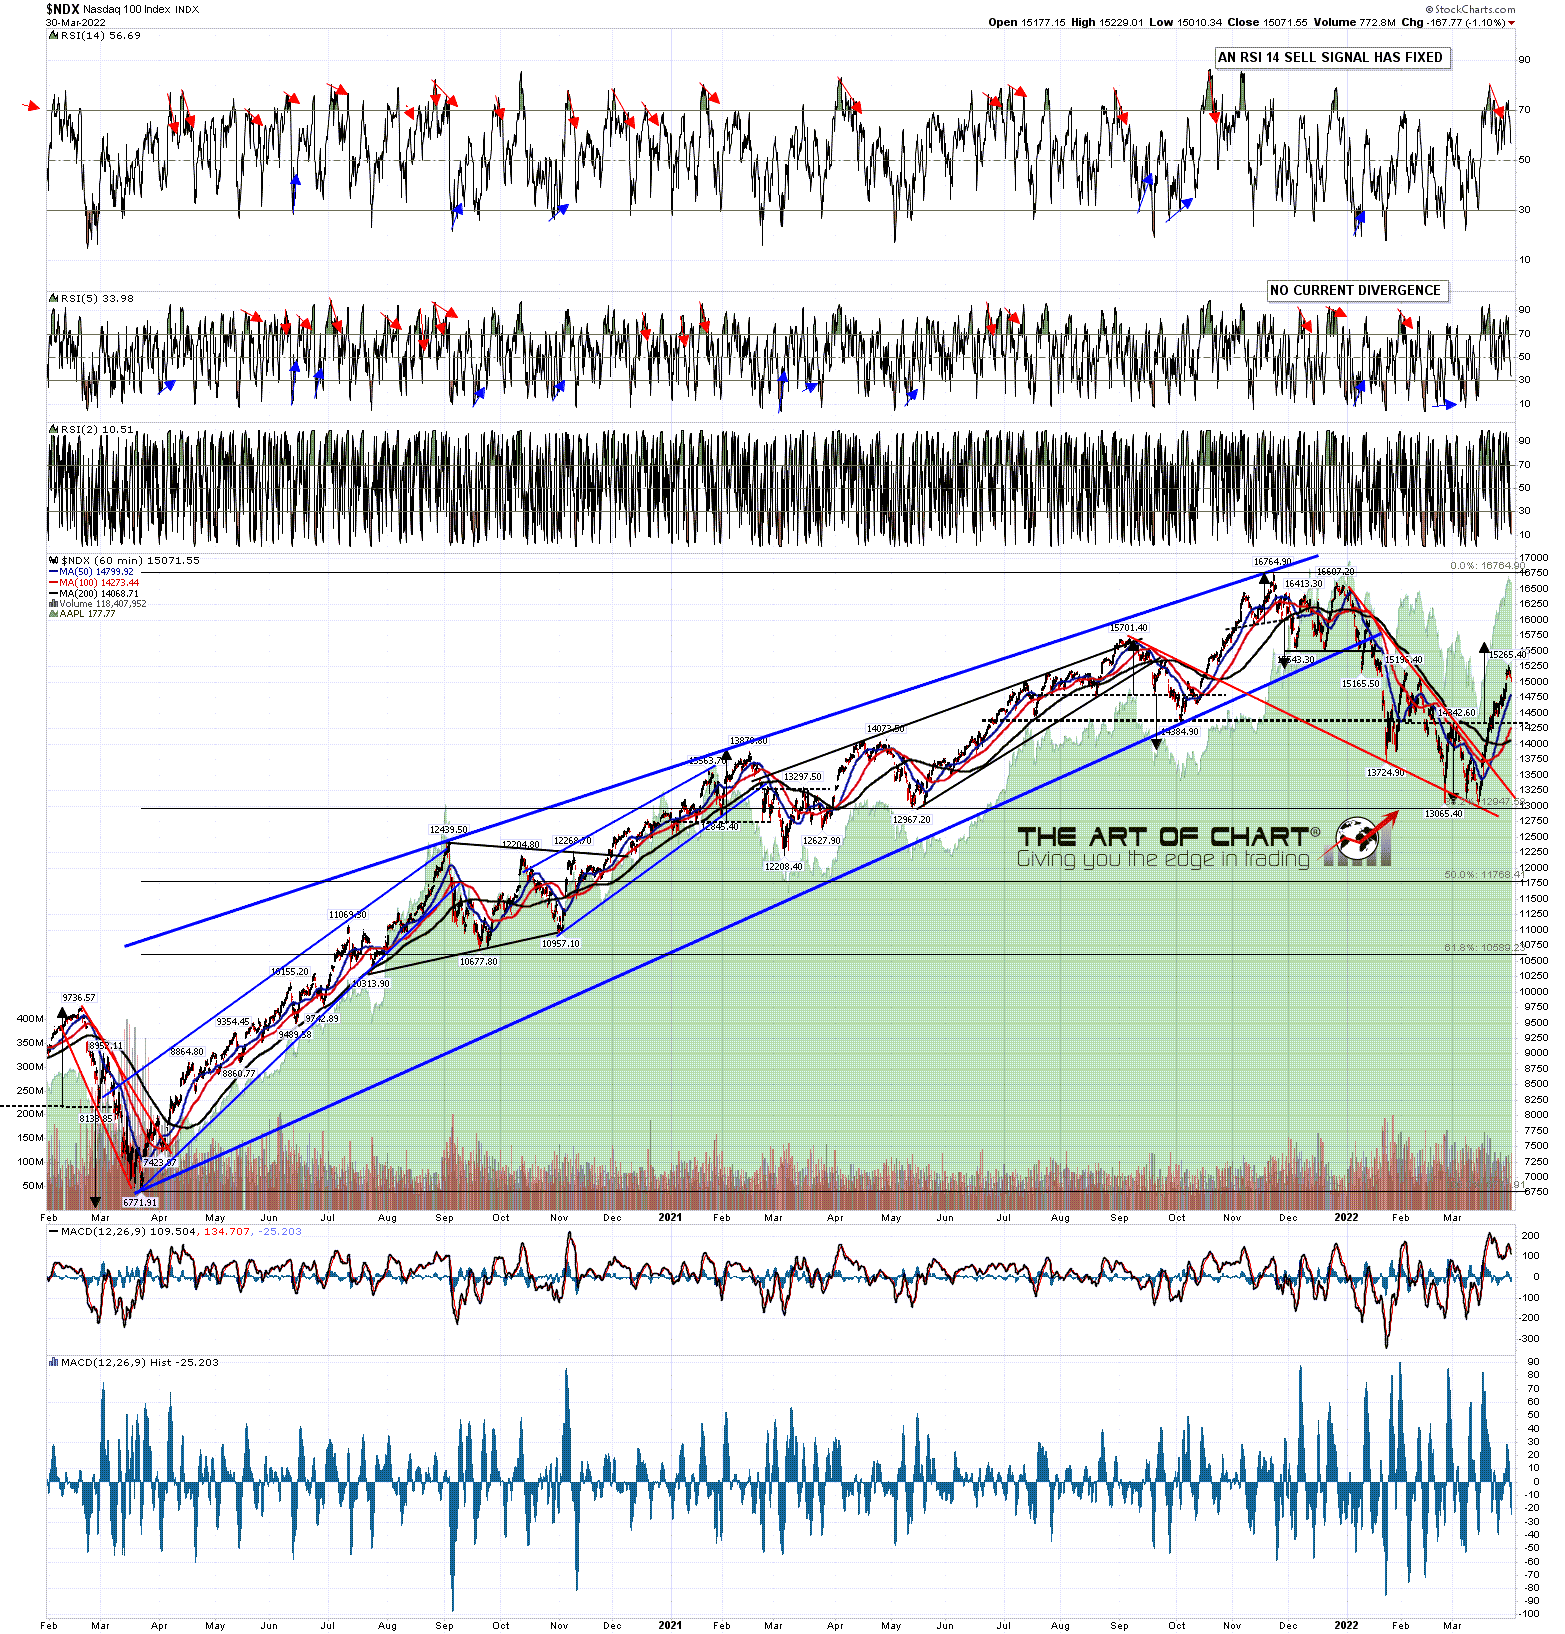
On NDX the hourly RSI 14 sell signal also survived and I'd add that NDX is close enough to a possible IHS neckline that a pullback here may for the right shoulder on an IHS that on a subsequent break up would look for a retest of the all time high on NDX.

We'll see how this develops over the next few days, but without doubt the overall setup now looks a lot more bullish than it did on Tuesday morning. What happens next will be key.

NDX 60min chart:

Unusually we are doing two free webinars at theartofchart.net tonight, as they were delayed by my COVID this month. They are starting an hour after the close today. The first is starting an hour after the RTH close at 5.00pm EDT and is on the 'FAANG Stocks & Key Sectors'. If you'd like to attend you can register for that here. The second is starting half an hour later at 5.30pm EDT and is looking at 'Trading Commodities - Setups and Approaches', where we'll be looking at opportunities in commodities and designing three options trades to trade them. If you'd like to attend you can register for that here. As always you can alternatively register for those on our monthly free webinars page.

Monday 28 March 2022

S&P Retesting Main Resistance

My apologies for the long wait between posts. I went out with some friends for the first time in two years on the first weekend in March and caught COVID, which has taken a while to clear. That wasn't too bad and I'm clear now though I'm still feeling low on energy. Hopefully that will pass soon too.

I did post one of my premarket videos at theartofchart.net on my personal twitter on 16th March looking at the very large amount of bullish pressure underneath the market and wondering whether we would see a strong rally and we have since seen that strong rally, which has taken SPX back to main resistance at the weekly middle band. So what now?

Well the first thing to mention again is that SPX is still on a 5dma Three Day Rule Signal, which is looking for a retest of the 2022 low at 4114.65 before a retest of the all time high at 4818.62. This is my strongest historical statistic that has delivered well over fifty times back to the start of 2007, so I am leaning strongly towards seeing that low retest. Is that a sure thing? No, every stat will fail sometime, and this could be that time, but the odds favor it delivering again.

SPX daily 5dma chart:

On the weekly chart the close last week was slightly above it but was in effect a close on resistance. A break and conversion of this level would open a possible all time high retest.

SPX weekly chart:

On the daily chart a possible RSI 5 sell signal is brewing, matching similar signals brewing on NDX and Dow, and with one already fixed on IWM. That is definitely what I would want to see here if we are to see a turn back down.

If SPX does turn down from this inflection point here I would note that the next inflection point would be at the SPX daily middle band, now at 3359. That would need to be re-broken and converted to open the low retest.

SPX daily chart:

On the SPX hourly chart I drew in an ideal falling channel resistance trendline a few days ago that might be a target if SPX should be forming a bull flag channel here. That may break later on today of course but the high so far today was a perfect touch of that channel resistance trendline, so a fail here would firmly establish that overall bull flag channel on SPX.

SPX 60min chart:

NDX is also showing a fixed hourly RSI 14 sell signal, as is Dow but not IWM. Again, there is significant pressure for a fail here on the hourly chart as well as the daily.

NDX 60min chart:

I'm leaning toward a rejection lower at this inflection point on indices, at least back into a daily middle band test. What is important if SPX breaks up instead?

You can see on my SPX daily and hourly charts that an H&S pattern formed and broken down on SPX with a target in the 3600 area. I was never expecting that to reach that target, but as and when that fails it would set a target back at the all time high retest. That fail would be on a break back over the right shoulder high at 4595.31, and if we see that directly from here, then that would be a significant bullish break suggesting that SPX may head to the all time high retest directly.

Now I am recovered from COVID, more or less, I'm planning to return to doing a couple of posts every week, so my next post should be on Wednesday or Thursday before the open.

Monday 7 March 2022

Awaiting SPX Low Retest

In my post a week ago I was saying that SPX was back on the Three Day Rule, and on the third day SPX closed clearly back below the 5dma, triggering the rule. That means there is a very high probability that the 4114.65 low will be retested in the near future.

SPX daily 5dma chart:

After that break SPX backtested the daily middle band and rejected from there. That makes a very decent looking candidate rally high.

SPX daily BBs chart:

On the SPX hourly chart a decent quality double top has formed that on a break and conversion of double top support at 4279 would take SPX back most of the way to the low.

SPX 60min chart:

On the NDX hourly chart a smaller double top has already broken down with a target in the 13500 area.

NDX 60min chart:

The matching double top on ES broke down overnight but has rallied back strongly so far. We'll see if that follows through to the downside today.

ES Mar 60min chart:

We did our monthly free public Chart Chat at theartofchart.net looking at equity indices and the usual wide range of other markets yesterday and if you missed that you can see the recording here or on our March Free Webinars page.